driving ccs deployment in industry
TRANSCRIPT
© OECD/IEA 2010 © OECD/IEA 2010
Driving CCS deployment in industry
Presentation to the 5th CCS Regulatory Network meeting
Paris, 18 June 2013
Simon Bennett
International Energy Agency

© OECD/IEA 2010
Outline
CCS in industrial applications A reminder of the importance
What is needed to drive deployment?
Technology and demonstration Where do we stand today?
Setting realistic goals
Policies for deployment Industry and power have different challenges
Trade exposure
Support mechanisms need to be tailored
Recommendations

© OECD/IEA 2010
Cement/steel/refining/chemicals: 20% of global CO2
CCS is the only known option to fully decarbonise many these sectors Sou
rce:
IEA
ETP
20
12
4D
S, in
corp
ora
tin
g re
cen
t p
olic
y p
led
ges

© OECD/IEA 2010
In the 2DS, 45% of stored CO2 is from industry
All existing major projects today are in industrial applications: gas processing, chemicals and refining. This shows where the low-cost opportunities are.

© OECD/IEA 2010
Different regions have different patterns in the 2DS
Sou
rce:
IEA
CC
S ro
adm
ap 2
01
3, f
ort
hco
min
g

© OECD/IEA 2010
What is needed to drive deployment?
Permitting framework
Technology RD&D framework
Incentive framework
Long-term vision for CCS deployment
Regulation for safe, effective storage
Efficient resource
management
Prices of limits on
emissions
Targeted deployment incentives
Demonstration funding
All parts of the policy puzzle must be in place if CCS is to excel, starting with a clear vision for the future for CCS

© OECD/IEA 2010 Sou
rce:
IEA
rep
ort
to
th
e C
lean
En
ergy
Min
iste
rial
20
13
Technology: where do we stand today?
There is a worrying lack of projects to advance technology for sectors such as steel and cement

© OECD/IEA 2010 Sou
rce:
IEA
rep
ort
to
th
e C
lean
En
ergy
Min
iste
rial
20
13
Technology: what do we know about costs?
Cost estimates vary widely between sites and within sites. Consensus is still evolving.

© OECD/IEA 2010
Technology: near-term needs
Gas processing; Hydrogen;
Ethanol
Opportunities to demonstrate CO2 transport and storage at
low-cost
Demonstrate integrated CCS
chain and regional co-operation
Blast furnace; Cement;
Crackers etc.
Range of pilot projects (testing
processes and products)
Development of cross-sectoral
competences and facilities
Advanced processes:
smelting etc.
Increased R&D; focus on reducing cost
impacts
Create expectations of
technology change and roadmaps

© OECD/IEA 2010
Why is progress challenging in these sectors?
Sou
rce:
IEA
rep
ort
to
th
e C
lean
En
ergy
Min
iste
rial
20
13
C
ost
ind
ex: i
mp
act
of
add
ing
CC
S to
th
e p
rod
uct
ion
co
st o
f a
un
it o
f o
utp
ut
No easy-wins. Industries with less exposure to trade are those with high additional costs of CCS
© OECD/IEA 2010
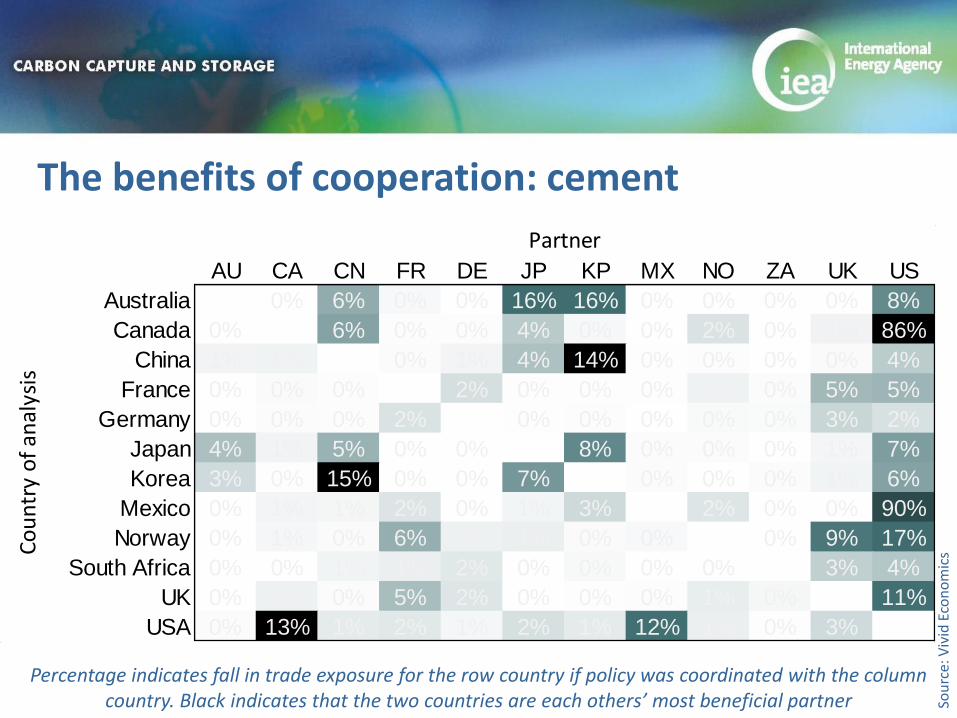
Percentage indicates fall in trade exposure for the row country if policy was coordinated with the column country. Black indicates that the two countries are each others’ most beneficial partner So
urc
e: V
ivid
Eco
no
mic
s
AU CA CN FR DE JP KP MX NO ZA UK US
Australia 0% 6% 0% 0% 16% 16% 0% 0% 0% 0% 8%
Canada 0% 6% 0% 0% 4% 0% 0% 2% 0% 1% 86%
China 1% 1% 0% 1% 4% 14% 0% 0% 0% 0% 4%
France 0% 0% 0% 2% 0% 0% 0% 1% 0% 5% 5%
Germany 0% 0% 0% 2% 0% 0% 0% 0% 0% 3% 2%
Japan 4% 1% 5% 0% 0% 8% 0% 0% 0% 1% 7%
Korea 3% 0% 15% 0% 0% 7% 0% 0% 0% 1% 6%
Mexico 0% 1% 1% 2% 0% 1% 3% 2% 0% 0% 90%
Norway 0% 1% 0% 6% 1% 1% 0% 0% 0% 9% 17%
South Africa 0% 0% 1% 1% 2% 0% 0% 0% 0% 3% 4%
UK 0% 1% 0% 5% 2% 0% 0% 0% 1% 0% 11%
USA 0% 13% 1% 2% 1% 2% 1% 12% 1% 0% 3%
Co
un
try
of
anal
ysis
Partner
The benefits of cooperation: cement

© OECD/IEA 2010
The benefits of cooperation: cement
Sou
rce:
Viv
id E
con
om
ics
AU CA CN FR DE JP KP MX NO ZA UK US
Australia 0% 24% 1% 0% 0% 0% 0% 0% 0% 0% 0%
Canada 0% 2% 0% 0% 0% 1% 0% 0% 0% 0% 92%
China 1% 0% 0% 0% 8% 1% 0% 0% 0% 0% 5%
France 0% 0% 0% 22% 0% 0% 0% 0% 0% 1% 0%
Germany 0% 0% 0% 12% 0% 0% 0% 3% 0% 6% 0%
Japan 0% 0% 15% 0% 0% 19% 0% 0% 0% 0% 0%
Korea 0% 1% 2% 0% 0% 30% 0% 0% 0% 0% 27%
Mexico 0% 0% 1% 0% 0% 0% 0% 0% 0% 0% 66%
Norway 0% 0% 0% 1% 40% 0% 0% 0% 0% 1% 0%
South Africa 0% 0% 1% 0% 0% 0% 0% 0% 0% 0% 0%
UK 0% 0% 2% 3% 5% 0% 0% 0% 1% 1% 0%
USA 0% 49% 8% 0% 0% 0% 13% 5% 0% 0% 0%
Partner
Co
un
try
of
anal
ysis
If countries work together on developing CCS policies for trade-exposed sectors, negative impacts and, potentially, subsidies, can be limited

© OECD/IEA 2010
An approach to policymaking
Objective: enable financing to flow to large-scale CCS projects with sufficient assurance of revenue such that carbon leakage and competitiveness concerns are mitigated.
Good policy options are likely to: 1. be cross-sectoral (reduce emissions at lowest cost)
2. place delivery risk on projects (place CCS into a competitive market context)
3. provide a continuous marginal incentive (potential to achieve beyond an EPS)
4. be quantity-based (preferable where costs are unknown)
5. share costs between public and private sector on the basis of trade exposure
Different options depending on level of trade-exposure Trade-exposed sectors/countries:
Government could hold reverse-auctions for fixed amounts of stored CO2, transferring cost to private sector over time
Less trade-exposed sectors:
Feebates, portfolio standards are options. Depends on uniformity of traded product.

© OECD/IEA 2010
1. Commit public funding to ~10 pilot and demo-scale projects in cement, steel etc.
2. Support projects according to their contribution to knowledge (not immediate CO2 emission reductions)
3. Incorporate CCS in forward-looking industrial strategies
4. Address competitiveness concerns of sectors in global competition
5. Better exploit synergies between sectors
6. Involve all industry sectors in actions to advance CCS
Recommendations to CEM governments

© OECD/IEA 2010 © OECD/IEA 2010
Thank you for your attention

© OECD/IEA 2010
Stepwise technology development is key to policy
Carbon price
CCS unit costs
Cost/ Revenues
Early stage Middle stage
Late stage
Time
Gateway Gateway
Sou
rce:
Viv
id E
con
om
ics
As in the power sector, CCS policy in each industrial sector will pass through several phases
Initially, costs of CCS will be far higher than any (implicit or explicit) carbon price. Different policies are required for each stage, and defined gateways will be necessary to transition between them