drive electric vermont case study - idaho national … · automaster mercedes spencer campbell...
TRANSCRIPT

The INL is a U.S. Department of Energy National Laboratory operated by Battelle Energy Alliance
INL/EXT-16-38077
Drive Electric Vermont Case Study
Fred Wagner Dave Roberts Jim Francfort Sera White
March 2016

DISCLAIMER
This information was prepared as an account of work sponsored by an agency of the U.S. Government. Neither the U.S. Government nor any agency thereof, nor any of their employees, makes any warranty, expressed or implied, or assumes any legal liability or responsibility for the accuracy, completeness, or usefulness, of any information, apparatus, product, or process disclosed, or represents that its use would not infringe privately owned rights. References herein to any specific commercial product, process, or service by trade name, trade mark, manufacturer, or otherwise, does not necessarily constitute or imply its endorsement, recommendation, or favoring by the U.S. Government or any agency thereof. The views and opinions of authors expressed herein do not necessarily state or reflect those of the U.S. Government or any agency thereof.

INL/EXT-16-38077
Drive Electric Vermont Case Study
Fred Wagner1 Dave Roberts2 Jim Francfort3
Sera White3
1Energetics Incorporated 2Vermont Energy Investment Corporation 3Idaho National Laboratory
March 2016
Idaho National Laboratory Idaho Falls, Idaho 83415
http://avt.inl.gov
Prepared for the U.S. Department of Energy Office of Nuclear Energy
Under DOE Idaho Operations Office Contract DE-AC07-05ID14517

ii
ACKNOWLEDGEMENTS
The following professionals are acknowledged for their contributions to this case study. This case study was developed based on the collective input, but does not necessarily reflect the views of the organizations listed.
Argonne National Laboratory Dan Santini, Yan Zhou
Automaster Mercedes Spencer Campbell
Burlington Electric Department Tom Lyle, Brian Reilly
ChargePoint John Gilbrook
Conservation Law Foundation Sandra Levine
Green Mountain Power/EVgo Jenn Cortez
Lamoille Valley Ford Tim Letourneau
NESCAUM Elaine O'Grady, Dick Valentinetti
Shearer Chevrolet David Bokan
Sierra Club Robb Kidd, Karl Kemnitzer
Stowe Electric Department Matt Rutherford
University of Vermont (UVM) Jim Barr
Vermont Agency of Natural Resources Tom Moye, Sarah McKearnan, Heidi Hales
Vermont Agency of Transportation Gina Campoli
Vermont Clean Cities Coalition Abby Mattera
Vermont Energy Investment Corporation Karen Glitman, Michelle McCutcheon-Schour
Vermont Public Service Department Asa Hopkins, Matthew Walker
Vermont Vehicle and Automotive Distributors Association
Marilynn Miller
Washington Electric Cooperative Bill Powell
World Learning John Benouski
Thanks and acknowledgement is given for the in-kind support and participation of the organizations that supplied experts for the case study. Without the contributions of these individuals and their collective expertise, this final case study would not have been possible.

iii
EXECUTIVE SUMMARY
Currently in the United States, the heavy majority of plug-in electric vehicle (PEV) sales have been in highly conducive, selected, metropolitan areas; opposed to more broad distribution across the country. The U.S. Department of Energy’s EV Everywhere Grand Challenge is looking carefully at the barriers and opportunities that exist to enable small and midsize communities to partake in the PEV market and benefit from the economic and environmental advantages of PEVs. In order to gain insight into these challenges and barriers, DOE selected a success story (i.e., Drive Electric Vermont) as the subject of this case study, as the state of Vermont is tied with Detroit, Michigan in having the highest percentage of 2014 (most recent complete data) PEV registrations for cold weather U.S. cities and has seen more than a six-fold increase in charging stations over the last three years.
The overall objective of this case study was to use the lessons learned from Drive Electric Vermont to determine what activities are most effective at encouraging acquisitions of PEVs and deployment of charging infrastructure in small to midsize communities, prioritizing and sequencing their implementation, identifying robust means for extrapolation, and applying this understanding to other small to midsize communities across the nation.
The Drive Electric Vermont Program was formed in 2012 with a goal of increasing the use of electrified transportation in Vermont through policy development, education and outreach, and infrastructure development. The Drive Electric Vermont Program can be broadly broken into four components: (1) strategic planning/leadership, (2) stakeholder/partnership development, (3) education and outreach, and (4) incentives. The early phases of the program focused heavily on strategic planning, and stakeholder and partnership development, followed by a transition to education and outreach activities, charging infrastructure development, and grant and incentive programs that support charging infrastructure deployment and PEV purchases. Future plans include an additional round of consumer/dealer PEV incentives, continuation of the marketing campaign, and utilization of consumer surveys to develop new campaign themes and to optimize information distribution channels.
In Vermont, the number of PEVs grew from 88 in July 2012 to 1,113 in January 2016, with a high percentage of the PEVs being plug-in hybrids (i.e., 865) versus all electric vehicles (i.e., 248). The most popular PEVs are Toyota’s Prius Plug-in and Ford’s C-Max Energi, which make up a combined 48% of the total PEV ownership in the state. The PEVs are predominantly clustered in four counties: Lamoille, Caledonia, Washington, and Chittenden. There is no evident correlation between community size and PEV penetration; however, over 70% of PEV owners are in communities of 1,000 to 10,000 people. On the other hand, there is a close correlation between where PEVs are registered and where they publically charge.
The number of PEV charging stations in Vermont grew from 17 in January 2013 to 111 in January 2016, at a variety of charging venues, including retail, parking (short term and long term), workplace, dealerships, hotels, education, leisure, and hospitals. The vast majority of the charging venues contain Level 2 electric vehicle supply equipment (EVSE) solely or combined with Level 1 EVSE or direct current fast charging. The average power transferred per charging event for communities across Vermont ranged from 4.8 to 13.8 kWh for direct current fast charging and 1.0 to 11.9 kWh for and Level 2 EVSE. Over half the charging locations offer free charging. For those that do require payment, different pricing models are employed, including monthly memberships, hourly payment (where there is often a higher fee for the first hour followed by a lower hourly fee for the remaining hours), and energy use based on kWh drawn from the EVSE. There is no correlation between pricing models and community size and region, the strongest correlation is by network provider. Charging events across Vermont generally correlate with east-west bands of chargers (Figure ES-1) running from Burlington to Montpelier and in the area of Rutland.

iv
Figure ES-1. Charging infrastructure locations in Vermont.
A number of critical factors are important to the success of the Drive Electric Vermont Program, including the following:
High-Level State Buy-in: Policymaker support raises visibility, awareness, and helps gain buy-in.
Central Hub and Point of Contact: Stakeholder coordination, one-stop technical support, and communications consistency are essential.

v
Early and Broad Stakeholder Involvement: Support has to come from multiple sources and partnerships that offer different resources and constituencies, and provide expanded reach.
Tracking PEV Registrations: It is essential to track PEV adoption to assess progress to inform project focus and local decision making.
Car Dealerships: It is important to work with auto dealers to ensure they are aware of PEV options and charging infrastructure, and to partner extensively to support their sales, including development of innovative incentive programs.
Utilities: A significant amount of infrastructure is stimulated by grants and utilities buying and coordinating placement of EVSE.
Incentives and Grants: Incentives and grants have played a significant role in the success of PEVs and EVSE in Vermont and can emanate from a variety of public and private sources.
Outreach and Education: A good strategy focuses on the consumer journey of awareness, purchasing, and advocacy, including raising public awareness, getting early adopters on board with new PEV models, and transitioning to early majority consumers.
Vermont Clean Cities: The Clean Cities Coalition in Vermont serves as force multiplier for technical assistance, education and outreach, and incentives.
Vermont Culture and Climate Factors: The unique culture is receptive to PEVs, while contrasting with the challenging climate.
The Drive Electric Vermont Program has proven successful in expanding the acceptance and utilization of PEVs in a rural, cold weather environment. PEVs are becoming more mainstream, with fewer barriers to PEV adoption. The timeline to develop a PEV program (similar to Drive Electric Vermont) in other states could be expected to proceed at a similar or faster pace due to greater current knowledge, ability to leverage a broader range of existing resources, and general, much broader PEV availability and consumer awareness than 3 to 4 years ago.

vi
CONTENTS
ACKNOWLEDGEMENTS .......................................................................................................................... ii
EXECUTIVE SUMMARY ......................................................................................................................... iii
ACRONYMS ............................................................................................................................................. viii
1. BACKGROUND ................................................................................................................................ 1
2. U.S. DEPARTMENT OF ENERGY EV EVERYWHERE GRAND CHALLENGE ...................... 1
3. DRIVE ELECTRIC VERMONT PROGRAM .................................................................................. 1
3.1 Costs ......................................................................................................................................... 4
3.2 Future Plans.............................................................................................................................. 5
4. PLUG-IN ELECTRIC VEHICLE MARKET PENETRATION ........................................................ 5
5. VERMONT CHARGING INFRASTRUCTURE .............................................................................. 8
6. CRITICAL FACTORS EVALUATION .......................................................................................... 12
6.1 Vermont Cultural and Climatic Factors ................................................................................. 12
6.2 High-Level State Buy-In ........................................................................................................ 13
6.3 Central Hub and Point of Contact .......................................................................................... 13
6.4 Early and Broad Stakeholder Involvement ............................................................................ 14
6.5 Tracking Plug-In Electric Vehicle Registrations ................................................................... 14
6.6 Car Dealerships ...................................................................................................................... 15 6.6.1 Plug-In Electric Vehicle Rebate Program ................................................................. 15 6.6.2 Dealership Challenges ............................................................................................... 17 6.6.3 Leasing ...................................................................................................................... 17 6.6.4 Used Vehicles ........................................................................................................... 18 6.6.5 Vehicle Availability .................................................................................................. 18 6.6.6 Opportunities to Attract Dealerships to Promote Plug-In Electric Vehicles ............. 18 6.6.7 Information Sells the Vehicle ................................................................................... 19
6.7 Utilities and Electric Vehicle Supply Equipment Usage Analysis......................................... 19 6.7.1 Green Mountain Power ............................................................................................. 19 6.7.2 Burlington Electric Department ................................................................................ 21 6.7.3 Washington Electric Co-Op ...................................................................................... 22 6.7.4 Stowe Electric ........................................................................................................... 22
6.8 Incentives and Grants ............................................................................................................. 23
6.9 Outreach and Education ......................................................................................................... 24
6.10 Vermont Clean Cities Coalition ............................................................................................. 26
7. EXTRAPOLATION: SMALL TO MIDSIZE TOWNS NATIONALLY ........................................ 27
APPENDICES ............................................................................................................................................ 29
Appendix A: Plug-In Electric Vehicle and Electric Vehicle Supply Equipment Surveys ............... 29
Appendix B: Case Study Methodology ............................................................................................ 33

vii
FIGURES
Figure ES-1 Charging infrastructure sites in Vermont. ............................................................................... iv
Figure 1.Monthly Vermont PEV registrations. ............................................................................................. 2
Figure 2. DEV Program timeline. ................................................................................................................. 4
Figure 3. Plug-in electric vehicles per capita in Vermont counties. ............................................................. 6
Figure 4. PEV sales penetration per person versus community size. ............................................................ 7
Figure 5. Evaluation of plug-in electric vehicles sales by community size. ................................................. 7
Figure 6. ZEV regulation states. ................................................................................................................... 8
Figure 7. Vermont PEV charging infrastructure by Levels 1 and 2, and DC fast chargers. ......................... 9
Figure 8. EVSE venues and charging levels. .............................................................................................. 10
Figure 9. EVSE locations by pricing structure. .......................................................................................... 12
Figure 10. PEVs registered in Vermont. ..................................................................................................... 16
Figure 11. Number of dealers by volume of PEV sales. ............................................................................. 17
Figure 12. Number of drivers that own and lease PEVs. ............................................................................ 18
Figure 13. Comparison of PEVs and charging events by zip code in Vermont. ......................................... 20
Figure 14. Green Mountain Power Freedom Station in Williston. ............................................................. 21
Figure 15. ChargePoint Level 2 EVSE in Stowe. ....................................................................................... 23
Figure 16. PEV demonstration in Burlington. ............................................................................................ 25
Figure 17. Drive the Dream Vermont ride and drive. ................................................................................. 26
Figure A-1. Mechanisms that create awareness of and interest in PEVs. ................................................... 29
Figure A-2. Mechanisms that create awareness of and interest in EVSE. .................................................. 30
Figure A-3. Principal reasons to purchase a PEV. ...................................................................................... 30
Figure A-4. Principal reasons to lease a PEV. ............................................................................................ 31
Figure A-5. Critical factors for encouraging the purchase/lease of PEVs. ................................................. 31
Figure A-6. Critical factors for installing EVSE. ........................................................................................ 32
TABLES
Table 1. 2014 PEV registrations in Vermont and other U.S. cities. ............................................................. 3
Table 2. 2014 PEV registrations in cold weather U.S. cities. ....................................................................... 3
Table 3. Vermont PEV registrations by model. ............................................................................................ 6
Table 4. Breakdown of PEV ownership by community size., ....................................................................... 7
Table 5. Vermont EVSE infrastructure and network providers. ................................................................... 9
Table 6. Free PEV charging locations by community size and network provider. ..................................... 11

viii
ACRONYMS
AEV all electric vehicle
BED Burlington Electric Department
DCFC direct current fast charger
DEV Drive Electric Vermont
DMV Department of Motor Vehicles
DOE U.S. Department of Energy
GMP Green Mountain Power
EVSE electric vehicle supply equipment
MOU memorandum of understanding
OEM original equipment manufacturer
PEV plug-in electric vehicle
PHEV plug-in hybrid electric vehicle
UVM University of Vermont
VEIC Vermont Energy Investment Corporation
VLITE Vermont Low-Income Trust for Energy
WEC Washington Electric Co-Op
ZEV zero emission vehicle

1
Drive Electric Vermont Case Study
1. BACKGROUND Since introduction of the Nissan Leaf and Chevy Volt in 2011, there has been a steady increase in the
adoption of plug-in electric vehicles (PEVs), especially on the west coast of the United States and selected urbanized areas of the eastern United States. In these areas, PEVs are transitioning from the early adopter to the early mass market phase. As of 2015, most major automobile original equipment manufacturers (OEMs) were providing PEVs to the market, with 21 models available in limited regional or national distribution, often in response to emission standards requirements. With regard to PEV charging infrastructure, in February 2016, there were 12,248 public electric vehicle charging stations in the United States; this includes 30,756 charging outlets.a
Despite promising growth in PEV sales and expansion of charging infrastructure, several factors currently dampen this momentum. As of early 2016, low oil prices have reduced the economic incentive of purchasing PEVs and consumer preferences have leaned toward larger sport utility vehicles and crossover models that presently have few PEV options. Consumer awareness and education regarding PEVs, incentive availability, and charging infrastructure are also affecting market growth. Currently, the majority of PEV sales have been in highly conducive, selected, metropolitan areas; opposed to more broad distribution across the country. This case study provides an example of a PEV-supportive initiative beyond the urban clusters as an illustration for other small and medium-sized communities that are advancing PEVs in their regions.
2. U.S. DEPARTMENT OF ENERGY EV EVERYWHERE GRAND CHALLENGE
Small and midsize towns in the United States, with populations of 50,000 or less, are often ideal PEV communities due to their typically shorter driving distances. The U.S. Department of Energy’s (DOE’s) EV Everywhere Grand Challenge is looking carefully at the barriers and opportunities that exist for enabling small and midsize communities to partake in the PEV market and at the benefits from the economic and environmental advantages of PEVs. One EV Everywhere objective is to develop a national pilot program that would enable small and midsize communities across the United States to implement PEV growth plans. In order to develop a sound pilot, it is critical that DOE understands the challenges and barriers to PEV penetration that must be overcome by small and midsize communities. This is necessary to attract an appropriate number of small to midsize community participants and supporting stakeholders (such as local electric utilities).
In order to gain insight into these challenges and barriers, DOE selected a success story (i.e., Drive Electric Vermont [DEV]; http://www.driveelectricvt.com/) as the subject of this case study. This case study involved a detailed review of the effort by organizations within the state of Vermont to establish a statewide PEV program. The overall objective of the case study is to use the lessons learned from DEV to determine what activities are most effective at encouraging the acquisition of PEVs and the deployment of charging infrastructure in small to midsize communities. This includes prioritizing PEV and charging infrastructure deployments, identifying robust means for growing the PEV market, and applying the lessons learned to other small to midsize communities across the nation.
3. DRIVE ELECTRIC VERMONT PROGRAM The DEV Program was formed in 2012 from a memorandum of understanding (MOU) between three
Vermont state agencies (i.e., Vermont Agency of Transportation, Vermont Agency of Natural Resources, a U.S. Department of Energy Clean Cities Alternative Fuels Data Center.

2
and Vermont Public Service Department) and the nonprofit Vermont Energy Investment Corporation (VEIC). The goal of the DEV Program is to increase use of electrified transportation in Vermont through policy development, education and outreach, and infrastructure development. Measures of success for the DEV Program include (1) number of PEVs registered in the state, (2) number of people aware of PEV options and considering them for vehicle purchases, (3) availability of workplace and public charging infrastructure, and (4) state and local policy support (e.g., building codes). Significant achievements have been made to-date and are discussed in the other sections of this report. Figure 1 illustrates steady growth in Vermont PEV registrations since 2012.
Figure 1.Monthly Vermont PEV registrations.
Table 1 illustrates the new 2014 registrations of PEVs and includes plug-in hybrid electric vehicles (PHEVs) and all electric vehicles (AEVs) as a percentage of total new 2014 light-duty vehicle registrations in Vermont. This is compared to the sister state of New Hampshire and several high PEV penetration cities across the United States, which are all in temperate or warm climates. While not achieving the PEV penetration rates of highly conducive (i.e., moderate temperatures, strong state support, and environmentally conscious) west coast cities, Vermont fares well against other similar locales.

3
Table 1. 2014 PEV registrations in Vermont and other U.S. cities.b
PHEV AEV Total PEV
% AEV of PEV
% of All 2014 Registered Vehicles
PHEV AEV PEV
Vermont 176 55 231 24 0.45 0.14 0.59
New Hampshire 115 61 176 65 0.14 0.08 0.22
Atlanta Metro 621 6,711 7,332 92 0.19 2.03 2.22
Los Angeles Metro 16,559 9,489 26,048 36 1.52 0.87 2.38
Portland Metro 544 979 1,523 64 0.48 0.87 1.35
San Diego Metro 1,840 2,185 4,025 54 1.05 1.25 2.30
Austin Metro 272 409 681 60 0.22 0.33 0.54
Success of the DEV Program is especially clear when (see Table 2) comparing new PEV registrations as a percentage of the total new 2014 registrations in Vermont with other cold weather cities. In this regard, Vermont is tied with Detroit, Michigan with the highest percentage of PEV registrations. In Burlington, Vermont, 40% of the average coldest day of the year (i.e., January 20th) was spent in the frigid temperature band defined as 15°F or less (otherwise known as the peak frigid %).
Table 2. 2014 PEV registrations in cold weather U.S. cities.b
PEV Share and Mix in Cities with Greater than 5% Peak Frigid January Temperature
% PEVs of All Registrations % AEVs of PEVs Peak Frigid %
Vermont* 0.59% 23.8% 40%
Detroit 0.59% 6.7% 17%
Spokane 0.48% 50.0% 13%
Philadelphia 0.34% 36.3% 7%
Boston 0.30% 45.3% 7%
Indianapolis 0.30% 44.3% 19%
Chicago 0.28% 47.2% 24%
Cincinnati 0.26% 36.3% 11%
Dayton 0.25% 24.4% 13%
Minneapolis 0.24% 35.3% 47%
Barnstable MA 0.23% 50.0% 7%
Columbus 0.23% 33.8% 11%
Bloomington IL 0.19% 57.1% 20%
Springfield IL 0.19% 25.0% 20%
Cleveland 0.14% 24.2% 10%
Jackson MI 0.14% 21.1% 24%
Pittsburgh 0.14% 37.6% 16%
South Bend 0.14% 37.6% 20% *Burlington peak frigid %.
b Argonne National Laboratory.

4
The DEV Program can be broadly broken into four components: (1) strategic planning/leadership, (2) stakeholder/partnership development, (3) education and outreach, and (4) incentives. Figure 2 illustrates the highlights of the DEV Program’s timeline with regards to these four components. The early phases of the program focused heavily on strategic planning and stakeholder and partnership development. As the foundation of the program became increasingly set, a transition was made to education and outreach activities and charging infrastructure development. Presently, this emphasis has continued with the addition of grant and incentive programs supporting implementation of charging infrastructure and purchasing of PEVs.
1 VTrans convened electric vehicle stakeholder meeting with representatives from VTrans, Vermont Agency of Natural Resources, Chittenden County RPC,
electric utilities, VEIC, and the City of Burlington. 2 Strategic planning meeting with stakeholders. 3 Initial stakeholder survey distributed. 4 2011 Vermont Comprehensive Energy Plan finalized with goals to reach 90% renewable energy across all sectors by 2050. 5 Stakeholder meeting with survey results. 6 VEIC-designated leader of PEV readiness initiative in Vermont through MOU with state agencies. MOU signed by VEIC, VTrans, Vermont Agency of Natural
Resources, and Vermont Public Service Department. 7 First large-scale PEV ride and drive event held with stakeholders, policy leaders, auto dealers, and public. 8 Initiative rebranded as DEV. 9 VTrans completes first study of transportation infrastructure funding associated with AFVs at the request of the legislature. 10 Quarterly stakeholder meetings continue and charging infrastructure development. 11 State grant program supporting electric vehicle charging in urban communities launches. 12 Consumer awareness survey completed. 13 Consumer/dealer incentive program. 14 Awareness campaign.
Figure 2. DEV Program timeline.
3.1 Costs For the DEV Program, costs can generally be broken out as baseline costs to initially implement the
program and recurring costs to sustain it on an annual basis. As such, the estimated costs for the DEV Program are as follows:
Baseline cost (total $50K):
- Stakeholder convening ($20K)
- Website and branding ($30K)
Recurring costs (total: initial approximately $65K, yearly approximately $100K):
- Stakeholder coordination ($20K/year)
- Charging infrastructure support:
Technical assistance ($5K/year)
Installation guides ($15K initial plus $5K/year)
Strategic Planning / Leadership 1 8 9
Stakeholder / Partnership Development 3 5 10 10
Education / Outreach 7 12 14
Incentives 11 13
Jan 2011
July 2011
Jan 2012
July 2012
Jan 2013
July 2013
Jan 2014
July 2014
Jan 2015
July 2015
Jan 2015
July 2015
Jan 2016
4 6 2

5
Building code updates ($8K initial plus $3K/year)
Workplace charging advocacy
Drive the dream ($20K)
Workplace charging ambassadorship: ongoing and varies depending on level of effort and interest (approximately $10K/year)
- Dealer outreach: varies depending on level of effort and interest (approximately $5K/year)
- Marketing
Website updates ($20K initial development, plus $5K/year)
Social media ($5K/year)
Events: varies depending on whether organizing ride and drives or attending events organized by others; DEV has done both ($15K to $20K/year)
Media campaigns: limited by funding ($15K/year)
3.2 Future Plans Future plans for the DEV Program in 2016 include the following:
A new round of consumer/dealer incentives in greater quantities and at higher incentive levels. Incentive forms will be distributed on an as-needed basis to support more rapid use of available funds.
Continuation of the marketing campaign, placing greater emphasis on search engine optimization techniques to drive “organic” visits to the DEV website.
Utilization of a consumer survey to develop new campaign themes and measure the effectiveness of the distribution channels.
4. PLUG-IN ELECTRIC VEHICLE MARKET PENETRATION As of January 2016, there were a total of 248 registered AEVs and 865 registered PHEVs in Vermont,
according to information from the Vermont Department of Motor Vehicles. As shown in Table 3, the most popular PEVs are Toyota’s Prius Plug-in and Ford’s C-Max Energi, which make up a combined 48% of the total PEV ownership in Vermont. Figure 3 shows the distribution of PEVs by county, with a clustering of Lamoille, Caledonia, Washington, and Chittenden counties having the highest per capita penetration.
Table 4 provides a breakdown of PEV ownership by community size (as of September 2015), with the number of communities (e.g., villages or towns) only including those with PEV owners. Over 70% of the state’s PEV owners are in areas with a population between 1,000 and 10,000 people, which could be partially due to the fact that most of the state’s population lives in communities of that size. PEV penetration does not show a trend when compared with community size (Figure 4).
Figure 5 shows how the number of PEVs per person has changed over the past couple of years. The overall takeaway is that there has been a relatively steady increase in PEV uptake, with the quickest rise in large communities (i.e., greater than 25,000) and those with a population between 5,000 and 10,000.

6
Table 3. Vermont PEV registrations by model.c
Figure 3. Plug-in electric vehicles per capita in Vermont counties.
c Vermont Department of Motor Vehicles and Vermont Agency of Natural Resources, January 2016.

7
Table 4. Breakdown of PEV ownership by community size.d,e
Community Size # of Communities # of PEVs PEVs per Community % of Total PEVs in VT
<1,000 45 72 1.60 6.9%
1,000-5,000 113 448 3.96 43.0%
5,000-10,000 16 288 18.00 27.7%
10,000-25,000 8 103 12.88 9.9%
>25,000 1 130 130.00 12.5%
Figure 4. PEV sales penetration per person versus community size.f
Figure 5. Evaluation of plug-in electric vehicles sales by community size.f
d U.S. Census Bureau and Vermont Agency of Natural Resources. e Note: Data analysis does not include neighborhood electric vehicles such as the GEM 825. f U.S. Census Bureau and Vermont Agency of Natural Resources.
0.00%
0.05%
0.10%
0.15%
0.20%
0.25%
0.30%
0.35%
<1,000 1,000‐5,000 5,000‐10,000 10,000‐25,000 >25,000
PEV
Penetration (per person)
Community Size
0.00%
0.05%
0.10%
0.15%
0.20%
0.25%
0.30%
0.35%
2013 2014 2015
PEV
Market Pen
etration (per person)
Year
PEV Market Penetration Growth
<1,000
1,000‐5,000
5,000‐10,000
10,000‐25,000
>25,000

8
An issue to keep in mind with regards to PEV market penetration is the California Zero Emission Vehicle (ZEV) regulation and its effects on the other nine states that have adopted it in-lieu of federal standards. They are often referred to as the “Section 177” states, after the section of the Clean Air Act that allows states to adopt the California requirements. Figure 6 shows the states participating in this regulation, which requires auto manufacturers to sell an increasing share of PEVs and hydrogen ZEVs in relation to their total sales. To foster technology development, the California ZEV regulation includes a travel provision, which addresses production volume requirements for compliance in California and the Section 177 states. This provision allows manufacturers to earn credits in all ZEV states for vehicles sold in any of those states. This has the effect of limiting the availability of ZEVs at dealerships in states outside California, because it is often easier to meet ZEV requirements by focusing on California or other Section 177 states with higher vehicle sales. The travel provision is expected to expire after the 2017 model year and, in model year 2018 automobile manufacturers will be required to place increasing numbers of AEVs in other Section 177 states. This should increase the availability of vehicles and OEM marketing efforts in those states. However, should the travel provision be extended, it could dampen PEV sales in the Section 177 States (including Vermont) and reduce industry obligations in those states that have adopted the California program.
Figure 6. ZEV regulation states.
5. VERMONT CHARGING INFRASTRUCTURE Vermont has experienced a significant increase in electric vehicle charging stations over the past
3 years. As shown in Figure 7, the number of electric vehicle charging infrastructure has grown from 17 in January 2013 to 111 in January 2016. This growth demonstrates the effectiveness of combined efforts to increase the availability of PEV charging, particularly with the advent of more robust utility and state participation over the last 2 years.
Table 5 provides information on electric vehicle supply equipment (EVSE) installations in Vermont, including both charging level and network provider. The vast majority of EVSE installations in Vermont contain Level 2 EVSE, either solely or in combination with Level 1 EVSE or direct current fast chargers (DCFCs). Most DCFC locations offer Level 2 EVSE as an alternative for vehicles not equipped with a fast charging port, for vehicle owners who favor the lower fees, or for vehicle owners that do not mind the slower speed. Very few locations only offer Level 1 EVSE and they tend to have a higher number of plugs per installation (i.e., some park and ride lot locations have over 10 Level 1 EVSE charging outlets available). Level 2 EVSE and DCFC offer an average of around two plugs per location, with ChargePoint

9
having the largest share of installations, followed by EVgo and Tesla. Many EVSE did not have network information available and are compiled under “No Network/Unknown.”
Figure 7. Vermont PEV charging infrastructure by Levels 1 and 2, and DC fast chargers.
Table 5. Vermont EVSE infrastructure and network providers.g
Level 1 Level 2 DCFC Total
Total Locations 10 94 22 114
Total Plugs 47 211 37 295
Average Plugs/ Location 4.7 2.2 1.7 2.6
Locations with more than one charging level
Level 1 and 2 EVSE 6
Level 2 EVSE and DCFC 6
Locations by Charging Network
ChargePoint 4 36 6 46
EVgo 0 20 11 31
Tesla 0 6 2 8
No Network/Unknown 6 23 3 32
EVSE have been installed in a variety of venues in Vermont. Figure 8 shows all installations in different venue segments, including retail, parking (short term), workplace, dealership, hotel, education,
g U.S. Department of Energy Clean Cities Alternative Fuels Data Center, February 2016.
17 20
42
929
19
0
20
40
60
80
100
120
Jan 2013 Jan 2014 Jan 2015 Jan 2016
Fast ChargingAvailableLevel 1 and 2

10
leisure, parking (long term), and hospital, and provides charging level information for each of these venue categories as of December 2015.
Figure 8. EVSE venues and charging levels.h
The largest segment, which is retail, refers to EVSE that have been installed at specific standalone businesses where customers purchase goods or services. Most of these are short-term charging opportunities, lasting perhaps 2 to 3 hours (e.g., malls, grocery stores, and markets). The parking (short term) category is very similar; however, it includes EVSE installations that are not specific to a single business. Many of these EVSE are located in downtown areas, serving PEV drivers who may be visiting several different places around a town center. The retail and parking (short term) categories have nearly identical charging level structure, with the vast majority being Level 2 EVSE, followed by DCFC and a couple of Level 1 EVSE .
The numbers of workplace, dealership, and hotel EVSE installations are nearly equal. A workplace designation was assumed for installations at businesses that are not retail or shopping locations. Most workplace EVSE are Level 2, but there are a few Level 1 EVSE and DCFCs. A number of dealerships also installed EVSE, including BMW, Chevrolet, Ford, Mini, Mitsubishi, Nissan, and Volkswagen. These EVSE are available for public use during regular business hours, but only a small number are DCFC (most PEV drivers would likely not stop for a few hours at a dealership, especially if it was not the maker of their vehicle). Additionally, nine hotels have installed EVSE. This venue type had the largest percentage of Level 2 EVSE (i.e., 90%), with a single DCFC installed at one hotel that is very close to an interstate highway exit.
The remaining 21% of installations are categorized under education, leisure, parking (long term), and hospital. Education encompasses university and grade school EVSE, but most installations are on college campuses. Leisure is a “catch-all” for theatres, ski resorts, museums, country clubs, and anything with a similar purpose. Parking (long term) includes anything that will likely have over 8 hours of dwell time, which, in Vermont, includes park and rides and Burlington International Airport. h U.S. Department of Energy Clean Cities Alternative Fuels Data Center, December 2015.

11
It is difficult to clearly distinguish between highway and downtown EVSE locations in a state with low population density such as Vermont. EVSE locations were tagged as highway installations if they were close to a major throughway (i.e., often locations designed for people traveling longer distances [e.g., quick stops, hotels, and gas stations]). Non-highway locations include EVSE in both downtown and other less highway-accessible areas. Seventy-one percent of the EVSE installations are downtown, leaving 29% installed in areas easily accessible from major highways. There is no clear charging level trend aside from the overall dominance of Level 2 EVSE, which is likely because most of the state highways go through several smaller townships and communities. EVSE installed in these smaller communities are easily accessible from the highway, but are primarily the slower Level 2 EVSE.
PEV charging costs vary across different networks and charging levels. Over half of the locations offer free charging; this does not include the standard parking/garage permit fees. Table 6 breaks down the locations with free charging by community size and network provider, showing that larger communities tend to offer free charging more frequently and this free charging is generally provided by network providers outside of EVgo. Additionally, Level 1 EVSE charging is cost-free significantly more often than Level 2 EVSE or DCFC. It is important to note that many EVSE site operators who are currently providing free PEV charging are expected to begin instituting a fee structure. This is not primarily to collect revenue, but to institute a “kick-off” fee after a set number of hours to encourage non-charging PEVs to vacate the charging station.
Table 6. Free PEV charging locations by community size and network provider.i
Free Charging by Community Size (% Free Locations)
Level 1 Level 2 DCFC Total
All 85% 53% 56% 58%
Less than 1,000 – 75% 0% 60%
1,000 to 5,000 75% 52% 0% 50%
5,000 to 10,000 80% 42% 67% 51%
10,000 to 25,000 100% 60% 50% 60%
Greater than 25,000 100% 67% 100% 79%
Free Charging by Network (% Free Locations)
Level 1 Level 2 DCFC Total
ChargePoint 83% 64% 75% 68%
EVgo 0% 0% 0% 0%
Tesla – 100% 100% 100%
Other/Unknown 100% 76% 100% 84%
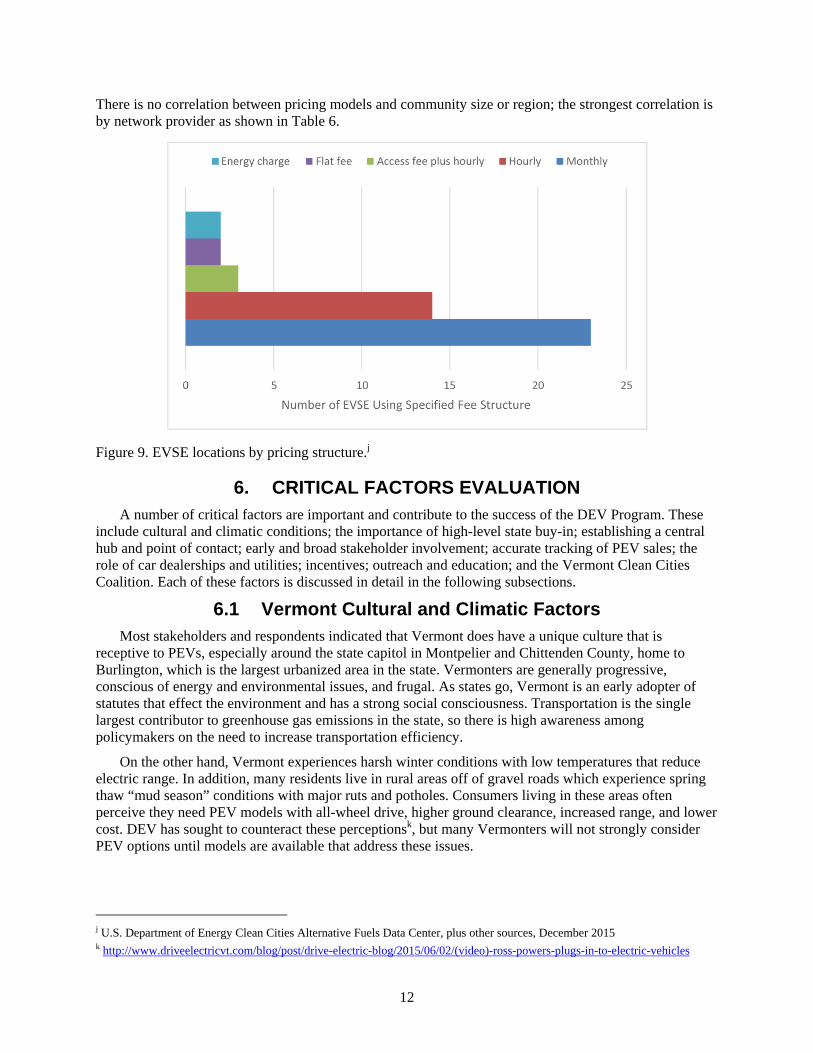
There are several different pricing models for EVSE charging. The first is a monthly membership, which is utilized by EVgo. Typically, in a monthly membership, a higher monthly payment equates to a lower fee per EVSE charging session. The second form of pricing is an hourly payment, where there is often a higher fee for the first hour, followed by a lower hourly fee for the remaining hours the PEV is plugged in. For some stations, there is a flat “access fee” in addition to the hourly rate. The final and least common fee type is energy-based, where the user is charged per kWh drawn from the EVSE. Figure 9 shows the different pricing models and the associated number of Vermont EVSE currently using them. i U.S. Department of Energy Clean Cities Alternative Fuels Data Center, December 2015.
12
There is no correlation between pricing models and community size or region; the strongest correlation is by network provider as shown in Table 6.
Figure 9. EVSE locations by pricing structure.j
6. CRITICAL FACTORS EVALUATION A number of critical factors are important and contribute to the success of the DEV Program. These
include cultural and climatic conditions; the importance of high-level state buy-in; establishing a central hub and point of contact; early and broad stakeholder involvement; accurate tracking of PEV sales; the role of car dealerships and utilities; incentives; outreach and education; and the Vermont Clean Cities Coalition. Each of these factors is discussed in detail in the following subsections.
6.1 Vermont Cultural and Climatic Factors Most stakeholders and respondents indicated that Vermont does have a unique culture that is
receptive to PEVs, especially around the state capitol in Montpelier and Chittenden County, home to Burlington, which is the largest urbanized area in the state. Vermonters are generally progressive, conscious of energy and environmental issues, and frugal. As states go, Vermont is an early adopter of statutes that effect the environment and has a strong social consciousness. Transportation is the single largest contributor to greenhouse gas emissions in the state, so there is high awareness among policymakers on the need to increase transportation efficiency.
On the other hand, Vermont experiences harsh winter conditions with low temperatures that reduce electric range. In addition, many residents live in rural areas off of gravel roads which experience spring thaw “mud season” conditions with major ruts and potholes. Consumers living in these areas often perceive they need PEV models with all-wheel drive, higher ground clearance, increased range, and lower cost. DEV has sought to counteract these perceptionsk, but many Vermonters will not strongly consider PEV options until models are available that address these issues.
j U.S. Department of Energy Clean Cities Alternative Fuels Data Center, plus other sources, December 2015 k http://www.driveelectricvt.com/blog/post/drive-electric-blog/2015/06/02/(video)-ross-powers-plugs-in-to-electric-vehicles

13
6.2 High-Level State Buy-In It is often difficult, yet very important to secure high-level state buy-in at the beginning of a PEV
program. The state of Vermont has had a long history with PEVs going back to EVermontl and the state’s support for early testing and deployment. In 2013, the Vermont governor signed an eight-state MOU calling for coordinated action to reach 3.3 million ZEVs by 2025. Prior to this, Vermont established a goal of achieving 90% renewable energy usage across all sectors by 2050 in the 2011 Comprehensive Energy Plan, which will require major electrification of the light-duty fleet. The governor has attended several DEV events and supported PEVs in a variety of venues, such as the New England Governors/Eastern Canadian Premiers meetings that led to creation of the Quebec-Vermont green corridor for PEV charging. Having high-level state policymakers supporting PEVs raises the visibility and awareness, and helps gain buy-in from other important entities, such as foundations that often refer to state policy when considering grants. Additionally, establishment of high state-level goals supports a variety of state activities, including use of clean energy funds, public EVSE investments, updates to building codes, permitting, and incentives. While most DEV activities that have been completed to date have not required legislative action, the passage of Act 56 in 2015 included a statewide Renewable Energy Standard and included a “tier 3” provision that requires electric utilities to reduce their customers’ fossil fuel consumption, potentially through vehicle electrification.
Despite this widespread support from leaders, the state has not found a sustainable source of funding for PEV incentives due to a variety of pressures on state budgets, including health care, weatherization programs, and other priorities. While state incentives would likely increase the rate of adoption, DEV has found other sources of funding (see section 6.7 Incentives and Grants) for limited incentive programs and continues to see significant PEV market gains.
Organizing around climate, energy, and transportation is a good strategy and strong participation of state agency heads and staff is important. In Vermont, all state agencies participate in climate action plan implementation, with regular state climate cabinet discussion of the Vermont ZEV plan. As a result of the establishment of the previously mentioned “green corridor” connecting Vermont and Montreal, members of DEV, particularly utilities and state agencies, coordinated regular meetings and assignments of responsibility (VTrans for signage, commerce/tourism for mapping, and utilities for hardware). Subsequently, EVSE installed in St. Alban, Burlington, Middlesex, and Montpelier were labeled on Vermont tourism maps.
6.3 Central Hub and Point of Contact Recognizing the crosscutting nature of PEVs, three state agencies (i.e., environmental, energy, and
transportation) identified the need to establish a central hub and single point-of-contact that serves as an umbrella over the various PEV-related activities in Vermont. A challenge facing Vermont was that state PEV efforts did not really have a natural home and that essential elements (such as establishment of events, stakeholder group organization, and website development) are difficult for state organizations to conduct. Understanding that the key to leadership is ownership, the three state agencies signed an MOU with the Vermont Energy Investment Corporation, which evolved into the DEV Program (i.e., a central hub and single point-of-contact supporting PEV adoption). Establishment of this central hub is essential for stakeholder coordination, one-stop-shop technical support (which is especially important for small entities), and consistency of communications.
DEV serves as a clearinghouse of information and accelerates actions by identifying common interests and complementary resources (e.g., financial and marketing), as well as providing consistent customer service. DEV’s convening function and provision of physical forums is especially important for leadership, establishment of subcommittees for specific topics, and answering technical questions. All
l http://www.anr.state.vt.us/air/docs/voice.pdf

14
stakeholders are engaged through a multi-stakeholder group that meets quarterly; many stakeholders serve on DEV subcommittees and attend stakeholder meetings, which helps keep them informed. As the central coordinating and management entity, DEV can drive strategy development. Finally, as the current level of state funding resources for PEV programs may decrease over time, it is important to build a foundation that is sustainable.
6.4 Early and Broad Stakeholder Involvement In order to achieve success of a PEV program, multiple stakeholders should be involved from the
beginning. In Vermont, the Public Service Department, Agency of Natural Resources, Agency of Transportation, and Agency of Commerce and Community Development all were engaged with regards to PEVs and charging infrastructure. Support has to come from multiple sources and partnerships with entities such as utilities, the energy and business communities, auto dealerships, nonprofits, and health care providers being key. Each entity offers a different constituency and provides expanded reach, audiences, communication mechanisms, resources, and perspectives. For example, the Sierra Club has a goal to increase PEV awareness, but has limited financial resources. However, the Sierra Club does attend DEV events, conducted a PEV forum with 250 people, and provides a volunteer base and outreach channel. A good strategy is to initially target larger institutions (such as universities, companies, and hospitals) because they frequently have more resources to support EVSE installations or fleet use of PEVs and can influence smaller entities, which leads to a domino effect. The State of Vermont has been an active and enthusiastic partner from the start, which has helped bring in many of these other stakeholders.
6.5 Tracking Plug-In Electric Vehicle Registrations Tracking state PEV adoption is essential to assessing progress to inform project focus and local
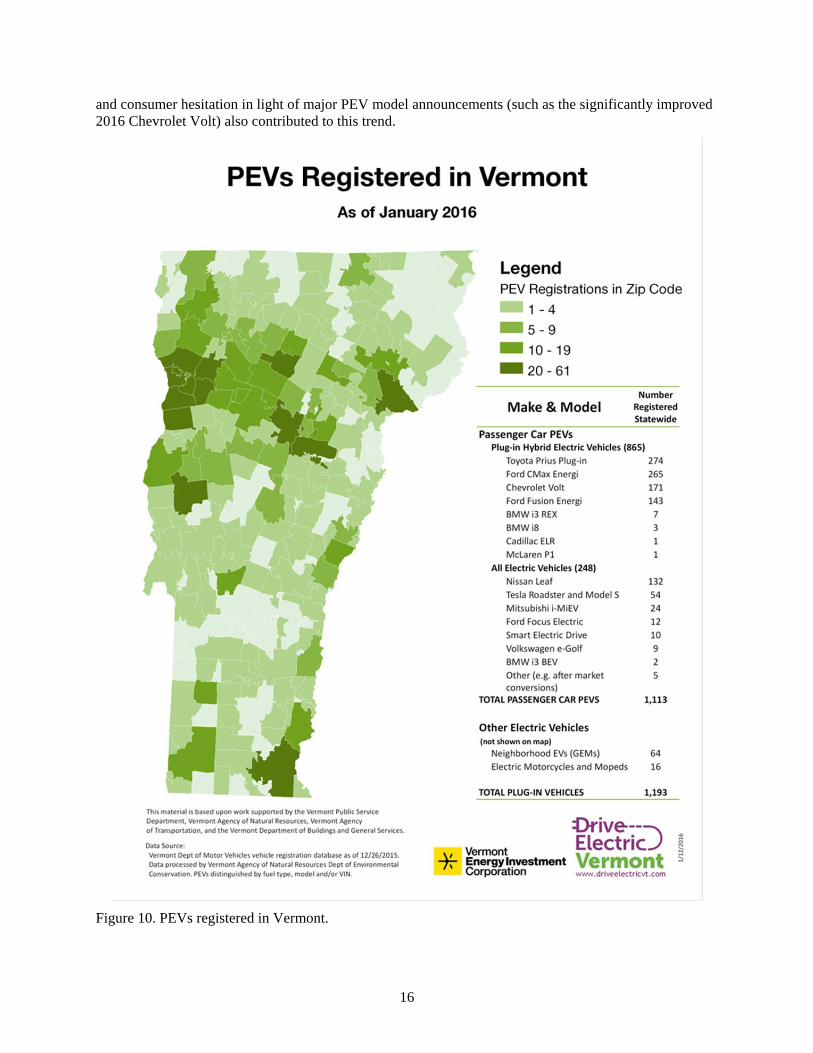
decision making. Many stakeholders are interested in data tracking PEV registrations, leased/purchased, new/used, and what types of vehicles are entering the fleet through easy-to-understand graphics and summaries. For example, Figure 10 illustrates PEVs registered in Vermont as of January 2016 by zip code and vehicle make and model. This information supports policy discussions of incentives and charging and creates opportunities for media coverage.
Despite what may seem a simple matter, in many states it is often difficult to extract PEV registration information from State Department of Motor Vehicles (DMV) data. Typical DMV data fields are used for different purposes and create four principal challenges: (1) DMV data fields do not correspond to PEVs, (2) errors exist in manual data entry, (3) the fuel-type field is often a misnomer (e.g., everything is often listed under hybrid, including PEVs), and (4) DMV databases are dynamic, with vehicles frequently entering and leaving with vehicle duplicates being in the database. It is important to build a system that starts with clean records and eliminate duplicates, which requires extra filtering processes. This may be better accomplished by state entities other than DMV. For example, in Vermont, the Agency of Natural Resources receives raw data from the DMV and then performs several actions to clean and validate this information. One way to improve DMV data quality is through vehicle identification number decoding companies (such as IHS Automotive; formerly Polk), which can provide information on the vehicle identification number stem to enhance DMV data records and consistently classify PEV models.
It is important to get buy-in from the state DMV, with a good practice of identifying a specific individual with which to work and accurately determine the foundational processes and frequency of data requests. It is a good idea to aggregate the data needs of other state agencies as part of the PEV data request. Once all data needs have been identified, approach the DMV with one major data request. A comprehensive request will save the DMV time and money as opposed to responding to multiple data requests. New states undertaking this process should sit down with their DMV and identify required data fields from information available in the state’s database system. For example, DMVs often collect information on where vehicles were acquired, which can be very useful. Additionally, it is often possible to determine whether PEVs are purchased or leased with additional analysis of DMV data.

15
For Vermont, cost estimates for identifying and segregating PEV sales/leases include an upfront capital cost to establish foundational processes (approximately 500 hours total for the Vermont Agency of Natural Resources and DMV). It required the Vermont Agency of Natural Resources 3 to 6 months to set up the processes on a part-time basis. Once the foundational processes were in place, data were requested quarterly from DMV, which provided an electronic text file sent through automatic processes. Processing each new quarterly dataset required approximately 10 to 20 hours of labor time, with about 90% of the process automated through queries and the remaining 10% manual. Conceptually, processes from Vermont could be used by other states or regions, with some process steps transferrable; however, this will depend on the data formats of other state DMVs.
6.6 Car Dealerships DEV’s initial engagement with automobile dealers was through the Vermont Vehicle and Automotive
Distributors Association. DEV continues to provide ongoing outreach to dealers as new PEV models become available. This provides DEV an opportunity to contact local dealers and inquire whether they plan to stock new PEVs and make them aware of DEV’s resources. In support of car dealerships, DEV serves as a technical resource and increases awareness through organization of PEV car demonstrations, maintaining a website with one-stop shopping for PEV-related information, acting as a conduit on energy-related issues (such as solar and biofuels), and providing rebates/incentives. This knowledge component is critical because there are so many potential options and PEV technology is rapidly changing.
6.6.1 Plug-In Electric Vehicle Rebate Program
During the summer of 2014, DEV implemented a point-of-sale PEV rebate consisting of $500 for the customer and $200 for the dealer for the sale or lease of each PEV. Seventy-six rebate certificates were made available for distribution to interested dealerships using funding from the nonprofit Vermont Low-Income Trust for Energy (VLITE), which resulted as part of a utility merger settlement. The $500 customer rebate was used by dealers to reduce the purchase price or lease payments/down payment. There are approximately 100 new car dealerships in the State of Vermont, 11 of which participated in the PEV Rebate Program. Incentive vouchers where given to participating dealerships, but if they were not utilized by a specific time, they were redistributed to dealerships more actively selling/leasing PEVs through the program. This program provided motivation for the dealership to encourage customers to consider PEVs, with several of the participating dealerships strongly embracing the technology and accounting for a high percentage of PEV sales. For example, the principal of one dealership challenged his franchise to sell 30 PEVs in 30 days, a target of which was ultimately exceeded by 100%. This particular dealership (Lamoille Valley Ford) is the #2 dealership in the entire country for selling this particular make/model (Ford C-Max Energi) of PEV. The PEV rebate process was simple, DEV directly provided rebate checks to the dealerships upon sale and submission of an incentive voucher. A second round of PEV rebates is currently being considered and is likely to include a higher incentive level and increased numbers of rebate certificates.
Figure 11 illustrates the number of dealers by the volume of PEVs sold in Vermont for 2012 through 2015. As shown, a large percentage of PEV sales were by a small handful of auto dealers. For example, the top three PEV sales dealerships accounted for 135 (out of 364), 141 (out of 308), and 108 (out of 261) PEV sales in 2013, 2014, and 2015, respectively. It is important to broaden the spectrum of dealerships, but initially a heavy focus should be on those early adopter dealerships that are truly interested in selling PEVs. In Vermont, there are more chargers per 10,000 light-duty vehicles than California, which is an indication that it may be more helpful to PEV adoption to focus on actions resulting in sales rather than increasing the availability of public EVSE. The decrease in annual sales from 2013 to 2015 is largely due to the discontinuance of the Toyota Prius plug-in model in Vermont. Robust sales of this model from 2012 through 2014 resulted in this still being the most registered PEV in the state in January 2016, despite very little growth in registrations over the past 2 years. Lack of incentives in 2015, lower gasoline prices,
16
and consumer hesitation in light of major PEV model announcements (such as the significantly improved 2016 Chevrolet Volt) also contributed to this trend.
Figure 10. PEVs registered in Vermont.

17
Figure 11. Number of dealers by volume of PEV sales.m
6.6.2 Dealership Challenges
In Vermont, automobile dealerships face a number of challenges to selling PEVs, including a rural setting, long distances between towns, and cold and snowy weather. As a result, approximately 78% of sales are for PHEVs, which will likely continue until the range of mass market AEVs increases substantially. To sell PEVs, a trained and educated dealership sales force is very important because PEV customers are often more educated and knowledgeable than typical dealer customers. However, given the high turnover of dealer sales staff, it is often difficult to consistently educate sales staff about PEVs and specific models available at their location. A potential mitigating solution is to have designated specialist staff at the dealership knowledgeable about PEV models for sale to which interested customers can be referred. A knowledgeable salesperson will be able to appropriately match a customer with a PEV model that will suit their needs. Additionally, development of training and incentive programs for dealers has proven beneficial; however, voluntary participation is recommended because some dealerships will not want to invest in the equipment and training required by automakers to sell and service PEVs. For example, approximately $33K worth of tools is required by dealerships to service General Motors PEV products. Mechanic training adds an additional $15 to 20K for an overall investment of approximately $50K. Furthermore, some OEMs maintain strict dealership requirements before shipping PEVs. For example, Ford requires dealerships to have at least two PEV-certified technicians and 70 to 80% of the sales staff be online PEV-certified before shipping any vehicles. PEV dealer training programs should be ongoing as vehicle technology evolves and sales staff turnover occurs.
6.6.3 Leasing
Leasing is a very attractive option given the unique and continuously evolving technology of PEVs. An important issue to keep in mind is how the greater availability of PEVs, resulting from expiring leases, affects the secondary market. Used PEVs with low mileage may be a more affordable option for lower-income car buyers. For at least one dealer, lease financing of PEVs was easier than conventional vehicles because the manufacturer leasing program is structured in a way that gives customers greater equity for PEVs due to the federal tax credit and manufacturer incentive offerings. As shown in
m Vermont Agency of Natural Resources, September 2015.

18
Figure 12, leasing accounts for a significant majority of PEVs purchases in Vermont, although the ratio of leased-to-owned PEVs has declined since 2013.
Figure 12. Number of drivers that own and lease PEVs.n
6.6.4 Used Vehicles
During the third quarter of 2015, 20% of new PEV registrations were for pre-owned PEVs. Some dealers are having a difficult time keeping up with the demand for used PEVs, and many have wait lists of people interested in purchasing PEVs. In Vermont, there are far more non-affiliated dealers than affiliated dealers and used car sales represent a much larger market. As such, it may be beneficial to consider new partners for selling used PEVs. A potentially successful strategy may be targeting a few highly receptive used car dealerships in coordination with credit unions for financing.
As PEVs are starting to come off lease, the question arises as to whether any future incentives should also be applicable to used PEVs. Discussions with representatives of three leading Vermont dealerships and the Vermont Vehicle and Automotive Distributors Association indicated that some financial incentives should be provided for the purchase of used PEVs to help maintain supply and continuity. However, based on dealership input, the preponderance of rebates (i.e., greater than 75%) should be reserved for the lease/purchase of new PEVs. With regards to incentives for used PEVs, it is important that warranties are maintained for batteries.
6.6.5 Vehicle Availability
Vermont dealerships have indicated that the overall availability of PEVs from OEMs has been good; however, it should be noted that larger dealerships and Section 177 states often get preference. For example, the latest Volt model will not be delivered outside of the ZEV states until spring 2016. In general, OEMs have been responsive, but there is often a “sine” wave of inventory (i.e., high to low and vice versa) available. It is important for dealers to go to their regional representatives to increase the availability of vehicles.
6.6.6 Opportunities to Attract Dealerships to Promote Plug-In Electric Vehicles
Working through regional entities (such as OEM-specific New England or “North Country” dealers associations) is a good way to increase awareness of PEVs and encourage dealerships to become more engaged. Dealer principals typically comprise the board of these associations and can significantly influence marketing dollars spent on PEV promotion. Dealerships with a tech-savvy person in upper
n Vermont Agency of Natural Resources, September 2015.

19
management were especially good partners. Organizations such as the Vermont Vehicle and Automotive Distributors Association organized PEV meetings with dealerships and provided leadership for a broader effort to reach the less engaged dealers.
6.6.7 Information Sells the Vehicle
Car demonstrations with DEV have been very effective in attracting people for test drives and providing exposure for dealerships. It is important to show the value of exposure to dealerships; for example, informing the dealership that their vehicles will be seen by a certain number of people. While it is important to make a variety of cars available at demos, it is equally important they be coupled with knowledgeable owners or sales staff to provide information about PEVs and charging requirements. Increasing the knowledge of PEVs is essential to helping consumers understand lease options and lifecycle savings that can offset the higher initial capital costs (e.g., a Ford Energi goes for about $36K, while a standard gasoline Ford Focus is about $22K). Dealerships can also provide PEVs as a short-term loaner option, which provides exposure to additional potential consumers. One frequent recommendation is to make long-term PEV loaners available to dealership management and sales staff to increase their first-hand experience.
6.7 Utilities and Electric Vehicle Supply Equipment Usage Analysis Presently, the Vermont Public Service Board has not opened a proceeding on PEVs and DEV has not
taken actions to directly engage with the Public Service Board, although the Vermont Comprehensive Energy Plan includes several provisions supporting the use of PEVs in the state. A significant amount of infrastructure in Vermont is stimulated by utilities and grants to municipalities by the state, with utilities buying and coordinating placement of EVSE.
Prior to discussing the details of individual electric utilities in Vermont, it is informative to look at the pattern of DCFC and Level 2 EVSE charging events in relation to registered PEVs by zip code in the state. As shown in Figure 13, there is a close correlation between where PEVs are registered and where they publically charge, especially in the more populated areas. Mapping suggests that PEV owners live in the suburbs, have a tendency to drive into downtown to work, and, subsequently, recharge at a workplace or other location prior to heading home for the night. Though not specifically shown here, a majority of the charging events generally correlates with bands of chargers running roughly east-west through the state from Burlington over to Montpelier and around the area of Rutland. In the southern part of the state, there appears to be lower use of DCFC and Level 2 EVSE despite the availability of public charging; this is likely due to lower PEV registrations in this area. Figure 13 is based on EVSE usage data from two data sets (i.e., ChargePoint from January 2014 to December 2015 and EVgo from April to December 2015). It is important to note that this analysis does not include stations from which data were not available. Additionally, this analysis revealed that the average power transferred per charging event for communities across Vermont ranged from 4.8 to 13.8 kWh for DCFC charge events and 1.0 to 11.9 kWh for Level 2 EVSE charge events.
Details provided in the following subsections are for the activities of the four utilities in Vermont most involved with PEVs and charging infrastructure to-date.
6.7.1 Green Mountain Power
Green Mountain Power’s (GMP’s) mission is to become more environmentally conscious and help Vermont achieve state goals to reduce costs. GMP owns and hosts charging stations and has recently shifted from ChargePoint to NRG EVgo as part of a broader partnership with NRG Energy. GMP has had the most success in placing chargers at locations with willing host property owners rather than trying to specifically site stations geographically (e.g., putting EVSE near a major intersection). GMP’s EVgo network now has 38 Level 2 EVSE locations, 21 using Liteon EVSE, and 10 SemaConnect EVSE, with most being dual port that are capable of charging two PEVs at once.

20
Figure 13. Comparison of PEVs and charging events by zip code in Vermont.o
o Idaho National Laboratory.

21
Figure 14. Green Mountain Power Freedom Station in Williston.
There are other locations with single charging ports, one four-port, one six-port, and one eight-port EVSE used by a private fleet customer. GMP also maintains 13 DCFC (two Fuji, one Signet, four Nissan, and six ABB) installed over the past few years, including “Freedom Stations” that combine DCFC and Level 2 EVSE charging (see Figure 14). GMP’s EVSE venues include a significant amount of retail, two workplaces not available to the public, a few colleges, and motels. GMP pays the cost to put the station in the ground, while the host pays the cost to run electrical service from the panel to the EVSE. The host pays a monthly fee to GMP (typically $69 for dual port). PEV owners sign up for an EVgo network membership and GMP collects fees from PEV owners for charging. These fees are used to pay the host site back for electricity consumed by the EVSE. For sites where charging is free, the host fee is less. Challenges can exist when the individual who wants to place a charger is not the property owner; typically, the agreement is with the parking lot owner. In these cases, GMP educates the site owners and works with them to include the property owner. GMP offers incentives for stations with connected solar, with four grants having been awarded (i.e., $13K each). Also, three Community Energy and Efficiency Development Fundp grants are offered to specific downtown sites for installation of DCFC. GMP’s goal is to put in 20 more Level 2 EVSE stations in 2016 and fill in DCFC availability.
6.7.2 Burlington Electric Department
Burlington Electric Department’s (BED’s) Energy Service Department focuses on efficiency, clean energy, and reducing peak load. EVSE fit naturally into BED’s mission, with public access being a major driver. BED maintains a total of six EVSE recharging stations on the street and in parking garages. There are four Level 2 EVSE sites (principally dual port); one also includes Level 1 EVSE, and two DCFC. Placed in March 2014, the Level 1 and Level 2 EVSE are ChargePoint (i.e., networked), while the DCFC are Fuji (25 kW), which were placed in March 2014. The cost for each ChargePoint Level 2 EVSE (dual port, including maintenance plan) was $7,000 to $8,000 for the equipment plus $7,000 for installation. BED covered the cost of the equipment and installation out of their capital budget with funding assistance
p http://www.greenmountainpower.com/innovative/ceed_fund/
22
from the state’s downtown grant program. The cost for the Fuji DCFC equipment was covered by grant money from Nissan. All Level 2 EVSE and DCFC were free for users until July 2015; however, both now charge $0.17 per kWh. There is a “kick-off fee” of $1 dollar per hour after 4 hours to discourage all day parking. BED is working directly with the University of Vermont, Champlain College, and the Parks and Recreation department to site new installations. There have not been any major challenges to siting the EVSE.
6.7.3 Washington Electric Co-Op
Washington Electric Co-Op (WEC) aims to determine if EVSE are viable in a low-density, rural market by acquiring and analyzing EVSE usage data. The WEC Director of Products and Services selected the site locations to target with five publically accessible EVSE installed around the end of 2015. All stations are owned by the host sites who decide what to charge users. Venues include a park and ride lot, a retail cheese making company, a garage in Montpelier, and two schools. WEC charges standard electric tariff rates to WEC members that host sites. The cost for the sites is being covered by a $147,000 grant from VLITE, which included equipment purchase cost and installation. The host’s lease on the ChargePoint EVSE and service contract is cost-free for 5 years. There is no special PEV electricity rate, which would require separate metering that may drive up installation costs. There were no significant difficulties placing EVSE, although a lesson learned was that every installation is different. For example, one school board’s initial reaction was to discuss the need for a policy on usage, but WEC received approval to proceed with installation before this was completed as the school board told the superintendent to proceed on their behalf. For the other larger school, it has been much more difficult due to multiple decision makers and politics. Additional items of note include issues with cellular data coverage, which can be a major issue in Vermont. Cell coverage is needed to provide EVSE networking capabilities to process fee transactions and provide status information. WEC has found even when cellular signal strength is measured and tested in the siting process, it can be misinterpreted and/or insufficient once the EVSE is placed. Cell strength away from the highway is hit or miss and, at times, additional equipment was needed to amplify the signal. Another item of note is that property transfer often takes a long time. WEC still has a portion of the VLITE grant funds remaining, with potentially more EVSE stations to be placed in 2016.
6.7.4 Stowe Electric
A principal driver behind Stowe Electric’s desire to install EVSE is to leverage Stowe as a PEV tourist site and for EVSE to be more pervasive. Stowe Electric wants to provide services outside of traditional electricity requirements and establish a reputation as an energy conscious, forward thinking utility. Stowe has funded and placed three dual-port Level 2 ChargePoint (networked) EVSE, all with public access. All are commercial properties, with two installed in the winter of 2013 at the base of the ski mountain resort (see Figure 15) and village center and one in July 2015 at a brewery. From the beginning, there has been a tariff to charge at the sites (i.e., $1.93 hook-up fee, $0.48 per hour for the first 4 hours of charging, and $0.96 cents per hour thereafter). Usage has ebbed and flowed, with a lot of charging from tourists. There have been no significant challenges to placement of EVSE other than in the main village, where it is very crowded and difficult to reserve parking for EVSE. The opposite problem exists on the mountain because there is no centralized area and EVSE need to be kept free of snow and ice. Some ski areas in other parts of the state are providing PEV charging through valet parking services as a result of these issues. Stowe Electric is looking to install eight more dual-port Level 2 ChargePoint EVSE in 2016, utilizing VLITE funding for 75% of the equipment cost, with the hosts providing 25% of the equipment cost, which is usually around $2K for each dual-port station. Stowe Electric is providing labor and materials to install and run electrical service for the EVSE. In response to the Act 56 Renewable Energy Standard Tier 3 requirements passed in 2015, Stowe may provide incentives for PEV ownership in the future, such as rebates for vehicles and EVSE.

23
Figure 15. ChargePoint Level 2 EVSE in Stowe.
6.8 Incentives and Grants Incentives and grants have played a significant role in the success of PEVs and EVSE in Vermont and
can emanate from a variety of sources. In the absence of official state incentives for PEV purchases and limited state funding for DEV, VEIC, and other DEV partners have developed smaller “bite size” projects (i.e., $10,000 to $100,000) for DEV programs and incentives. For example, 5 to 10 ride and drives, electrician training, PEV or EVSE incentive packages, and social media outreach. The following is an example listing of past, current, and possible future grants and incentives in support of DEV:
Vermont Multi-Agency Grants: There have been a series of grants to the DEV Program for stakeholder coalition development, outreach activities/events, website development, and social media outreach. The listing of program costs in the earlier DEV section of the report provides some detail on the costs of the various activities undertaken with this support.
Chittenden County Regional Planning Commission: As the designated Metropolitan Planning Organization for the Burlington, Vermont urbanized area, CCRPC has adopted regional transportation and climate action plans which include support for PEVs. CCRPC program funding has underwritten the development of EVSE installation guidebook materials as well as PEV outreach and education programs in the region.
John Merck Foundation: Similar to the multi-agency grants above, DEV applied for and received funding from the John Merck Foundation three times and has used these grants to fund a variety of programmatic activities. Foundations require a long lead time, conduct thorough due diligence before making awards, and have been very helpful in augmenting state funding.
VLITE: VLITE provided funding for the PEV dealer and incentive program, which provided consumers with $500 off the purchase or lease of PEVs, with dealers receiving $200 for each

24
incentive submission. The total budget was $130K, of which $100K was spent on training and incentives and the remaining $30K focused on event outreach and program administrative costs. Another round of funding of $280K has just been received from VLITE to re-launch an expanded incentive program later in 2016, with higher incentive amounts ($1,000 consumer for battery size greater than 18 kWh, $750 for smaller batteries, and $275 for dealer for larger battery and $250 for dealer for smaller battery).
VLITE EVSE Grants: As described above, VLITE provided funds to develop PEV charging infrastructure through two distinct programs. The first in Stowe developed a partnership between the municipal electric department and local businesses to install eight charging stations for customers and the general public. The second worked with WEC to build out charging infrastructure at workplaces and other suitable locations in a more rural community.
Vermont Agency of Commerce and Community Development – Downtown EVSE Grants: There were two prior rounds of funding to support EVSE installations in state-designated downtowns before the most recent application period closed on October 31, 2015. The earlier rounds supported $258K in charging installations at 16 locations, with the state providing approximately $170K (i.e., 66%) of the total. Some matching funds came from Nissan to support two CHAdeMO DCFCs in Burlington and Winooski.
GMP Downtown DCFC: This is a GMP/VEIC/Agency of Commerce and Community Development partnership through GMP’s Community Energy and Efficiency Development Fund. The Community Energy and Efficiency Development fund provided support for public DCFC with $40K per station potentially available to designated downtowns. Three communities have committed to participation: Bennington (under construction), Brattleboro (planned spring 2016), and St. Albans (planned for summer 2016).
GMP: Provided incentives for four solar charging stations (up to $40K per station) in 2015. The solar charging stations are net metered solar photovoltaic paired with Level 2 EVSE.
Vermont Clean Cities/Vermont Public Service Department: Provides incentives for workplace charging (i.e., $525 to $1,575 depending on charger type) to offset the cost of EVSE and installation (http://vtccc.w3.uvm.edu/wp-content/uploads/2015/10/VTCCC-Workplace-EVSE-Terms-and-ConditionsMOD2.pdf).
Vermont Comprehensive Energy Plan Update: The plan is now available and includes a recommendation for PEV incentives; however, at this point, there are no immediate sources of funding to support the state-sponsored incentive; therefore, implementation is uncertain (https://outside.vermont.gov/sov/webservices/Shared%20Documents/2016CEP_Final.pdf).
Non-financial incentives have not been identified in Vermont; there are no high occupancy vehicle lanes or toll facilities on Vermont highways and no communities have experimented with free parking or other non-monetary incentives to date.
6.9 Outreach and Education In short, the focus of DEV outreach and education is the Consumer Decision Journeyq of Awareness,
Purchasing, and Advocacy. This includes raising overall public awareness, getting early adopters on board with new PEV models, and starting a transition to “early majority” consumers. Other important philosophies underpinning successful outreach and education are Community Building, Leading by Example, and Public Policy development. It is important to accurately, responsively, and in a user-friendly fashion inform people about PEVs and charging infrastructure, including applicability for different types of users, costs, maintenance, and operations. It is difficult to establish metrics for outreach
q http://www.mckinsey.com/business-functions/marketing-and-sales/our-insights/the-consumer-decision-journey.

25
and education, but DEV has been invited to return to many events and venues for presentations. In the near future, DEV will be conducting a second survey of Vermonters’ attitudes and awareness of PEVs to measure the results of marketing efforts to-date and reexamine key barriers and motivators to PEV adoption identified in the first surveyr. DEV has made progress on the long-term goal of moving beyond PEV awareness to purchasing and advocacy.
In 2012, DEV conducted a Kick-Off PEV Demo Event with policy makers and the general public. A ride and drive was organized and included auto dealers, EVSE suppliers, legislators, local marquee companies (such as Ben and Jerry’s Ice Cream), and other stakeholders. Plug-in America has extensive resources on conducting ride and drives that are very useful in maximizing efficient planning for these events, which often entail significant effort and eventually seem to reach a point of diminishing payback once a geographic area has been reached in a given time period. Figure 16 illustrates a PEV demo in Burlington, Vermont in September 2013.
Figure 16. PEV demonstration in Burlington.
Key to improving consumer awareness and acceptance of PEVs is creating high visibility and marketing through implementation of events, website development, and social media. It is also important to link with national efforts (such as the U.S. DOE EV Everywhere Workplace Charging Challenge) and regional initiatives (including Section 177 state efforts). DEV’s outreach and education has focused on website development, ride and drives, videos, press releases, news articles, radio shows, a PEV charging installation guide, social media such as blog posts, meet the owner events, and creating partnerships with stakeholders to extend public outreach. One-stop shopping for PEV-related information and real world data is especially important. Here, interested stakeholders can learn about particular topics. It is very helpful to cultivate a PEV champion in the press, with a strong focus on state and area specifics because Vermonters indicate a preference for materials and outreach which recognize unique issues in Vermont. Starting in 2015, DEV initiated development and implementation of a summer outreach and education campaign to support increased awareness of PEVs in Vermont. This campaign utilized familiar “road sign” graphical elements; developed two videos featured on the DEV website, social media, and cable access stations; and internet banner advertisements purchased through a media buy. One video featured
r http://www.veic.org/resource-library/a-survey-of-electric-vehicle-awareness-preferences-in-vermont

26
Olympic snowboarder Ross Powers driving a PHEV in Vermont winter conditions and the other featured an animated introduction to PEV technology. Late 2015 and early 2016 activities include a planned renewal of the consumer/dealer PEV incentive program and ongoing stakeholder engagement.
In September 2015, the Vermont Clean Cities Coalition, Vermont Agency of Natural Resources, Northeast States for Coordinated Air Use Management, VEIC, and GMP cooperatively organized and conducted “DRIVE THE DREAM VERMONT,” a major media event with Governor Peter Shumlin, other state representatives, auto dealers, and 21 companies. This initiative was modeled after a program launched by the California Plug-in Vehicle Collaboratives in 2013. Initial organizational activities focused on reaching out to major Vermont employers to take 1 of 3 steps by September 16, 2016: (1) install EVSE at their company, (2) institute a PEV incentive program for employees, or (3) company purchases of PEVs for fleet use. This event was held during National Drive Electric Weekt and started with a morning discussion convening corporate leaders and the governor followed by a public ride and drive event in the evening (see Figure 17). Vermont Teddy Bear, a local participant company, hosted the event. Meeting sustainability goals and providing incentives for employees were the two principal reasons companies were interested in participating, with 19 ultimately choosing workplace charging and three pledging to provide incentives. Creating an event where businesses get recognition and media attention is an excellent way to promote workplace charging. Company chief executive officers sign a commitment, which is an important step, because it ensures follow through.
Figure 17. Drive the Dream Vermont ride and drive.
6.10 Vermont Clean Cities Coalition The Vermont Clean Cities Coalition supports all PEV activity in Vermont and provides technical
assistance, education and outreach, and incentives for EVSE installation. They also participate on the DEV outreach and education committee. Vermont Clean Cities currently has funding specifically for workplace charging installations and a variety of stakeholders are supported. Targeting charging to definitive audiences (e.g., workplaces) has been especially fruitful because U.S. DOE statistics suggest company employees with access to workplace charging are 20 times more likely to purchase a PEV than s http://www.pevcollaborative.org/DRIVETHEDREAM2015. t http://driveelectricweek.org/.

27
employees lacking this access. Vermont Clean Cities works with a variety of employers, including colleges, hospitals, municipalities, nonprofits, and small businesses. They are currently offering an incentive program to help offset the cost of station purchase and installation by $525 to $1,575 (depending on charger type) through April 15, 2016. This is a Vermont Public Service Department-funded program, with future incentives to be determined. Clean Cities provides technical assistance and support whether workplaces participate in the incentive program or not. As elsewhere, Vermont workplace charging is currently relatively limited, but will be essential to long-term success. Vermont Clean Cities recommends starting small and simple and progressing from there. Vermont Clean Cities also promotes the use of PEVs through general outreach in presentations, newsletters, through the website, social media, and other communication channels.
Vermont Clean Cities has been directly involved with an effort to support PEV charging at UVM from its initiation. The critical factors that drove UVM’s interest in EVSE were increased awareness and interest on campus from staff and visitors, as well as organizational goals for “net zero” energy programs powering energy needs from renewable sources. In December 2015, two Level 1 EVSE and a Level 2 EVSE dual port were installed and opened to the public. Employees of UVM pay for charging through a parking permit purchase. UVM plans on using an existing “pay-by-cell” option or some form of parking meters for all other public users. In 2016, UVM plans on adding four additional EVSE with two dual-port Level 2 EVSE early in the year with two more following by the end of year. During the second phase, UVM is targeting two additional dual-port Level 2 EVSE, covering a total of four spaces, and installing Level 1 EVSE in commuter lots (i.e., four spaces). During Phase 3, UVM is hoping to collaborate with a regional hospital facility to install either Level 2 or Level 1 EVSE. Additionally, UVM is working on a UVM car share; there are no fully electric PEVs in UVM’s fleet besides GEM vehicles. UVM staff currently own 10 to 12 PEVs.
7. EXTRAPOLATION: SMALL TO MIDSIZE TOWNS NATIONALLY The DEV Program commenced in 2012 and has proven successful in expanding the acceptance and
utilization of PEVs in a rural, cold weather environment. Based on the activities and results of the DEV Program, the following are recommendations and approximate costs to consider for those who endeavor to expand the presence of PEVs and charging infrastructure in small to mid-size communities in other States.
State and Local Policy: When commencing activities, a good strategy is to initially focus on energy, regional, and comprehensive plans to lay a foundation for PEVs and why they should be supported at the state and local levels. Identify and target the support of high-level state officials.
Central Hub and Point of Contact: Recognizing the cross-cutting nature of PEVs, it is important to establish a central hub that serves as an umbrella over all PEV-related activities in a state and to be the single point-of-contact for technical support and information.
Early and Broad Stakeholder Involvement: Multiple stakeholders should be targeted and involved from the beginning of a PEV program to maximize support, participation, ownership, and breadth of communication distribution channels.
Establish Tracking Mechanisms: Establish robust measures for tracking PEV sales and EVSE installations to gauge program progress and encourage enthusiasm.
Auto Dealers: Work with auto dealers to ensure they are aware of PEV options and charging infrastructure and partner as much as possible to support their sales, including development of innovative incentive programs.
EVSE Charging Infrastructure: Develop charging infrastructure for PEVs, understanding it may initially require government and/or utility rate payer support given the current low profitability potential.

28
Incentives: Aggressively pursue incentives and grants through a variety of sources (e.g., state, utilities, settlement funds, and foundations) to build program infrastructure and support the purchase of PEVs and installation of EVSE.
Outreach and Education: Develop website information, social media, advertising, and events. Maximize leveraging of existing events (e.g., National Drive Electric Week) to reduce logistical costs.
Clean Cities: Coordinate with and leverage the resources of state/local Clean Cities Coalitions to augment technical assistance, stakeholder identification and participation, consumer education and outreach, and incentives with a strong focus on workplace charging.
Cultural and Climatic Factors: Be cognizant of state and local cultural and climatic factors that may positively or negatively impact acceptance of PEVs and establishment of recharging infrastructure.
There has been a rapid progression of PEV and charging technology and increased general PEV awareness of over the last several years. PEVs are becoming more mainstream, there are fewer barriers, and there is no reason to start from scratch when implementing a PEV program. Currently, there are more and better PEV vehicles, including the advent of affordable 200-mile all electric range vehicles due to arrive in late 2016, with broad national availability anticipated soon thereafter. It is likely that DCFC (both CHAdeMO and the Society of Automotive Engineers Combo) will increase in importance with the increased availability of and affordability of these long-distance PEVs. At outreach events, people have moved from not knowing about PEV technologies to now arriving in order to experience PEVs as part of a strong consideration of actually purchasing one.
Based on the DEV Program, the following is the estimated financial investment of implementing a PEV program of similar scope:
Baseline costs for stakeholder convening and initial website development ($50K)
Initial costs for installation guides, building codes updates, and website customization ($50K)
Recurring costs for technical assistance, installation guides, building codes updates, workplace charging advocacy, dealer outreach, marketing, events, and media campaigns ($125K/year).
While these resource levels are based on experience with DEV, it is important to recognize there are lower-cost options, for example using existing resources to establish a strong foundation such as a stakeholder organizing process that can be expanded as more support becomes available. Leveraging existing resources to the extent possible (such as referencing existing PEV charging installation guides, with any minor changes for local conditions) can be very helpful in spreading limited resources for maximum effect.
The timeline for implementing a PEV program in other states similar to DEV could be expected to proceed at a similar or faster pace. This results from a greater current knowledge base, ability to leverage a broader range of existing resources, and, generally, much broader PEV availability and consumer awareness than 3 to 4 years ago. However, the significantly lower price of gasoline and generally reduced availability of state funding to support PEV and EVSE implementation could act as a dampening effect on the current uptake of PEVs and EVSE in communities.

29
APPENDICES
Appendix A
Plug-In Electric Vehicle and Electric Vehicle Supply Equipment Questionnaires
Energetics Incorporated and the Vermont Energy Investment Corporation developed questionnaires for PEV owners/leasers/enthusiasts and EVSE site owners. These questions examined a number of areas, including identifying the primary awareness and interest mechanisms for PEVs in Vermont and the critical factors that ultimately influence the purchase of PEVs or installation of EVSE. These questions were distributed to over 1,000 PEV owners/leasers/enthusiasts and over 80 EVSE site operators; 71 and 23 responses were received, respectively. As shown in Figures A-1 and A-2, there are a number of mechanisms through which Vermonters become aware of and find interest in PEVs and EVSE. The principal communication channels were news (i.e., TV, internet, and publications), work, and family members and friends. For EVSE, electric utilities were also especially influential.
Figure A-1. Mechanisms that create awareness of and interest in PEVs.

30
Figure A-2. Mechanisms that create awareness of and interest in EVSE.
Figures A-3 and A-4 illustrate the principal reasons Vermonters decided to purchase or lease a PEV, including environmental benefits, save on gasoline, or energy independence. A surprisingly high percentage was also compelled to pair their PEV with renewable energy sources and also consider vehicle performance relatively important.
Figure A-3. Principal reasons to purchase a PEV.
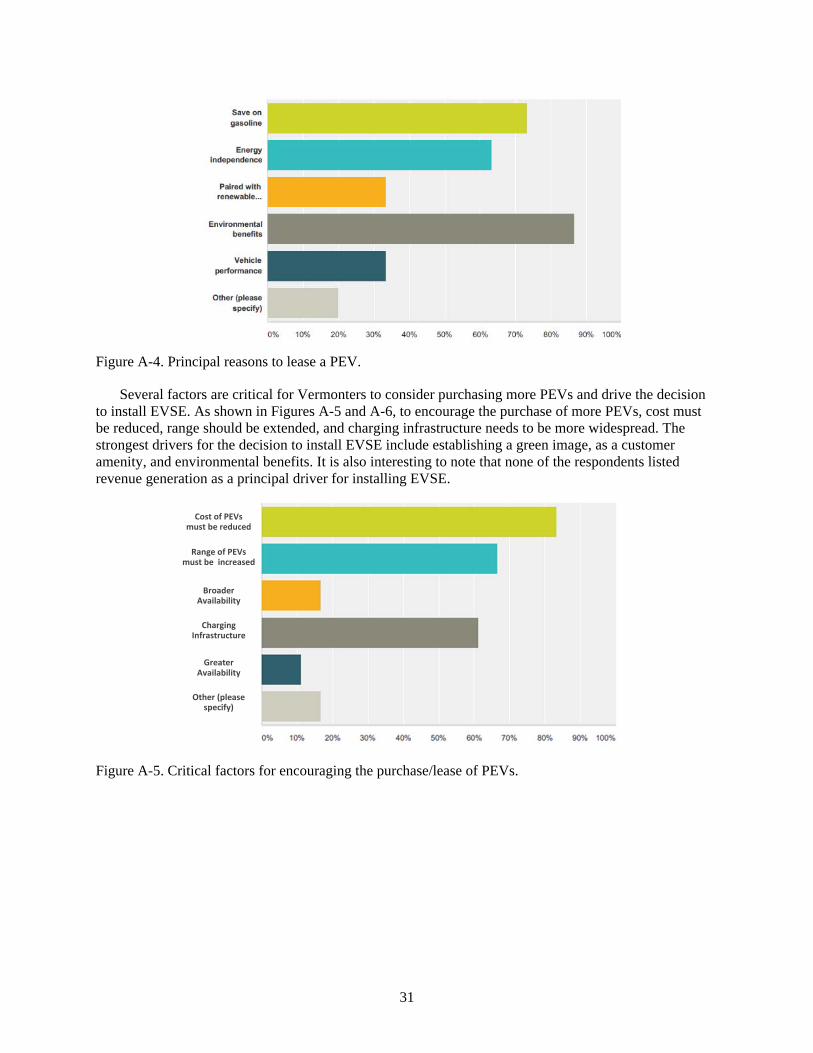
31
Figure A-4. Principal reasons to lease a PEV.
Several factors are critical for Vermonters to consider purchasing more PEVs and drive the decision to install EVSE. As shown in Figures A-5 and A-6, to encourage the purchase of more PEVs, cost must be reduced, range should be extended, and charging infrastructure needs to be more widespread. The strongest drivers for the decision to install EVSE include establishing a green image, as a customer amenity, and environmental benefits. It is also interesting to note that none of the respondents listed revenue generation as a principal driver for installing EVSE.
Figure A-5. Critical factors for encouraging the purchase/lease of PEVs.
Cost of PEVs must be reduced
Range of PEVs must be increased
Broader Availability
Charging Infrastructure
Greater Availability
Other (please specify)

32
Figure A-6. Critical factors for installing EVSE.
Additional results from the questions indicate that the majority of the respondents who drive PEVs lease them (i.e., 65%) and of the remaining respondents who own their PEV purchased them new (i.e., 75%). Most PEV owners (i.e., 75%) own pre-2013 PEVs (i.e., 2011 to 2013), while those who lease PEVs are far more likely to have newer vehicles (i.e., 75% with 2014 to 2015 PEVs). Most respondents were fairly (but not strongly) satisfied with the dealership salesforce, the vehicle delivery process, and the overall dealer experience; those being very satisfied with their vehicles would recommend them to family and friends.
Respondents indicated they charged their vehicles predominantly at home (i.e., 72%), followed by workplace (i.e., 30%), and, finally, public charging (i.e., 11%). The figures do not add up to 100% because the questionnaire averages the data responses. Nonetheless, the high workplace charging numbers are especially interesting given the currently relatively low availability of recharging infrastructure at employers in Vermont. Of those questioned, 55% did not install an EVSE at home, but simply used a standard 120-V wall outlet instead. Two-thirds of who did install an EVSE at home installed Level 2 EVSE, with the remaining one-third installing a dedicated Level 1 EVSE. There was no clear trend of a preferred EVSE manufacturer. The respondents indicated there were no particularly remarkable or common threads to the challenges to EVSE siting and installation, just well-known issues, including distances from the electrical panel, zoning, management buy-in, and so forth. Overall, EVSE site owners were very satisfied with the reliability of the equipment, the installation process, and the cost of operating the charging stations; however, many (i.e., approximately 40%) were not satisfied with the amount of usage.
Other interesting results of the questionnaire are that nearly 35% of respondents have a photovoltaic system installed at home and over 60% of them sized their photovoltaic systems to accommodate the increased electricity usage for PEV charging. The average respondent is 48 years old, with over 50% of the respondents being over 50 years old. The majority (i.e., 65%) was male; 56% have a household income of over $100K per year; and 75% have high educational levels (i.e., bachelors or post-graduate degree).

33
Appendix B
Case Study Methodology The following five data streams of information were used to frame and inform the case study analysis
of the DEV Program:
DEV: The DEV Program that was spearheaded by the Vermont Energy Investment Corporation supplied extensive information in support of the development of this case study. Some notable aspects include programmatic details on the DEV Program, provision of extensive stakeholder contact lists, breakdown of PEV per capita sales (by state and county), information retrieval from other Vermont entities, coordination of the team trip to visit Vermont stakeholders, assistance with survey development and provision of stakeholder delivery mechanisms, review of draft reports, and recommendations for the future.
Vermont PEV Registrations and EVSE Installations: The acquisition of PEV registration data for 2012 through 2015 was obtained from the Vermont Agency of Natural Resources and utilized to assess sales progression and market penetration. Recharging infrastructure (i.e., EVSE) information was obtained through several sources, including the Clean Cities Alternative Fuels Data Center; DEV; interviews with utilities, EVSE manufacturers, and network providers; and an EVSE site operator survey. This information was used to assess various factors, including EVSE market penetration, usage factors, and pricing to recharge.
Vermont Stakeholder Trip: The Idaho National Laboratory/Energetics/DEV team met and conducted mini facilitations with 16 stakeholders from Vermont state agencies, Northeast States for Coordinated Air Use Management, and non-governmental organizations in Burlington and Montpelier on November 12, 2015. Comprehensive notes and best practice feedback forms on DEV were obtained from each stakeholder and subsequently compiled and analyzed.
Stakeholder Phone Interviews: Phone interviews were conducted with 13 additional DEV stakeholders representing Vermont Clean Cities, Vermont Agency of Natural Resources, utilities (i.e., Green Mountain Power, Burlington Electric Department, Washington Electric Coop, and Stowe Electric), EVSE manufacturers service providers (i.e., ChargePoint and NRG EVgo), auto dealerships (i.e., Shearer Chevrolet, Lamoille Valley Ford, and Automaster Mercedes), Vermont Vehicle and Automotive Distributors Association, UVM, and a participant in the DOE EV Workplace Challenge (i.e., World Learning).
PEV and EVSE Site Operator Questions: Questions were developed for PEV owners/leasers/enthusiasts and EVSE site operators. These questions looked to assess a number of issues such as the primary mechanisms that created awareness for stakeholders of the opportunities that PEVs afford, what piqued their interest, and the critical factors that ultimately convinced them to purchase/lease a PEV and/or install EVSE. These questions were distributed to over 1,000 PEV owners/leasers/enthusiasts and over 80 EVSE site operators; 71 and 23 responses were received, respectively.