drilling project cores from the north philippine … · drilling project cores from the north...
TRANSCRIPT
13. PETROGRAPHIC AND GEOCHEMICAL PROPERTIES OF TEPHRAS IN DEEP SEADRILLING PROJECT CORES FROM THE NORTH PHILIPPINE SEA
Toshio Furuta, Ocean Research Institute, University of Tokyo,and
Fusao Arai, Department of Geology, Gunma University, Maebashi, Japan
ABSTRACTRefractive index and chemical composition were determined for
glass shards contained in more than 100 tephra layers in DSDP Leg58 sediment cores collected in the Shikoku Basin, North PhilippineSea. The refractive index is consistent with chemical composition.Refractive index and total iron show a linear relationship. Tephra inPleistocene and Pliocene sediments is mostly rhyolitic and dacitic(non-alkali), whereas tephra in the Miocene shows wide compositionvariations in the eastern part of the basin. Basaltic tephra is recogniz-ed in Miocene sediments at Sites 443 and 444, but not at Site 442,west of the other two sites. This indicates that the basaltic tephracame from eruption relatively close to those drill sites (perhaps theKinan Seamounts and the Shichito-Iwo Jima volcanic arc), althoughthe exact source has not been identified.
INTRODUCTION
Recent mineralogical and chronological studies ofdeep-sea tephra layers in DSDP and piston cores haveenabled us to consider the geological and geophysicalproblems related to volcanism in and around island arcsand oceanic islands.
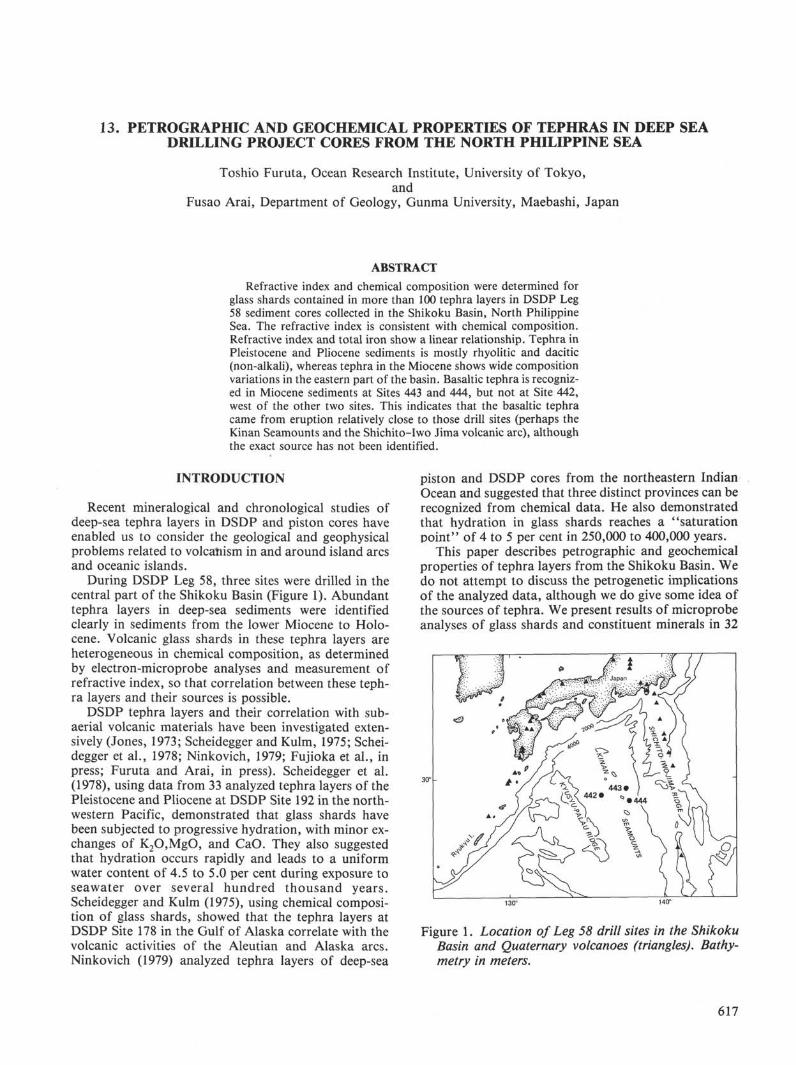
During DSDP Leg 58, three sites were drilled in thecentral part of the Shikoku Basin (Figure 1). Abundanttephra layers in deep-sea sediments were identifiedclearly in sediments from the lower Miocene to Holo-cene. Volcanic glass shards in these tephra layers areheterogeneous in chemical composition, as determinedby electron-microprobe analyses and measurement ofrefractive index, so that correlation between these teph-ra layers and their sources is possible.
DSDP tephra layers and their correlation with sub-aerial volcanic materials have been investigated exten-sively (Jones, 1973; Scheidegger and Kulm, 1975; Schei-degger et al., 1978; Ninkovich, 1979; Fujioka et al., inpress; Furuta and Arai, in press). Scheidegger et al.(1978), using data from 33 analyzed tephra layers of thePleistocene and Pliocene at DSDP Site 192 in the north-western Pacific, demonstrated that glass shards havebeen subjected to progressive hydration, with minor ex-changes of K2O,MgO, and CaO. They also suggestedthat hydration occurs rapidly and leads to a uniformwater content of 4.5 to 5.0 per cent during exposure toseawater over several hundred thousand years.Scheidegger and Kulm (1975), using chemical composi-tion of glass shards, showed that the tephra layers atDSDP Site 178 in the Gulf of Alaska correlate with thevolcanic activities of the Aleutian and Alaska arcs.Ninkovich (1979) analyzed tephra layers of deep-sea
piston and DSDP cores from the northeastern IndianOcean and suggested that three distinct provinces can berecognized from chemical data. He also demonstratedthat hydration in glass shards reaches a "saturationpoint" of 4 to 5 per cent in 250,000 to 400,000 years.
This paper describes petrographic and geochemicalproperties of tephra layers from the Shikoku Basin. Wedo not attempt to discuss the petrogenetic implicationsof the analyzed data, although we do give some idea ofthe sources of tephra. We present results of microprobeanalyses of glass shards and constituent minerals in 32
Figure 1. Location of Leg 58 drill sites in the ShikokuBasin and Quaternary volcanoes (triangles). Bathy-metry in meters.
617

T. FURUTA, F. ARAI
tephra layers from the early Miocene to Holocene andmeasurements of refractive index of glass shards in alltephra layers.
It is worth emphasizing that at two sites (443 and444), tephra of basaltic composition was recovered fromMiocene sediments. Tephra found so far in DSDP coreshas been mostly rhyolitic to andesitic; it is seldom thatbasaltic tephra, such as in the Shikoku Basin, has beenrecognized. Therefore, examination of these tephra lay-ers is of great interest from the viewpoint of the sedi-mentary environments and tectonic developments of theShikoku Basin.
Twenty-three tephra layers of late-Eocene to Holo-cene age were also sampled at Site 445, at the crest of theDaito Ridge. However, only petrographic characters arepresented (Appendix, this chapter), because theirfeatures have not been examined in detail.
PETROGRAPHIC FEATURESTephra layers in deep-sea sediments of the Shikoku
Basin range from early-Miocene to Holocene in age.Twenty layers from Site 442 (Holes 442A and 442B), 30layers from Site 443, and 60 layers from Site 444 (Holes444 and 444A) were investigated. Table 1 shows thenumbers of tephra layers from the three sites. Techni-ques used for preparation of tephra samples for refrac-tive index and chemical analysis are the same as describ-ed by Furuta and Arai (in press).
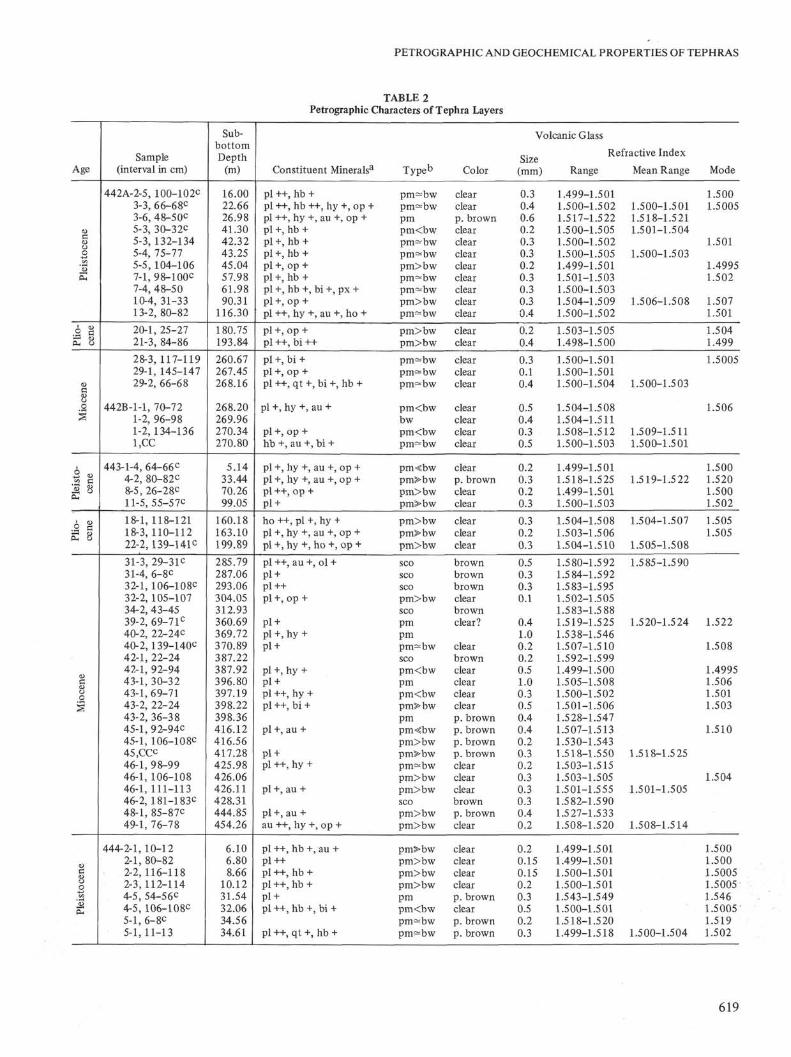
Refractive indexes of tephra layers are shown inTable 2 and Figure 2. Volcanic glass shards are classi-fied as pumice, bubble-wall, and scoria types by theirshapes. Plate 1 illustrates typical examples.
At Site 442, refractive indexes of glass shards inearly-Miocene to Holocene tephra layers range from1.498 to 1.512. The glass is colorless, with the exceptionof one layer at 442-3-6, 48-50 cm. Glass shards fromthis site are pumice and (or) bubble-wall type (Table 2).The refractive index for the layer at 442-3-6, 48-50 cm issomewhat higher than that of shards from other layers,with values from 1.518 to 1.521.
At Site 443, approximately 100 km east of Site 442,refractive indexes of glass shards show a wide range,from 1.499 to 1.599. Basaltic tephra predominates inlate-Miocene sediments. Glass shards at this site arepumice and (or) bubble-wall and scoria types. The firstand second types have relatively low refractive indexes,while the third has high indexes. Glass shards with rela-tively low refractive indexes are colorless, and thosewith high indexes are brown. At Site 444, 70 km south-
TABLE 1Numbers of Tephra Layers Cored at
the Shikoku Basin Sites
Age
Pleistocene
Pliocene
Miocene
Total
Site 442
11
2
7
20
Site 443
4
3
23
30
Site 444
12
13
35
60
east of Site 443, petrographic features and refractive in-dexes of glass shards appear to be similar to those forSite 443 tephra layers.
At this site, the highest refractive indexes, 1.600 to1.610, are found at 444A-10-1, 92-94 cm. Refractive in-dex and color of glass shards seem to be controlled bythe abundance of transition metals (FeO, TiO2, MnO,etc.).
CHEMICAL COMPOSITION OFVOLCANIC GLASS
Five samples from the Site 442 tephra layers, 16 fromSite 443, and 11 from Site 444 were chemically analyzedby electron microprobe. The results are shown in Table3. SiO2 content ranges from 47 to 74 per cent, corre-sponding to compositions from basalt to rhyolite.A12O3 content varies from 11 to 16 per cent, values con-sistent with those reported for normal volcanic rockswith the same SiO2 contents. FeO (total iron as FeO)varies from 0.9 to 13 per cent. This variation is mainlyresponsible for the changes in refractive index of glassshards. MgO content also varies considerably and is in-versely related to SiO2 content. CaO, Na2O, and K2Ocontents vary considerably. Such variation in CaO andalkalis can be explained by magmatic differentiation, aswell as by hydration of glasses after deposition. In par-ticular, the alkali contents are likely to vary significantlyas a result of hydration (Aramaki and Lipman, 1965;Aramaki and Haramura, 1966; Jezek and Noble, 1978).
In order to test whether the analyzed glass shards be-long to alkali or non-alkali rock series, total alkalis areplotted against SiO2 (Figure 3) (Kuno, 1965). In this dia-gram, data were recalculated on a water-free basis.Most values from Pleistocene and Pliocene glass shardsare fitted to the non-alkali rock series (Figure 3a), butdata from Miocene glass shards are scattered (Figure3b). Miocene glass shards from three tephra layers atSite 444 with low SiO2 contents, and three from Site 443with high SiO2 contents, belong to the alkali rock series.This suggests that two different types of volcanic activi-ty occurred during the same time in the Shikoku Basinor adjacent areas.
In the upper Miocene, different rock series, alkalicand non-alkalic, are represented by the deep-sea tephralayers. Figure 3 shows that the compositions of glassshards from different sites are well clustered. Suchsimilarity of chemical composition is very useful forcorrelation of tephra layers.
Data from each tephra layer are plotted in an AFMdiagram in Figure 4. This diagram indicates the frac-tionation evidenced by glass-shard compositions. TheMiocene tephra layers show patterns of high iron con-centration, typical of the tholeiitic fractional crystalliza-tion trends, with three exceptions (Figure 4b); these arefrom Miocene tephra layers at Site 444 and belong to thealkali rock series. These samples have a high alkali con-tent (4-5%), in spite of an SiO2 content lower than 50per cent and are very similar to typical alkali olivinebasalt. From Figures 3 and 4, it is inferred that tephralayers from the Shikoku Basin originated from at leasttwo different volcanic activities.
618
PETROGRAPHIC AND GEOCHEMICAL PROPERTIES OF TEPHRAS
TABLE 2Petrographic Characters of Tephra Layers
Age
<DC<D
O
àCH O
<D
8oS
is toto Cs 8
A <",2 G‰ o
CD
oo
dCD
oois
t
Sample(interval in cm)
442A-2-5, 100-102C3-3, 66-68c
3-6, 48-50^5-3, 30-32C5-3,132-1345-4, 75-775-5,104-1067-1, 98-100C7-4, 48-5010-4, 31-3313-2,80-82
20-1, 25-2721-3, 84-86
28-3, 117-11929-1, 145-14729-2, 66-68
442B-1-1, 70-721-2, 96-981-2,134-1361,CC
443-1-4, 64-66 c
4-2, 80-82C8-5, 26-2 8 c
11-5, 55-57C
18-1, 118-12118-3, 110-11222-2,139-141^
31-3, 29-31^31-4, 6-8C32-1, 106-108C32-2, 105-10734-2, 43-4539-2, 69-7 l c
40-2, 22-24C40-2,139-140c
42-1, 22-2442-1, 92-9443-1, 30-3243-1, 69-7143-2, 22-2443-2,36-3845-1,92-94^45-1, 106-108c
45,CCc46-1, 98-9946-1, 106-10846-1, 111-11346-2, 181-183C
48-1, 85-87C49-1, 76-78
444-2-1, 10-122-1, 80-822-2,116-1182-3,112-1144-5, 54-5 6 c
4-5, 106-108c
5-1, 6-8^5-1,11-13
Sub-
bottomDepth
(m)
16.0022.6626.9841.3042.3243.2545.0457.9861.9890.31
116.30
180.75193.84
260.67267.45268.16
268.20269.96270.34270.80
5.1433.4470.2699.05
160.18163.10199.89
285.79287.06293.06304.05312.93360.69369.72370.89387.22387.92396.80397.19398.22398.36416.12416.56417.28425.98426.06426.11428.31444.85454.26
6.106.808.66
10.1231.5432.0634.5634.61
Constituent Mineralsa
pi ++, hb +pi ++, hb ++, hy +, op +pi ++, hy +, au +, op +pi +, hb +pi +, hb +pi +, hb +pi +, op +pi +, hb +pi +, hb +, bi +, px +pi +, op +pi ++, hy +, au +, ho +
pi +, op +pi ++, bi ++
pi +, bi +pi +, op +pi ++, qt +, bi +, hb +
pi +, hy +, au +
pi +, op +hb +, au +, bi +
pi +, hy +, au +, op +pi +, hy +, au +, op +pi ++, op +pl +
ho ++, pi +, hy +pi +, hy +, au +, op +pi +, hy +, ho +, op +
pi ++, au +, ol +pl +pl++pi +, op +
pl +pl +, hy +pl +
pi +, hy +pl +pi ++, hy +pi ++, bi +
pi +, au +
pl +pi ++, hy +
pi +, au +
pi +, au +au ++, hy +, op +
pi ++, hb +, au +pl++pi ++, hb +pi ++, hb +pl +pi ++, hb +, bi +
pi ++, qt +, hb +
Type*5
pm-bwpm—bwpmpm<bwpm-bwpm—bwpm>bwpm-bwpm-bwpm>bwpm~bw
pm>bwpm>bw
pm-bwpm-bwpm—bw
pm<bwbwpm<bwpm bw
pm<bwpm>bwpm>bwpm>bw
pm>bwpm>bwpm>bw
SCO
SCO
SCO
pm>bwSCO
pmpmpm—bwSCO
pm<bwpmpm<bwpm>bwpmpm<bwpm>bwpm>bwpm—bwpm>bwpm>bwSCO
pm>bwpm>bw
pm>bwpm>bwpm>bwpm>bwpmpm<bwpm^bwpm—bw
Color
clearclearp. brownclearclearclearclearclearclearclearclear
clearclear
clearclearclear
clearclearclearclear
clearp. brownclearclear
clearclearclear
brownbrownbrownclearbrownclear?
clearbrownclearclearclearclearp. brownp. brownp. brownp. brownclearclearclearbrownp. brownclear
clearclearclearclearp. brownclearp. brownp. brown
Volcanic Glass
Size(mm)
0.30.40.60.20.30.30.20.30.30.30.4
0.20.4
0.30.10.4
0.50.40.30.5
0.20.30.20.3
0.30.20.3
0.50.30.30.1
0.41.00.20.20.51.00.30.50.40.40.20.30.20.30.30.30.40.2
0.20.150.150.20.30.50.20.3
Refractive Index
Range
1.499-1.5011.500-1.5021.517-1.5221.500-1.5051.500-1.5021.500-1.5051.499-1.5011.501-1.5031.500-1.5031.504-1.5091.500-1.502
1.503-1.5051.498-1.500
1.500-1.5011.500-1.5011.500-1.504
1.504-1.5081.504-1.5111.508-1.5121.500-1.503
1.499-1.5011.518-1.5251.499-1.5011.500-1.503
1.504-1.5081.503-1.5061.504-1.510
1.580-1.5921.5 84-1.5921.583-1.5951.502-1.5051.583-1.5 881.519-1.5251.538-1.5461.507-1.5101.592-1.5991.499-1.5001.505-1.5081.500-1.5021.501-1.5061.528-1.5471.507-1.5131.530-1.5431.518-1.5501.503-1.5151.503-1.5051.501-1.5551.582-1.5901.527-1.5331.508-1.520
1.499-1.5011.499-1.5011.500-1.5011.500-1.5011.543-1.5491.500-1.5011.518-1.5201.499-1.518
Mean Range
1.500-1.5011.518-1.5211.501-1.504
1.500-1.503
1.506-1.508
1.500-1.503
1.509-1.5111.500-1.501
1.519-1.522
1.504-1.507
1.505-1.508
1.585-1.590
1.520-1.524
1.518-1.5 25
1.501-1.505
1.508-1.514
1.500-1.504
Mode
1.5001.5005
1.501
1.49951.502
1.5071.501
1.5041.499
1.5005
1.506
1.5001.5201.5001.502
1.5051.505
1.522
1.508
1.49951.5061.5011.503
1.510
1.504
1.5001.5001.50051.50051.5461.50051.5191.502
619

T. FURUTA, F. ARAI
Age
ene
uo
8
ilio
ce
Sample(interval in cm)
444-5-4, 34-365-5, 14-165-5, 53-556-1, 18-20
444-7-2, 19-217-2, 111-1137-3, 57-597-3, 139-1417-4, 145-1477-5, 80-827-6,17-199-1, 125-127C10,CC
444A-1-1, 137-1391-3, 10-121-3, 38-401-5, 44-46
2-2, 72-74
2-2,115-117
2-3, 36-38
8-1, 98-100
9-1, 115-1179-2, 7-99-2, 38-409-2, 82-849-2,112-114C9-3, 70-729-4, 17-199-4, 41-439-4, 86-889-5, 5-710-1, 92-94C10-2,0-2
10-2, 30-32
10-2, 114-116
10-2, 130-13211-2,68-7011-3, 83-85
12-1,59-61
12-1, 119-121C12-2, 45-47 c13-2, 0-2C13-3, 74-76c
14-1,50-5214-2, 30-3214-4, 40-4215-1,20-2215-1,97-9915-2, 77-7922-1, 82-84c22-5,36-3822-5, 58-60
Sub-bottomDepth
(m)
39.3440.6441.0342.18
55.1956.1157.0757.8959.4560.3061.1773.7582.00
83.3785.1085.3888.44
93.72
94.15
94.86
149.48
159.15159.57159.88160.32160.62161.70162.67162.91163.36164.05168.42169.00
169.30
170.14
170.30179.18180.83
187.09
187.69188.45197.50199.74206.00207.30210.40215.20215.97217.27282.32287.86288.08
TABLE
Constituent Mineralsa
pi ++, op +pi ++, hb +, hy +pi ++, hb +pi ++, hy +
pl +pi ++, hb +pi ++, hb +pi ++, hy +, hb +pl +pi +, hy +pi ++, hy +, au +pi ++, hy +, au +, hb +pl.++, hy, au, op, ol, hb +
pi ++, op +, bi +pl +pl +pl +
pl+, op +
pi +, hy +, au +
pl +
pi ++, hy +, au +, op +
pi +, au +pi +, hy +pi +,au +pi ++, bi, au, hb +pi ++, au +, hy +pi ++, au +pl+++pi ++,au +pi ++, au +pi ++, hy +pi ++,au +pi ++, au +
pl+++
pi++,au +
pi ++, hy +ρl ++, hy +ρl ++ au +
pi ++, hy +, au +
pi ++, hy +
ρl ++, au +pi ++, au +pi ++, au +
pi +, au +
pi ++, hy +, au +pi ++, au +pl++pi ++, bi +pi ++,au +
2 - Continued
Typeb
pm-bwpm>bwpm>bwpm—bw
pm>bwpm>bwpm>bwpm>bwpm>bwpm>bwpmpm>bwpm
pm>bwpm>bwpm>bwpm>bw
pm—bw
pm>bw
pm>bw
pm~bw
SCO
SCO
SCO
pm~bw
SCO
SCO
SCO
SCO
SCO
SCO
pm
pm
pm
pmpm>bwpm>bw
SCO
SCO
SCO
pm>bwpm>bwpm>bwpm>bwpm>bwpm>bwpm>bwpm~bwpm>bw
Color
clearclearclearclear
clearclearclearclearclearclearp. brownclear
clearp. brownclearclear
clear
clearp. brownclear
clearp. brownbrownbrownp. brownclearbrownp. brownbrownbrownbrownbrownbrownp. brown
p. brownclearp. brownto clearp. brownclearp. brown
clear tobrownbrownp. brownbrownbrownp. brownp. brownclearclearclearclearp. brownclearclear
Volcanic Glass
Size(mm)
0.80.70.20.2
0.30.40.20.30.10.130.20.4
0.20.10.20.25
0.45
0.5
0.2
0.4
0.11.50.70.30.50.30.7
0.30.30.20.1
1.0
0.8
1.00.250.4
0.1
0.70.40.20.30.30.40.20.40.30.40.40.30.3
Refractive Index
Range
1.500-1.5011.500-1.5011.499-1.5011.508-1.513
1.505-1.5091.506-1.5081.506-1.5081.506-1.5091.506-1.5091.506-1.5091.523-1.5301.501-1.5051.510-1.520
1.500-1.5351.502-1.5531.505-1.5511.505-1.510
1.505-1.509
1.505-1.509
1.501-1.504
1.506-1.510
1.583-1.5901.585-1.5901.552-1.5831.500-1.5251.528-1.5781.528-1.5951.510-1.5901.508-1.5771.507-1.5731.540-1.5851.580-1.6151.525-1.532
1.523-1.531
1.510-1.550
1.520-1.5301.509-1.5141.508-1.522
1.508-1.590
1.584-1.5891.584-1.5881.531-1.5831.575-1.5901.526-1.5351.519-1.5301.508-1.5121.507-1.5101.507-1.5101.506-1.5121.537-1.5391.497-1.5001.499-1.502
Mean Range
1.525-1.5281.502-1.504
1.505-1.5151.515-1.5351.510-1.535
1.502-1.504
1.5 85-1.589
1.500-1.510
1.585-1.590
1.520-1.570
1.5 70-1.5801.600-1.610
1.515-1.535
1.510-1.5121.509-1.514
1.578-1.583
1.527-1.5311.520-1.524
1.507-1.510
1.500-1.501
Mode
1.50051.50051.5001.511
1.5081.5071.5071.5081.5081.508
1.507
1.507
1.507
1.503
1.507
1.577
1.528
1.528
1.511
1.5871.586
1.5281.5231.5101.5081.5091.5091.5381.4981.5005
pi = plagioclase, au = augite, hy = hypersthene, hb = hornblende, bi = biotite, ol = olivine, op = opaque minerals, +++ = very abundant,++ = abundant, + = common.
^pm = pumice type, bw = bubble-wall type, sco = scoria type.'Chemical analysis in Table 3.
620

Site 442 Site 443
Q
100-
-
200-
-
300-
ocen
eP
leis
tP
lioce
neM
ioce
neRefractive Index
1.500 1.520
«P=
*
•
-mk-
1.5 1.500Refractive Index
1.520 1.540 1.560
Site 444
1.580 1.600
Legend
• mean rangemode
100-
€ 200 H
aE
300-
400-
100-
200-
300-
Plei
stc
lioce
ne |
Mio
cene
1.500
•i
•
\
t _
Refractive Index1.520 1.540 1.560
»-
H
—••-
t- - —
-
1.580
Figure 2. Refractive index of volcanic glass shards.
ONto

T. FURUTA, F. ARAI
TABLE 3Chemical Composition of Volcanic Glass, Sites 442, 443, and 444
Com-ponent
Siθ2A12O3
Tiθ2FeO*MnOMgOCaONa2θK 2 O
Total
Refractiveindex
Com-ponent
SiO2
AI2O3T1O2FeO*MnOMgOCaONa2θK2O
Total
Refractiveindex
Com-ponent
Siθ2AI2O3Tiθ2FeO*MnOMgOCaONa2OK2O
Total
Refractiveindex
442A-2-5,100-104
71.7511.640.070.900.030.171.193.662.86
92.26
1.499-1.501
443-31-4,6-8
54.2314.39
1.0712.850.214.169.742.190.25
99.09
1.584-1.592
444-4-5,106-108
73.9511.690.180.880.060.191.283.712.79
94.73
1.500-1.501
442A-3-3,66-68
73.4511.510.120.870.050.151.213.722.19
93.99
1.500-1.501
443-32-1,106-108
52.9513.59
1.0312.91
0.245.609.562.240.27
98.08
1.583-1.595
444-5-1,6-8
71.0412.260.583.150.180.602.743.691.91
96.15
1.518-1.520
442A-3-6,48-50
70.8613.260.633.250.170.632.533.741.74
96.81
1.518-1.521
443-39-2,69-71
69.4011.96
0.613.800.120.783.373.300.99
94.33
1.520-1.524
444-7-6,17-19
70.8911.980.371.410.040.341.333.493.21
93.06
1.525-1.528
442A-5-3,30-34
72.7011.450.201.040.060.231.212.872.86
92.62
1.501-1.504
443-40-2,22-24
60.1915.09
0.936.170.171.504.624.241.17
94.80
1.538-1.546
444A-9-2,112-114
47.7415.36
1.827.580.226.23
11.093.411.59
95.04
1.577-1.580
Sample (interval in cm)
442A-7-1,98-100
73.3911.390.220.920.050.150.993.154.23
94.49
1.501-1.503
443-1-4,64-66
74.7311.170.240.900.040.171.053.643.27
94.85
1.499-1.501
443-4-2,80-82
72.2012.50
0.453.160.130.542.733.661.88
97.25
1.519-1.522
Sample (interval in cm)
443-40-2,139-140
73.3411.01
0.321.920.050.292.073.191.00
93.19
1.507-1.512
443-45-1,92-94
73.6411.22
0.362.290.060.352.483.531.16
95.09
1.507-1.512
443^5-1,106-108
70.6312.33
0.161.780.050.030.554.164.89
94.58
1.530-1.543
Sample (interval in cm)
444A-10-1,92-94
51.0012.44
1.1013.05
0.354.44
10.481.910.26
94.83
1.600-1.610
444A-12-1.119-121
46.8116.00
1.637.890.207.36
11.232.981.30
95.40
1.584-1.589
443-8-5,26-28
77.2711.610.130.750.070.150.873.683.19
97.72
1.499-1.501
443-45,CC
67.8513.960.523.130.100.522.065.152.91
95.72
1.518-1.525
443-11-5,55-57
74.8212.350.101.400.050.040.913.624.25
97.54
1.500-1.503
443-46-2,81-83
56.5913.16
1.3513.630.273.458.792.360.39
97.69
1.582-1.592
443-22-2,139-141
74.1012.290.151.660.030.131.304.082.72
96.46
1.505-1.508
443-48-1,85-87
72.2112.89
0.754.150.180.914.144.020.74
95.20
1.527-1.533
443-31-3,29-31
54.1114.13
0.9612.290.254.408.922.310.27
97.64
1.585-1.590
444-4-5,54-56
60.5014.55
1.097.490.232.155.714.060.76
96.54
1.543-1.549
, 444A-12-2, 444A-13-2, 444A-13-3, 444A-22-1,45-47
47.7915.78
1.678.080.197.67
11.102.811.25
96.34
1.584-1.588
0-2
55.4713.16
0.8911.89
0.272.547.942.110.35
94.62
1.578-1.583
74-76
56.1914.21
0.9310.61
0.213.239.832.540.43
98.18
1.575-1.590
82-84
62.2013.46
0.955.230.131.243.643.533.31
93.69
1.537-1.539
*Total iron as FeO.
RELATIONSHIP BETWEEN REFRACTIVE INDEXAND CHEMICAL COMPOSITION OF GLASS
SHARDS
According to Williams et al. (1955), SiO2 content ofglass from artificial fusion of volcanic rocks and that ofnatural glass can be estimated from the refractive index-es. Recently, many investigators have reported the rela-tionship between refractive index and SiO2 content: it iswell known that as SiO2 content increases, refractive in-dex decreases, although the relationship between thetwo parameters has not been established in detail yet.
In Figure 5, the mean ranges of refractive indexesfrom individual tephra layers (the range within which 80
per cent of the measurements fall) are plotted againstaverage SiO2 content. The correlation between refrac-tive index and SiO2 content is consistent, as a whole,with the trend given by Williams et al. (1955). In Figure6, the mean ranges of refractive indexes are plottedagainst the mean of total iron content of glass shards.The relation between refractive index and FeO contentis quite linear. Because the refractivity of the transition-metal oxides is higher than that of SiO2 and other ox-ides, the refractive index seems to be affected primarilyby the content of the transition-metal oxides, such asFeO, TiO2, and MnO. In volcanic glass shards, FeO (orFe2O3) predominates over the other transition-metal ox-ides, so that the refractive index of volcanic glass shards
622

PETROGRAPHIC AND GEOCHEMICAL PROPERTIES OF TEPHRAS
8 -
50 60 70 80
SiO.
50 60 70 80
SiO.
Figure 3. Total alkalis-SiO2 relation for glass shards oftephra layers from the Shikoku Basin. A. Pleistoceneand Pliocene tephra layers. B. Miocene tephra layers.The two lines mark the general boundaries betweenthe fields of the tholeiitic series, the high-aluminaseries, and the alkali series (Kuno, 1965).
can be determined by the content of the iron oxidesalone.
The refractivity of ferric oxide is about 1.6 timesgreater than that of ferrous oxide, so that as ferric-oxideincreases over ferrous oxide, the refractive index ofglass shards increases. In Figure 6, some of the plotteddata are off the general trend. In these exceptional sam-ples, the ferric-iron content may be much higher than inglass which plots on the trend, because the total alka-Ii-Siθ2 relation of these samples show that they belongto the alkali rock series.
INTERPRETATIONS
On the basis of petrographic characteristics, chemicalcomposition, and paleontological age, the tephra layers
from the Shikoku Basin are divided into the followinggroups: (1) non-alkali rhyolitic tephra layers in thePleistocene and Pliocene at Sites 442, 443, and 444; (2)non-alkali rhyolitic tephra layers in the Miocene at Site444; (3) non-alkali tholeiitic basalt tephra layers in theMiocene at Sites 443 and 444; (4) alkali rhyolitic tephralayers in the Miocene at Site 443; and (5) alkali basaltictephra layers in the Miocene at Site 444.
It is clear that most Pleistocene and Pliocene tephralayers originated from non-alkali volcanism, whereasMiocene tephra layers originated from two different, si-multaneous volcanic activities, as described below.
Hydration of Glass Shards
Hydration of volcanic glass shards has been discussedby many investigators (Aramaki and Lipman, 1965; Ara-maki and Haramura, 1966; Jezek and Noble, 1978; Schei-degger et al., 1978; Ninkovich, 1979). Glass shards indeep-sea tephra layers are commonly subjected to hy-dration after deposition (Scheidegger et al., 1978; Nin-kovich, 1979). In this study, glass shards of tephra lay-ers from three sites seem to be hydrated, but visible al-teration or hydrated rims of glass shards cannot be de-tected by optical observation. Electron-microprobe an-alysis of glass shards shows that most shards with thechemical composition of rhyolite and basalt are homo-geneous from rim to core. In a few samples, shards areinhomogeneous: Na2O and K2O increase slightly fromrim to core. In the present work, we omitted these sam-ples.
Relation Between Refractive Index and Some Oxides
As shown by Williams et al. (1955), there is a closecorrelation between refractive index and SiO2 content involcanic glass shards. This relation is summarized asfollows: (1) with a SiO2 content of 72 to 73 per cent, therefractive index is about 1.50; (2) as the SiO2 content de-creases, the refractive index increases proportionately,but the trend is slightly curved at SiO2 contents between55 and 65 per cent. The same correlation between re-fractive index and SiO2 content of glass shards is estab-lished for deep-sea tephras in the Shikoku Basin.
The correlation between refractive index and totaliron oxide is shown in Figure 6. This linear relationshipis better than that between refractive index and SiO2
content.The refractive index of volcanic glass shards primari-
ly depends upon the contents of transition-metal oxides,because the refractivity of transition-metal oxides ishigher than that of SiO2 and other chief constituent ox-ides (Larsen and Berman, 1943). Because the predomi-nant constituent of transition-metal oxides is usuallyiron oxide, refractive index of glass shards is closely cor-related to total iron. Although TiO2 has the highest re-fractivity among the transition-metal oxides in glass, itscontent is considerably smaller than that of iron oxide.In Figure 6, some data plot off the trend of correlation.The TiO2 content in these glass shards is larger than thatin glass shards with a normal refractive index. If the to-tal content of transition metal oxides in glass is plotted
623

T. FURUTA, F. ARAI
Figure 4. AFM (total iron-total alkali—MgO) diagram, showing the fractionationtrend from basaltic to rhyolitic glass shards of tephra layers from the ShikokuBasin. Symbols as in Figure 3.
1.600 -
~ 1.550 -
1.500 -
Figure 5. Relationship between refractive index andSiO2 content of volcanic glass shards. Horizontalbars denote the ranges of SiO2 content, and verticalbars denote the mean ranges of refractive index. Dataare recalculated on a water-free basis.
against the refractive index, the correlation will be bet-ter. Another cause of this deviation seems to be therelatively large amount of ferric iron.
Origins of the Deep-Sea Tephra Layers
As noted, it is clear that the tephra layers from thecentral part of the Shikoku Basin have been derived
1.600
3C
= 1.550
1.500
-
-
-
-
- • • • • • i
/
4rt
i
/
/
• /
-
-
-
10 15FeO (%)
Figure 6. Relationship between refractive index andtotal iron oxide content. Horizontal bars denote theranges of total iron oxide contents, and vertical barsdenote the mean ranges of refractive index. Data arerecalculated on a water-free basis.
from different volcanic sources with different rock se-ries. Most of the Pleistocene and Pliocene tephra layersin this region are rhyolitic to dacitic (non-alkali series).These tephra layers presumably are ejecta produced byrelatively large-scale eruptions in an island arc andtransported toward the east: the grain size of shards in awell-correlated late-Pleistocene layer (442A-3-6, 48-50
624

PETROGRAPHIC AND GEOCHEMICAL PROPERTIES OF TEPHRAS
cm; 443-4-3, 80-82 cm; 444-5-1, 6-8 cm) is greater in thewesternmost site (442) than at the two eastern sites (443and 444).
In contrast, the Miocene tephra layers are from rhyo-litic to basaltic and belong to both the non-alkali and al-kali rock series. In these tephras, the grain size of basal-tic glass shards is usually greater than that of rhyoliticshards. This implies that sources of basaltic tephra werecloser to the drilling sites than those of rhyolitic and an-desitic tephra. Moreover, it is well known that the erup-tion columns of basaltic volcanoes are much smallerthan those of felsic volcanoes, and the altitude attainedby the ejecta is much lower. This results in much shorterdistances of transport for basaltic ash falls, as comparedwith felsic ash falls. Therefore, the source of these ba-saltic tephra layers is assumed to have been close to thedrilling sites.
A pillow basalt was dredged from one of the sea-mounts of the Kinan seamount chain in the central partof the Shikoku Basin; it was identified as tholeiitic ba-salt of late-Miocene age (Tokuyama and Fujioka, 1976).Petrographic study of basement basalts from the Shiko-ku Basin DSDP sites indicates that most are abyssal tho-leiite, but a few sills belong to the alkali series (Dick etal., this volume). Tephra with high total alkali may befrom such alkali volcanism. Another possible source isthe Izu-Shichito-Iwo Jima volcanic arc, east of thedrilling sites, although its history is not well understood.The activity of this arc probably ranges from the earlyMiocene to the Holocene (Kaneoka et al., 1970).
ACKNOWLEDGMENTS
We are very grateful to S. Aramaki, K. Kobayashi, and K.Fujioka for valuable suggestions and critical reading of themanuscript.
REFERENCES
Aramaki, S., and Lipman, P., 1965. Possible leaching ofNajO during hydration of volcanic glasses. Proc. Jap.Acad., 41, 467-470.
Aramaki, S., and Haramura, H., 1966. Leaching of N a ^ fromvolcanic glasses during hydration—an experimental study.J. Geol. Soc. Japan, 72, 69-73.
Fujioka, K., Furuta, T., and Arai, F., in press. Petrographyand geochemistry of volcanic glass of Leg 57. In vonHuene, R., Nasu, N., et al., Init. Repts. DSDP, 56,57, Pt.2: Washington (U.S. Govt. Printing Office).
Furuta, T., and Arai, F., in press. Petrographic properties oftephras in DSDP core from Leg 56. In Langseth, M., Oka-da, H., et al., Init. Repts. DSDP, 56, 57, Pt. 2: Washington(U.S. Govt. Printing Office).
Jezek, P. A., and Noble, D. C , 1978. Natural hydration andion exchanges of obsidian: an electron microprobe study.Am. Mineral., 63, 266-273.
Jones, E. J. W., 1973. Volcanic glass in abyssal clayssampled at DSDP Leg 20 Drilling site, Northwest Pacific.In Heezen, B., MacGregor, I., et al., Init. Repts. DSDP,20: Washington (U.S. Govt. Printing Office), pp. 389-416.
Kaneoka, I., Ishiki, N., and Zashu, S., 1970. K-Ar ages ofthe Izu-Bonin islands. Geochem. J., 4, 53-60.
Kuno, H., 1965. Fractionation trend of basalt magmas inlava flows. /. Petrol., 6, 302-321.
Larsen, E. R., and Berman, H., 1943. The microscopic de-termination of the nonopaque minerals. Bull. U.S. Geol.Surv., 843, 30-32.
Ninkovich, D., 1979. Distribution, age and chemical com-position of tephra layers in deep-sea sediments off westernIndonesia. J. Volcanol. Geotherm. Res., 5, 67-86.
Sheidegger, K. F., and Kulm, L. D., 1975. Late Cenozoicvolcanism in the Aleutian Arcs: information from ash lay-ers in the northeastern Gulf of Alaska. Geol. Soc. Am.Bull., 86, 1407-1412.
Sheidegger, K. F., Jezek, P. A., and Ninkovich, D., 1978.Chemical and optical studies of glass shards in Pleistoceneand Pliocene ash layers from DSDP Site 192, northwesternPacific Ocean. /. Volcanol. Geotherm. Res., 4, 99-116.
Tokuyama, H., and Fujioka, K., 1976. The petrologic studyon basalt from Kinan Seamount and DSDP Site 54. Mar.ScL, 8, 184-191.
Williams, H., Turner, F. J., and Gilbert, C. M., 1955. Petrog-raphy-an Introduction to the Study of Rocks in Thin Sec-tions: San Francisco (Freeman).
625

T. FURUTA, F. ARAI
APPENDIXPetrographic Characteristics, Site 445 Tephra Layersa
Sample(interval in cm)
445-1-5, 33-352-3, 48-503-3,114-1168-4, 59-6110-5,90-92
12-3,31-3312-4, 105-107
13-4, 118-120
23-2,53-5523-3,9-11
26-1, 99-10132-2, 61-6346-2, 7-855-6, 30-32
56-2, 144-146
57-7, 40-42
62-1,110-112
62-2, 89-9064-4,92-9364-4,114-115
64-6, 76-7764-6, 78-7966-4, 144-146
Sub-bottomDepth
(m)
6.3311.9822.1470.5991.40
106.81109.05
118.68
210.03211.09
237.49295.61428.07518.30
524.44
540.40
579.60
580.89602.92603.14
605.76605.78622.44
Constituent Minerals
pl +pl ++, hy +, au +, hb +, op +
pi ++, hy +, au +, op +
pi ++, hb +, hy +, op +pi ++, hb ++, au +, op +
pi +, op +
bi ++, pi +pi +, hb +
pi ++, bi ++, hy +, op +pi ++, hy +, au +, op +pi ++, hy +, au +, op +pi ++, op +
pi ++, hy +, au +
pi ++, bi ++, hy +
pl++
pi ++, au +pl +pl +
pi ++, au +, op +pi ++, au ++, op +pi ++, hy +, au +, op +
Type
pm<bwpm<bwbwbwpm>bw
pm>bwpm>bw
pm>bw
pm>bwpmpm>bwpm<bwpmpm
pm>bw
pm>bw
pm>bw
pmpm>bwpm
pm bwpm<bwpm>bw
Color
clearclearclearclearp. brown
clearclearclear top. brownclearclear
clearp. brownp. brownp. brownclear top. brownclearclear top. brownclearp. brownp. brown
p. brownp. brownclear
Volcanic Glass
Size(mm)
0.20.40.40.20.5
0.10.1
0.2
0.10.1
0.20.30.10.2
0.2
0.5
0.1
0.10.20.1
0.20.50.1
Refractive Index
Range
1.500-1.5121.502-1.5031.500-1.5041.501-1.5121.505-1.540
1.508-1.5121.503-1.509
1.515-1.550
1.501-1.5031.504-1.505
1.499-1.5011.506-1.5211.522-1.5281.520-1.540
1.512-1.514
1.501-1.503
1.504-1.506
1.508-1.5151.518-1.5211.517-1.558
1.509-1.5111.509-1.5121.507-1.510
Mean Range
1.509-1.511
1.518-1.530
1.503-1.505
1.515-1.530
1.506-1.5081.523-1.525
1.508-1.511
1.525-1.540
Mode
1.502
1.5001.507
1.513
1.502
1.505
1.520
1.5101.5111.508
Symbols as in Table 2.
PLATE 1
Figure 1 442-A-3-6, 48-50 cm. Glasses are almost pumice type. Refractive index = 1.517to 1.522.
Figure 2 443-1-4, 64-66 cm. Glasses are bubble-wall type. Refractive index = 1.499 to1.501.
Figure 3 443-11-5, 55-57 cm. Clean pumice-type glasses are predominant in this sam-ple. Refractive index ranges from 1.500 to 1.503.
Figure 4 443-31-4, 6-8 cm. Glasses are brown scoria type. Refractive index = 1.584 to1.592. Dark-brown devitrified glasses have numerous inclusions.
Figure 5 443-45-1, 92-94 cm. Glasses are clear bubble-wall type. Refractive index = 1.507to 1.513.
Figure 6 443-46-2, 81-83 cm. Glasses are brown scoria type and have acicular crystal-lites. Refractive index = 1.582 to 1.589.
Figure 7 444A-12-1, 119-121 cm. Glasses are flake-shaped brown shards. Refractive in-dex = 1.584 to 1.588.
Figure 8 Closeup of shard with crystallites from sample shown in Figure 7. This glassshard includes many crystallites, including scopulite and globulite.
626

PETROGRAPHIC AND GEOCHEMICAL PROPERTIES OF TEPHRAS
PLATE 1
1OθAim
627