dreyfus appreciation fund, inc. - bny mellon · renee laroche-morris president the dreyfus...
TRANSCRIPT
Dreyfus Appreciation Fund, Inc.
ANNUAL REPORT December 31, 2017
Save time. Save paper. View your next shareholder report onlineas soon as it’s available. Log into www.dreyfus.com and sign upfor Dreyfus eCommunications. It’s simple and only takes a fewminutes.
The views expressed in this report reflect those of the portfolio manager(s) only through the end of the period covered and do notnecessarily represent the views of Dreyfus or any other person in theDreyfus organization. Any such views are subject to change at anytime based upon market or other conditions and Dreyfus disclaims any responsibility to update such views. These views may not berelied on as investment advice and, because investment decisions fora Dreyfus fund are based on numerous factors, may not be relied onas an indication of trading intent on behalf of any Dreyfus fund.
Not FDIC-Insured • Not Bank-Guaranteed • May Lose Value
Contents T H E F U N D
A Letter from the President of Dreyfus 2 Discussion of Fund Performance 3 Fund Performance 5 Understanding Your Fund’s Expenses 7 Comparing Your Fund’s Expenses With Those of Other Funds 7 Statement of Investments 8 Statement of Investments in Affiliated Issuers 11 Statement of Assets and Liabilities 12 Statement of Operations 13 Statement of Changes in Net Assets 14 Financial Highlights 16 Notes to Financial Statements 19 Report of Independent Registered Public Accounting Firm 27 Important Tax Information 28 Information About the Renewal of the Fund’s Investment Advisory and Sub-Investment Advisory Agreements 29 Board Members Information 33 Officers of the Fund 35
F O R M O R E I N F O R M AT I O N
Back Cover
2
A LETTER FROM THE PRESIDENT OF DREYFUS
Dear Shareholder:
We are pleased to present this annual report for Dreyfus Appreciation Fund, Inc., covering the 12-month period from January 1, 2017 through December 31, 2017. For information about how the fund performed during the reporting period, as well as general market perspectives, we provide a Discussion of Fund Performance on the pages that follow.
Stocks set a series of new record highs and bonds produced modestly positive results during 2017. Financial markets early in the year were dominated by the inauguration of a new U.S. president, as equities and corporate-backed bonds surged higher in anticipation of more business-friendly regulatory, tax, and fiscal policies. U.S. and international stocks continued to rally in the spring as corporate earnings grew and global economic conditions improved. Later in the year, the passage of tax reform legislation fueled additional stock market gains.
Despite three short-term interest rate hikes and concerns early in the year that inflation might accelerate in a growing economy, bonds generally produced positive total returns in 2017. Corporate-backed securities and municipal bonds fared particularly well.
The markets’ strong performance last year was supported by solid underlying fundamentals, including sustained economic growth, a robust labor market, and low inflation. We currently expect these favorable conditions to persist in 2018, but we remain watchful for economic and political developments that could negatively impact the markets. As always, we encourage you to discuss the risks and opportunities of today’s investment environment with your financial advisor.
Thank you for your continued confidence and support.
Sincerely,
Renee Laroche-Morris President The Dreyfus Corporation January 16, 2018
Dreyfus Appreciation Fund, Inc. The Fund
DISCUSSION OF FUND PERFORMANCE
3
For the period from January 1, 2017 through December 31, 2017, as provided by portfolio manager Fayez Sarofim of Fayez Sarofim & Co., Sub-Investment Adviser
Market and Fund Performance Overview For the 12-month period ended December 31, 2017, Dreyfus Appreciation Fund, Inc.’s Investor shares produced a total return of 26.65%, its Class I shares returned 26.91%, and its Class Y shares returned 27.03%.1 In comparison, the S&P 500® Index (the “Index”), the fund’s benchmark, provided a total return of 21.82% for the same period.2
Stocks gained ground in 2017 amid better-than-expected corporate earnings and in anticipation of more stimulative U.S. government policies. Favorable stock selections in the information technology and health care sectors enabled the fund to outperform the Index.
The Fund’s Investment Approach The fund seeks long-term capital growth consistent with the preservation of capital. Its secondary goal is current income. To pursue these goals, the fund normally invests at least 80% of its net assets in common stocks. The fund focuses on blue-chip companies with total market capitalizations of more than $5 billion at the time of purchase, including multinational companies. These are established companies that have demonstrated sustained patterns of profitability, strong balance sheets, an expanding global presence, and the potential to achieve predictable, above-average earnings growth.
In choosing stocks, we identify economic sectors we believe will expand over the next three to five years or longer. Using fundamental analysis, we then seek companies within these sectors that have proven track records and dominant positions in their industries. The fund employs a “buy-and-hold” investment strategy, which generally has resulted in an annual portfolio turnover rate of below 15%. A low portfolio turnover rate helps reduce the fund’s trading costs and can help limit the distribution of capital gains generated due to portfolio turnover.3
Rising Corporate Earnings Drove Markets Higher U.S. equities enjoyed steady gains in 2017 as the economy expanded, corporate profits rebounded, and financial-market volatility waned, powering the Index to a series of all-time highs and a double-digit return for the year. The Federal Reserve Board’s tightening cycle gained traction while most other central banks continued to ease, and the value of the U.S. dollar declined relative to other major currencies. The softer dollar, coupled with strengthening global growth prospects, helped support the performance of many foreign equity markets as well as domestic companies with ample international sales exposure. The information technology sector proved to be the best-performing market segment in 2017, contributing almost 40% of the Index’s rise with strength concentrated in mega-cap companies. The telecommunication services and energy sectors were the only segments of the Index to post declines for the year.
Security Selections Drove Relative Performance The fund meaningfully outperformed the Index in 2017, supported by the overall impact of our stock selection strategy. The fund’s overweighted and selectively focused representation

DISCUSSION OF FUND PERFORMANCE (continued)
4
in the top-performing information technology sector was the most significant contributor to relative and absolute results. Correctly emphasized representation in the health care sector also added value compared to the Index. Positions in pharmaceutical developers AbbVie, Abbott Laboratories, and Novo Nordisk generated returns of more than 50% for the year. In the financials sector, the fund’s focus on capital markets, one of the sector’s better-performing segments, also was constructive. The largest contributors to the fund’s return for the year included Apple, Facebook, Microsoft, Philip Morris International, and Texas Instruments.
Factors that modestly constrained relative results during the year included an above-market allocation to the lagging energy sector. This impact, however, was tempered by an emphasis on the major integrated oils, which generally are less sensitive to crude oil prices than oilfield and equipment stocks. Another impediment to relative results was overweighted exposure to the consumer staples sector, though correct stock focus within the sector entirely offset the negative allocation effect, and the sector’s total relative impact on the fund’s performance was positive. The largest detractors from the fund’s returns in 2017 were Exxon Mobil, Occidental Petroleum, Walgreens Boots Alliance, Gilead Sciences, and Union Pacific.
Positioned for Continued Growth Although the current bull market is just three months shy of its ninth birthday, we believe that stocks enter 2018 with strong tailwinds, including improving global growth, strong corporate earnings, the impact of tax-reform legislation, and accommodative monetary policies among central banks. However, last year’s supportive combination of positive economic surprises and subdued volatility will be hard to replicate, and we expect market leadership to narrow as the economic cycle matures and as investors seek out fundamentally sound companies with risk-mitigating qualities. Our long-practiced investment approach focuses on such companies. The fund’s portfolio is composed of what we believe are high-quality, competitively advantaged businesses that have proven themselves capable of growing global market share and earnings across market cycles. With their solid balance sheets, ample financial resources, and disciplined capital allocation policies, these multinational industry leaders should be well positioned to build shareholder value even through periods of market fluctuations.
January 16, 2018 1 Total return includes reinvestment of dividends and any capital gains paid. Past performance is no guarantee of future results. Share
price and investment return fluctuate such that upon redemption, fund shares may be worth more or less than their original cost. 2 Source: Lipper Inc. — The S&P 500® Index is widely regarded as the best single gauge of large-cap U.S. equities. The index
includes 500 leading companies and captures approximately 80% coverage of available market capitalization. Investors cannot invest directly in any index.
3 Achieving tax efficiency is not a part of the fund’s investment objective, and there can be no guarantee that the fund will achieve any particular level of taxable distributions in future years. In periods when the manager has to sell significant amounts of securities (e.g., during periods of significant net redemptions or changes in index components), funds can be expected to be less tax efficient than during periods of more stable market conditions and asset flows.
Please note: the position in any security highlighted with italicized typeface was sold during the reporting period. Equities are subject generally to market, market sector, market liquidity, issuer, and investment style risks, among other factors, to varying degrees, all of which are more fully described in the fund’s prospectus.
FUND PERFORMANCE
5
6,000
9,400
12,800
16,200
19,600
23,000
1716151413121110090807
Years Ended 12/31
Dol
lars
$22,589
$19,765$19,525$19,470
Dreyfus Appreciation Fund, Inc. (Investor shares)
Dreyfus Appreciation Fund, Inc. (Class I shares)†††
Dreyfus Appreciation Fund, Inc. (Class Y shares)††
S&P 500® Index†
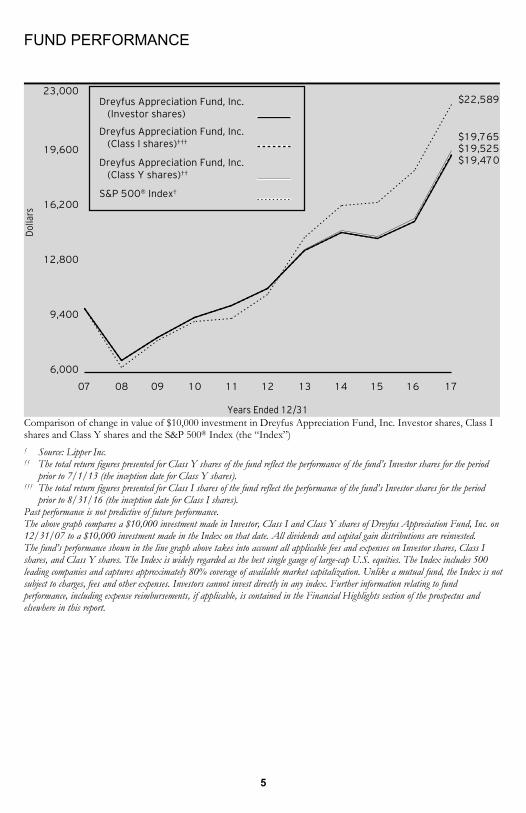
Comparison of change in value of $10,000 investment in Dreyfus Appreciation Fund, Inc. Investor shares, Class I shares and Class Y shares and the S&P 500® Index (the “Index”) † Source: Lipper Inc. †† The total return figures presented for Class Y shares of the fund reflect the performance of the fund’s Investor shares for the period
prior to 7/1/13 (the inception date for Class Y shares). ††† The total return figures presented for Class I shares of the fund reflect the performance of the fund’s Investor shares for the period
prior to 8/31/16 (the inception date for Class I shares). Past performance is not predictive of future performance. The above graph compares a $10,000 investment made in Investor, Class I and Class Y shares of Dreyfus Appreciation Fund, Inc. on 12/31/07 to a $10,000 investment made in the Index on that date. All dividends and capital gain distributions are reinvested. The fund’s performance shown in the line graph above takes into account all applicable fees and expenses on Investor shares, Class I shares, and Class Y shares. The Index is widely regarded as the best single gauge of large-cap U.S. equities. The Index includes 500 leading companies and captures approximately 80% coverage of available market capitalization. Unlike a mutual fund, the Index is not subject to charges, fees and other expenses. Investors cannot invest directly in any index. Further information relating to fund performance, including expense reimbursements, if applicable, is contained in the Financial Highlights section of the prospectus and elsewhere in this report.
FUND PERFORMANCE (continued)
6
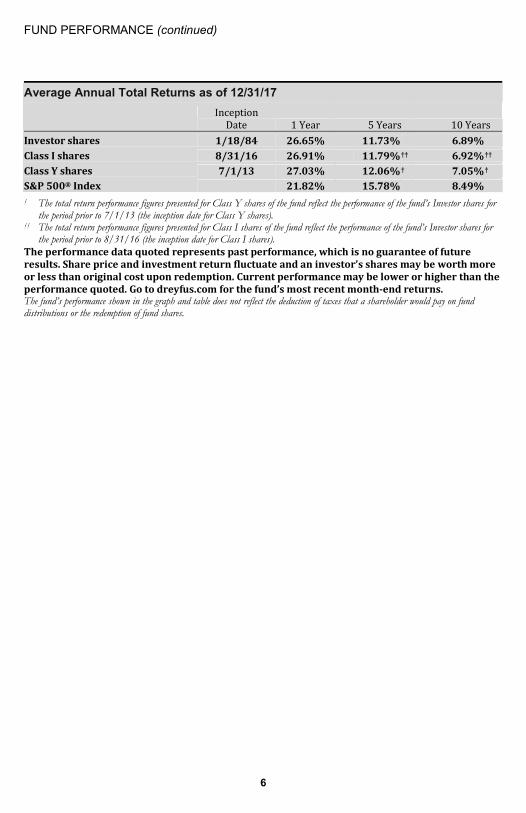
Average Annual Total Returns as of 12/31/17
Inception Date 1 Year 5 Years 10 Years
Investor shares 1/18/84 26.65% 11.73% 6.89% Class I shares 8/31/16 26.91% 11.79%†† 6.92%†† Class Y shares 7/1/13 27.03% 12.06%† 7.05%† S&P 500® Index 21.82% 15.78% 8.49% † The total return performance figures presented for Class Y shares of the fund reflect the performance of the fund’s Investor shares for
the period prior to 7/1/13 (the inception date for Class Y shares). †† The total return performance figures presented for Class I shares of the fund reflect the performance of the fund’s Investor shares for
the period prior to 8/31/16 (the inception date for Class I shares). The performance data quoted represents past performance, which is no guarantee of future results. Share price and investment return fluctuate and an investor’s shares may be worth more or less than original cost upon redemption. Current performance may be lower or higher than the performance quoted. Go to dreyfus.com for the fund’s most recent month-end returns. The fund’s performance shown in the graph and table does not reflect the deduction of taxes that a shareholder would pay on fund distributions or the redemption of fund shares.
UNDERSTANDING YOUR FUND’S EXPENSES (Unaudited)
7
As a mutual fund investor, you pay ongoing expenses, such as management fees and other expenses. Using the information below, you can estimate how these expenses affect your investment and compare them with the expenses of other funds. You also may pay one-time transaction expenses, including sales charges (loads) and redemption fees, which are not shown in this section and would have resulted in higher total expenses. For more information, see your fund’s prospectus or talk to your financial adviser.
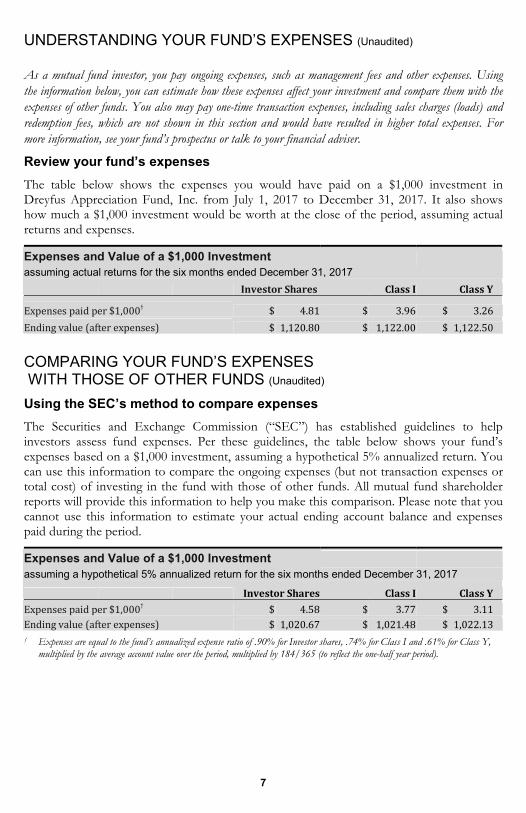
Review your fund’s expenses The table below shows the expenses you would have paid on a $1,000 investment in Dreyfus Appreciation Fund, Inc. from July 1, 2017 to December 31, 2017. It also shows how much a $1,000 investment would be worth at the close of the period, assuming actual returns and expenses.
Expenses and Value of a $1,000 Investment assuming actual returns for the six months ended December 31, 2017
Investor Shares Class I Class Y Expenses paid per $1,000† $ 4.81 $ 3.96 $ 3.26 Ending value (after expenses) $ 1,120.80 $ 1,122.00 $ 1,122.50
COMPARING YOUR FUND’S EXPENSES WITH THOSE OF OTHER FUNDS (Unaudited) Using the SEC’s method to compare expenses The Securities and Exchange Commission (“SEC”) has established guidelines to help investors assess fund expenses. Per these guidelines, the table below shows your fund’s expenses based on a $1,000 investment, assuming a hypothetical 5% annualized return. You can use this information to compare the ongoing expenses (but not transaction expenses or total cost) of investing in the fund with those of other funds. All mutual fund shareholder reports will provide this information to help you make this comparison. Please note that you cannot use this information to estimate your actual ending account balance and expenses paid during the period.
Expenses and Value of a $1,000 Investment
assuming a hypothetical 5% annualized return for the six months ended December 31, 2017
Investor Shares Class I Class Y Expenses paid per $1,000† $ 4.58 $ 3.77 $ 3.11 Ending value (after expenses) $ 1,020.67 $ 1,021.48 $ 1,022.13 † Expenses are equal to the fund’s annualized expense ratio of .90% for Investor shares, .74% for Class I and .61% for Class Y,
multiplied by the average account value over the period, multiplied by 184/365 (to reflect the one-half year period).
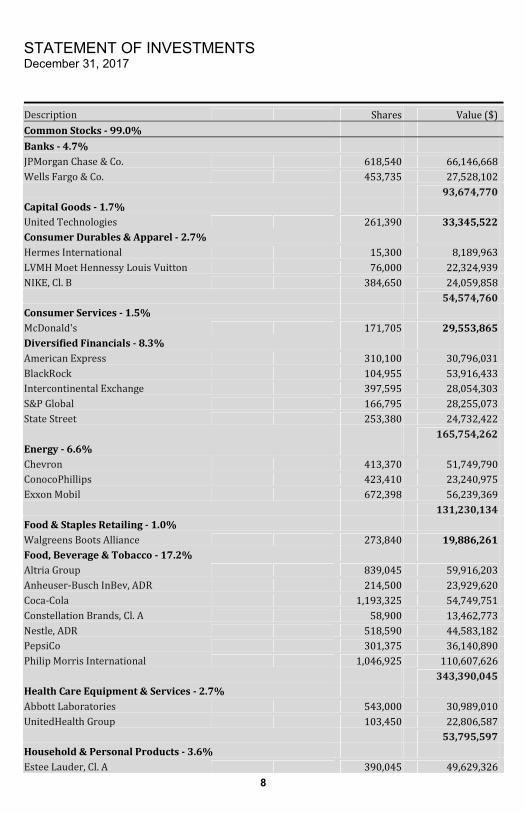
STATEMENT OF INVESTMENTS December 31, 2017
8
Description Shares Value ($)Common Stocks - 99.0%
Banks - 4.7% JPMorgan Chase & Co. 618,540 66,146,668Wells Fargo & Co. 453,735 27,528,102 93,674,770Capital Goods - 1.7% United Technologies 261,390 33,345,522Consumer Durables & Apparel - 2.7% Hermes International 15,300 8,189,963LVMH Moet Hennessy Louis Vuitton 76,000 22,324,939NIKE, Cl. B 384,650 24,059,858 54,574,760Consumer Services - 1.5% McDonald's 171,705 29,553,865Diversified Financials - 8.3% American Express 310,100 30,796,031BlackRock 104,955 53,916,433Intercontinental Exchange 397,595 28,054,303S&P Global 166,795 28,255,073State Street 253,380 24,732,422 165,754,262Energy - 6.6% Chevron 413,370 51,749,790ConocoPhillips 423,410 23,240,975Exxon Mobil 672,398 56,239,369 131,230,134Food & Staples Retailing - 1.0% Walgreens Boots Alliance 273,840 19,886,261Food, Beverage & Tobacco - 17.2% Altria Group 839,045 59,916,203Anheuser-Busch InBev, ADR 214,500 23,929,620Coca-Cola 1,193,325 54,749,751Constellation Brands, Cl. A 58,900 13,462,773Nestle, ADR 518,590 44,583,182PepsiCo 301,375 36,140,890Philip Morris International 1,046,925 110,607,626 343,390,045Health Care Equipment & Services - 2.7% Abbott Laboratories 543,000 30,989,010UnitedHealth Group 103,450 22,806,587 53,795,597Household & Personal Products - 3.6% Estee Lauder, Cl. A 390,045 49,629,326

9
Description Shares Value ($)Common Stocks - 99.0% (continued)
Household & Personal Products - 3.6% (continued) Procter & Gamble 235,675 21,653,819 71,283,145Insurance - 4.6% Berkshire Hathaway, Cl. A 123 a 36,604,801Chubb 382,135 55,841,388 92,446,189Materials - 1.7% Air Products & Chemicals 123,565 20,274,545Praxair 97,320 15,053,458 35,328,003Media - 5.7% Comcast, Cl. A 1,230,790 49,293,139Twenty-First Century Fox, Cl. A 746,233 25,767,425Walt Disney 358,215 38,511,695 113,572,259Pharmaceuticals, Biotechnology & Life Sciences - 7.8% AbbVie 408,010 39,458,647Johnson & Johnson 154,540 21,592,329Novartis, ADR 292,180 b 24,531,433Novo Nordisk, ADR 699,080 37,519,624Roche Holding, ADR 1,027,325 32,442,923 155,544,956Semiconductors & Semiconductor Equipment - 4.7% ASML Holding 171,335 b 29,781,450Texas Instruments 620,205 64,774,210 94,555,660Software & Services - 16.7% Alphabet, Cl. C 71,782 a 75,112,685Automatic Data Processing 90,190 10,569,366Facebook, Cl. A 554,880 a 97,914,125Microsoft 1,161,990 99,396,625Visa, Cl. A 436,445 b 49,763,459 332,756,260Technology Hardware & Equipment - 5.7% Apple 674,375 114,124,481Transportation - 2.1% Canadian Pacific Railway 173,315 31,675,049Union Pacific 75,000 10,057,500 41,732,549Total Common Stocks (cost $763,648,032) 1,976,548,718
STATEMENT OF INVESTMENTS (continued)
10
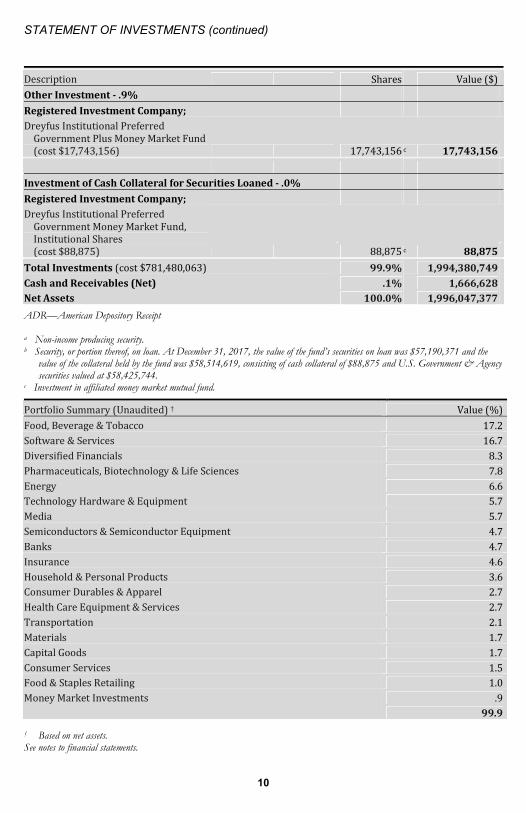
Description Shares Value ($)Other Investment - .9%
Registered Investment Company; Dreyfus Institutional Preferred Government Plus Money Market Fund(cost $17,743,156) 17,743,156 c 17,743,156 Investment of Cash Collateral for Securities Loaned - .0%
Registered Investment Company; Dreyfus Institutional Preferred Government Money Market Fund, Institutional Shares (cost $88,875) 88,875 c 88,875
Total Investments (cost $781,480,063) 99.9% 1,994,380,749Cash and Receivables (Net) .1% 1,666,628Net Assets 100.0% 1,996,047,377
ADR—American Depository Receipt a Non-income producing security. b Security, or portion thereof, on loan. At December 31, 2017, the value of the fund’s securities on loan was $57,190,371 and the
value of the collateral held by the fund was $58,514,619, consisting of cash collateral of $88,875 and U.S. Government & Agency securities valued at $58,425,744.
c Investment in affiliated money market mutual fund. Portfolio Summary (Unaudited) † Value (%)Food, Beverage & Tobacco 17.2Software & Services 16.7Diversified Financials 8.3Pharmaceuticals, Biotechnology & Life Sciences 7.8Energy 6.6Technology Hardware & Equipment 5.7Media 5.7Semiconductors & Semiconductor Equipment 4.7Banks 4.7Insurance 4.6Household & Personal Products 3.6Consumer Durables & Apparel 2.7Health Care Equipment & Services 2.7Transportation 2.1Materials 1.7Capital Goods 1.7Consumer Services 1.5Food & Staples Retailing 1.0Money Market Investments .9 99.9
† Based on net assets. See notes to financial statements.
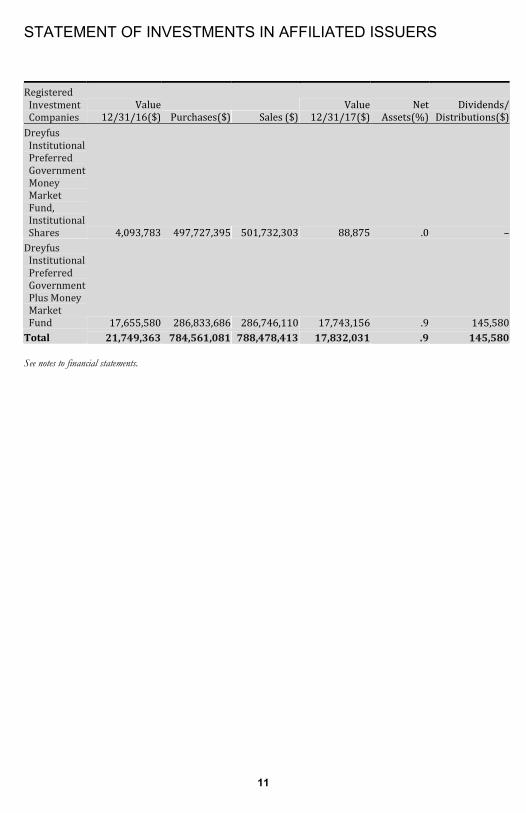
STATEMENT OF INVESTMENTS IN AFFILIATED ISSUERS
11
Registered Investment Companies Value 12/31/16 ($) Purchases ($) Sales ($) Value 12/31/17 ($) NetAssets (%) Dividends/ Distributions ($) Dreyfus Institutional Preferred Government Money Market Fund, Institutional Shares 4,093,783 497,727,395 501,732,303 88,875 .0 – Dreyfus Institutional Preferred Government Plus Money Market Fund 17,655,580 286,833,686 286,746,110 17,743,156 .9 145,580 Total 21,749,363 784,561,081 788,478,413 17,832,031 .9 145,580 See notes to financial statements.
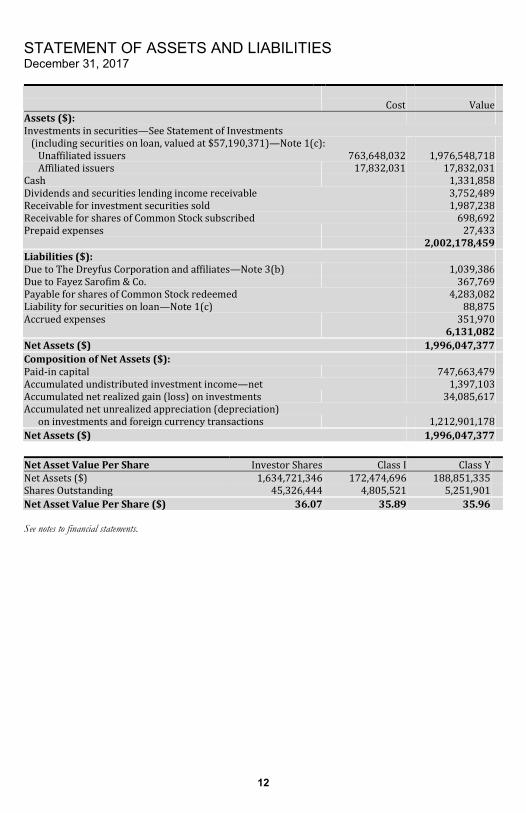
STATEMENT OF ASSETS AND LIABILITIES December 31, 2017
12
Cost Value
Assets ($): Investments in securities—See Statement of Investments (including securities on loan, valued at $57,190,371)—Note 1(c): Unaffiliated issuers 763,648,032 1,976,548,718 Affiliated issuers 17,832,031 17,832,031 Cash 1,331,858 Dividends and securities lending income receivable 3,752,489 Receivable for investment securities sold 1,987,238 Receivable for shares of Common Stock subscribed 698,692 Prepaid expenses 27,433 2,002,178,459 Liabilities ($): Due to The Dreyfus Corporation and affiliates—Note 3(b) 1,039,386 Due to Fayez Sarofim & Co. 367,769 Payable for shares of Common Stock redeemed 4,283,082 Liability for securities on loan—Note 1(c) 88,875 Accrued expenses 351,970 6,131,082 Net Assets ($) 1,996,047,377 Composition of Net Assets ($): Paid-in capital 747,663,479 Accumulated undistributed investment income—net 1,397,103 Accumulated net realized gain (loss) on investments 34,085,617 Accumulated net unrealized appreciation (depreciation) on investments and foreign currency transactions 1,212,901,178 Net Assets ($) 1,996,047,377 Net Asset Value Per Share Investor Shares Class I Class Y Net Assets ($) 1,634,721,346 172,474,696 188,851,335 Shares Outstanding 45,326,444 4,805,521 5,251,901 Net Asset Value Per Share ($) 36.07 35.89 35.96 See notes to financial statements.
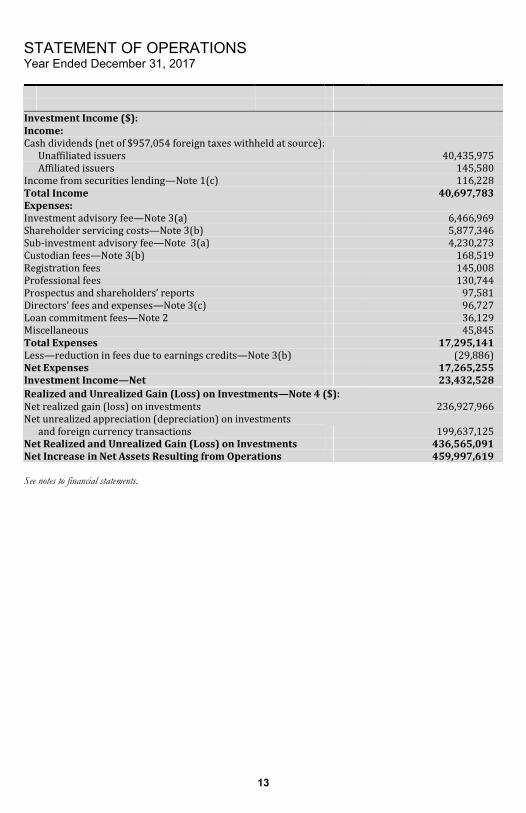
STATEMENT OF OPERATIONS Year Ended December 31, 2017
13
Investment Income ($): Income: Cash dividends (net of $957,054 foreign taxes withheld at source): Unaffiliated issuers 40,435,975 Affiliated issuers 145,580 Income from securities lending—Note 1(c) 116,228 Total Income 40,697,783 Expenses: Investment advisory fee—Note 3(a) 6,466,969 Shareholder servicing costs—Note 3(b) 5,877,346 Sub-investment advisory fee—Note 3(a) 4,230,273 Custodian fees—Note 3(b) 168,519 Registration fees 145,008 Professional fees 130,744 Prospectus and shareholders’ reports 97,581 Directors’ fees and expenses—Note 3(c) 96,727 Loan commitment fees—Note 2 36,129 Miscellaneous 45,845 Total Expenses 17,295,141 Less—reduction in fees due to earnings credits—Note 3(b) (29,886) Net Expenses 17,265,255 Investment Income—Net 23,432,528 Realized and Unrealized Gain (Loss) on Investments—Note 4 ($): Net realized gain (loss) on investments 236,927,966 Net unrealized appreciation (depreciation) on investments and foreign currency transactions 199,637,125 Net Realized and Unrealized Gain (Loss) on Investments 436,565,091 Net Increase in Net Assets Resulting from Operations 459,997,619 See notes to financial statements.
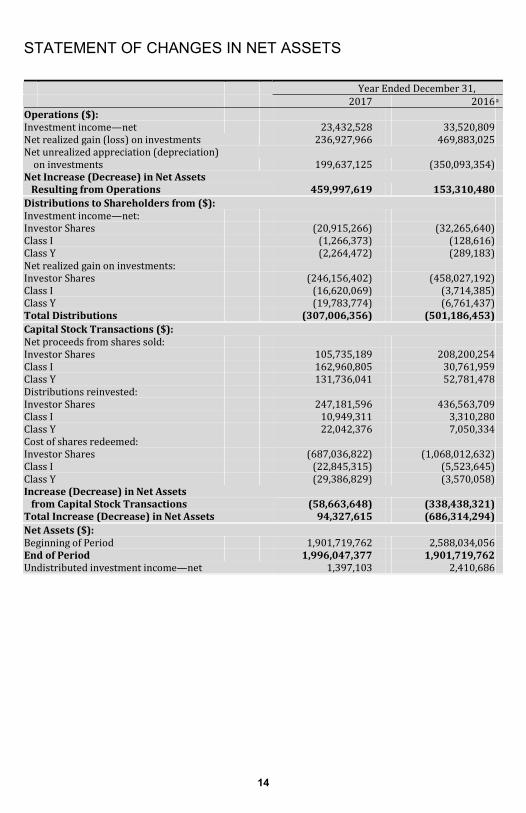
STATEMENT OF CHANGES IN NET ASSETS
14
Year Ended December 31, 2017 2016a
Operations ($): Investment income—net 23,432,528 33,520,809 Net realized gain (loss) on investments 236,927,966 469,883,025 Net unrealized appreciation (depreciation) on investments 199,637,125 (350,093,354) Net Increase (Decrease) in Net Assets Resulting from Operations 459,997,619 153,310,480 Distributions to Shareholders from ($): Investment income—net: Investor Shares (20,915,266) (32,265,640) Class I (1,266,373) (128,616) Class Y (2,264,472) (289,183) Net realized gain on investments: Investor Shares (246,156,402) (458,027,192) Class I (16,620,069) (3,714,385) Class Y (19,783,774) (6,761,437) Total Distributions (307,006,356) (501,186,453) Capital Stock Transactions ($): Net proceeds from shares sold: Investor Shares 105,735,189 208,200,254 Class I 162,960,805 30,761,959 Class Y 131,736,041 52,781,478 Distributions reinvested: Investor Shares 247,181,596 436,563,709 Class I 10,949,311 3,310,280 Class Y 22,042,376 7,050,334 Cost of shares redeemed: Investor Shares (687,036,822) (1,068,012,632) Class I (22,845,315) (5,523,645) Class Y (29,386,829) (3,570,058) Increase (Decrease) in Net Assets from Capital Stock Transactions (58,663,648) (338,438,321) Total Increase (Decrease) in Net Assets 94,327,615 (686,314,294) Net Assets ($): Beginning of Period 1,901,719,762 2,588,034,056 End of Period 1,996,047,377 1,901,719,762 Undistributed investment income—net 1,397,103 2,410,686
15
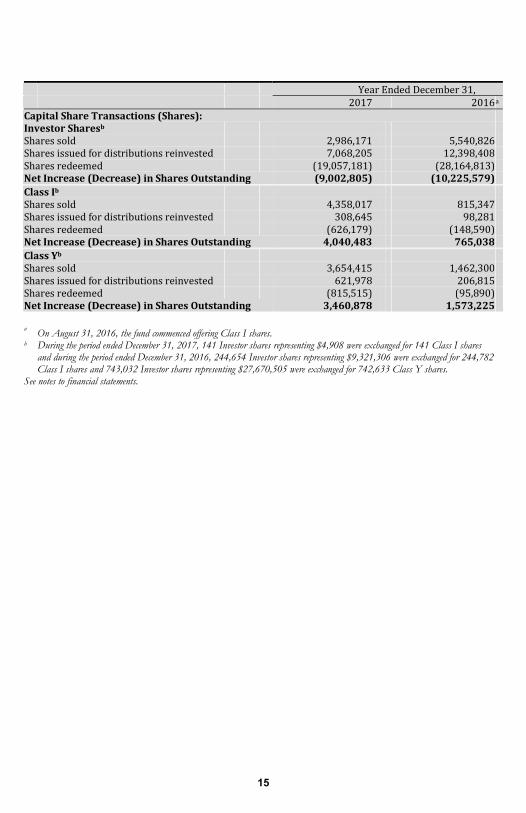
Year Ended December 31, 2017 2016a
Capital Share Transactions (Shares): Investor Sharesb Shares sold 2,986,171 5,540,826 Shares issued for distributions reinvested 7,068,205 12,398,408 Shares redeemed (19,057,181) (28,164,813) Net Increase (Decrease) in Shares Outstanding (9,002,805) (10,225,579) Class Ib Shares sold 4,358,017 815,347 Shares issued for distributions reinvested 308,645 98,281 Shares redeemed (626,179) (148,590) Net Increase (Decrease) in Shares Outstanding 4,040,483 765,038 Class Yb Shares sold 3,654,415 1,462,300 Shares issued for distributions reinvested 621,978 206,815 Shares redeemed (815,515) (95,890) Net Increase (Decrease) in Shares Outstanding 3,460,878 1,573,225 a On August 31, 2016, the fund commenced offering Class I shares. b During the period ended December 31, 2017, 141 Investor shares representing $4,908 were exchanged for 141 Class I shares
and during the period ended December 31, 2016, 244,654 Investor shares representing $9,321,306 were exchanged for 244,782 Class I shares and 743,032 Investor shares representing $27,670,505 were exchanged for 742,633 Class Y shares.
See notes to financial statements.
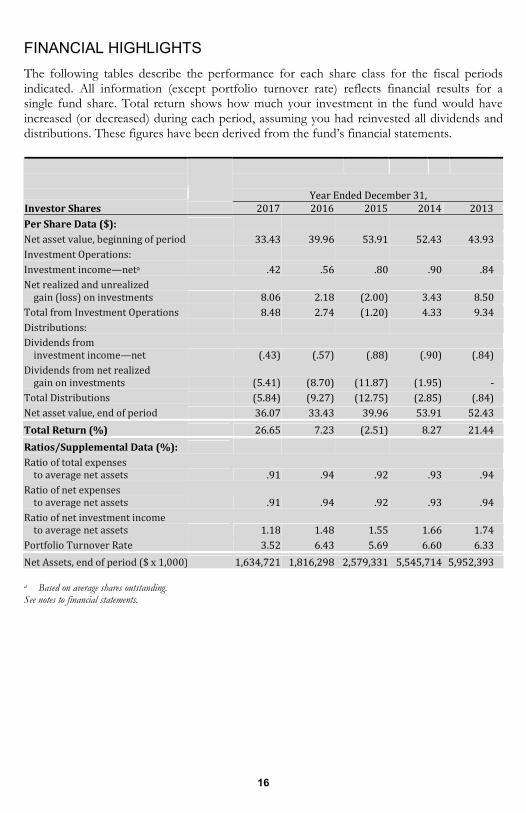
FINANCIAL HIGHLIGHTS
16
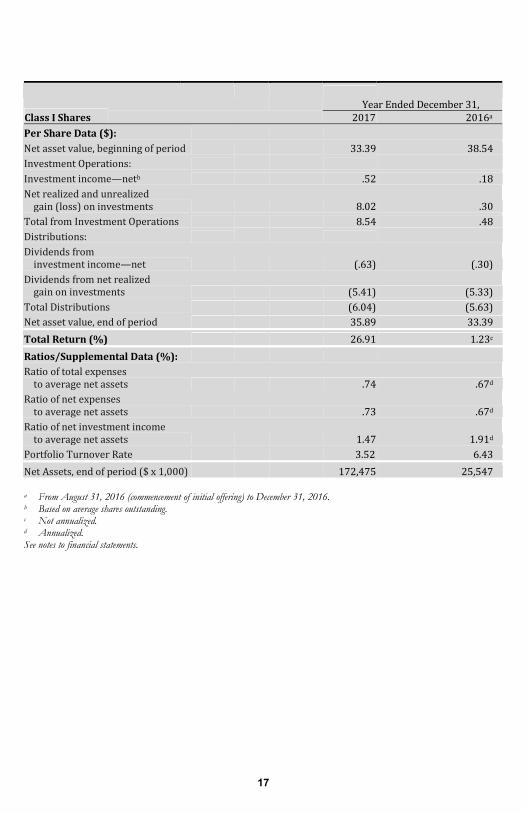
The following tables describe the performance for each share class for the fiscal periods indicated. All information (except portfolio turnover rate) reflects financial results for a single fund share. Total return shows how much your investment in the fund would have increased (or decreased) during each period, assuming you had reinvested all dividends and distributions. These figures have been derived from the fund’s financial statements.
Year Ended December 31, Investor Shares 2017 2016 2015 2014 2013 Per Share Data ($): Net asset value, beginning of period 33.43 39.96 53.91 52.43 43.93 Investment Operations: Investment income—neta .42 .56 .80 .90 .84 Net realized and unrealized gain (loss) on investments 8.06 2.18 (2.00) 3.43 8.50 Total from Investment Operations 8.48 2.74 (1.20) 4.33 9.34 Distributions: Dividends from investment income—net (.43) (.57) (.88) (.90) (.84) Dividends from net realized gain on investments (5.41) (8.70) (11.87) (1.95) - Total Distributions (5.84) (9.27) (12.75) (2.85) (.84) Net asset value, end of period 36.07 33.43 39.96 53.91 52.43 Total Return (%) 26.65 7.23 (2.51) 8.27 21.44 Ratios/Supplemental Data (%): Ratio of total expenses to average net assets .91 .94 .92 .93 .94 Ratio of net expenses to average net assets .91 .94 .92 .93 .94 Ratio of net investment income to average net assets 1.18 1.48 1.55 1.66 1.74 Portfolio Turnover Rate 3.52 6.43 5.69 6.60 6.33 Net Assets, end of period ($ x 1,000) 1,634,721 1,816,298 2,579,331 5,545,714 5,952,393 a Based on average shares outstanding. See notes to financial statements.
17
Year Ended December 31, Class I Shares 2017 2016a Per Share Data ($): Net asset value, beginning of period 33.39 38.54 Investment Operations: Investment income—netb .52 .18 Net realized and unrealized gain (loss) on investments 8.02 .30 Total from Investment Operations 8.54 .48 Distributions: Dividends from investment income—net (.63) (.30) Dividends from net realized gain on investments (5.41) (5.33) Total Distributions (6.04) (5.63) Net asset value, end of period 35.89 33.39 Total Return (%) 26.91 1.23c Ratios/Supplemental Data (%): Ratio of total expenses to average net assets .74 .67d Ratio of net expenses to average net assets .73 .67d Ratio of net investment income to average net assets 1.47 1.91d Portfolio Turnover Rate 3.52 6.43 Net Assets, end of period ($ x 1,000) 172,475 25,547 a From August 31, 2016 (commencement of initial offering) to December 31, 2016. b Based on average shares outstanding. c Not annualized. d Annualized. See notes to financial statements.
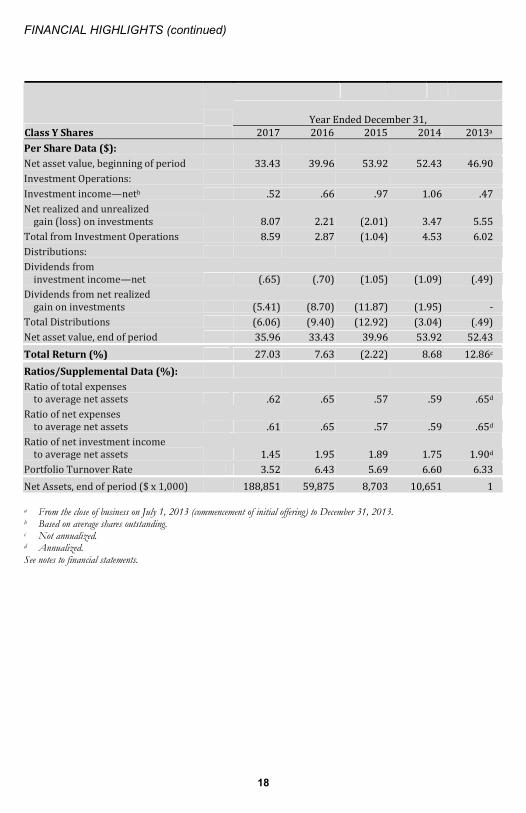
FINANCIAL HIGHLIGHTS (continued)
18
Year Ended December 31, Class Y Shares 2017 2016 2015 2014 2013a Per Share Data ($): Net asset value, beginning of period 33.43 39.96 53.92 52.43 46.90 Investment Operations: Investment income—netb .52 .66 .97 1.06 .47 Net realized and unrealized gain (loss) on investments 8.07 2.21 (2.01) 3.47 5.55 Total from Investment Operations 8.59 2.87 (1.04) 4.53 6.02 Distributions: Dividends from investment income—net (.65) (.70) (1.05) (1.09) (.49) Dividends from net realized gain on investments (5.41) (8.70) (11.87) (1.95) - Total Distributions (6.06) (9.40) (12.92) (3.04) (.49) Net asset value, end of period 35.96 33.43 39.96 53.92 52.43 Total Return (%) 27.03 7.63 (2.22) 8.68 12.86c Ratios/Supplemental Data (%): Ratio of total expenses to average net assets .62 .65 .57 .59 .65d Ratio of net expenses to average net assets .61 .65 .57 .59 .65d Ratio of net investment income to average net assets 1.45 1.95 1.89 1.75 1.90d Portfolio Turnover Rate 3.52 6.43 5.69 6.60 6.33 Net Assets, end of period ($ x 1,000) 188,851 59,875 8,703 10,651 1 a From the close of business on July 1, 2013 (commencement of initial offering) to December 31, 2013. b Based on average shares outstanding. c Not annualized. d Annualized. See notes to financial statements.
NOTES TO FINANCIAL STATEMENTS
19
NOTE 1—Significant Accounting Policies:
Dreyfus Appreciation Fund, Inc. (the “fund”) is registered under the Investment Company Act of 1940, as amended (the “Act”), as a diversified open-end management investment company. The fund’s investment objective is to seek long-term capital growth consistent with the preservation of capital. The Dreyfus Corporation (the “Manager” or “Dreyfus”), a wholly-owned subsidiary of The Bank of New York Mellon Corporation (“BNY Mellon”), serves as the fund’s investment adviser. Fayez Sarofim & Co. (“Sarofim & Co.”) serves as the fund’s sub-investment adviser.
MBSC Securities Corporation (the “Distributor”), a wholly-owned subsidiary of Dreyfus, is the distributor of the fund’s shares, which are sold to the public without a sales charge. The fund is authorized to issue 500 million shares of $.001 par value Common Stock. The fund currently has authorized three classes of shares: Investor (300 million shares authorized), Class I (100 million shares authorized) and Class Y (100 million shares authorized). Investor shares are sold primarily to retail investors through financial intermediaries and bear Shareholder Services Plan fees. Class I and Y shares are sold at net asset value per share generally to institutional investors. Other differences between the classes include the services offered to and the expenses borne by each class, the allocation of certain transfer agency costs, and certain voting rights. Income, expenses (other than expenses attributable to a specific class), and realized and unrealized gains or losses on investments are allocated to each class of shares based on its relative net assets.
The Financial Accounting Standards Board (“FASB”) Accounting Standards Codification is the exclusive reference of authoritative U.S. generally accepted accounting principles (“GAAP”) recognized by the FASB to be applied by nongovernmental entities. Rules and interpretive releases of the Securities and Exchange Commission (“SEC”) under authority of federal laws are also sources of authoritative GAAP for SEC registrants. The fund’s financial statements are prepared in accordance with GAAP, which may require the use of management estimates and assumptions. Actual results could differ from those estimates.
The fund enters into contracts that contain a variety of indemnifications. The fund’s maximum exposure under these arrangements is unknown. The fund does not anticipate recognizing any loss related to these arrangements.
(a) Portfolio valuation: The fair value of a financial instrument is the amount that would be received to sell an asset or paid to transfer a liability
NOTES TO FINANCIAL STATEMENTS (continued)
20
in an orderly transaction between market participants at the measurement date (i.e., the exit price). GAAP establishes a fair value hierarchy that prioritizes the inputs of valuation techniques used to measure fair value. This hierarchy gives the highest priority to unadjusted quoted prices in active markets for identical assets or liabilities (Level 1 measurements) and the lowest priority to unobservable inputs (Level 3 measurements).
Additionally, GAAP provides guidance on determining whether the volume and activity in a market has decreased significantly and whether such a decrease in activity results in transactions that are not orderly. GAAP requires enhanced disclosures around valuation inputs and techniques used during annual and interim periods.
Various inputs are used in determining the value of the fund’s investments relating to fair value measurements. These inputs are summarized in the three broad levels listed below:
Level 1—unadjusted quoted prices in active markets for identical investments.
Level 2—other significant observable inputs (including quoted prices for similar investments, interest rates, prepayment speeds, credit risk, etc.).
Level 3—significant unobservable inputs (including the fund’s own assumptions in determining the fair value of investments).
The inputs or methodology used for valuing securities are not necessarily an indication of the risk associated with investing in those securities.
Changes in valuation techniques may result in transfers in or out of an assigned level within the disclosure hierarchy. Valuation techniques used to value the fund’s investments are as follows:
Investments in securities are valued at the last sales price on the securities exchange or national securities market on which such securities are primarily traded. Securities listed on the National Market System for which market quotations are available are valued at the official closing price or, if there is no official closing price that day, at the last sales price. For open short positions, asked prices are used for valuation purposes. Bid price is used when no asked price is available. Registered investment companies that are not traded on an exchange are valued at their net asset value. All of the preceding securities are generally categorized within Level 1 of the fair value hierarchy.
Securities not listed on an exchange or the national securities market, or securities for which there were no transactions, are valued at the average of
21
the most recent bid and asked prices. These securities are generally categorized within Level 2 of the fair value hierarchy.
Fair valuing of securities may be determined with the assistance of a pricing service using calculations based on indices of domestic securities and other appropriate indicators, such as prices of relevant ADRs and futures. Utilizing these techniques may result in transfers between Level 1 and Level 2 of the fair value hierarchy.
When market quotations or official closing prices are not readily available, or are determined to not accurately reflect fair value, such as when the value of a security has been significantly affected by events after the close of the exchange or market on which the security is principally traded (for example, a foreign exchange or market), but before the fund calculates its net asset value, the fund may value these investments at fair value as determined in accordance with the procedures approved by the fund’s Board of Directors (the “Board”). Certain factors may be considered when fair valuing investments such as: fundamental analytical data, the nature and duration of restrictions on disposition, an evaluation of the forces that influence the market in which the securities are purchased and sold, and public trading in similar securities of the issuer or comparable issuers. These securities are either categorized within Level 2 or 3 of the fair value hierarchy depending on the relevant inputs used.
For restricted securities where observable inputs are limited, assumptions about market activity and risk are used and are generally categorized within Level 3 of the fair value hierarchy.
Investments denominated in foreign currencies are translated to U.S. dollars at the prevailing rates of exchange.
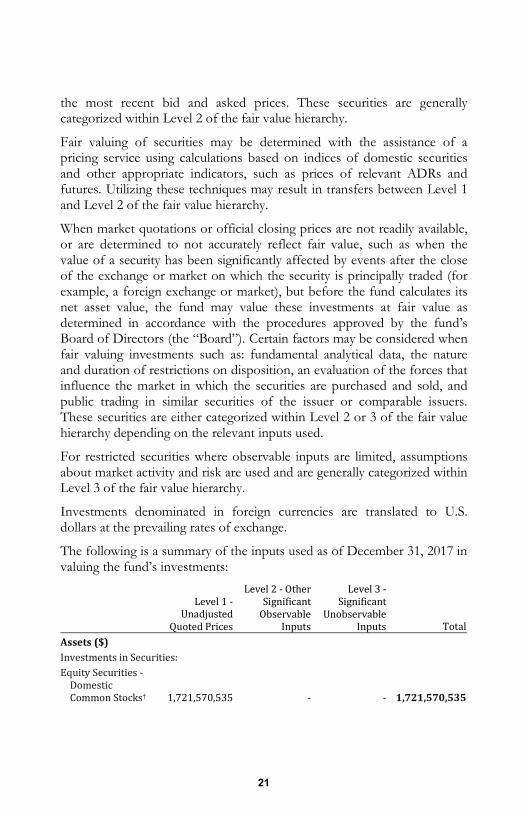
The following is a summary of the inputs used as of December 31, 2017 in valuing the fund’s investments:
Level 1 -Unadjusted Quoted PricesLevel 2 - Other Significant Observable Inputs
Level 3 -Significant Unobservable Inputs TotalAssets ($) Investments in Securities: Equity Securities - Domestic Common Stocks† 1,721,570,535 - - 1,721,570,535
NOTES TO FINANCIAL STATEMENTS (continued)
22
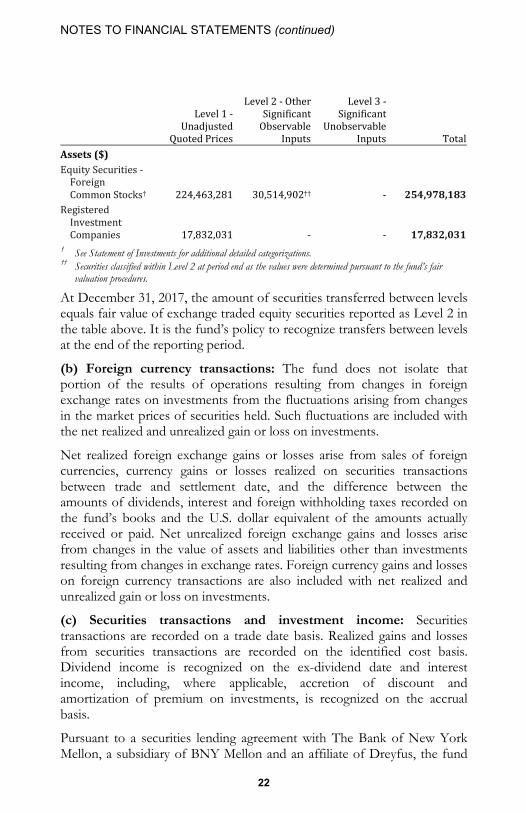
Level 1 -Unadjusted Quoted PricesLevel 2 - Other Significant Observable Inputs
Level 3 -Significant Unobservable Inputs TotalAssets ($) Equity Securities - Foreign Common Stocks† 224,463,281 30,514,902†† - 254,978,183Registered Investment Companies 17,832,031 - - 17,832,031† See Statement of Investments for additional detailed categorizations. †† Securities classified within Level 2 at period end as the values were determined pursuant to the fund’s fair
valuation procedures.
At December 31, 2017, the amount of securities transferred between levels equals fair value of exchange traded equity securities reported as Level 2 in the table above. It is the fund’s policy to recognize transfers between levels at the end of the reporting period.
(b) Foreign currency transactions: The fund does not isolate that portion of the results of operations resulting from changes in foreign exchange rates on investments from the fluctuations arising from changes in the market prices of securities held. Such fluctuations are included with the net realized and unrealized gain or loss on investments.
Net realized foreign exchange gains or losses arise from sales of foreign currencies, currency gains or losses realized on securities transactions between trade and settlement date, and the difference between the amounts of dividends, interest and foreign withholding taxes recorded on the fund’s books and the U.S. dollar equivalent of the amounts actually received or paid. Net unrealized foreign exchange gains and losses arise from changes in the value of assets and liabilities other than investments resulting from changes in exchange rates. Foreign currency gains and losses on foreign currency transactions are also included with net realized and unrealized gain or loss on investments.
(c) Securities transactions and investment income: Securities transactions are recorded on a trade date basis. Realized gains and losses from securities transactions are recorded on the identified cost basis. Dividend income is recognized on the ex-dividend date and interest income, including, where applicable, accretion of discount and amortization of premium on investments, is recognized on the accrual basis.
Pursuant to a securities lending agreement with The Bank of New York Mellon, a subsidiary of BNY Mellon and an affiliate of Dreyfus, the fund
23
may lend securities to qualified institutions. It is the fund’s policy that, at origination, all loans are secured by collateral of at least 102% of the value of U.S. securities loaned and 105% of the value of foreign securities loaned. Collateral equivalent to at least 100% of the market value of securities on loan is maintained at all times. Collateral is either in the form of cash, which can be invested in certain money market mutual funds managed by Dreyfus, or U.S. Government and Agency securities. The fund is entitled to receive all dividends, interest and distributions on securities loaned, in addition to income earned as a result of the lending transaction. Should a borrower fail to return the securities in a timely manner, The Bank of New York Mellon is required to replace the securities for the benefit of the fund or credit the fund with the market value of the unreturned securities and is subrogated to the fund’s rights against the borrower and the collateral. Additionally, the contractual maturity of security lending transactions are on an overnight and continuous basis. During the period ended December 31, 2017, The Bank of New York Mellon earned $21,475 from lending portfolio securities, pursuant to the securities lending agreement.
(d) Affiliated issuers: Investments in other investment companies advised by Dreyfus are defined as “affiliated” under the Act.
(e) Dividends and distributions to shareholders: Dividends and distributions are recorded on the ex-dividend date. Dividends from investment income-net are normally declared and paid quarterly. Dividends from net realized capital gains, if any, are normally declared and paid annually, but the fund may make distributions on a more frequent basis to comply with the distribution requirements of the Internal Revenue Code of 1986, as amended (the “Code”). To the extent that net realized capital gains can be offset by capital loss carryovers, it is the policy of the fund not to distribute such gains. Income and capital gain distributions are determined in accordance with income tax regulations, which may differ from GAAP.
(f) Federal income taxes: It is the policy of the fund to continue to qualify as a regulated investment company, if such qualification is in the best interests of its shareholders, by complying with the applicable provisions of the Code, and to make distributions of taxable income sufficient to relieve it from substantially all federal income and excise taxes.
As of and during the period ended December 31, 2017, the fund did not have any liabilities for any uncertain tax positions. The fund recognizes interest and penalties, if any, related to uncertain tax positions as income tax expense in the Statement of Operations. During the period ended December 31, 2017, the fund did not incur any interest or penalties.
NOTES TO FINANCIAL STATEMENTS (continued)
24
Each tax year in the four-year period ended December 31, 2017 remains subject to examination by the Internal Revenue Service and state taxing authorities.
At December 31, 2017, the components of accumulated earnings on a tax basis were as follows: undistributed ordinary income $2,980,084, undistributed capital gains $32,524,363 and unrealized appreciation $1,212,879,451.
The tax character of distributions paid to shareholders during the fiscal periods ended December 31, 2017 and December 31, 2016 were as follows: ordinary income $25,747,920 and $32,683,439, and long-term capital gains $281,258,436 and $468,503,014, respectively.
During the period ended December 31, 2017, as a result of permanent book to tax differences, primarily due to the tax treatment for treating a portion of the proceeds from redemptions as a distribution for tax purposes, the fund decreased accumulated net realized gain (loss) on investments by $39,664,482 and increased paid-in capital by the same amount. Net assets and net asset value per share were not affected by this reclassification.
NOTE 2—Bank Lines of Credit:
The fund participates with other Dreyfus-managed funds in an $830 million unsecured credit facility led by Citibank, N.A. and a $300 million unsecured credit facility provided by The Bank of New York Mellon (each, a “Facility”), each to be utilized primarily for temporary or emergency purposes, including the financing of redemptions. Prior to October 4, 2017, the unsecured credit facility with Citibank, N.A. was $810 million. In connection therewith, the fund has agreed to pay its pro rata portion of commitment fees for each Facility. Interest is charged to the fund based on rates determined pursuant to the terms of the respective Facility at the time of borrowing. During the period ended December 31, 2017, the fund did not borrow under the Facilities.
NOTE 3—Investment Advisory Fee, Sub-Investment Advisory Fee and Other Transactions with Affiliates:
(a) Pursuant to an investment advisory agreement with Dreyfus, the investment advisory fee is computed at the annual rate of .3325% of the value of the fund’s average daily net assets. Pursuant to a sub-investment advisory agreement with Sarofim & Co., the fund pays Sarofim & Co. a monthly sub-investment advisory fee at the annual rate of .2175% of the value of the fund’s average daily net assets. Both fees are payable monthly.
25
(b) Under the Shareholder Services Plan, Investor shares pay the Distributor at an annual rate of .25% of the value of its average daily net assets for the provision of certain services. The services provided may include personal services relating to shareholder accounts, such as answering shareholder inquiries regarding the fund and providing reports and other information, and services related to the maintenance of shareholder accounts, such as recordkeeping and sub-accounting services. The Distributor may make payments to Service Agents (securities dealers, financial institutions or other industry professionals) with respect to these services. The Distributor determines the amounts to be paid to Service Agents. During the period ended December 31, 2017, the fund was charged $4,436,032 pursuant to the Shareholder Services Plan.
The fund has arrangements with the transfer agent and the custodian whereby the fund may receive earnings credits when positive cash balances are maintained, which are used to offset transfer agency and custody fees. For financial reporting purposes, the fund includes net earnings credits as an expense offset in the Statement of Operations.
The fund compensates Dreyfus Transfer, Inc., a wholly-owned subsidiary of Dreyfus, under a transfer agency agreement for providing transfer agency and cash management services for the fund. The majority of transfer agency fees are comprised of amounts paid on a per account basis, while cash management fees are related to fund subscriptions and redemptions. During the period ended December 31, 2017, the fund was charged $306,496 for transfer agency services and $29,886 for cash management services. These fees are included in Shareholder servicing costs in the Statement of Operations. Cash management fees were offset by earnings credits of $29,886.
The fund compensates The Bank of New York Mellon under a custody agreement for providing custodial services for the fund. These fees are determined based on net assets, geographic region and transaction activity. During the period ended December 31, 2017, the fund was charged $168,519 pursuant to the custody agreement.
During the period ended December 31, 2017, the fund was charged $11,202 for services performed by the Chief Compliance Officer and his staff.
The components of “Due to The Dreyfus Corporation and affiliates” in the Statement of Assets and Liabilities consist of: investment advisory fees $562,222, Shareholder Services Plan fees $346,215, custodian fees $32,000, Chief Compliance Officer fees $8,406 and transfer agency fees $90,543.
NOTES TO FINANCIAL STATEMENTS (continued)
26
(c) Each Board member also serves as a Board member of other funds within the Dreyfus complex. Annual retainer fees and attendance fees are allocated to each fund based on net assets.
NOTE 4—Securities Transactions:
The aggregate amount of purchases and sales of investment securities, excluding short-term securities, during the period ended December 31, 2017, amounted to $67,650,970 and $412,937,788, respectively.
At December 31, 2017, the cost of investments for federal income tax purposes was $781,501,790; accordingly, accumulated net unrealized appreciation on investments was $1,212,878,959, consisting of gross unrealized appreciation.
REPORT OF INDEPENDENT REGISTERED PUBLIC ACCOUNTING FIRM
27
To the Shareholders and the Board of Directors of Dreyfus Appreciation Fund, Inc.
Opinion on the Financial Statements We have audited the accompanying statement of assets and liabilities of Dreyfus Appreciation Fund, Inc. (the “Fund”), including the statements of investments and investments in affiliated issuers, as of December 31, 2017, and the related statement of operations for the year then ended, the statements of changes in net assets for each of the two years in the period then ended, the financial highlights for each of the five years in the period then ended and the related notes (collectively referred to as the “financial statements”). In our opinion, the financial statements present fairly, in all material respects, the financial position of Dreyfus Appreciation Fund, Inc. at December 31, 2017, the results of its operations for the year then ended, the changes in its net assets for each of the two years in the period then ended and its financial highlights for each of the five years in the period then ended, in conformity with U.S. generally accepted accounting principles.
Basis for opinion These financial statements are the responsibility of the Fund’s management. Our responsibility is to express an opinion on the Fund’s financial statements based on our audits. We are a public accounting firm registered with the Public Company Accounting Oversight Board (United States) (“PCAOB”) and are required to be independent with respect to the Fund in accordance with the U.S. federal securities laws and the applicable rules and regulations of the Securities and Exchange Commission and the PCAOB. We conducted our audits in accordance with the standards of the PCAOB. Those standards require that we plan and perform the audit to obtain reasonable assurance about whether the financial statements are free of material misstatement, whether due to error or fraud. The Fund is not required to have, nor were we engaged to perform, an audit of the Fund’s internal control over financial reporting. As part of our audits, we are required to obtain an understanding of internal control over financial reporting, but not for the purpose of expressing an opinion on the effectiveness of the Fund’s internal control over financial reporting. Accordingly, we express no such opinion. Our audits included performing procedures to assess the risks of material misstatement of the financial statements, whether due to error or fraud, and performing procedures that respond to those risks. Such procedures included examining, on a test basis, evidence regarding the amounts and disclosures in the financial statements. Our procedures included confirmation of securities owned as of December 31, 2017, by correspondence with the custodian and others or by other appropriate auditing procedures where replies were not received. Our audits also included evaluating the accounting principles used and significant estimates made by management, as well as evaluating the overall presentation of the financial statements. We believe that our audits provide a reasonable basis for our opinion.
We have served as the auditor of one or more Dreyfus investment companies since at least 1957, but we are unable to determine the specific year. New York, New York February 26, 2018
IMPORTANT TAX INFORMATION (Unaudited)
28
In accordance with federal tax law, the fund hereby reports 100% of the ordinary dividends paid during the fiscal year ended December 31, 2017 as qualifying for the corporate dividends received deduction. For the fiscal year ended December 31, 2017, certain dividends paid by the fund may be subject to a maximum tax rate of 15%, as provided for by the Jobs and Growth Tax Relief Reconciliation Act of 2003. Of the distributions paid during the fiscal year, $25,747,920 represents the maximum amount that may be considered qualified dividend income. Shareholders will receive notification in early 2018 of the percentage applicable to the preparation of their 2017 income tax returns. Also, the fund hereby reports $.0243 per share as a short-term capital gain distribution and $2.2047 per share as a long-term capital gain distribution paid on March 31, 2017 and the fund also reports $3.1765 per share as a long-term capital gain distribution paid on December 22, 2017.
INFORMATION ABOUT THE RENEWAL OF THE FUND’S INVESTMENT ADVISORY AND SUB-INVESTMENT ADVISORY AGREEMENTS (Unaudited)
29
At a meeting of the fund’s Board of Directors held on July 20, 2017, the Board considered the renewal of the fund’s Management Agreement, pursuant to which Dreyfus provides the fund with investment advisory and administrative services (the “Agreement”), and the Sub-Investment Advisory Agreement (together, the “Agreements”), pursuant to which Fayez Sarofim & Co. (the “Subadviser”) provides day-to-day management of the fund’s investments. The Board members, none of whom are “interested persons” (as defined in the Investment Company Act of 1940, as amended) of the fund, were assisted in their review by independent legal counsel and met with counsel in executive session separate from representatives of Dreyfus and the Subadviser. In considering the renewal of the Agreements, the Board considered all factors that it believed to be relevant, including those discussed below. The Board did not identify any one factor as dispositive, and each Board member may have attributed different weights to the factors considered.
Analysis of Nature, Extent, and Quality of Services Provided to the Fund. The Board considered information provided to them at the meeting and in previous presentations from Dreyfus representatives regarding the nature, extent, and quality of the services provided to funds in the Dreyfus fund complex. Dreyfus provided the number of open accounts in the fund, the fund’s asset size and the allocation of fund assets among distribution channels. Dreyfus also had previously provided information regarding the diverse intermediary relationships and distribution channels of funds in the Dreyfus fund complex (such as retail direct or intermediary, in which intermediaries typically are paid by the fund and/or Dreyfus) and Dreyfus’ corresponding need for broad, deep, and diverse resources to be able to provide ongoing shareholder services to each intermediary or distribution channel, as applicable to the fund.
The Board also considered research support available to, and portfolio management capabilities of, the fund’s portfolio management personnel and that Dreyfus also provides oversight of day-to-day fund operations, including fund accounting and administration and assistance in meeting legal and regulatory requirements. The Board also considered Dreyfus’ extensive administrative, accounting, and compliance infrastructures, as well as Dreyfus’ supervisory activities over the Subadviser. The Board also considered portfolio management’s brokerage policies and practices (including policies and practices regarding soft dollars) and the standards applied in seeking best execution.
Comparative Analysis of the Fund’s Performance and Management Fee and Expense Ratio. The Board reviewed reports prepared by Broadridge Financial Solutions, Inc. (“Broadridge”), an independent provider of investment company data, which included information comparing (1) the fund’s performance with the performance of a group of comparable funds (the “Performance Group”) and with a broader group of funds (the “Performance Universe”), all for various periods ended May 31, 2017, and (2) the fund’s actual and contractual management fees and total expenses with those of a group of
INFORMATION ABOUT THE RENEWAL OF THE FUND’S INVESTMENT ADVISORY AND SUB-INVESTMENT ADVISORY AGREEMENTS (Unaudited) (continued)
30
comparable funds (the “Expense Group”) and with a broader group of funds (the “Expense Universe”), the information for which was derived in part from fund financial statements available to Broadridge as of the date of its analysis. Dreyfus previously had furnished the Board with a description of the methodology Broadridge used to select the Performance Group and Performance Universe and the Expense Group and Expense Universe.
Dreyfus representatives stated that the usefulness of performance comparisons may be affected by a number of factors, including different investment limitations that may be applicable to the fund and comparison funds. The Board discussed with representatives of Dreyfus, its affiliates and/or the Subadviser the results of the comparisons and considered that the fund’s total return performance was below the Performance Group and Performance Universe medians for all periods, except for the one-year period when the fund’s performance was above the Performance Universe median. The Board noted the relative proximity to the median during certain periods when the fund’s total return performance was below the median of the Performance Group or Performance Universe, as applicable. Dreyfus also provided a comparison of the fund’s calendar year total returns to the returns of the fund’s benchmark index, and it was noted that the fund’s performance was above the index for four of the ten calendar years shown.
The Board discussed with representatives of Dreyfus, its affiliates and the Subadviser the investment strategy employed in the management of the fund’s assets and how that strategy affected the fund’s relative performance. The Board members considered that the Subadviser is an experienced manager with a long-term “buy-and-hold” investment approach to investing in high quality, “mega-cap” companies. The Subadviser’s considerable reputation, based on following this investment approach, was considered.
The Board also reviewed the range of actual and contractual management fees and total expenses of the Expense Group and Expense Universe funds and discussed the results of the comparisons. The Board considered that the fund’s contractual management fee was below the Expense Group median, the fund’s actual management fee was at the Expense Group median and below the Expense Universe median and the fund’s total expense ratio was at the Expense Group median and above the Expense Universe median.
Dreyfus representatives reviewed with the Board the management or investment advisory fees (1) paid by funds advised or administered by Dreyfus that are in the same Lipper category as the fund and (2) paid to Dreyfus or the Subadviser or its affiliates for advising any separate accounts and/or other types of client portfolios that are considered to have similar investment strategies and policies as the fund (the “Similar Clients”), and explained the nature of the Similar Clients. They discussed differences in fees paid and the relationship of the fees paid in light of any differences in the services provided and other relevant factors. The Board considered the relevance of the fee information provided for the Similar Clients to evaluate the appropriateness of the fund’s management fee.
31
The Board considered the fee to the Subadviser in relation to the fee paid to Dreyfus by the fund and the respective services provided by the Subadviser and Dreyfus.
Analysis of Profitability and Economies of Scale. Dreyfus representatives reviewed the expenses allocated and profit received by Dreyfus and its affiliates and the resulting profitability percentage for managing the fund and the aggregate profitability percentage to Dreyfus and its affiliates for managing the funds in the Dreyfus fund complex, and the method used to determine the expenses and profit. The Board concluded that the profitability results were not unreasonable given the services rendered and service levels provided by Dreyfus. The Board also had been provided with information prepared by an independent consulting firm regarding Dreyfus’ approach to allocating costs to, and determining the profitability of, individual funds and the entire Dreyfus fund complex. The consulting firm also had analyzed where any economies of scale might emerge in connection with the management of a fund.
The Board considered on the advice of its counsel the profitability analysis (1) as part of its evaluation of whether the fees under the Agreements, considered in relation to the mix of services provided by Dreyfus and the Subadviser, including the nature, extent and quality of such services, supported the renewal of the Agreements and (2) in light of the relevant circumstances for the fund and the extent to which economies of scale would be realized if the fund grows and whether fee levels reflect these economies of scale for the benefit of fund shareholders. Dreyfus representatives stated that a discussion of economies of scale is predicated on a fund having achieved a substantial size with increasing assets and that, if a fund’s assets had been stable or decreasing, the possibility that Dreyfus may have realized any economies of scale would be less. Dreyfus representatives also stated that, as a result of shared and allocated costs among funds in the Dreyfus fund complex, the extent of economies of scale could depend substantially on the level of assets in the complex as a whole, so that increases and decreases in complex-wide assets can affect potential economies of scale in a manner that is disproportionate to, or even in the opposite direction from, changes in the fund’s asset level. The Board also considered potential benefits to Dreyfus and the Subadviser from acting as investment adviser and sub-investment adviser, respectively, and took into consideration the soft dollar arrangements in effect for trading the fund’s investments.
At the conclusion of these discussions, the Board agreed that it had been furnished with sufficient information to make an informed business decision with respect to the renewal of the Agreements. Based on the discussions and considerations as described above, the Board concluded and determined as follows.
• The Board concluded that the nature, extent and quality of the services provided by Dreyfus and the Subadviser are adequate and appropriate.
• The Board noted the Subadviser’s adherence to the fund’s investment strategy and the Subadviser’s general investment approach and the efforts by Dreyfus and the Subadviser to improve fund performance and agreed to continue to closely monitor performance.
INFORMATION ABOUT THE RENEWAL OF THE FUND’S INVESTMENT ADVISORY AND SUB-INVESTMENT ADVISORY AGREEMENTS (Unaudited) (continued)
32
• The Board concluded that the fees paid to Dreyfus and the Subadviser continued to be appropriate under the circumstances and in light of the factors and the totality of the services provided as discussed above.
• The Board determined that the economies of scale which may accrue to Dreyfus and its affiliates in connection with the management of the fund had been adequately considered by Dreyfus in connection with the fee rate charged to the fund pursuant to the Agreement and that, to the extent in the future it were determined that material economies of scale had not been shared with the fund, the Board would seek to have those economies of scale shared with the fund.
In evaluating the Agreements, the Board considered these conclusions and determinations and also relied on its previous knowledge, gained through meetings and other interactions with Dreyfus and its affiliates and the Subadviser, of Dreyfus and the Subadviser and the services provided to the fund by Dreyfus and the Subadviser. The Board also relied on information received on a routine and regular basis throughout the year relating to the operations of the fund and the investment management and other services provided under the Agreements, including information on the investment performance of the fund in comparison to similar mutual funds and benchmark performance indices; general market outlook as applicable to the fund; and compliance reports. In addition, the Board’s consideration of the contractual fee arrangements for this fund had the benefit of a number of years of reviews of the Agreements for the fund, or substantially similar agreements for other Dreyfus funds that the Board oversees, during which lengthy discussions took place between the Board and Dreyfus representatives. Certain aspects of the arrangements may receive greater scrutiny in some years than in others, and the Board’s conclusions may be based, in part, on their consideration of the fund’s arrangements, or substantially similar arrangements for other Dreyfus funds that the Board oversees, in prior years. The Board determined to renew the Agreements.
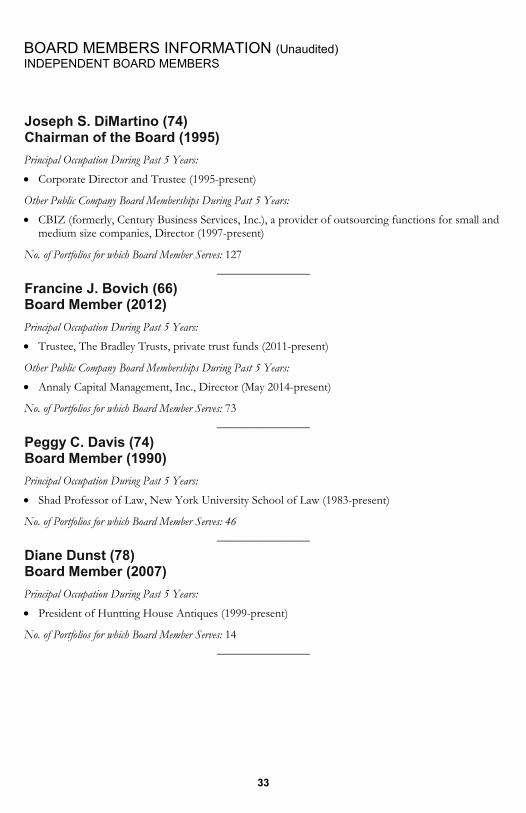
BOARD MEMBERS INFORMATION (Unaudited) INDEPENDENT BOARD MEMBERS
33
Joseph S. DiMartino (74) Chairman of the Board (1995) Principal Occupation During Past 5 Years: • Corporate Director and Trustee (1995-present)
Other Public Company Board Memberships During Past 5 Years: • CBIZ (formerly, Century Business Services, Inc.), a provider of outsourcing functions for small and
medium size companies, Director (1997-present)
No. of Portfolios for which Board Member Serves: 127 ———————
Francine J. Bovich (66) Board Member (2012) Principal Occupation During Past 5 Years: • Trustee, The Bradley Trusts, private trust funds (2011-present)
Other Public Company Board Memberships During Past 5 Years: • Annaly Capital Management, Inc., Director (May 2014-present)
No. of Portfolios for which Board Member Serves: 73 ———————
Peggy C. Davis (74) Board Member (1990) Principal Occupation During Past 5 Years: • Shad Professor of Law, New York University School of Law (1983-present)
No. of Portfolios for which Board Member Serves: 46 ———————
Diane Dunst (78) Board Member (2007) Principal Occupation During Past 5 Years: • President of Huntting House Antiques (1999-present)
No. of Portfolios for which Board Member Serves: 14 ———————

BOARD MEMBERS INFORMATION (Unaudited) (continued) INDEPENDENT BOARD MEMBERS (continued)
34
Nathan Leventhal (74) Board Member (1989) Principal Occupation During Past 5 Years: • President Emeritus of Lincoln Center for the Performing Arts (2001-present) • Chairman of the Avery Fisher Artist Program (1997-2014) • Commissioner, NYC Planning Commission (2007-2011)
Other Public Company Board Memberships During Past 5 Years: • Movado Group, Inc., Director (2003-present)
No. of Portfolios for which Board Member Serves: 47 ———————
Robin A. Melvin (54) Board Member (2012) Principal Occupation During Past 5 Years: • Co-chairman, Illinois Mentoring Partnership, non-profit organization dedicated to increasing the
quantity and quality of mentoring services in Illinois (2014-present; board member since 2013) • Director, Boisi Family Foundation, a private family foundation that supports
youth-serving organizations that promote the self sufficiency of youth from disadvantaged circumstances (1995-2012)
No. of Portfolios for which Board Member Serves: 101 ———————
Once elected all Board Members serve for an indefinite term, but achieve Emeritus status upon reaching age 80. The address of the Board Members and Officers is c/o The Dreyfus Corporation, 200 Park Avenue, New York, New York 10166. Additional information about the Board Members is available in the fund’s Statement of Additional Information which can be obtained from Dreyfus free of charge by calling this toll free number: 1-800-DREYFUS.
Clifford L. Alexander, Jr., Emeritus Board Member Ernest Kafka, Emeritus Board Member Jay I. Meltzer, Emeritus Board Member Daniel Rose, Emeritus Board Member Sander Vanocur, Emeritus Board Member
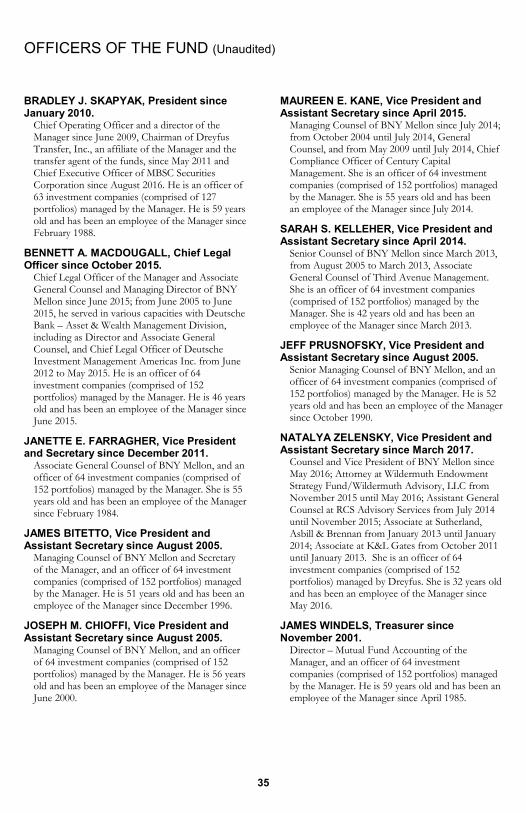
OFFICERS OF THE FUND (Unaudited)
35
BRADLEY J. SKAPYAK, President since January 2010.
Chief Operating Officer and a director of the Manager since June 2009, Chairman of Dreyfus Transfer, Inc., an affiliate of the Manager and the transfer agent of the funds, since May 2011 and Chief Executive Officer of MBSC Securities Corporation since August 2016. He is an officer of 63 investment companies (comprised of 127 portfolios) managed by the Manager. He is 59 years old and has been an employee of the Manager since February 1988.
BENNETT A. MACDOUGALL, Chief Legal Officer since October 2015.
Chief Legal Officer of the Manager and Associate General Counsel and Managing Director of BNY Mellon since June 2015; from June 2005 to June 2015, he served in various capacities with Deutsche Bank – Asset & Wealth Management Division, including as Director and Associate General Counsel, and Chief Legal Officer of Deutsche Investment Management Americas Inc. from June 2012 to May 2015. He is an officer of 64 investment companies (comprised of 152 portfolios) managed by the Manager. He is 46 years old and has been an employee of the Manager since June 2015.
JANETTE E. FARRAGHER, Vice President and Secretary since December 2011.
Associate General Counsel of BNY Mellon, and an officer of 64 investment companies (comprised of 152 portfolios) managed by the Manager. She is 55 years old and has been an employee of the Manager since February 1984.
JAMES BITETTO, Vice President and Assistant Secretary since August 2005.
Managing Counsel of BNY Mellon and Secretary of the Manager, and an officer of 64 investment companies (comprised of 152 portfolios) managed by the Manager. He is 51 years old and has been an employee of the Manager since December 1996.
JOSEPH M. CHIOFFI, Vice President and Assistant Secretary since August 2005.
Managing Counsel of BNY Mellon, and an officer of 64 investment companies (comprised of 152 portfolios) managed by the Manager. He is 56 years old and has been an employee of the Manager since June 2000.
MAUREEN E. KANE, Vice President and Assistant Secretary since April 2015.
Managing Counsel of BNY Mellon since July 2014; from October 2004 until July 2014, General Counsel, and from May 2009 until July 2014, Chief Compliance Officer of Century Capital Management. She is an officer of 64 investment companies (comprised of 152 portfolios) managed by the Manager. She is 55 years old and has been an employee of the Manager since July 2014.
SARAH S. KELLEHER, Vice President and Assistant Secretary since April 2014.
Senior Counsel of BNY Mellon since March 2013, from August 2005 to March 2013, Associate General Counsel of Third Avenue Management. She is an officer of 64 investment companies (comprised of 152 portfolios) managed by the Manager. She is 42 years old and has been an employee of the Manager since March 2013.
JEFF PRUSNOFSKY, Vice President and Assistant Secretary since August 2005.
Senior Managing Counsel of BNY Mellon, and an officer of 64 investment companies (comprised of 152 portfolios) managed by the Manager. He is 52 years old and has been an employee of the Manager since October 1990.
NATALYA ZELENSKY, Vice President and Assistant Secretary since March 2017.
Counsel and Vice President of BNY Mellon since May 2016; Attorney at Wildermuth Endowment Strategy Fund/Wildermuth Advisory, LLC from November 2015 until May 2016; Assistant General Counsel at RCS Advisory Services from July 2014 until November 2015; Associate at Sutherland, Asbill & Brennan from January 2013 until January 2014; Associate at K&L Gates from October 2011 until January 2013. She is an officer of 64 investment companies (comprised of 152 portfolios) managed by Dreyfus. She is 32 years old and has been an employee of the Manager since May 2016.
JAMES WINDELS, Treasurer since November 2001.
Director – Mutual Fund Accounting of the Manager, and an officer of 64 investment companies (comprised of 152 portfolios) managed by the Manager. He is 59 years old and has been an employee of the Manager since April 1985.
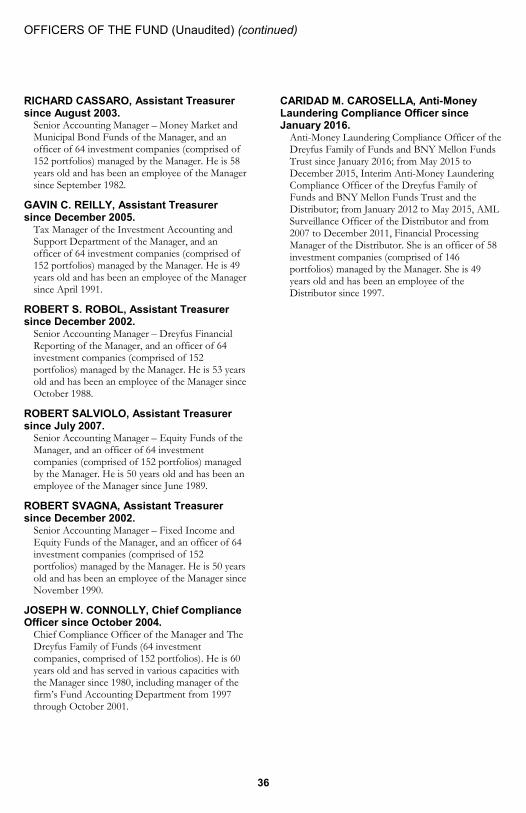
OFFICERS OF THE FUND (Unaudited) (continued)
36
RICHARD CASSARO, Assistant Treasurer since August 2003.
Senior Accounting Manager – Money Market and Municipal Bond Funds of the Manager, and an officer of 64 investment companies (comprised of 152 portfolios) managed by the Manager. He is 58 years old and has been an employee of the Manager since September 1982.
GAVIN C. REILLY, Assistant Treasurer since December 2005.
Tax Manager of the Investment Accounting and Support Department of the Manager, and an officer of 64 investment companies (comprised of 152 portfolios) managed by the Manager. He is 49 years old and has been an employee of the Manager since April 1991.
ROBERT S. ROBOL, Assistant Treasurer since December 2002.
Senior Accounting Manager – Dreyfus Financial Reporting of the Manager, and an officer of 64 investment companies (comprised of 152 portfolios) managed by the Manager. He is 53 years old and has been an employee of the Manager since October 1988.
ROBERT SALVIOLO, Assistant Treasurer since July 2007.
Senior Accounting Manager – Equity Funds of the Manager, and an officer of 64 investment companies (comprised of 152 portfolios) managed by the Manager. He is 50 years old and has been an employee of the Manager since June 1989.
ROBERT SVAGNA, Assistant Treasurer since December 2002.
Senior Accounting Manager – Fixed Income and Equity Funds of the Manager, and an officer of 64 investment companies (comprised of 152 portfolios) managed by the Manager. He is 50 years old and has been an employee of the Manager since November 1990.
JOSEPH W. CONNOLLY, Chief Compliance Officer since October 2004.
Chief Compliance Officer of the Manager and The Dreyfus Family of Funds (64 investment companies, comprised of 152 portfolios). He is 60 years old and has served in various capacities with the Manager since 1980, including manager of the firm’s Fund Accounting Department from 1997 through October 2001.
CARIDAD M. CAROSELLA, Anti-Money Laundering Compliance Officer since January 2016.
Anti-Money Laundering Compliance Officer of the Dreyfus Family of Funds and BNY Mellon Funds Trust since January 2016; from May 2015 to December 2015, Interim Anti-Money Laundering Compliance Officer of the Dreyfus Family of Funds and BNY Mellon Funds Trust and the Distributor; from January 2012 to May 2015, AML Surveillance Officer of the Distributor and from 2007 to December 2011, Financial Processing Manager of the Distributor. She is an officer of 58 investment companies (comprised of 146 portfolios) managed by the Manager. She is 49 years old and has been an employee of the Distributor since 1997.

NOTES
37
For More Information
Dreyfus Appreciation Fund, Inc. 200 Park Avenue New York, NY 10166 Investment Adviser The Dreyfus Corporation 200 Park Avenue New York, NY 10166 Sub-Investment Adviser Fayez Sarofim & Co. Two Houston Center Suite 2907 Houston, TX 77010
Custodian The Bank of New York Mellon 225 Liberty Street New York, NY 10286 Transfer Agent & Dividend Disbursing Agent Dreyfus Transfer, Inc. 200 Park Avenue New York, NY 10166 Distributor MBSC Securities Corporation 200 Park Avenue New York, NY 10166
Ticker Symbols: Investor: DGAGX Class I: DGIGX Class Y: DGYGX
Telephone Call your financial representative or 1-800-DREYFUS
Mail The Dreyfus Family of Funds, 144 Glenn Curtiss Boulevard, Uniondale, NY 11556-0144
E-mail Send your request to [email protected]
Internet Information can be viewed online or downloaded at www.dreyfus.com
The fund files its complete schedule of portfolio holdings with the Securities and Exchange Commission (“SEC”) for the first and third quarters of each fiscal year on Form N-Q. The fund’s Forms N-Q are available on the SEC’s website at www.sec.gov and may be reviewed and copied at the SEC’s Public Reference Room in Washington, D.C. (phone 1-800-SEC-0330 for information).
A description of the policies and procedures that the fund uses to determine how to vote proxies relating to portfolio securities and information regarding how the fund voted these proxies for the most recent 12-month period ended June 30 is available at www.dreyfus.com and on the SEC’s website at www.sec.gov and without charge, upon request, by calling 1-800-DREYFUS.
© 2018 MBSC Securities Corporation 0141AR1217