dredging productivity, draft engineering performance ... · pdf filedraft engineering...
TRANSCRIPT

Draft Engineering Performance StandardsPeer Review Copy
Part 3: Performance Standard for Dredging Productivity
October 2003
Prepared for:
U.S. Army Corps of Engineers, Kansas City DistrictUSACE Contract No. DACW41-02-D-0003 On Behalf of: U.S. Environmental Protection Agency, Region 2
Prepared by:
Malcolm Pirnie, Inc. 104 Corporate Park DriveWhite Plains, New York 10602
and
TAMS Consultants, Inc. an Earth Tech Company300 Broadacres DriveBloomfield, New Jersey 07003
Volume 3 of 4

Malcolm Pirnie/ TAMS-Earth Tech ES-1 Peer Review Draft - October 2003 Engineering Performance Standards Executive Summary
Draft Engineering Performance Standards – Peer Review Copy Hudson River PCBs Superfund Site
Executive Summary October 2003
In February 2002, the United States Environmental Protection Agency (USEPA) issued a Record of Decision (ROD) for the Hudson River PCBs Superfund Site (Site). The ROD calls for targeted environmental dredging of approximately 2.65 million cubic yards of PCB-contaminated sediment from the Upper Hudson River (approximately 40 river miles) in two phases over a six-year period, and monitored natural attenuation of the PCB contamination that remains in the river after dredging. In the ROD, USEPA identified five remedial action objectives, which are as follows:
• Reduce the cancer risks and non-cancer health hazards for people eating fish from the Hudson River by reducing the concentration of PCBs in fish;
• Reduce the risks to ecological receptors by reducing the concentration of PCBs in fish;
• Reduce PCB levels in sediments in order to reduce PCB concentrations in river (surface) water that are above applicable or relevant and appropriate requirements for surface water;
• Reduce the inventory (mass) of PCBs in sediments that are or may be bioavailable; and
• Minimize the long-term downstream transport of PCBs in the river. In selecting its cleanup remedy, USEPA required that performance standards for resuspension during dredging, production rates during dredging, and residuals after dredging (together called the “Engineering Performance Standards”) be established. This decision was made to address comments received from members of the public who expressed a wide spectrum of views on the project. Some suggested that the environmental dredging could “do more harm than good” and take much longer than stated, while others were concerned that the ROD was not sufficiently comprehensive in its requirements for the environmental cleanup. USEPA required these performance standards in its final cleanup decision to promote accountability and ensure that the cleanup meets the human health and environmental protection objectives set forth in the ROD.1 This document presents the draft Engineering Performance Standards for public review and comment. For each performance standard, it discusses the major ways performance is measured, the techniques used to assess performance, the supporting analyses for the
1 Other performance standards will address public concerns related to potential impacts of the cleanup on the surrounding community, such as air emissions, navigation, and noise. These are being developed separately.

Malcolm Pirnie/ TAMS-Earth Tech ES-2 Peer Review Draft - October 2003 Engineering Performance Standards Executive Summary
recommendations (including case studies), and some of the major interactions among the performance standards. Consistent with the ROD, the Engineering Performance Standards were developed in consultation with New York State, the National Oceanic and Atmospheric Administration and the U.S. Fish and Wildlife Service. (New York State is developing substantive water quality certification requirements for the environmental dredging pursuant to the federal Clean Water Act; USEPA will review the requirements when they become available for any implications with respect to the Engineering Performance Standards). USEPA’s consultants included a team of senior scientists and engineers who developed the standards, which then were reviewed by a separate team of recognized technical experts. General Electric Company reviewed a near-final version of the draft standards. Comments from these organizations were considered in preparing this Public Review Copy of the Draft Engineering Performance Standards. Following the close of the public comment period, the Draft Engineering Performance Standards were revised as appropriate and are now released to the public as this Draft Engineering Performance Standards – Peer Review Copy. The standards will be peer reviewed by a panel of independent experts, modified as appropriate to address the peer reviewers’ recommendations, and then implemented during the Phase 1 dredging. The results from the first season of dredging (Phase 1) will be used to evaluate the project’s progress compared to the assumptions in the ROD in order to determine whether there are any necessary adjustments to the dredging operations in the succeeding phase (Phase 2) or to the standards. The report evaluating the dredging with respect to the Phase 1 standards also will be peer reviewed. USEPA will use the peer reviewers’ recommendations to help determine whether the dredging plan is feasible in achieving the human health and environmental protection objectives of the ROD. The Engineering Performance Standards will be refined or adjusted, if necessary, for the remaining dredging seasons (Phase 2). Based on the analyses performed to develop the standards, USEPA believes that the standards are consistent with the human health and environmental protection objectives of the ROD. USEPA has determined:
• Compliance with the Resuspension Standard will limit the concentration of Total PCBs in river water one mile or more downstream of the dredging area to levels that are acceptable for potable water under the requirements of the Safe Drinking Water Act;
• Resuspension of PCBs in compliance with the Resuspension Standard will have a
negligible adverse effect on Tri+ PCB concentrations in Hudson River fish, as compared to a scenario assuming no dredging-related PCB releases;2
2 A negligible effect is defined, in this case, as a predicted Tri+ PCB concentration in Upper Hudson fish of 0.5 mg/kg or less, and in Lower Hudson River fish of 0.05 mg/kg or less, within 5 years after the completion of dredging in the Upper Hudson.

Malcolm Pirnie/ TAMS-Earth Tech ES-3 Peer Review Draft - October 2003 Engineering Performance Standards Executive Summary
• Compliance with the Control Level of the Resuspension Standard is expected to result in a Total PCB load (mass) transported downstream during remedial dredging that is similar to the range of Total PCB loads detected during recent baseline (i.e., pre-dredging) conditions, as documented by weekly measurements from 1996 to 2001;
• The Residuals Standard specified in the ROD (approximately 1 mg/kg Tri+ PCBs
prior to backfilling) is achievable based on case studies of other environmental dredging projects and can be applied in the Upper Hudson on an area-wide average basis;
• The Productivity Standard will result in completion of the dredging within the six
dredging seasons called for in the ROD, based on an example conceptual schedule for project implementation; and
• The three Draft Engineering Performance Standards, including their respective
monitoring programs, are achievable individually and in combination. The standards appropriately balance their points of interaction, allowing flexibility during design and implementation while ensuring protection of human health and the environment. For example, the requirements concerning additional dredging attempts in the Residuals Standard must consider the requirements for dredging production in the Productivity Standard.
A summary of each of the three Draft Engineering Performance Standards is presented below, followed by discussion of some of the major interactions among the Standards. Performance Standard for Dredging Resuspension Objectives The Performance Standard for Dredging Resuspension (i.e., Resuspension Standard) is designed to limit the concentration of PCBs in river water such that water supply intakes downstream of the dredging operations are protected, and to limit the downstream transport of PCB-contaminated dredged material. The attendant water quality monitoring program will be implemented to verify that the objectives of the Resuspension Standard have been met during dredging. The analytical results obtained from the water quality monitoring will be compared to the Resuspension Standard and associated lower action levels to monitor and control resuspension through appropriate actions. Such actions could include, as appropriate, expanding the monitoring program, notifying public water suppliers, implementing operational or engineering improvements, and, if necessary, temporarily halting the dredging.
Malcolm Pirnie/ TAMS-Earth Tech ES-4 Peer Review Draft - October 2003 Engineering Performance Standards Executive Summary
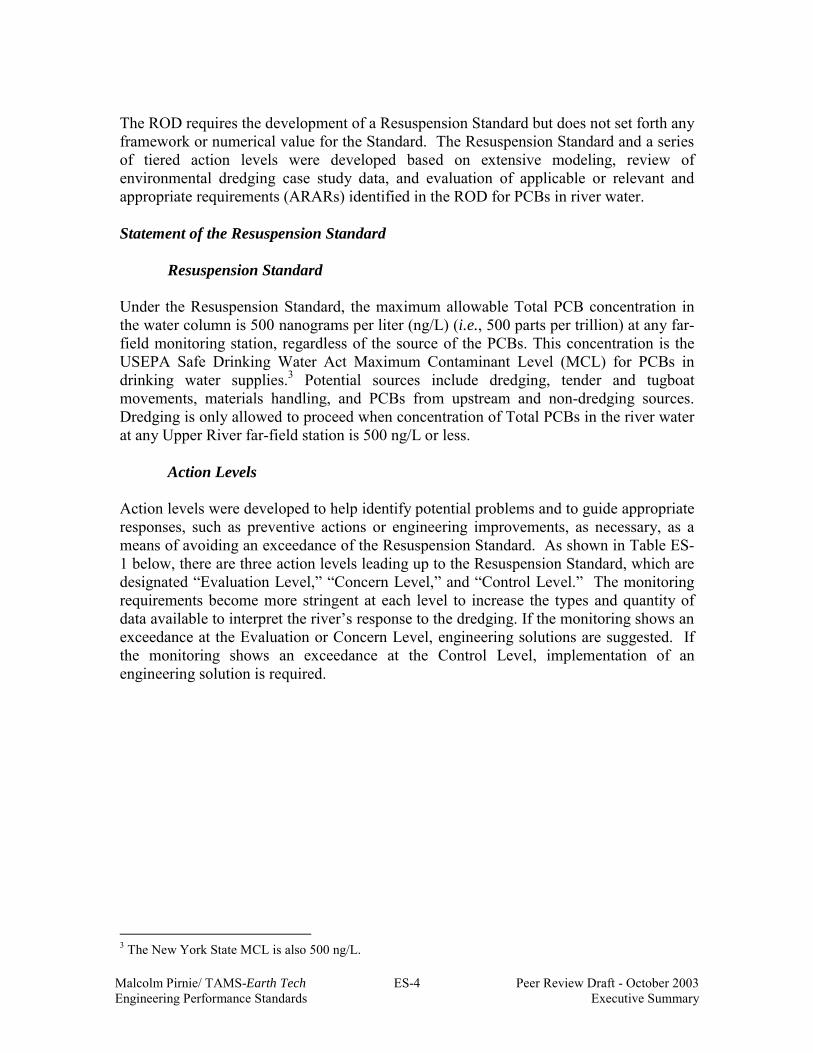
The ROD requires the development of a Resuspension Standard but does not set forth any framework or numerical value for the Standard. The Resuspension Standard and a series of tiered action levels were developed based on extensive modeling, review of environmental dredging case study data, and evaluation of applicable or relevant and appropriate requirements (ARARs) identified in the ROD for PCBs in river water. Statement of the Resuspension Standard
Resuspension Standard Under the Resuspension Standard, the maximum allowable Total PCB concentration in the water column is 500 nanograms per liter (ng/L) (i.e., 500 parts per trillion) at any far-field monitoring station, regardless of the source of the PCBs. This concentration is the USEPA Safe Drinking Water Act Maximum Contaminant Level (MCL) for PCBs in drinking water supplies.3 Potential sources include dredging, tender and tugboat movements, materials handling, and PCBs from upstream and non-dredging sources. Dredging is only allowed to proceed when concentration of Total PCBs in the river water at any Upper River far-field station is 500 ng/L or less.
Action Levels
Action levels were developed to help identify potential problems and to guide appropriate responses, such as preventive actions or engineering improvements, as necessary, as a means of avoiding an exceedance of the Resuspension Standard. As shown in Table ES-1 below, there are three action levels leading up to the Resuspension Standard, which are designated “Evaluation Level,” “Concern Level,” and “Control Level.” The monitoring requirements become more stringent at each level to increase the types and quantity of data available to interpret the river’s response to the dredging. If the monitoring shows an exceedance at the Evaluation or Concern Level, engineering solutions are suggested. If the monitoring shows an exceedance at the Control Level, implementation of an engineering solution is required.
3 The New York State MCL is also 500 ng/L.

Malcolm Pirnie/ TAMS-Earth Tech ES-5 Peer Review Draft - October 2003 Engineering Performance Standards Executive Summary
Table ES-1: Resuspension Standard and Action Levels
Action Level Parameter Required Action Evaluation Level
• 300 g/day Total PCB load or 100 g/day Tri+ PCB load as a 7-day running average (far-field)
• 100 mg/L 6-hour running average net suspended solids increase or average net increase in the daily dredging period if the dredging period is less than 6 hours (near-field, 300 m, River Sections 1 & 3)
• 60 mg/L 6-hour running average net suspended solids increase or average net increase in the daily dredging period if the dredging period is less than 6 hours (near-field, 300 m, River Section 2)
• 700 mg/L net suspended solids average 3-hour continuous (near field, 100 m and channel-side)
• 12 mg/L 6-hour running average net suspended solids increase or average net increase in the daily dredging period if the dredging period is less than 6 hours (far-field)
Monitoring Contingencies Engineering Evaluations (recommended) Engineering Solutions (recommended)
Concern Level
• 350 ng/L Total PCBs as a 7-day running average (far-field) • 600 g/day Total PCB load or 200 g/day Tri+ PCB load as a 7-day
running average (far-field) • 100 mg/L net suspended solids daily average for the dredging
period (greater than 6 hours) or 24 hours (near-field, 300 m, River Sections 1 & 3)
• 60 mg/L net suspended solids daily average for the dredging period (greater than 6 hours) or 24 hours (near-field, 300 m, River Section 2)
• 24 mg/L net suspended solids daily average for the dredging period (greater than 6 hours) or 24 hours (far-field)
Monitoring Contingencies Engineering Evaluations Engineering Solutions (recommended)
Control Level
• 350 ng/L Total PCBs as a 4-week running average (far-field) • 65 kg/year Total PCB or 22 kg/year Tri+ PCB load during the
Phase 1 dredging season (far-field) • 600 g/day Total PCB load or 200 g/day Tri+ PCB load as a 4-
week running average (far-field)
Monitoring Contingencies Engineering Evaluations Engineering Solutions
Resuspension Standard
500 ng/L Total PCBs (confirmed far-field occurrence) Temporarily Halt Dredging Monitoring Contingencies Engineering Evaluations Engineering Solutions
The Evaluation Level is based on PCB load (net mass loss) criteria and suspended solids concentrations. The PCB load criteria are 300 g/day Total PCBs (and 100 g/day Tri+ PCBs), which approximates the amount that could reasonably be distinguished from baseline conditions. These amounts are approximately three times the best engineering estimate of mass loss from the dredging operation at full production as reported in the ROD. The near-field suspended solids concentration criteria were derived for each River Section of the Upper Hudson to correspond to a far-field PCB concentration of 350 ng/L Total PCBs. There is a corresponding far-field suspended solids criterion derived for a far-field concentration of 500 ng/L Total PCBs, the Resuspension Standard. Consistent with the ROD, the Evaluation Level, Control Level and Concern Level each require the collection of site-specific data in Phase 1 that will be used to determine whether adjustment to the dredging operations or to the standards are needed in Phase 2. Once these data have been evaluated, it may be appropriate to eliminate the Evaluation Level in the Resuspension Standard for Phase 2.

Malcolm Pirnie/ TAMS-Earth Tech ES-6 Peer Review Draft - October 2003 Engineering Performance Standards Executive Summary
The Concern Level includes both a PCB concentration and load-based criteria. The concentration criterion is a seven-day running average exceedance of 350 ng/L Total PCBs (i.e., 70% of the 500 ng/L Resuspension Standard, which is a reasonable warning threshold). The load criteria are structured similarly, with a one-week exceedance of 600 g/day Total PCBs (and 200 g/day Tri+ PCBs). This daily load rate is based on a total project load of up to 650 kg Total PCBs over the duration of the dredging as estimated from various engineering and modeling analyses.4 The near-field suspended solids concentration criteria were derived for each River Section of the Upper Hudson to correspond to a far-field PCB concentration of 350 ng/L Total PCBs, but the threshold duration of the concentration criteria is longer. There is an associated far-field suspended solids criterion derived to correspond to a far-field PCB concentration at twice the Resuspension Standard (i.e., 1000 ng/L).5 The Control Level criteria for PCB concentration and load are similar in form to those for the Concern Level, but the threshold duration of the concentration criteria is increased. In this case, the concentration criterion is a four-week running average concentration of 350 ng/L Total PCBs. The load criteria, likewise, consist of a four-week exceedance of 600 g/day Total PCBs (and 200 g/day Tri+ PCBs). There are no increased suspended solids criteria associated with the Control Level (i.e., the Control Level is not triggered by suspended solids concentrations alone).
Near-field and Far-field Monitoring Stations The Resuspension Standard requires water quality monitoring at both “near-field” stations (located within a few hundred meters of the dredging operation) and “far-field” stations (to be established at fixed locations in the Upper and Lower Hudson River, primarily dams and bridges). Monitoring is required at all far-field stations during Phase 1 (two stations upstream of the project area, four stations in the Upper River, two stations in the Lower River and one station in the Mohawk River at Cohoes). The Resuspension Standard of 500 ng/L Total PCBs is applied to the PCB concentration data collected at any far-field station that is at least 1 mile downstream of the dredging area. The data collected at both near-field and far-field stations are compared to the action level criteria.
Water quality impacts that are detected only in the immediate dredging area, including within containment barriers that the Contractor may employ around the dredging area, are not covered by the Resuspension Standard. Some resuspension within the dredging areas is likely unavoidable regardless of the type of dredging equipment used, and is of concern only to the extent it transports PCBs downstream.
4 The daily rate is based on attainment of the recommended target cumulative volume as specified in the Productivity Standard, and should be prorated according to the production rate planned in the Production Schedule to be submitted annually to USEPA. 5 This higher level recognizes the high degree of uncertainty in the suspended solids measurement. Additional PCB sampling prompted by this level will be used to confirm compliance with the Resuspension Standard.
Malcolm Pirnie/ TAMS-Earth Tech ES-7 Peer Review Draft - October 2003 Engineering Performance Standards Executive Summary
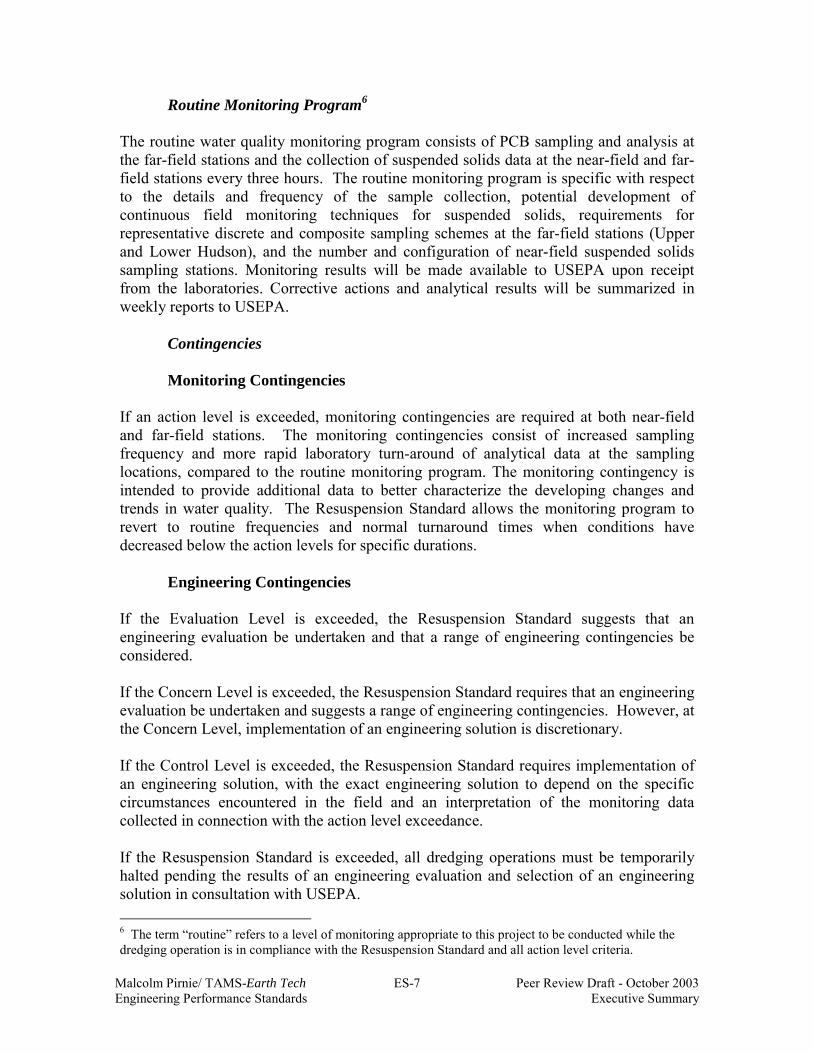
Routine Monitoring Program6
The routine water quality monitoring program consists of PCB sampling and analysis at the far-field stations and the collection of suspended solids data at the near-field and far-field stations every three hours. The routine monitoring program is specific with respect to the details and frequency of the sample collection, potential development of continuous field monitoring techniques for suspended solids, requirements for representative discrete and composite sampling schemes at the far-field stations (Upper and Lower Hudson), and the number and configuration of near-field suspended solids sampling stations. Monitoring results will be made available to USEPA upon receipt from the laboratories. Corrective actions and analytical results will be summarized in weekly reports to USEPA.
Contingencies
Monitoring Contingencies If an action level is exceeded, monitoring contingencies are required at both near-field and far-field stations. The monitoring contingencies consist of increased sampling frequency and more rapid laboratory turn-around of analytical data at the sampling locations, compared to the routine monitoring program. The monitoring contingency is intended to provide additional data to better characterize the developing changes and trends in water quality. The Resuspension Standard allows the monitoring program to revert to routine frequencies and normal turnaround times when conditions have decreased below the action levels for specific durations.
Engineering Contingencies
If the Evaluation Level is exceeded, the Resuspension Standard suggests that an engineering evaluation be undertaken and that a range of engineering contingencies be considered. If the Concern Level is exceeded, the Resuspension Standard requires that an engineering evaluation be undertaken and suggests a range of engineering contingencies. However, at the Concern Level, implementation of an engineering solution is discretionary. If the Control Level is exceeded, the Resuspension Standard requires implementation of an engineering solution, with the exact engineering solution to depend on the specific circumstances encountered in the field and an interpretation of the monitoring data collected in connection with the action level exceedance. If the Resuspension Standard is exceeded, all dredging operations must be temporarily halted pending the results of an engineering evaluation and selection of an engineering solution in consultation with USEPA. 6 The term “routine” refers to a level of monitoring appropriate to this project to be conducted while the dredging operation is in compliance with the Resuspension Standard and all action level criteria.

Malcolm Pirnie/ TAMS-Earth Tech ES-8 Peer Review Draft - October 2003 Engineering Performance Standards Executive Summary
The suggested engineering evaluations and solutions include examination of boat traffic patterns, additional evaluation of sediment pipelines for leaks, implementation or modification of silt barriers and may include, for the Control Level, temporarily halting the dredging operations.
Public Water Supply Monitoring and Contingencies
The Resuspension Standard provides for notification to downstream public water suppliers when the Total PCB concentration at the Waterford far-field station is predicted to be 350 ng/L or greater. The monitoring and notification required by the Resuspension Standard is in addition to monitoring and notification requirements that will be developed separately for the Community Health and Safety Plan for the remedial work activities.7
Supporting Analyses and Assumptions
A large number of analyses were conducted in developing the Resuspension Standard, including the action levels. Some of the most important analyses are summarized below.
Dissolved-Phase PCB Releases Case studies regarding environmental dredging projects provide different conclusions regarding the importance of dissolved-phase PCBs in the absence of a release of suspended solids. Some data from the Fox River in Wisconsin suggest that relatively large dissolved-phase releases of PCBs are possible during dredging without an associated release of contaminated sediments (suspended solids). In contrast, field measurements of dissolved and particle-associated PCBs collected during environmental dredging at the New Bedford Harbor site in Massachusetts suggest that dissolved phase PCB releases are not significant. In developing the Resuspension Standard, analyses were conducted to evaluate possible mechanisms for dissolved-phase PCB releases during dredging of the Upper Hudson. These analyses sought to consider the likelihood and magnitude of potential dissolved-phase effects. Potential releases of dissolved-phase PCBs, via 1) release of contaminated porewater from the dredged sediment surface and 2) a release of contaminated solids into the water column, were quantitatively modeled to estimate a range of potential PCB contaminant loads that could be experienced. The modeling indicated that the amount of dissolved-phase PCBs likely to be introduced into the system is relatively small compared to baseline concentrations (i.e., without dredging).
7 The ROD requires development of a Community Health and Safety Plan to protect the community, including persons in residences and businesses, from potential exposures as a direct result of remedial work activities. The Community Health and Safety Plan will provide for community notification of ongoing health and safety issues, monitoring of contaminants and protection of the community from physical and other hazards. The plan will include a section that outlines the actions to be followed should monitoring of contaminants show contaminant levels above certain levels to be identified in the plan.
Malcolm Pirnie/ TAMS-Earth Tech ES-9 Peer Review Draft - October 2003 Engineering Performance Standards Executive Summary
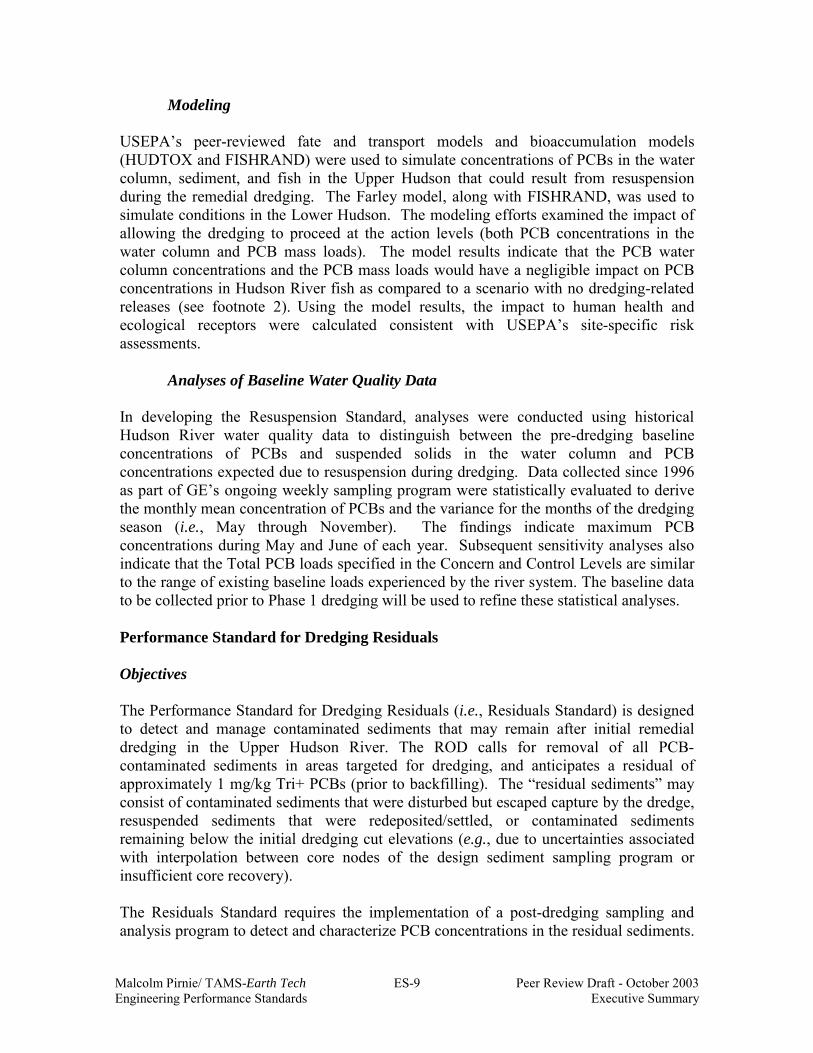
Modeling USEPA’s peer-reviewed fate and transport models and bioaccumulation models (HUDTOX and FISHRAND) were used to simulate concentrations of PCBs in the water column, sediment, and fish in the Upper Hudson that could result from resuspension during the remedial dredging. The Farley model, along with FISHRAND, was used to simulate conditions in the Lower Hudson. The modeling efforts examined the impact of allowing the dredging to proceed at the action levels (both PCB concentrations in the water column and PCB mass loads). The model results indicate that the PCB water column concentrations and the PCB mass loads would have a negligible impact on PCB concentrations in Hudson River fish as compared to a scenario with no dredging-related releases (see footnote 2). Using the model results, the impact to human health and ecological receptors were calculated consistent with USEPA’s site-specific risk assessments.
Analyses of Baseline Water Quality Data In developing the Resuspension Standard, analyses were conducted using historical Hudson River water quality data to distinguish between the pre-dredging baseline concentrations of PCBs and suspended solids in the water column and PCB concentrations expected due to resuspension during dredging. Data collected since 1996 as part of GE’s ongoing weekly sampling program were statistically evaluated to derive the monthly mean concentration of PCBs and the variance for the months of the dredging season (i.e., May through November). The findings indicate maximum PCB concentrations during May and June of each year. Subsequent sensitivity analyses also indicate that the Total PCB loads specified in the Concern and Control Levels are similar to the range of existing baseline loads experienced by the river system. The baseline data to be collected prior to Phase 1 dredging will be used to refine these statistical analyses. Performance Standard for Dredging Residuals Objectives
The Performance Standard for Dredging Residuals (i.e., Residuals Standard) is designed to detect and manage contaminated sediments that may remain after initial remedial dredging in the Upper Hudson River. The ROD calls for removal of all PCB-contaminated sediments in areas targeted for dredging, and anticipates a residual of approximately 1 mg/kg Tri+ PCBs (prior to backfilling). The “residual sediments” may consist of contaminated sediments that were disturbed but escaped capture by the dredge, resuspended sediments that were redeposited/settled, or contaminated sediments remaining below the initial dredging cut elevations (e.g., due to uncertainties associated with interpolation between core nodes of the design sediment sampling program or insufficient core recovery).
The Residuals Standard requires the implementation of a post-dredging sampling and analysis program to detect and characterize PCB concentrations in the residual sediments.

Malcolm Pirnie/ TAMS-Earth Tech ES-10 Peer Review Draft - October 2003 Engineering Performance Standards Executive Summary
The post-dredging sediment data are compared to the anticipated residual of approximately 1 mg/kg Tri+ PCBs stated in the ROD and a group of statistical action levels developed for the Residuals Standard. The approach to be taken to manage the residual sediments (including re-dredging) is then selected depending on the statistical analyses of the post-dredging data. The use of statistical analyses to evaluate environmental datasets is a scientifically accepted practice. Statement of the Residuals Standard
Sampling and Analysis
The Residuals Standard requires the collection of surface sediment samples following dredging and after USEPA has confirmed that the design cut-lines have been achieved. Based on engineering judgment, the dredging is assumed to proceed within work areas that are similar to the median size of the targeted areas identified in the ROD. Therefore, a 5-acre “certification unit” was considered for the post-dredging sampling program and the subsequent statistical evaluation of the post-dredging surface sediment data. The Residuals Standard specifies that each certification unit be sampled for compliance directly after it is dredged, so that appropriate actions can be taken as the project progresses. In each 5-acre certification unit, sediment samples representing the 0-6 inch depth interval below the dredged sediment surface are to be obtained from 40 grid nodes and analyzed for Tri+ PCBs. The analytical results from those samples will be compared to the action levels in the Residuals Standard, and the required actions taken.8
Action Levels and Required Responses
The Residuals Standard requires the review of: 1) the Tri+ PCB concentrations in all 40 individual sediment samples within each 5-acre certification unit, 2) the mean Tri+ PCB concentration of the certification unit, 3) the median Tri+ PCB concentration of the certification unit, and 4) the average of the mean Tri+ PCB concentrations of a 20-acre joint evaluation area (certification unit under review and the three units within 2 mile stretch of river). The following responses are required for Phase 1 of the dredging project. Adjustments may be made before finalizing the Residuals Standard for Phase 2 based on analyses of the post-dredging sediment data collected during Phase 1. For example, if justified, the joint evaluation area may be increased to 40 acres for Phase 2.
1. Backfill (where appropriate) and Demobilize: At certification units with an arithmetic
average residual concentration less than or equal to 1 mg/kg Tri+ PCBs, no sediment sample result greater than or equal to 27 mg/kg Tri+ PCBs, and not more than one sediment sample result greater than or equal to 15 mg/kg Tri+ PCBs, backfill (where appropriate) and demobilize from the certification unit.
8 The Residuals Standard does not preclude collection of samples from deeper intervals, which may be cost-effective.

Malcolm Pirnie/ TAMS-Earth Tech ES-11 Peer Review Draft - October 2003 Engineering Performance Standards Executive Summary
2. Jointly Evaluate 20-acre Area: At a certification unit with an arithmetic average
residuals concentration greater than 1 mg/kg Tri+ PCBs and less than or equal to 3 mg/kg Tri+ PCBs, no sediment sample result greater than or equal to 27 mg/kg Tri+ PCBs, and not more than one sediment sample result greater than or equal to 15 mg/kg Tri+ PCBs, jointly evaluate a 20-acre area.
For 20-acre evaluation, if the area-weighted arithmetic average of the individual means from the certification unit under evaluation and the 3 previously dredged certification units (within 2 miles of the current unit) is less than or equal to 1 mg/kg Tri+ PCBs, backfill may be placed (with subsequent testing required). Otherwise, the certification unit must be re-dredged (see #4 below for actions required during and following re-dredging) or a sub-aqueous cap constructed. Re-dredging or capping is to be conducted at the specific areas within the certification unit that are causing the non-compliant mean concentration. If the certification unit does not comply with #1 or #2, above, after two re-dredging attempts, contingency actions may be implemented in lieu of further re-dredging attempts, as described in #5, below.
3. Re-dredge or Construct Sub-aqueous Cap: At a certification unit with an arithmetic
average residuals concentration greater than 3 mg/kg Tri+ PCBs but less than or equal to 6 mg/kg Tri+ PCBs, no single sediment sample result is greater than or equal to 27 mg/kg Tri+ PCBs, and not more than one sediment sample result is greater than or equal to 15 mg/kg Tri+ PCBs, re-dredge or construct a sub-aqueous cap. The choice of two options is provided to maintain flexibility and productivity (e.g., some areas may not be conducive to dredging). If re-dredging is chosen, the surface sediment of the re-dredged area must be sampled and the certification unit re-evaluated. If the certification unit does not meet the objectives of #1 or #2, above, following two re-dredging attempts, contingency actions may be implemented in lieu of further re-dredging attempts, as described in #5, below.
4. Re-dredging Required: For areas of elevated Tri+ PCB concentrations within a
certification unit with an arithmetic average residuals concentration greater than 6 mg/kg Tri+ PCBs or to address individual sampling point(s) with concentrations greater than or equal to 27 mg/kg Tri+ PCBs or more than one sampling point with concentrations greater than or equal to 15 mg/kg Tri+ PCBs, re-dredging is required.
Sampling at depths greater than 6 inches will be triggered by an arithmetic average residual concentration of greater than 6 mg/kg Tri+ PCBs. The spatial extent of this sampling at greater depth will be determined by the median Tri+ PCB concentration. If the median concentration in the certification unit is greater than 6 mg/kg Tri+ PCBs, collection and analysis of additional sediment samples is required from deeper intervals over the entire certification unit (e.g., 6-12 inch, 12-18 inch, etc.) as necessary to re-characterize the vertical extent of PCB contamination. If the median concentration is 6 mg/kg Tri+ PCBs or less, characterization of the vertical extent of contamination is required only in the areas within the certification unit that are

Malcolm Pirnie/ TAMS-Earth Tech ES-12 Peer Review Draft - October 2003 Engineering Performance Standards Executive Summary
contributing to the non-compliant mean concentration. Additional sampling to characterize the vertical extent of contamination is contemplated only once.
The Residuals Standard provides a mechanism for calculating the horizontal extent of re-dredging. All re-dredging attempts are to be designed to reduce the mean Tri+ PCB concentration of the certification unit to 1 mg/kg Tri+ PCBs or less. If after two re-dredging attempts, the arithmetic average Tri+ PCB concentration in the surface sediment still is greater than 1 mg/kg, then contingency actions are to be implemented as stated in #5, below.
5. Contingency Actions: At areas where two re-dredging attempts do not achieve
compliance with the residuals criteria, as verified by USEPA, construct an appropriately designed sub-aqueous cap, where conditions allow.
A flow chart illustrating implementation of the Performance Standard for Dredging Residuals is shown in Figure ES-1. The flow chart options are summarized in Table ES-2.
TABLE ES-2
SUMMARY OF DRAFT RESIDUALS STANDARD
Case
Certification Unit Mean
(mg/kg Tri+ PCBs)
No. of Sample Results where
27 > result >15 mg/kg Tri+ PCBs
No. of
Sample Results
> 27 mg/kg Tri+ PCBs
No. of Re-Dredging Attempts
Conducted
Required Action (when all conditions are met)*
A xi ≤ 1 ≤ 1 0 N/A Backfill certification unit (where appropriate); no testing of backfill required.
B N/A > 2 N/A < 2 Redredge sampling nodes and re-sample. C N/A N/A 1 or more < 2 Redredge sampling node(s) and re-sample. D 1 < xi < 3 ≤ 1 0 N/A Evaluate 20-acre average concentration. If 20-
acre average concentration < 1 mg/kg Tri+ PCBs, place and sample backfill. If 20-acre average concentration > 1 mg/kg, follow actions for Case E below.
E 3 < xi < 6 ≤ 1 0 < 2 Construct sub-aqueous cap immediately OR re-dredge.
F xi > 6 N/A N/A 0 Collect additional sediment samples to re-characterize vertical extent of contamination and re-dredge. If certification unit median > 6, entire certification unit must be sampled for vertical extent. If certification unit median < 6, additional sampling required only in portions of certification unit contributing to elevated mean concentration.
G xi > 6 N/A N/A 1 Re-dredge. H xi > 1 (and
20-acre average > 1)
> 2 > 1 2 Construct sub-aqueous cap (if any of these mean/sample result conditions are true) and two re-dredging attempts have been conducted OR choose to continue to re-dredge.
*Except for Case H, where any of the listed conditions will require cap construction.

Malcolm Pirnie/ TAMS-Earth Tech ES-13 Peer Review Draft - October 2003 Engineering Performance Standards Executive Summary
Preference for Dredging The selected remedy includes dredging of contaminated sediment, using PCB inventory as the primary means to target removal areas. The Residuals Standard of approximately 1 mg/kg Tri+ PCBs (prior to backfilling) is achievable based on case studies of other environmental dredging projects and can be applied on an area-wide average basis. However, review of case studies also indicates that, for some isolated areas, residual concentrations subsequent to the initial dredging attempt may exceed the 1 mg/kg Tri + PCB standard. The non-compliant residuals will likely be associated with difficult-to-dredge bottom conditions such as bedrock outcrops and boulder fields. As a result, in limited areas of the Upper Hudson River, it may be difficult to achieve the Residuals Standard. The capping contingency was added as an option to address this scenario. Capping of the existing PCB inventory was assessed as a remedial action alternative in the 2000 Feasibility Study, but was not selected as the most appropriate remedy, largely because it does not provide the same degree of reliability as dredging. This finding was due to the potential for defects or damage to the cap, thereby reducing its effectiveness relative to dredging while still requiring the sediment handling, processing, and disposal activities needed for dredging. The option for capping allowed in the Residuals Standard differs significantly from the remedial action alternative that was evaluated in the Feasibility Study in that the design dredging cut lines must be met and the targeted PCB inventory removed before this option can be considered (i.e., the capping contingency in the Residuals Standard is not a stand-alone remedial action alternative). Capping performed under the Residuals Standard would not be used to sequester significant PCB inventory and, because the mass of PCBs to be isolated is greatly reduced, the reliability of a cap placed for the purpose of isolating residual contamination is less critical. Were the cap breached in this situation, the potential spread of contamination would be much less because of the much lower contaminant mass and potential for mixing (dilution) with the surrounding capping material. Although application of a sub-aqueous cap has been added as an option in the Residuals Standard, there is a decided preference for dredging alone. Capping is less reliable for long-term control than dredging, and there are long-term operation and maintenance requirements associated with capping. Factors for deciding if an area should be capped and preparation of the site-specific cap design must include the river conditions (sediment texture, water depth, location in the channel, compatibility with habitat, etc.) as well as cost and impact on productivity. The option for capping is not meant to compensate for any deficiency in the dredging design or operations. USEPA will be fully apprised of the decision-making for areas to be capped in accordance with the requirements of the Standard as represented in Figure ES-1. Through the required submittal of Certification Unit-specific closure reports, USEPA will review the residual sampling data collected for the areas, confirm that the dredging cut lines have been met, review field notes, and review and approve each site-specific cap design. A limit on the amount of area that can be capped without obtaining approval from USEPA may be added to the standard for Phase 2, based on information gathered during Phase 1.
Malcolm Pirnie/ TAMS-Earth Tech ES-14 Peer Review Draft - October 2003 Engineering Performance Standards Executive Summary
Supporting Analyses and Assumptions
Certification Unit Sample Size and Sampling Grid
USEPA’s 2002 “Guidance for Choosing a Sampling Design for Environmental Data Collection” provides methods to determine the number of samples required to estimate the mean contaminant concentration of a given area. Evaluation of the 1984 Upper Hudson River sediment data (which is the most comprehensive to date), case study residuals data from other environmental dredging projects, and USEPA statistical guidance supported the use of 40 samples to characterize each 5-acre certification unit.
The 40 samples are to be collected from a regular triangular grid, which equates to a sample spacing of approximately 80 feet. The residuals sampling grid is to be offset from the design support sediment sampling grid by 40-60 percent of the grid spacing. Criteria for relocating sampling points, when necessary, are provided in the Residuals Standard. The Residuals Standard accommodates the application of the sampling grid to certification units that differ in size from the conceptual 5-acre unit. This flexibility is provided to address circumstances in which the remedial dredging may result in certification units of varying sizes (e.g., due to the installation of silt barriers, if used).
Action Level Development
The action levels originated with the statement in the ROD that anticipates a residual in dredged areas of approximately 1 mg/kg Tri+ PCBs (before backfilling). Statistical thresholds were developed to evaluate residuals sampling data and trigger responses, a common scientifically accepted practice for interpreting environmental data. The thresholds consist of action levels for the area-weighted mean concentration (upper confidence limits, or UCLs) and action levels for individual sample results (prediction limits, or PLs). Both UCLs and PLs are measures of the probability that a sample result belongs to a sample population that has a specific mean; consistent with the ROD, the desired mean for Upper Hudson River residuals is 1 mg/kg Tri+ PCBs or less).
Since no residual sediment data exist for the Upper Hudson River (and will not exist until after remedial dredging is initiated), UCLs and PLs were calculated based on residual sediment data from other environmental dredging projects. The values derived for the Residuals Standard are: 3 mg/kg Tri+ PCBs (95% UCL), 6 mg/kg Tri+ PCBs (99% UCL), 15 mg/kg Tri+ PCBs (97.5% PL), and 27 mg/kg Tri+ PCBs (99% PL). These criteria are used to evaluate the degree to which the residual of approximately 1 mg/kg Tri+ PCBs specified in the ROD is attained in a particular certification unit, and to trigger appropriate actions for managing residual sediments.
Requirement for Collection of Additional Core Samples
The Residuals Standard requires the collection of additional sediment samples where the initial mean Tri+ PCB concentration (0-6 inch interval) for the certification unit is greater than 6 mg/kg. Residual sediments with a Tri+ PCB concentration above the 99% UCL

Malcolm Pirnie/ TAMS-Earth Tech ES-15 Peer Review Draft - October 2003 Engineering Performance Standards Executive Summary
indicates the dredge was still removing material from a contaminated stratum. In this case, it is possible that additional contaminated sediment “inventory” remains to be removed. The median concentration is used as a criterion to determine whether deeper sediment samples (e.g., 6-12 inch, 12-18 inch, etc. as necessary to define the vertical extent of contamination) must be collected from all 40 sampling points in the certification unit or, as appropriate, from smaller sub-areas where isolated or clustered elevated nodes are causing the mean concentration to exceed the requirements of the standard. Following the collection and evaluation of the deeper sediment samples, new cut-lines must be established and re-dredging conducted to reduce the residual concentrations.
Required Number of Re-dredging Attempts
To maintain dredging productivity, and noting that case studies of other environmental dredging projects report diminishing returns for successive re-dredging in an attempt to obtain the remedial objectives, the number of required re-dredging attempts was set at two attempts. Re-dredging attempts are dredging efforts conducted to reduce residual concentrations, and by definition occur subsequent to the USEPA’s confirmation of attainment of the initial design cut elevations to remove inventory. The Construction Manager may also choose to conduct additional re-dredging attempts, based on cost considerations or knowledge of the dredging area, with the intent of reducing the mean Tri+ PCB concentration in the certification unit to 1 mg/kg or less Tri+ PCBs.9 Based on the Phase 1 results and the second peer review, USEPA may modify the required number of redredging attempts (or the triggers for engineering contingencies and capping, described below).
Engineering Contingencies and Capping
In the event that the dredging operations after two or more dredging attempts cannot achieve the Residuals Standard of a mean concentration of 1 mg/kg Tri+ PCBs or less, engineering contingencies must be implemented, including the construction of a sub-aqueous cap, where conditions permit, over the recalcitrant area to address the residual PCB contamination.
Where further dredging is not practicable, the sub-aqueous cap is intended to support recovery of the Hudson River ecosystem following removal of inventory, similar to the function of the backfill. The type of backfill and capping material will vary to account for the river conditions and ecological setting. This will be an important consideration for the remedial design with regard to habitat issues, and may require the design of multi-layer caps that address both residuals isolation and habitat recovery. The installation of a sub-aqueous cap is likely to further reduce residual concentrations of PCBs and may require additional dredging to accommodate the cap thickness. While not expected, should conditions encountered in the navigation channel require the installation 9 This option is limited to circumstances where no project delays affecting the ability to meet the Productivity Standard will be incurred.

Malcolm Pirnie/ TAMS-Earth Tech ES-16 Peer Review Draft - October 2003 Engineering Performance Standards Executive Summary
of a sub-aqueous cap, sufficient dredging may be required to install the cap and an upper, armored layer below the navigation depth. The armored layer would act as an indicator during future navigational dredging in the channel to prevent damage to the cap. In order to avoid delays to the remediation, prototype capping specifications for typical river conditions and ecological settings will need to be developed during the remedial design phase. These prototypes can then be readily customized for the situations encountered during remediation. General cap design criteria and relevant USEPA and USACE guidance documents for cap design are identified in the Residuals Standard. The specific design details of the capping contingency are to be addressed in the design phase of the Hudson River PCBs Site remediation. USEPA will review the submitted design for conformance with the requirements of the ROD and the engineering performance standards. The cost of cap construction and maintenance should be balanced by the Construction Manager, in consultation with USEPA, against the cost of additional re-dredging attempts and their respective impacts on the schedule. Following the completion of Phase 1, the areas capped (if any) during Phase 1 will be evaluated to review the decisions that were made given river conditions in the capped areas and impacts on productivity. Using the information gathered during Phase 1 and the data gathered during the design sampling (e.g., subbottom profiling results), a limit on the amount of area that can be capped without prior approval from USEPA may be added to the standard for Phase 2, if warranted.
Joint Evaluations and Backfill Testing
The concept of a 20-acre joint evaluation was developed to maintain flexibility where the mean residual concentrations in selected 5-acre certification units are only slightly higher than 1 mg/kg Tri+ PCBs. The size of the joint evaluation area was chosen based on USEPA’s peer-reviewed fate, transport and bioaccumulation models for the Upper Hudson River (HUDTOX and FISHRAND), which were used to evaluate recovery of the Upper Hudson following remediation. The models used river segments in the Thompson Island Pool that are similar in size to the 20-acre joint-evaluation areas. The benefits of targeted remedial dredging projected by the USEPA models hold if the mean residuals concentration is 1 mg/kg Tri+ PCBs or less on average, over 20-acre areas.
If a certification unit has a mean residuals concentration of greater than 1 mg/kg Tri+ PCBs but less than or equal to 3 mg/kg Tri+ PCBs, and the average concentration in the 20-acre joint evaluation area that contains the certification unit is 1 mg/kg Tri+ PCBs or less, backfill may be placed without a re-dredging attempt. In this case, testing of the backfill after placement is required.
The backfill testing is to be accomplished by collecting surface sediment samples (0-6 inches) of the backfill after it is placed, using the same grid spacing used for the residual sediment sampling. Each 0-6 inch backfill sample is to be analyzed for PCBs. The mean concentration of PCBs in the backfill samples must be 0.25 mg/kg Tri+ PCBs or less. If

Malcolm Pirnie/ TAMS-Earth Tech ES-17 Peer Review Draft - October 2003 Engineering Performance Standards Executive Summary
this criterion is not met, the non-compliant areas of the backfill layer must be removed via dredging, replaced, and retested until the criterion is achieved. Alternately, in some areas it may be possible to place additional backfill material. However USEPA approval is required for this option. Performance Standard for Dredging Productivity Objective The Performance Standard for Dredging Productivity (i.e., Productivity Standard) is designed to monitor and maintain the progress of the dredging to meet the schedule stated in the ROD. The project schedule stated in the ROD has a six-year duration and consists of the first dredging season designated “Phase 1” (initial dredging at a reduced scale) followed by five dredging seasons collectively designated “Phase 2” (each with dredging at full production to remove the remainder of the contaminated sediments identified for removal). The Productivity Standard specifies the cumulative volume of sediment to be dredged during each dredging season, based on the current estimate of 2.65 million cubic yards of sediment to be removed.
Statement of the Productivity Standard
Required and Recommended Cumulative Annual Dredging Volumes The Productivity Standard requires compliance with minimum cumulative volumes of sediment for each dredging season and targets larger volumes for the first five dredging seasons, as provided in Table ES-3 below. The minimum cumulative volume of sediment to be removed, processed and shipped off-site by the end of each dredging season is the quantity shown in the “Required Cumulative Volume” column. The targeted cumulative volumes allow for the work to be designed for completion at a somewhat faster rate, so that a reduced volume remains in the sixth and final dredging season. This recommended approach provides additional time to address any unexpected difficulties within the schedule called for in the ROD. The targeted cumulative dredging volumes are shown in the “Target Cumulative Volume” column.

Malcolm Pirnie/ TAMS-Earth Tech ES-18 Peer Review Draft - October 2003 Engineering Performance Standards Executive Summary
Table ES-3: Productivity Requirements and Targets
Dredging Season(1) Required Cumulative Volume (cubic yards)
Target Cumulative Volume (cubic yards)
Phase 1 (Year 1) Approx. 240,000 265,000 Phase 2 (Year 2) 720,000 795,000 Phase 2 (Year 3) 1,200,000 1,325,000 Phase 2 (Year 4) 1,680,000 1,855,000 Phase 2 (Year 5) 2,160,000 2,385,000 Phase 2 (Year 6) 2,650,000(2) 2,650,000(2)
(1) The overall completion schedule, if appropriate, should be adjusted to be consistent with the total volume of sediment to be dredged as determined by USEPA during remedial design (for example, based on the findings of the design support sediment characterization program). (2) Represents total estimated in-situ volume to be removed as per the ROD, exclusive of any amounts generated by re-dredging to meet the Residuals Performance Standard.
Monitoring and Recordkeeping
The Productivity Standard requires the Contractor managing the dredging project to track and report progress to the USEPA. The recordkeeping, in addition to and as verified by USEPA or its representatives in the field, will become the basis for measuring compliance with the Productivity Standard By March 1 of each year, the Contractor shall provide USEPA with a schedule showing cumulative volumes planned to be removed each month during the upcoming dredging season (i.e., Production Schedule). The production schedule should consider the targeted cumulative volumes and must meet or exceed the requirements of the Productivity Standard (or as revised in accordance with USEPA-approved design documents). Monthly and annual productivity progress reports shall be submitted to USEPA. Monthly productivity progress reports will be compared to the production schedule submitted by the Contractor and will be the primary tool for assessing whether the project is on schedule. Annual production progress reports, prepared at the conclusion of each dredging season, will be used to evaluate compliance with the Productivity Standard.
The monthly and annual reports will summarize daily records of the dredging locations, approximate production and number of operating hours of operation for each dredge, estimates of in-situ sediment volumes removed, and the weight of dewatered sediments and estimated mass of PCBs shipped off-site.

Malcolm Pirnie/ TAMS-Earth Tech ES-19 Peer Review Draft - October 2003 Engineering Performance Standards Executive Summary
Action Levels and Required Responses
The Productivity Standard’s action levels and responses are summarized in Table ES-4 below.
Table ES-4: Action Levels and Required Responses Action Level
Description
Response
Concern Level
Monthly production rate falls 10% below scheduled rate.
Notify USEPA and take immediate steps to erase shortfall in production over next two months.
Control Level
Production falls below scheduled production by 10% or more for two or more consecutive months.
Submit an action plan explaining the reasons for the production shortfall and describing the engineering and management actions taken or underway to increase production and erase shortfall by end of the dredging season.
Standard Annual cumulative volume fails to meet required production requirements.
Action to be determined by USEPA.
In any dredging season, if the planned monthly cumulative production falls below the scheduled amount by 10 percent or more, the Contractor shall identify the cause of the shortfall to USEPA and take immediate steps (adding equipment and crews, working extended hours, modifying the plant and equipment or approach to the work, or other) to erase the cumulative shortfall over the following two months or by the end of the dredging season, whichever occurs sooner. Any steps taken to increase production shall conform to all other Performance Standards established for the project. Significant changes to operating procedures or equipment, such as use of an entirely different dredging technology or means of processing the dredged sediments prior to shipment, will require USEPA approval. If the monthly productivity falls below the scheduled productivity by 10 percent or more for two or more consecutive months, the Contractor shall provide a written action plan to the USEPA explaining the reasons for the production shortfall and describing the engineering and management steps taken or underway to erase the shortfall in production during that dredging season. If an annual production shortfall occurs, USEPA will determine the appropriate action to address non-compliance with the Productivity Standard. USEPA will also evaluate the circumstances that led to the annual shortfall, if encountered, when assessing compliance.

Malcolm Pirnie/ TAMS-Earth Tech ES-20 Peer Review Draft - October 2003 Engineering Performance Standards Executive Summary
Supporting Analyses and Assumptions
Conceptual Project Schedule To evaluate the feasibility of the required and target cumulative annual volumes specified in the Productivity Standard (refer to Table ES-3), a detailed conceptual critical path schedule was developed using Primavera Systems, Inc. software. A number of conservative assumptions were made regarding means and methods that could be used during the dredging project in order to demonstrate that the Productivity Standard is achievable. The Productivity Standard, however, does not require that the remedial design adhere to the assumptions and work sequence used to develop the Productivity Standard conceptual schedule. The schedule output indicates that both the required and the target cumulative volumes developed for the Productivity Standard are reasonable and achievable. Selected examples of the supporting analyses and assumptions used to develop the schedule are summarized below.
Removal Volume
The Productivity Standard is based on the removal of approximately 2.65 million cubic yards of sediment, as stated in the ROD. This volume may be revised upward or downward based on the results of the design support sediment characterization program. The Productivity Standard requires adjustment if the final targeted dredging volume differs by more than 10% from the current estimate.
Construction Schedule and Dredging Season
The Productivity Standard is based on a construction period for the project of six (6) years (including Phases 1 and 2, as stated in the ROD) and assumes that there will be a minimum of 30 weeks available each year to conduct dredging operations, unconstrained by any work hours limitations. To implement this schedule, coordination would be required with the New York State Canal Corporation to extend their routine hours and season of operation.
Dredging Equipment
Both mechanical and hydraulic dredges were considered during the development of the conceptual schedule. Smaller specialty equipment was also considered for use near shorelines, in shallow water, and in difficult locations (such as shallow bedrock areas). Estimated dredging volumes were developed by river section and dredge type for the schedule. The conceptual schedule included only the use of a mechanical dredge as a conservative approach, since mechanical dredging is typically a slower process. The schedule assumes that dredging can take place in multiple river sections simultaneously, with the dredging generally progressing from upstream to downstream within each river section.
Malcolm Pirnie/ TAMS-Earth Tech ES-21 Peer Review Draft - October 2003 Engineering Performance Standards Executive Summary
Work Elements and Sequence
The conceptual schedule assumptions address the potential elements and sequence of the dredging work. The assumptions include, but are not limited to, the following: • Silt barriers, while not required by the Productivity Standard, were assumed to be
installed for all dredging work outside the navigation channel. The assumed silt barriers consist of segments of steel sheet piling installed at the upstream and downstream limits of the work area, connected by high density polyethylene (HDPE) curtains with floatation booms and weighted at the bottom. This assumption is conservative with respect to the schedule, which accounts for the time necessary to install and remove the silt barriers.
• Silt barriers are removed only after backfill and shoreline stabilization where
appropriate, has been completed. • Backfilling and shoreline stabilization at each area dredged in a particular season
is completed prior to demobilization at the end of each dredging season. • Work is conducted in a generally upstream to downstream sequence within a
given river section.
Sediment Processing/Transfer Facility The conceptual schedule of the Productivity Standard assumed the establishment of one land-based sediment processing/transfer facility, located at the northern extreme of the 40-mile long project area. Conceptual design calculations were prepared regarding railroad sidings, transportation of scows loaded with dredged sediments via the canal system, and other transportation issues to evaluate whether the dredged sediment volumes to be removed could be transferred, processed (e.g., dewatered), and shipped off-site at an appropriate rate (compared to the required and target production rates). The assumption of one facility was made to be conservative with respect to the schedule, in that it requires sufficient time for sediments removed from any location within the Upper Hudson to be transported to one location. A less conservative assumption would entail two facilities, as was assumed for purposes of evaluating engineering feasibility of the remedy. Note, however, that the assumption does not reflect a worst case based on available information, which would be one facility at or below the southern extreme of the project area. Interactions Among Performance Standards The development of the Performance Standards included consideration of the degree to which they are interrelated. Some of the major points of interaction between the Standards, and issues identified as being significant to the compliance with all the

Malcolm Pirnie/ TAMS-Earth Tech ES-22 Peer Review Draft - October 2003 Engineering Performance Standards Executive Summary
standards, are summarized below. The design of the project should be optimized in consideration of these interactions. • The Resuspension Standard controls PCB mass loss during dredging. It is
important to note that PCB mass loss is intrinsically linked to dredging productivity, in that ongoing project activities (dredging, vessel traffic, installation and removal of barriers, if used, and debris removal) will contribute to PCB mass loss. The Resuspension Standard Concern Level and Control Level are triggered if the average daily Total PCB mass loss exceeds 600 g/day for more than a one-week, or four-week stretch, respectively.10 Non-compliance with the Productivity Standard beyond the six (6) year schedule will increase the total project PCB mass loss. If unforeseen difficulties require extensions to the schedule, the daily allocation of PCB mass loss will have to be commensurately lowered during the remainder of the dredging project to maintain the PCB mass loss of 650 kg upon which the Resuspension Standard action levels are based. Achievement of the target cumulative annual volumes in the Productivity Standard is strongly encouraged to minimize the total project-related downstream transport of PCBs.
• Balancing the limits on PCB concentrations in the water column in the
Resuspension Standard and the cumulative annual volumes in the Productivity Standard requires careful planning during equipment deployment considering, for example, the impacts of the number and types of equipment selected, location of dredging areas, and the monthly baseline variation in PCB water column concentrations. This is an area where Phase 1 monitoring is expected to contribute significantly to the understanding of how to efficiently proceed with dredging and maintain compliance with the Performance Standards.
• The Residuals Standard requires characterization of residual sediments, which
may include redeposited/settled sediments. To avoid recontamination of a satisfactorily completed certification unit, the Productivity Standard assumes that dredging generally will proceed from upstream to downstream within each River Section. The Resuspension Standard modeling also indicates that the dredge may create a deposit of resuspended sediments slightly downstream of each dredging area, providing further incentive for work to proceed generally from upstream to downstream.
• The Productivity Standard includes a conceptual sequence of work and schedule
for the dredging work to validate the feasibility of the required and target cumulative annual dredging volumes. The conceptual sequence of work and schedule necessarily included, among other elements, the time needed to comply with the requirements of the Residual Standard for sampling and analysis of each certification unit, possibly two re-dredging attempts and/or sub-aqueous cap
10 The daily rate is based on attainment of the recommended target cumulative volume as specified in the Productivity Standard, and should be prorated according to the production rate planned in the Production Schedule to be submitted annually to USEPA.

Malcolm Pirnie/ TAMS-Earth Tech ES-23 Peer Review Draft - October 2003 Engineering Performance Standards Executive Summary
construction, and placement of backfill (where appropriate) prior to demobilization. For instance, USEPA conservatively assumed that re-dredging could require half of the total time spent on the initial dredging. However, if significantly more time is needed for re-dredging than was estimated in the conceptual schedule, it may affect the ability to meet the overall productivity standard. Understanding that these work elements contribute to the project duration, flexibility was designed in the Residuals Standard (e.g., provisions for 20-acre joint evaluations during Phase 1, options for immediate capping where the certification unit mean is only slightly greater than the objective of 1 mg/kg Tri+ PCBs, and provisions for successively closing portions of a certification unit as dredging progresses) to maintain productivity. The experience and information gained during Phase 1 of dredging will be the subject of the second peer review. This peer review will evaluate the project performance in Phase 1, so that any necessary refinements and adjustments can be made to the dredging operations or standards, including the Productivity Standard, prior to the second phase of dredging.

Select the nodes of concern, including nodes with
concentration > 97.5% PL, such that the arithmetic average after
re-dredging is <1 mg/kg.
Dredge to design depth and collect and analyze sediment
samples per Residuals Standard
Review sediment sample Tri+ PCB concentration results and calculate arithmetic average
(avg.) Tri+ PCB concentration for certification unit
All samples within a certification unit <1 mg/kg Tri+ PCBs?
Is 0-6” certification unit median < 99%
UCL ?
Is 0-6” certification unit arithmetic avg. <
99% UCL?
All individual
sample concentrations < 99% PL and no more than one
sample > 97.5% PL?
Is 0-6” certification unit arithmetic avg. <
95% UCL?
Certification unit
completed
Select the entire certification unit as affected area
Select the nodes of concern, including nodes with concentration > 97.5% PL, such that the arithmetic
average after re-dredging is <1 mg/kg.
Re-characterize the vertical extent of contamination and revise the cut line, as necessary (only required after
initial dredging attempt)
Calculate area-weighted avg. Tri+ PCB concentration
for 20-acre area
Is20-
acre area-weighted avg. < 1
ppm?
Backfilland sample
Backfill 0-6 inch arithmetic avg. concentration < 0.25 mg/kg Tri+
PCB?
Dredge and replace non-compliant backfill nodes and/or place additional
backfill d
Is 0-6” certification unit
arithmetic avg. < 1 mg/kg?
Have 2 re-dredging attempts been conducted?
Re-dredge and resample
Yes Yes Yes Yes Yes
Yes
YesYes
Yes
No
No No No NoNo
No
NoNo
Option 1
Option 2
Figure ES-1Residual Evaluation Flow Chart
Have 2 re-dredging attempts been conducted?
Yes
No
Cap -Construct sub-aqueous cap over non-compliant area. When possible, dredge additional depth to
accommodate cap thickness. Backfill the remaining area. c
[Additional dredging attempts may be made at the contractor’s discretion. b]
Select the area for capping such that the arithmetic avg. of the non-
capped area is < 1 mg/kg Tri+ PCBs, no sample > 99% PL, not
more than one sample > 97.5% PL.
START HERE a
END
Backfillwhere
appropriate
Notesa) Shaded figures represent primary certification path.b) Areas can be re-dredged if no delay to the project schedule will be incurred.c) Sub-aqueous caps will not be placed in areas of shallow bedrock located in the navigation channel or in areas with shallow water.d) Placement of additional backfill is contingent on sufficient water depth and USEPA approval.
Optional

Malcolm Pirnie/TAMS-Earth Tech 1 Peer Review Draft – October 2003 Engineering Performance Standards Introduction
Introduction Draft Engineering Performance Standards – Peer Review Copy
Hudson River PCBs Superfund Site Overview In February 2002, the United States Environmental Protection Agency (USEPA) issued a Record of Decision (ROD) for the Hudson River PCBs Superfund Site (Site). The ROD calls for targeted environmental dredging of approximately 2.65 million cubic yards of PCB-contaminated sediment from the Upper Hudson River (approximately 40 river miles) in two phases over a six-year period, and monitored natural attenuation of the PCB contamination that remains in the river after dredging. In the ROD, USEPA identified five remedial action objectives, which are as follows:
• Reduce the cancer risks and non-cancer health hazards for people eating fish from the Hudson River by reducing the concentration of PCBs in fish;
• Reduce the risks to ecological receptors by reducing the concentration of PCBs in fish;
• Reduce PCB levels in sediments in order to reduce PCB concentrations in river (surface) water that are above applicable or relevant and appropriate requirements for surface water;
• Reduce the inventory (mass) of PCBs in sediments that are or may be bioavailable; and
• Minimize the long-term downstream transport of PCBs in the river. In selecting its cleanup remedy, USEPA required that performance standards for resuspension during dredging, production rates during dredging, and residuals after dredging (together called the “Engineering Performance Standards”) be established. This decision was made to address comments received from members of the public who expressed a wide spectrum of views on the project. Some suggested that the environmental dredging could “do more harm than good” and take much longer than stated, while others were concerned that the ROD was not sufficiently comprehensive in its requirements for the environmental cleanup. USEPA required these performance standards in its final cleanup decision to promote accountability and ensure that the cleanup meets the human health and environmental protection objectives set forth in the ROD.1 This Public Review Copy of the Draft Engineering Performance Standards document is published in four volumes. The standards are presented in three parts, each contained in a single volume; an Appendix is contained in the fourth volume. Each part discusses one performance standard: Part 1 discusses the Performance Standard for Dredging
1 Other performance standards will address public concerns related to potential impacts of the cleanup on the surrounding community, such as air emissions, navigation and noise; these are being developed separately.
Malcolm Pirnie/TAMS-Earth Tech 2 Peer Review Draft – October 2003 Engineering Performance Standards Introduction
Resuspension, Part 2 provides the Performance Standard for Dredging Residuals, and Part 3 contains the Performance Standard for Dredging Productivity. Each of these parts includes a concise statement of the standard, discussion on the development approach, supporting analyses, and rationale used to derive the performance standard. Each part further provides a plan for refinement of the standard to account for additional data that may be obtained subsequent to publishing the standard, as well as to address evaluation of Phase 1. The Appendix contains a review of pertinent information derived from case studies of other environmental dredging projects considered in developing the draft Engineering Performance Standards. Some of the information was derived from research of the literature and public web sites, while additional information was developed from interviews with project managers and technical staff. Consistent with the ROD, the Engineering Performance Standards were developed in consultation with New York State, the National Oceanic and Atmospheric Administration and the U.S. Fish and Wildlife Service. (New York State is developing substantive water quality certification requirements for the environmental dredging pursuant to the federal Clean Water Act; USEPA will review the requirements when they become available for any implications with respect to the Engineering Performance Standards). USEPA’s consultants included a team of senior scientists and engineers who developed the standards, which then were reviewed by a separate team of recognized technical experts. General Electric Company reviewed a version of the draft standards previous to this one. Comments from these organizations were considered in preparing a Public Review Copy of the Draft Engineering Performance Standards. Following the close of the public comment period on July 14, 2003, the Draft Engineering Performance Standards was revised to create the Draft Engineering Performance Standards – Peer Review Copy. This version of the standards will be peer reviewed by a panel of independent experts, modified as appropriate to address the peer reviewers’ recommendations, and then implemented during the Phase 1 dredging. The results from the first season of dredging (Phase 1) also will be peer reviewed, and the Engineering Performance Standards will be refined or adjusted, if necessary, for the remaining dredging seasons (Phase 2). It is important to note that the standards developed herein are intended only for application to the remedial environmental dredging of the Upper Hudson River called for in USEPA’s 2002 ROD for the Hudson River PCBs Superfund Site at this juncture in time. The standards are not intended to provide general or universal guidance for environmental dredging. Other projects and locations may have specific features differing from those of the Hudson River, and the standards presented here may not be applicable to those projects. Site Background The Hudson River PCBs Superfund Site encompasses the Hudson River from the Fenimore Bridge in Hudson Falls (River Mile [RM] 197.3) to the Battery in New York Harbor (RM 0), a stretch of nearly 200 river miles (about 320 km). The Upper Hudson

Malcolm Pirnie/TAMS-Earth Tech 3 Peer Review Draft – October 2003 Engineering Performance Standards Introduction
River portion of the Site extends from the Fenimore Bridge to the Federal Dam at Troy (RM 153.9), a distance of just over 43 river miles. To facilitate effective project management and address Site complexities, the Upper Hudson River has been further divided into three major sections: River Sections 1, 2 and 3. River Section 1 extends from the former Fort Edward Dam just north of Rogers Island (RM 194.8) to the Thompson Island (TI) Dam (RM 188.5), a stretch of the river also known as the Thompson Island Pool; River Section 2 extends from the TI Dam to the Northumberland Dam (RM 183.4), which includes a 2.3-mile, non-navigable stretch of the river from the TI Dam to the Fort Miller Dam; and River Section 3 extends from the Northumberland Dam to the Federal Dam. Upstream of River Section 1 is a river segment between the Fenimore Bridge and the former Fort Edward Dam, a distance of about 2.5 river miles. During an approximately 30-year period ending in 1977, General Electric (GE) used PCBs in its capacitor manufacturing operations at its Hudson Falls and Fort Edward, NY facilities. PCB oils were discharged both directly and indirectly from these plants into the Hudson River. This included both non-permitted and permitted discharges. Even after GE received a permit in 1975, permit exceedances occurred. Estimates of the total quantity of PCBs discharged directly from the two plants into the river from the 1940s to 1977 are as high as 1,330,000 pounds (about 605,000 kg). Many of the PCBs discharged to the river adhered to sediments and accumulated downstream with the sediments as they settled in the impounded pool behind the former Fort Edward Dam, as well as other depositional areas farther downstream. Because of its deteriorating condition, the Fort Edward Dam was removed in 1973. Five areas of PCB-contaminated sediments were exposed due to the lowering of the river water level when the Fort Edward Dam was removed. These five areas are known as the Remnant Deposits. During subsequent spring floods, PCB-contaminated sediments from the Fort Edward Dam area were scoured and transported downstream. In 1984, USEPA completed a Feasibility Study (FS) and issued a Record of Decision (ROD) for the site (the 1984 ROD). The 1984 ROD contained the following components:
• An interim No Action decision with regard to PCBs in the sediments of the Upper Hudson River;
• In-place capping, containment, and monitoring of exposed Remnant Deposits (in the area of RM 195 to 196) from the former impoundment behind the Fort Edward Dam, stabilization of the associated river banks and revegetation of the areas; and
• A detailed evaluation of the Waterford Water Works treatment facilities, including sampling and analysis of treatment operations to see if an upgrade or alterations of the facilities were needed.
Although commercial uses of PCBs ceased in 1977, GE’s Fort Edward and Hudson Falls plants continue to contaminate the Hudson River with PCBs, due primarily to releases of PCBs via bedrock fractures from the GE Hudson Falls plant. In September 1991, GE
Malcolm Pirnie/TAMS-Earth Tech 4 Peer Review Draft – October 2003 Engineering Performance Standards Introduction
detected an increase in PCB concentrations at the Upper Hudson River water sampling stations being monitored as part of the construction monitoring program associated with Remnant Deposits capping. GE ultimately attributed the higher levels to the collapse of a wooden gate structure within the abandoned Allen Mill located adjacent to the river bank near the GE Hudson Falls plant. As reported by GE, the gate structure had diverted water from a tunnel that had been cut into bedrock, thereby preventing oil-phase PCBs originating at the GE Hudson Falls plant, that had migrated to the tunnel via subsurface bedrock fractures, from flowing into the river. From 1993 to 1995, GE removed approximately 45 tons of PCBs from the tunnel under NYSDEC jurisdiction. In 1994, GE documented the presence of PCB-contaminated oils in bedrock seeps at Bakers Falls adjacent to its Hudson Falls plant. GE has instituted a number of mitigation efforts that have resulted in a decline, but not cessation, of PCBs entering the river through the seeps. The 1984 ROD did not address the PCB-contaminated oil leaking through bedrock in the vicinity of the GE Hudson Falls plant, which was not known to USEPA at the time. GE is conducting remedial activities at the GE Hudson Falls Plant Site under an Order on Consent between the New York State Department of Environmental Conservation (NYSDEC) and GE. The changing upstream loading from the Hudson Falls site must be accounted for in any evaluation of PCB levels within the Hudson River. In addition, the GE Fort Edward Plant outfall area is likely a continuing source of PCBs to the Hudson River , although the Fort Edward outfall area currently is being remediated by the New York State Department of Environmental Conservation pursuant to state law. In December 1989, USEPA announced its decision to initiate a detailed Reassessment Remedial Investigation/Feasibility Study (RI/FS) of the interim No Action decision for the Upper Hudson River sediments. This was prompted by the five-year review required by the Comprehensive Environmental Response, Compensation, and Liability Act (CERCLA), technical advances in sediment dredging and treatment/destruction technologies, as well as a request by NYSDEC for a re-examination of the 1984 decision. The February 2002 ROD is the result of the Reassessment. Engineering Performance Standards Development This document presents the development of the performance standards required by the ROD and discusses the major measure(s) of performance in each case, the technique(s) used to assess performance, the supporting analyses for the recommendations (including case studies), and major possible interactions among the performance standards. To develop meaningful performance standards, it was necessary to envision a likely sequence of work for the major elements of the remediation project. It is understood that this “model sequence” may require adjustment as the remedial design is prepared. The model sequence of work outlined below is based on information in the ROD and emphasizes the points where the performance standards will interact with the work.
1. Extensive sediment sampling and analyses are conducted to identify locations where the Tri+ PCB mass per unit area (MPA) is 3 g/m2 or greater in River

Malcolm Pirnie/TAMS-Earth Tech 5 Peer Review Draft – October 2003 Engineering Performance Standards Introduction
Section 1 and 10 g/m2 or greater in River Section 2. In River Section 3, identification of target areas is based on removal of selected sediments with high concentrations of PCBs, high erosional potential and potential for uptake by biota. This information, in conjunction with other field investigation data, is used to determine target area boundaries for dredging and to delineate dredging “cut-lines.” The dredging cut-lines are to be designed to remove all PCB-contaminated sediments within a particular targeted area (i.e., the dredged bottom surface concentration is anticipated to be below 1 mg/kg).
2. Regular water column sampling and analysis is conducted to evaluate the PCB and total suspended solid (TSS) concentrations in the Hudson River prior to dredging (background concentrations).
3. Upon commencement of remediation, environmental dredging is employed to remove contaminated sediments from the targeted areas. Water quality monitoring is conducted continuously according to the requirements of the Dredging-Related Resuspension Performance Standard. Contingency actions are implemented to control resuspension releases if the action levels in the standard are contravened.
4. On completion of dredging in a particular targeted area, post-dredging sediment sampling is conducted according to the requirements of the Dredging Residuals Performance Standard to confirm that residual PCB concentrations are less than or equal to the anticipated residual concentration of approximately 1 mg/kg, as specified by the ROD. Contingency actions are implemented if sediment sample results from a particular targeted area are non-compliant. Following verification, backfill is placed where appropriate and shoreline stabilization is completed.
5. The progress of the dredging project is monitored according to the requirements of the Dredging Productivity Performance Standard. Contingency actions are implemented if the dredging production rate deviates significantly from that required by the performance standard.
6. At the completion of the first dredging construction season (Phase 1), remedial operations are assessed for compliance with the various performance standards. If necessary, adjustments to the remedial operations and performance standards are recommended, evaluated by the peer review panel, and implemented.
7. Phase 2 dredging commences and continues through project completion. Extensive monitoring (including that required to establish compliance with the performance standards) continues throughout the life of the project. Adjustments to the remedial operations and performance standards may also be implemented during Phase 2 consistent with the peer-reviewed approach.
8. Property restoration and decommissioning of the processing/transfer facility location(s) are conducted as expeditiously as practicable following completion of dredging and backfill activities. Habitat replacement and associated monitoring are performed in accordance with the approved plan.
Based on the analyses performed to develop the standards, USEPA believes that the standards are consistent with the human health and environmental protection objectives of the ROD. USEPA has determined:
Malcolm Pirnie/TAMS-Earth Tech 6 Peer Review Draft – October 2003 Engineering Performance Standards Introduction
• Compliance with the Resuspension Standard will limit the concentration of Total PCBs in river water one mile or more downstream of the dredging area to levels that are acceptable for potable water under the requirements of the Safe Drinking Water Act;
• Resuspension of PCBs in compliance with the Resuspension Standard will have a
negligible adverse effect on Tri+ PCB concentrations in Hudson River fish, as compared to a scenario assuming no dredging-related PCB releases;2
• Compliance with the Control Level of the Resuspension Standard is expected to
result in a Total PCB load (mass) transported downstream during remedial dredging that is similar to the range of Total PCB loads detected during recent baseline (i.e., pre-dredging) conditions, as documented by weekly measurements from 1996 to 2001;
• The Residuals Standard specified in the ROD (approximately 1 mg/kg Tri+ PCBs
prior to backfilling) is achievable based on case studies of other environmental dredging projects and can be applied in the Upper Hudson on an area-wide average basis;
• The Productivity Standard will result in completion of the dredging within the six
dredging seasons called for in the ROD, based on an example conceptual schedule for project implementation; and
• The three Draft Engineering Performance Standards, including their respective
monitoring programs, are achievable individually and in combination. The standards appropriately balance their points of interaction, allowing flexibility during design and implementation while ensuring protection of human health and the environment. For example, the requirements concerning additional dredging attempts in the Residuals Standard must consider the requirements for dredging production in the Productivity Standard.
Performance Standard for Dredging Resuspension The Performance Standard for Dredging Resuspension (i.e., Resuspension Standard) is designed to limit the concentration of PCBs in river water such that water supply intakes downstream of the dredging operations are protected, and to limit the downstream transport of PCB-contaminated dredged material. The attendant water quality monitoring program will be implemented to verify that the objectives of the Resuspension Standard have been met during dredging. The analytical results obtained from the water quality monitoring will be compared to the Resuspension Standard and associated lower action levels to monitor and control resuspension through appropriate actions. Such actions
2 A negligible effect is defined, in this case, as a predicted Tri+ PCB concentration in Upper Hudson fish of 0.5 mg/kg or less, and in Lower Hudson River fish of 0.05 mg/kg or less, within 5 years after the completion of dredging in the Upper Hudson.
Malcolm Pirnie/TAMS-Earth Tech 7 Peer Review Draft – October 2003 Engineering Performance Standards Introduction
could include, as appropriate, expanding the monitoring program, notifying public water suppliers, implementing operational or engineering improvements, and, if necessary, temporarily halting the dredging. The ROD requires the development of a Resuspension Standard but does not set forth any framework or numerical value for the Standard. The Resuspension Standard and a series of tiered action levels were developed based on extensive modeling, review of environmental dredging case study data, and evaluation of applicable or relevant and appropriate requirements (ARARs) identified in the ROD for PCBs in river water. Thresholds for increased monitoring and engineering controls provide a basis for design and evaluation of a contingency plan in the event of a contravention of the action levels. Once a baseline monitoring program has been finalized and implemented for the project, new water quality data will be collected and evaluated. The improved understanding of baseline conditions will be used to prepare a more thorough description of the relationships between water quality parameters and to further refine or adjust the Resuspension Standard (primarily the associated monitoring program), as necessary, based on the peer-reviewed approach. A plan is presented for refinement of the standard and the associated monitoring program, both as a result of availability of ongoing baseline monitoring data prior to Phase 1, and following completion and evaluation of Phase 1.
Performance Standard for Dredging Residuals The Performance Standard for Dredging Residuals (i.e., Residuals Standard) is designed to detect and manage contaminated sediments that may remain after initial remedial dredging in the Upper Hudson River. The ROD calls for removal of all PCB-contaminated sediments in areas targeted for dredging, and anticipates a residual of approximately 1 mg/kg Tri+ PCBs (prior to backfilling). The “residual sediments” may consist of contaminated sediments that were disturbed but escaped capture by the dredge, resuspended sediments that were re-deposited/settled, or contaminated sediments remaining below the initial dredging cut elevations (e.g., due to uncertainties associated with interpolation between core nodes of the design sediment sampling program or insufficient core recovery).
The Residuals Standard requires the implementation of a post-dredging sampling and analysis program to detect and characterize PCB concentrations in the residual sediments. The post-dredging sediment data are compared to the anticipated residual of approximately 1 mg/kg Tri+ PCBs stated in the ROD and a group of statistical action levels developed for the Residuals Standard. The approach to be taken to manage the residual sediments (including re-dredging) is then selected depending on the statistical analyses of the post-dredging data. The use of statistical analyses to evaluate environmental datasets is a scientifically accepted practice. The development of the residuals performance standard was accomplished using information from remedial dredging project case studies, and consideration and implementation of statistical data evaluation tools. The standard also encompasses

Malcolm Pirnie/TAMS-Earth Tech 8 Peer Review Draft – October 2003 Engineering Performance Standards Introduction
contingency options in the event of non-compliance, and the development of an approach to refine the standard following analysis and interpretation of Phase 1 data. Performance Standard for Dredging Productivity The Performance Standard for Dredging Productivity (i.e., Productivity Standard) is designed to monitor and maintain the progress of the dredging to meet the schedule stated in the ROD. The project schedule stated in the ROD has a six-year duration and consists of the first dredging season designated “Phase 1” (with dredging at a reduced scale) followed by five dredging seasons collectively designated “Phase 2” (each with dredging at full production to remove the remainder of the contaminated sediments identified for removal). The Productivity Standard specifies the cumulative volume of sediment to be dredged during each dredging season, based on the current estimate of 2.65 million cubic yards of sediment to be removed. Following the completion of Phase 1, the data obtained from the monitoring program will be analyzed to determine if refinements to the Productivity Standard or changes to the Phase 2 remedial program are necessary. Structure and Content of the Engineering Performance Standards As stated above, the Engineering Performance Standards are presented in three parts, one for each of the three standards. To provide a comprehensive and consistent presentation of each standard, each part is subdivided into four sections, as follows:
Section 1 – Statement of the Performance Standard This section provides a concise statement of the standard and associated lower-tier action levels with no rationale or background explanation. It simply states the standard as it is to be implemented during the dredging program.
Section 2 – Technical Basis of the Performance Standard This section contains three major subsections describing the technical basis for development of the standard.
Background and Approach The objectives, development processes, and methodology used in the development of these standards are presented in this section. A brief summary of the scope for the development of the standard is included in this section. Summaries of several case studies that are similar in nature to this project are also presented.
Supporting Analyses This section analyses the available information for its applicability to this project. This section includes the statistical evaluations and modeling required in order to derive the standard. Evaluations of baseline monitoring data or performance data from previous case

Malcolm Pirnie/TAMS-Earth Tech 9 Peer Review Draft – October 2003 Engineering Performance Standards Introduction
studies, as well as any conceptual design activities, that give substance to the derivation of the standard are provided.
Rationale for Determination of the Standard Based on the supporting analyses performed, a determination is made as to what the performance standard should be, and the rationale for this determination is discussed. Analysis of case studies, along with reasoning and explanation of decisions and judgments made to arrive at the standard is provided in this section. Section 3 – Implementation of the Performance Standard This section is a full presentation of the standard, including conceptual information to be provided to assist the user to interpret application of the standard in unforeseen circumstances. Action levels, including the standard proper, along with monitoring requirements and the basis for engineering controls and contingencies to be required at each level, are laid out in detail. Section 4 - Plan for Refinement of the Performance Standard This section contains a plan for refinement of the standard that may be appropriate due to ongoing collection of baseline data, or to discovery of additional case studies that shed new light on the development of the standard prior to implementation of Phase 1. In addition, the plan will address the means by which data developed during monitoring of Phase 1 operations and impacts will be used to refine or adjust the standard prior to and during Phase 2. Within each Section, the presentation may vary from Standard to Standard, in order to suit the needs of that particular Standard. Key Project Personnel and Roles In order to facilitate development of engineering performance standards that are consistent with the state-of-the-art dredging technologies and methods, scientific and statistical analysis, and the current level of knowledge about the Hudson River system, Malcolm Pirnie assembled a technical team of highly qualified professionals, many of whom had been involved with the Reassessment RI/FS for the site, or previous work on the river on behalf of New York State. In addition, the quality review normally conducted internally was delegated to a diverse team of technical experts assembled from a broader pool of candidates, recognized in their respective fields, and functioning independently of the technical team developing the standards. Technical Team The technical effort was divided among three teams corresponding to the three standards to be developed. Key senior members of the technical team are presented below.

Malcolm Pirnie/TAMS-Earth Tech 10 Peer Review Draft – October 2003 Engineering Performance Standards Introduction
Bruce Fidler, P.E. – Engineering Performance Standards Development Leader Mr. Fidler obtained his master’s degree in civil and sanitary engineering in 1979 and has more than 23 years experience in environmental engineering and hazardous waste remediation. He has been involved with the Hudson River PCBs Superfund Site since 1991, virtually the entire period of the Reassessment RI/FS and subsequent design-phase work. While with TAMS Consultants, Inc., Mr. Fidler led various pre-feasibility evaluations and served as Project Manager for Phase 3 of the Reassessment, including preparation of the Feasibility Study and the summary of the selected remedy presented to USEPA’s National Remedy Review Board, and the final Reassessment Responsiveness Summary incorporating over 73,000 comment documents received from the public. Having joined Malcolm Pirnie in early 2002, Mr. Fidler is now providing consultation on various aspects of the design period activities in addition to leading the engineering performance standards development effort. Edward Garvey, Ph.D., P.G. – Resuspension Standard Team Leader Dr. Garvey is a senior environmental geochemist with TAMS Consultants, Inc., an Earth Tech Company. He has over 22 years of experience in environmental geochemistry, with additional experience in human health risk assessment and hydrogeology. His educational training includes a Ph.D. in geochemistry, a M.A. in geological sciences and a B.E. in chemical engineering. Dr. Garvey is a registered geologist/geochemist in the Commonwealth of Pennsylvania. Dr. Garvey’s experience includes over 19 years of study specific to the Hudson River, including his Ph.D. dissertation and his efforts since 1991 as the chief scientist on the Hudson River PCBs Reassessment RI/FS for USEPA. For the Reassessment RI/FS, Dr. Garvey planned and directed the collection of environmental data, including extensive, multi-year sediment and water column sampling programs, coordinated the efforts of various scientists and consultants, and prepared several major reports on the investigation. His work on this project has produced several technical papers as well as many technical presentations on the fate of PCBs in the environment. In his role as the Resuspension Standard Team Leader, Dr. Garvey brings extensive experience on the geochemical interpretation of sediment contamination data and its implications for long-term PCB transport. Neven Kresic, Ph.D. – Residuals Standard Team Leader Dr. Kresic has more than 20 years of teaching, research and consulting experience in surface water and groundwater assessment, engineering and remediation for U.S. and international clients. He has designed site characterization and environmental sampling plans, and performed data analysis and evaluation of remedial design alternatives at numerous CERCLA, Resource Conservation and Recovery Act (RCRA) and other industrial sites throughout the US. His areas of expertise include subsurface modeling, geostatistical, probabilistic and stochastic analyses of spatial and time data series, and groundwater remediation. Dr. Kresic is a professional geologist and hydrogeologist, and
Malcolm Pirnie/TAMS-Earth Tech 11 Peer Review Draft – October 2003 Engineering Performance Standards Introduction
teaches short professional courses in geographic information systems (GIS), Groundwater Modeling and Groundwater Remediation for the National Ground Water Association. John Mulligan, P.E. – Productivity Standard Team Leader Mr. Mulligan earned his master’s degree in sanitary engineering from the School of Public Health at the University of North Carolina in 1967 and has over 35 years of experience in civil and environmental projects including a number of hazardous waste remediation projects involving dredging and disposal of contaminated sediments. He became involved in the Hudson River PCB project in 1974 when he served as Malcolm Pirnie’s project engineer on the design of a new water main crossing the Hudson. This was required to replace existing mains damaged by the removal of the former Fort Edward Dam, and involved removing timber cribs from the former dam pool, and stabilizing the sediment deposits left behind the old dam when the water level fell. From 1975 through 1991, he served as Malcolm Pirnie’s Project Manager for the preparation of studies and designs for the NYSDEC aimed at remediating the PCB contamination of the river sediments. In more recent years, Mr. Mulligan has designed a dredging project to remove and dewater PCB-contaminated sediments from the St. Lawrence River for General Motors Corp. and assisted in the design of the demonstration project for the remediation of PCB-contaminated sediments at Deposit N in the Fox River near Green Bay, WI. Donald J. Hayes, Ph.D., P.E. – Consulting Expert Dr. Hayes has been working with environmental aspects of dredging, dredged sediment disposal, and contaminated sediment management for over 20 years. He has published extensively in these areas. He also contributed to a number of guidance documents and authored software used to evaluate contaminated sediments management alternatives. He is especially recognized for his expertise in water quality impacts associated with dredging operations. Dr. Hayes served on the National Academies of Engineering Committee on Contaminated Marine Sediments and co-authored the resulting report. He is currently actively working on seven contaminated sediment projects and has contributed to many more projects over the past few years; many of these are Superfund projects. He previously contributed to the Reassessment Feasibility Study for this Site, as well as the final Reassessment Responsiveness Summary. Dr. Hayes worked as a research Civil Engineer at the USACE's Waterways Experiment Station for over 10 years and has been in academia for the past 11 years. Dr. Hayes received his Ph.D. in Environmental Engineering and Water Resources Planning and Management in 1990. In addition to the expertise contributed by these team members, modeling for the project was conducted by LimnoTech, Inc. (HUDTOX model) and Menzie-Cura & Associates, Inc. (FISHRAND model).
Malcolm Pirnie/TAMS-Earth Tech 12 Peer Review Draft – October 2003 Engineering Performance Standards Introduction
Quality Review Team Quality reviews for the project are being performed by a team of experts that functions independently of the technical team. Reviewers include the following: Kenneth J. Goldstein, C.G.W.P - Quality Review Team Coordinator Area of Expertise: Residuals Sampling Mr. Goldstein is a professional hydrologist/hydrogeologist at Malcolm Pirnie, with over 20 years experience in contaminant hydrogeology and contaminant fate and transport. He has designed work plans, field sampling plans and quality assurance plans and directed numerous sampling and analytical programs for physical and chemical characterization of sediments, soil and groundwater. Mr. Goldstein was responsible for the sampling and characterization of dredge spoil deposits and contaminated sediments in the Upper Hudson River through the late 1980s and early 1990s. In addition, Mr. Goldstein developed field sampling plans and performed sediment sampling on the Raritan River, Jamaica Bay, and Eastchester Bay. He has performed statistical and geospatial analysis of sediment quality data and physical characterization data. Mr. Goldstein’s current focus is on remediation of contaminated media using in-situ remedial technologies. Jonathan B. Butcher, Ph.D., P.H. Areas of Expertise: Residuals, Resuspension, Reassessment RI/FS History Dr. Jonathan Butcher is an environmental engineer and Professional Hydrologist with TetraTech, Inc., who has worked on the Reassessment RI/FS for the Hudson River PCBs Site since soon after its commencement. He has provided technical support in four key areas: (1) contaminant fate and transport modeling for PCBs within the river water and sediment; (2) predictive modeling of bioaccumulation of PCBs in fish; (3) data validation and reconciliation for historical data collection efforts, and (4) sampling design and statistical and geostatistical analyses of sample data. Dr. Butcher developed the Phase 1 PCB fate and transport model application and Phase 2 model specifications for the study, and was responsible for internal model review during the FS. He developed a bivariate bioaccumulation factor method to predict PCB burdens in fish in systems where the water column and sediment fractions are not in equilibrium, and collaborated on development of mechanistic and stochastic bioaccumulation models. He was also responsible for an innovative study of the environmental partitioning behavior of PCB congeners in Hudson River water and sediments. Dr. Butcher has taken a lead role in the review of GE’s alternative modeling analyses of PCBs in the Hudson, and has developed methods for translating historical Aroclor

Malcolm Pirnie/TAMS-Earth Tech 13 Peer Review Draft – October 2003 Engineering Performance Standards Introduction
quantitation results to a common Tri+ PCB basis. He has published several peer-reviewed papers on key scientific aspects of this work. Gregory Hartman, P.E. Areas of Expertise: Sediment Remediation, Environmental Dredging, Dredging Residuals Mr. Hartman is a licensed Professional Engineer in Oregon and Washington, and is currently a consultant with the firm of Dalton, Olmsted & Fuglevand in Kirkland, WA. Mr. Hartman has a B.S. in Civil Engineering, and an M.S. in Coastal and River Engineering. He has 34 years experience working in the Coastal and Waterway Industry. As a Civil Engineer in the Navigation Division of the Portland District USACE, he was Chief of Dredging Operations, and gained direct working experience as a dredger. Since 1978 Mr. Hartman has been a consultant, working on coastal and river projects in the United States and overseas. Mr. Hartman has taught the USACE Dredging Fundamentals Short Course every year since 1982. He has also taught courses intermittently on Dredge Cost Estimating, Dredge Contract Administration, and Dredge Inspectors Course to the USACE, and Dredge Remediation and Confined Disposal Site Design for the University of Wisconsin Short Course on Understanding Contaminated Sediment. Mr. Hartman is Past President and Past Chairman of the Board for the Western Dredging Association, and Retired Board Member of the World Dredging Association. He is on the Board of Industry Advisors for the World Dredging, Mining and Construction Magazine. Relevant experience includes the remediation of the St. Paul Waterway in Tacoma, WA and the development, design and construction oversight for the Sitcum Waterway Remediation Project in the Port of Tacoma. Mr. Hartman was Dredge Consultant for various projects including: the design and contract oversight of navigation dredging and PCB remediation on the US Navy Puget Sound Shipyard in Bremerton, WA; Pilot Study 2000, to dredge PCBs for the New Bedford, MA remediation; preliminary design for remediation of PCBs in Fox River, WI; sediment remediation in Greens Bayou, TX and; Hylebos Waterway PCB remediation design and construction in Tacoma, WA.

Malcolm Pirnie/TAMS-Earth Tech 14 Peer Review Draft – October 2003 Engineering Performance Standards Introduction
Michael R. Palermo, Ph.D., P.E. Areas of Expertise: Sediment Remediation, Environmental Dredging, Residuals Dr. Palermo is a Research Civil Engineer and Director of the Center for Contaminated Sediments at the U.S. Army Engineer Research and Development Center, Waterways Experiment Station, where he manages and conducts research and applied studies concerning dredging and dredged material disposal and remediation of contaminated sediments. He has authored numerous publications in the area of dredging and dredged material disposal technology and remediation of contaminated sediments. He was the lead author of the USACE technical guidance for dredged material capping and the lead author of the USEPA ARCS program guidance for in-situ capping for sediment remediation. Dr. Palermo also serves on several technical advisory panels for superfund projects involving contaminated sediments. Dr. Palermo is a Registered Professional Engineer and a member of the Western Dredging Association and the International Navigation Association. He is also Associate Editor for the Journal of Dredging Engineering. He received his B.S. and M.S. degrees in Civil Engineering from Mississippi State University and his Ph.D. degree in Environmental and Water Resources Engineering from Vanderbilt University. William N. Stasiuk, Ph.D., P.E. Areas of Expertise: Water Quality, Public Water Supply, Risk Assessment Dr. Stasiuk is a Licensed Professional Engineer at Malcolm Pirnie, with experience in dealing with sites contaminated with PCBs. In 1975, he helped coordinate the NYSDEC’s technical case in the original enforcement action against GE regarding Hudson River contamination. He directed the public health response to PCB contamination in the West Glens Falls, NY residential area in 1979 and the subsequent remedial action. As Director of the Center for Environmental Health within the New York State Department of Health (NYSDOH) from 1985 through 1996, Dr. Stasiuk provided direction to the Bureaus which carried out exposure investigations, risk assessments and health studies at all contaminated sites in New York State. He was directly responsible for the post-cleanup assessment and further remedial actions leading to the reoccupancy of the Binghamton State Office Building. He provided oversight of assessment, response and remedial actions at the State University at New Paltz PCB contamination incident. Also with NYSDOH in the late 1960s, Dr. Stasiuk was instrumental in development of a mathematical water quality model for the Hudson River from Corinth to the Battery. He also organized, staffed and supervised the first Toxic Substances Control Unit in NYSDOH in 1979, and assisted in development of drinking water standards for organic compounds, including PCBs. He was the NYSDOH’s representative on the NYS Superfund Management Board.

Malcolm Pirnie/TAMS-Earth Tech 15 Peer Review Draft – October 2003 Engineering Performance Standards Introduction
In addition to providing executive direction to the Bureau of Water Supply (part of the Center for Environmental Health), Dr. Stasiuk's water supply experience includes serving from 1996-2000 as Deputy Commissioner and Director of the Bureau of Water Supply in the New York City Department of Environmental Protection, which is responsible for the New York City water supply system. Quality Review Team Roles and Responsibilities The above team of experts, collectively referred to as the Quality Review Team (or QRT), was charged with reviewing and evaluating the scope of work and approach for the development effort as well as a series of draft deliverables leading up to publication of the standards for review by the public and the peer review panel. The team members performed their reviews individually, but then sought to reach consensus and provide unified guidance to the technical team to the extent possible. All comments received from the QRT were considered carefully by the technical team and implemented in consultation with USEPA. Although each of the five members of the QRT has a particular specialty (or specialties) relating to the project as indicated above, each was asked to review all three standards in the course of his work. The intention of this approach was to provide consistent review and evaluation of all standards individually and to provide evaluation of the interactions among the standards. While each of the QRT members has reviewed the standards3, and concurs with their form and content, each has been operating solely within the framework of this project and not with the intention of providing generic or universal guidance on performance standards development related to other projects or sites. Disclaimer Applicable to the Engineering Performance Standards Development As indicated above, the standards developed herein are intended only for application to remedial environmental dredging of the Upper Hudson River called for in USEPA’s 2002 ROD for the Hudson River PCBs Superfund Site at this juncture in time. The standards are not intended to provide general or universal guidance for environmental dredging. Other projects and locations may have specific features differing from those of the Hudson River, and the standards presented here may not be applicable to those projects.
3 Gregory Hartman, PE was unavailable to review later drafts of the standards documents as issued for public comment and peer review, but participated in review of the technical approach, as well as internal drafts. He also addressed specific questions and issues posed by members of the technical team during preparation of later drafts.

Part 3: Draft Performance Standard for Dredging Productivity – Peer Review Copy
Table of Contents
Malcolm Pirnie/TAMS-Earth Tech i Peer Review Draft – October 2003 Engineering Performance Standards Part 3: Dredging Productivity
LIST OF TABLES.......................................................................................................................... ii 1.0 Statement of the Performance Standard for Dredging Productivity ................................... 1
Dredging Productivity - Phase 1 (First Year Dredging) ............................................................. 1 Dredging Productivity – Phase 2 ................................................................................................ 2 1.1 Implementation ............................................................................................................... 2
1.1.1 Minimum Monitoring and Record Keeping Requirements .................................... 2 1.1.2 Action Levels and Required Responses.................................................................. 2
2.0 Technical Basis of the Performance Standard for Dredging Productivity.......................... 4 2.1 Background and Approach ............................................................................................. 4
2.1.1 ROD Requirements Related to Performance Standard for Dredging Productivity 4 2.1.2 Direct Implications of ROD Requirements for Productivity .................................. 4 2.1.3 Indirect Implications of ROD Requirements for Productivity................................ 6 2.1.4 Other Factors Influencing Productivity .................................................................. 7 2.1.5 Approach to Development of Standard................................................................... 7
2.2 Supporting Analyses ....................................................................................................... 8 2.2.1 Recent Projects and Developments in Dredging Technology ................................ 8 2.2.2 Analysis of Factors Affecting Productivity ............................................................ 9
2.2.2.1 Dredging Equipment........................................................................................... 9 2.2.2.2 In-River Factors ................................................................................................ 10 2.2.2.3 Implications of Post Dredging Sampling and Re-dredging .............................. 16 2.2.2.4 Backfilling of Dredged Areas and Stabilizing Disturbed Shorelines ............... 16 2.2.2.5 Sediment Dewatering, Water Treatment, and Shipping ................................... 16 2.2.2.6 Quality of Life Factors...................................................................................... 20
2.2.3 Example Production Schedule .............................................................................. 20 2.2.3.1 Major Assumptions used in Development of Example Production Schedule .. 21 2.2.3.2 Results of Example Production Schedule ......................................................... 23
2.3 Rationale for the Development of the Performance Standard ...................................... 24 3.0 Implementation of the Performance Standard for Dredging Productivity........................ 26
3.1 Summary of the Standard.............................................................................................. 26 3.2 Potential Impacts of Other Performance Standards on Productivity ............................ 27 3.3 Monitoring, Record Keeping and Reporting Requirements ......................................... 28
3.3.1 Action Levels ........................................................................................................ 29 4.0 Plan for Refinement of the Performance Standard for Dredging Productivity................. 30
4.1 Incorporation of Data Collected and Interpreted during Remedial Design .................. 30 4.2 Revisions to the Performance Standard for Dredging Productivity Following Phase 131

Part 3: Draft Performance Standard for Dredging Productivity – Peer Review Copy
Table of Contents
Malcolm Pirnie/TAMS-Earth Tech ii Peer Review Draft – October 2003 Engineering Performance Standards Part 3: Dredging Productivity
LIST OF TABLES Table 1-1 - Productivity Requirements and Targets Table 1-2 - Action Levels and Required Responses Table 2-1 - Phase 2 Productivity Parameters Table 2-2 - Mechanical Dredging Schedule by Phase and Year Table 2-3 - Cumulative Dredge Volumes Table 3-1 - Productivity Requirements and Targets LIST OF ATTACHMENTS Attachment 1.0 – Productivity Schedule Attachment 2.0 – Productivity Schedule Backup Attachment 3.0 – Evaluation of Applicable Dredge Equipment for the Upper Hudson River Attachment 4.0 – Issues Associated with Processing 4500 Tons/Day at Moreau Landfill Site

Malcolm Pirnie/TAMS-Earth Tech 1 Peer Review Draft – October 2003 Engineering Performance Standards Part 3: Dredging Productivity
1.0 Statement of the Performance Standard for Dredging Productivity The Productivity Standard (i.e., Productivity Standard) is designed to monitor and maintain the progress of the dredging project to meet the schedule stated in the ROD. The project schedule stated in the ROD has a six-year duration and consists of one dredging season designated Phase 1 and five dredging seasons collectively designated as Phase 2. Phase 1 consists of initial dredging at a reduced scale with extensive monitoring to evaluate compliance with the performance standards. Phase 2 consists of dredging at full production to remove the remainder of the contaminated sediments that are targeted for removal. The Productivity Standard accordingly defines the contaminated sediment volumes to be dredged during each project Phase and dredging season. Maintaining an appropriate dredging production rate will result in implementation of the project within the timeframe specified in the ROD, and simultaneously limit the duration of construction-related impacts. Following the completion of Phase 1, the data obtained from the monitoring program will be analyzed to determine if refinements to the performance standard or changes to the Phase 2 remedial program are necessary. The volume of contaminated sediment referred to in this Productivity Standard is the volume as measured in-situ in the riverbed. It is currently estimated to be approximately 2.65 million cubic yards based on sediment sampling data available through the end of 2001. It is recognized that new data from the on-going, sediment sampling program and other analyses begun by General Electric Company (GE) in 2002 are likely to result in a revision of this volume estimate. A methodology for revising the Productivity Standard to reflect a relatively minor change (10% or less) in the overall volume is presented as part of the Standard. However, should the volume of sediment to be dredged change by more than about 10 percent as a result of the current sampling program and final design considerations, the overall duration of the dredging program may be increased or decreased, as appropriate. In that event, the Productivity Standard may need to be revised to reflect the change in the overall project schedule. The following Productivity Standard has been developed:1 Dredging Productivity - Phase 1 (First Year Dredging)
1. The minimum volume of sediment to be removed, processed and shipped off-site during Phase 1 shall be one-half the minimum annual productivity volume required for full scale dredging in Phase 2, which is estimated to be 240,000 cubic yards;
2. For a time period of at least one month during Phase 1, the minimum production rate
shall be the rate required to meet the Phase 2 Performance Standard (currently estimated at 68,600 cy/month based on a 7-month dredging season), in order to verify the capabilities of the dredging equipment and the sediment processing and transportation systems; and
1 The volume of sediment to be dredged, processed, and disposed of has been estimated in the FS and ROD at 2.65 million cubic yards (USEPA, 2001, 2002). This estimate includes material to be dredged for remediation and material to be dredged for navigational purposes in order to implement the USEPA remedy.

Malcolm Pirnie/TAMS-Earth Tech 2 Peer Review Draft – October 2003 Engineering Performance Standards Part 3: Dredging Productivity
3. Stabilization of shorelines and backfilling of areas dredged during Phase 1, where appropriate, shall be completed by the end of the calendar year. All dredged material shall be processed and shipped off-site for disposal by the end of the calendar year.
Dredging Productivity – Phase 2
1. Based on an estimate of 2.65 million cubic yards of sediment, the minimum volume of sediment to be removed, processed and shipped off-site during each of the 5 years of Phase 2 (full scale dredging) shall be as shown in the middle column of Table 1-1. Furthermore, Phase 2 should be designed to meet the targeted removal volumes shown in the right-hand column of Table 1-1. If possible, the project should be completed ahead of schedule, or at least with a reduced required volume for the final season of the project (Phase 2, Year 6).
2. Stabilization of shorelines and backfilling, where appropriate, of areas dredged during
a dredging season in Phase 2 shall be completed by the end of the work season (i.e., prior to the following spring high flow period in the River).
3. All dredged material should be processed and shipped off-site for disposal by the end
of each calendar year. Processed sediment shall not be stockpiled for disposal the following dredging season.
1.1 Implementation 1.1.1 Minimum Monitoring and Record Keeping Requirements By March 1 of each year, the contractor shall provide USEPA with a Production Schedule showing anticipated monthly sediment production for the upcoming dredging season. The schedule must meet or exceed the productivity requirements defined herein or as revised in accordance with USEPA-approved design documents. Monthly and annual productivity progress reports shall be submitted to the USEPA according to a schedule to be defined by the Agency, for use in determining compliance with the Productivity Standard. Monthly productivity progress reports will be compared to the production schedule submitted by the Contractor and will be the primary tool for demonstrating whether the project is on schedule. Annual production progress reports will determine compliance with the Productivity Standard. 1.1.2 Action Levels and Required Responses The action levels and required responses are summarized in Table 1-2. In any given dredging season, whenever the monthly dredging productivity falls below the scheduled productivity for that particular month by 10 percent or more, the Contractor shall identify the cause of the shortfall to USEPA and shall take immediate steps to correct the situation by adding equipment and crews, working extended hours, modifying his plant and equipment or approach to the work, or other steps needed to achieve the necessary production rate and erase the cumulative shortfall

Malcolm Pirnie/TAMS-Earth Tech 3 Peer Review Draft – October 2003 Engineering Performance Standards Part 3: Dredging Productivity
in productivity over the following two months or by the end of the dredging season, whichever occurs sooner. Any such steps taken to increase production shall conform to all other Performance Standards established for the project. Significant changes to operating procedures or equipment, such as use of an entirely different dredging technology or means of processing the dredged sediments prior to shipments, will require USEPA approval. If the monthly productivity falls below the scheduled productivity by 10 percent or more for two or more consecutive months, the contractor shall provide a written action plan to the USEPA explaining the reasons for the shortfall in production and describing the engineering and management steps taken or underway to erase the shortfall in production during that dredging season. Failure to erase the shortfall by the end of the dredging season will result in USEPA taking action. USEPA will review the specific circumstances that led to the annual production shortfall prior to determining what USEPA action would be appropriate to address noncompliance with the Productivity Standard.

Malcolm Pirnie/TAMS-Earth Tech 4 Peer Review Draft – October 2003 Engineering Performance Standards Part 3: Dredging Productivity
2.0 Technical Basis of the Performance Standard for Dredging Productivity 2.1 Background and Approach 2.1.1 ROD Requirements Related to Performance Standard for Dredging Productivity USEPA’s ROD for the Hudson River PCBs Site (USEPA, 2002) specifies a number of conditions that influence the development of the Productivity Standard. For the purposes of developing the Productivity Standard, the ROD’s mandates were placed into two categories:
• Requirements that relate directly to productivity and schedule; and • Factors that influence or constrain productivity.
The principal elements of the remedy that directly influence the Productivity Standard are as follows (ROD at pp. ii to iii and 94 to 95):
• An estimated 2.65 million cubic yards of sediment are to be removed from the Upper Hudson River. This estimate was initially developed in the Feasibility Study (FS).
• Of the 2.65 million cubic yards, an estimated 341,000 cubic yards will be removed for purposes of improving project-related navigation;
• Dredging will occur in two phases: Phase 1 and Phase 2; • Phase 1 dredging will be conducted initially at a reduced rate, and the results of
monitoring during Phase 1 will be used to make any necessary adjustments to operations in Phase 2;
• Phase 2 dredging will be conducted at full scale; • The design for the project will plan for a construction period of six years; • The first year will be at less than full scale and the next five years will be at full scale.
In summary, USEPA’s objective is to remove sufficient PCB-contaminated sediment from the Upper Hudson River to meet the objectives stated in the ROD, estimated at 2.65 million cubic yards, over a period of six years. The initial year of work will entail considerable monitoring of dredging operations to allow evaluation of and adjustments to the dredging program. Full-scale removal operations will then be conducted for five years during which the remaining targeted contaminated sediment will be removed. 2.1.2 Direct Implications of ROD Requirements for Productivity To develop the Productivity Standard for Phase 1 and Phase 2, and to confirm the feasibility of accomplishing the remedy in accordance with the Productivity Standard, it is necessary to view the ROD requirements from the perspective of setting-up a construction and materials handling operation. The requirement to remove an estimated 2.65 million cubic yards of sediment establishes the overall scale of the effort but does not, in and of itself, set measurable targets for the remedial work as the project progresses. In addition, although the 2.65 million cubic yard figure is the current best approximation of the volume of sediment to be dredged, this estimate is expected to be revised during the remedial design. Based on engineering judgment, it was deemed reasonable to assume that the overall schedule would remain the same if the final

Malcolm Pirnie/TAMS-Earth Tech 5 Peer Review Draft – October 2003 Engineering Performance Standards Part 3: Dredging Productivity
volume of sediment targeted for dredging falls within about 10 percent, more or less, of the estimated total volume presented in the ROD. If the volume (or location) of the sediment targeted for removal changes by more than 10 percent as a result of the new data collected during the design, it is likely that a change in the overall schedule may occur. To develop the quantitative and measurable Productivity Standard, the following assumptions were made and applied throughout this Chapter:
• The estimated volume of sediment that will be removed is 2.65 million cubic yards as stated in the ROD.
• Dredging during Phase 1 will require the removal of about 240,000 cubic yards of sediment, with a target for removal of 265,000 cubic yards;
• An average of approximately 480,000 cubic yards of sediment will have to be removed during each of five full-scale dredging years (Phase 2). A target removal objective is set at 530,000 cubic yards per year for the first four seasons of Phase 2 and 265,000 cubic yards for the final season of dredging;
• In the ideal case, there will be a minimum of 30 weeks available each year to conduct dredging operations, and dredging operations will occur seven days per week, as per the FS and Responsiveness Summary (RS). However, the project will be planned around a schedule that includes some downtime due to high river flows and other uncontrollable events.
• Transfer, processing and transportation (for disposal) facilities will be available to manage dredged sediments at the rate implied by the Productivity Standard.
• The sequence in which the various sediment deposits are dredged will not be influenced by whether the sediment is considered a TSCA waste (i.e. contains ≥ 50 mg/kg Total PCBs) or non-TSCA (contains <50 mg/kg Total PCBs). A determination of the regulatory status of the sediment will be made by sampling processed sediment prior to loading rail cars or barges for shipment to the disposal site.
Given the above assumptions, it is possible to consider general productivity parameters for the project’s full-scale production years. Table 2-1 presents a gross calculation of generalized production rates required to meet the six-year schedule specified by the ROD. These generalized rates are obtained by dividing the total estimated volume to be dredged in a season by the total estimated available calendar time in a season. While these generalized rates are presented for illustrative purposes as a starting point for evaluating the equipment and facilities necessary to achieve the Productivity Standard, the actual average weekly and average daily production rates will have to be increased to account for a lack of production on holidays and downtime due to high flow events in the river, breakdowns of equipment, the need to remove unanticipated submerged obstacles, and similar disruptions in the project schedule. From the perspective of meeting the project’s overall goals, the seasonal production rate is most critical. The average monthly rate may be used as a basis for monitoring whether the project is on track toward achieving the seasonal target. The average daily production rate will have the greatest impact on setting requirements for the capacity of transfer, processing and transportation facilities. Knowing the project’s average daily effective time (percent of time dredge is actually dredging and delivering sediment to the processing/shipping site), it is also possible to estimate the hourly throughput that will have to be handled by various conveyance and processing

Malcolm Pirnie/TAMS-Earth Tech 6 Peer Review Draft – October 2003 Engineering Performance Standards Part 3: Dredging Productivity
subsystems. The capacities and redundancies to be designed and built into these subsystems should be based on an assessment of the peak hourly loads that are likely to be generated by the dredging equipment. 2.1.3 Indirect Implications of ROD Requirements for Productivity In addition to those elements of the ROD that have a direct bearing on productivity, there are several facets of the ROD that have an indirect impact on project output. Among the most significant of these are the following:
• Backfilling dredged areas with approximately one foot of clean fill, to isolate PCB residuals and to expedite habitat recovery, where appropriate;
• Removal of all PCB contaminated sediments in areas targeted for remediation with an anticipated residual of approximately 1 mg/kg Tri+ PCBs (prior to backfilling); and
• Limiting allowable dredging related resuspension rates. The implications of these particular ROD requirements relative to productivity are discussed in this Chapter. With regard to placement of backfill, the additional equipment and time needed to conduct this facet of the remedial work is factored directly into the Productivity Standard. Essentially, backfilling is planned to occur and is treated as one component of the construction activities that comprise of the overall program, and it will impact project output much the way the other activities do. The requirements identified in the second and third bullets above are reflected in the Resuspension Standard (see Volume 1) and the Residuals Standard (see Volume 2). The Resuspension Standard and Residuals Standard will influence productivity (and ultimately, the Productivity Standard) in a somewhat different manner. For instance, conforming to the Resuspension Standard may result in the following actions being taken, as appropriate:
• Selecting different dredging equipment; • Implementing contingency measures such as modifying dredge operating procedures or
collecting samples more frequently; • Postponing or reducing operations until more favorable river conditions are present; • Delaying operations while monitoring data are evaluated; and • Installing turbidity containment barriers around the dredging site, if such barriers are not
already in use. Similarly, the Residuals Standard may result one of the following actions being taken:
• Selection different dredging equipment; • Requirement of additional dredging passes within targeted areas or redredging of areas
that fail to meet the Residuals Standard; and • Construction of an engineered cap over residual sediments in extreme cases where the
Residuals Standard is not met despite best efforts to remove the sediments.

Malcolm Pirnie/TAMS-Earth Tech 7 Peer Review Draft – October 2003 Engineering Performance Standards Part 3: Dredging Productivity
2.1.4 Other Factors Influencing Productivity A number of other factors, beyond those considered above, will impact project productivity. Among the more significant of these are the following:
• Distribution of targeted sediments within the Upper Hudson River; • Limitations on in-river work imposed by river conditions and the need to maintain traffic
on the Canal system; • Limitations on in-river work as a result of standards set on equipment noise and air
emissions; and • The interrelationship of dredging productivity to the location and capacities of transfer,
processing and transportation facilities. The first two of these additional factors are addressed in the analysis presented below. The remaining two factors are not evaluated in this document but will be addressed in the project design. With regard to noise, it is assumed that the noise standards set by USEPA will not constrain the productivity of the dredging operations (i.e., noise abatement will either not be necessary or noise abatement technology installed on dredging equipment will not significantly affect the productivity of the equipment). Furthermore, consistent with the ROD, it is assumed that in-river activities and sediment processing and transportation operations are not restricted to certain days or hours. Since the location(s) and characteristics of sediment processing/transfer facility(ies) are not known at this time, it is not possible to factor into the productivity analysis the capacities of those facilities to handle dredged sediments. Rather, it is assumed that once the location(s) of the processing/transfer facility(ies) are identified, the facilities will be designed to ensure adequate processing capability to handle incoming sediments at rates commensurate with USEPA’s project goals (five years of full scale operation). However, processing and shipping considerations have not been ignored in developing the Productivity Standard. Instead, the Productivity Standard has been developed with consideration of the design team’s need for flexibility to avoid the problems associated with radical, short-term fluctuations in the volume of sediment sent to the processing/transfer facilities, so that on-site sediment staging requirements can be reduced and off-site transportation needs can be anticipated and coordinated. 2.1.5 Approach to Development of Standard The approach taken to develop the Productivity Standard is to:
a) Establish minimum productivity requirements for Phases 1 and 2 of the project that meet the requirements of the ROD;
b) Identify and evaluate the anticipated field conditions that will impact productivity; c) Obtain, where possible, reports or other information on projects that are similar to the
Upper Hudson River environmental dredging project and can provide support to the Productivity Standard;

Malcolm Pirnie/TAMS-Earth Tech 8 Peer Review Draft – October 2003 Engineering Performance Standards Part 3: Dredging Productivity
d) Identify typical production rates for available dredging equipment that has been demonstrated to function successfully under the field conditions anticipated in the Upper Hudson River; and
e) Prepare an example Production Schedule based upon use of the identified plant and equipment that supports the assumption that the proposed Productivity Standard can be met and the project completed within the time frame established by the ROD.
While the development of the Productivity Standard includes an example Production Schedule, the actual project schedule will be developed by the design team as a separate activity. The purpose of the example Production Schedule is to support the assumption that the Performance Standards are feasible and can be met using conservative assumptions and at least one selection of equipment from the wide array of such equipment currently available and in use on environmental dredging projects. 2.2 Supporting Analyses 2.2.1 Recent Projects and Developments in Dredging Technology To take into account the most current technologies and information available from other dredging sites, a search was conducted on the USEPA website, and parties associated with other sediment remediation/dredging projects were contacted to update the database developed during preparation of the FS and RS. In addition, follow-up conversations were held with site managers contacted during completion of the FS and RS where it was thought that additional information with regard to dredging, equipment, schedules, constraints and the like could be obtained. The information obtained from these sources is presented in Appendix A. The review of recent projects and developments in dredging technology revealed a number of points that are of interest in developing the Productivity Standard. Some of the more significant findings are as follows:
• A large number of sediment remediation projects have been completed or are being designed using mechanical dredges equipped with special buckets designed to minimize resuspension and to produce a flat bottomed cut. Positioning of the dredge and bucket to ensure that sediment is not “missed” is accomplished with GPS equipment linked to computers on board the dredging vessel. This equipment has been demonstrated to achieve cut tolerances of less than 6 inches when properly operated.
• Many, if not most, projects reviewed made use of some type of containment structure around the dredges to minimize the loss of resuspended sediments to downstream areas. Containment systems ranged from interlocking steel sheet piling to traditional silt curtains.
• Resuspension has not been a major problem in most instances where containment systems have been used. Where such systems have not been employed, resuspension has been minimized through careful control of the dredging operation including reducing dredge production rates and limiting dredging operations during adverse weather or high flow periods. A decision as to whether it is more cost effective to spend part of a dredging season installing an engineered containment system around an area to be

Malcolm Pirnie/TAMS-Earth Tech 9 Peer Review Draft – October 2003 Engineering Performance Standards Part 3: Dredging Productivity
dredged or to depend on very careful operation of the dredges and ancillary equipment, which usually results in some reduction in dredge production rates, must be made on a site-specific basis and should be addressed in final design.
• Achieving low cleanup levels (e.g., 1.0 mg/kg) has proven difficult, particularly where boulders and other obstacles are present in or underlying the sediment to be removed. In many of the projects reviewed, it was necessary to re-dredge at least some areas to achieve the target cleanup level, and on some projects the target cleanup level was not reached in limited, extremely difficult areas despite multiple passes of the dredging equipment.
2.2.2 Analysis of Factors Affecting Productivity A large number of factors will affect the length of time required to complete the Upper Hudson River environmental dredging project, including the actual volume of sediments to be dredged, the capacity and production rates of dredging equipment selected, the sediment processing/transfer facility(ies) (including the water treatment system), the distance from the dredging areas to the sediment processing/transfer facility(ies), any physical limitations on reaching areas targeted for dredging, the potential need to conduct a number of passes with the dredge to achieve target clean up goals, the rate at which backfill can be placed over dredged areas, engineering constraints imposed on the Contractor regarding resuspension, potential bottlenecks in the transportation networks required for shipping sediments to off-site disposal facilities, poor weather, and high river flows. All of these factors must be taken into account in developing the Productivity Standard to ensure that the Standard can be met. Some of the more critical factors are discussed below. 2.2.2.1 Dredging Equipment Four general types of dredging systems are considered here:
• Mechanical dredges with scow transport; • Hydraulic dredges with hydraulic transport; • Mechanical dredges with hydraulic transport; • Hydraulic dredges with scow transport.
Specialty equipment will also be required in some areas such as around docks, locks, retaining walls, submerged utility lines and bridge piers and in shallow water along the shoreline where access by large equipment is limited. This equipment may include small, diver-assisted dredges, amphibious excavators and trucks capable of working in shallow water and on beaches and conveying sediment to scows located in deeper water and similar equipment not usually associated with major dredging projects.
Malcolm Pirnie/TAMS-Earth Tech 10 Peer Review Draft – October 2003 Engineering Performance Standards Part 3: Dredging Productivity
2.2.2.2 In-River Factors Factors affecting the productivity of the various types of dredges and auxiliary operations that are likely to be considered and used in the Upper Hudson are described below.
• Need to Minimize Resuspension and Residuals ( See Part1: Performance Standard for Dredging-Related Resuspension and Part 2: Performance Standard for Dredging Residuals): Environmental dredging to remove contaminated sediments is inherently slower than navigational dredging because of the care that must be taken to avoid excessive resuspension and ensure that sediment is not “missed” by the dredge. Numerous projects conducted over the past decade show that properly operated hydraulic dredges can function with limited resuspension of particulate matter into the water column. Recent improvements in bucket design and electronic controls have significantly reduced the problem of resuspension when using mechanical dredges (See Volume 4: Appendix: Case Studies of Environmental Dredging Projects). The use of properly designed silt barriers to isolate areas being dredged has been demonstrated to prevent the loss of resuspended sediment downstream. Although not required by the Productivity Standard, it is assumed that silt barriers will be considered for control by the design team.
The use of a global positioning system (GPS), coupled to an on-board computer running WINOPS or a similar software package, has been shown to be effective and essential in assisting dredge operators to position a dredge head or bucket to ensure overlapping cuts and reduce the probability of missing contaminated sediment. However, recent experience has shown that, even where these devices have been used, the problem of residual contamination has not been completely eliminated. In some instances, most notably the 1999-2000 dredging of PCB-contaminated sediments and paper mill sludges in Cumberland Bay in Lake Champlain, inspection of the lake bottom following initial dredging showed that windrows (long heaped rows) and pockets of undredged material remained despite the fact that GPS equipment was used to control and map dredge passes. Further investigations revealed that the GPS equipment suffered from numerous failures and that wind gusts, which blew the dredge off station, were a problem on a number of days. In the St. Lawrence River opposite the former Reynolds Metals Primary Aluminum Extraction Plant, where PCB-contaminated sediments were dredged from a 35 acre area using derrick dredges equipped with Cable Arm environmental buckets during the summer of 2001, sampling following initial dredging showed that the dredging had successfully removed the contaminated sediment to the target cleanup level set for the project in 134 of 268 “cells” established at the start of the project for control purposes. Although the WINOPS system was used to control the derrick dredges and the placement of the buckets, fully 50 percent of the cells had to be re-dredged to remove residual contamination despite the fact that the initial dredging included some over-cut in an attempt to avoid leaving contaminated material behind. This problem apparently did not result from failure of the WINOPS system, but rather from the inability of the bucket used to remove the final layer of PCB-contaminated sediment above a compacted glacial till. Re-dredging successfully remediated 78 additional cells in one additional pass of the dredge. A second attempt at re-dredging succeeded in remediating 22 more cells, and 34

Malcolm Pirnie/TAMS-Earth Tech 11 Peer Review Draft – October 2003 Engineering Performance Standards Part 3: Dredging Productivity
cells were re-dredged 3 or more times. One cell was dredged a total of 10 times and still did not achieve the target cleanup level. A report on the project concluded that, in addition to the problem encountered in removing all of the sediment overlying a compacted till, large rock fragments and other obstructions in the dredging area hindered the clean up work. Whatever the reason, the records for this project show that re-dredging was very time consuming and resulted in very low overall dredge production rates.
• Shallow water depth: The draft of a small hydraulic dredge is usually in the 30- inch range, while larger hydraulic dredges and mechanical dredges have drafts of three feet or more. Although a dredge can work from deep water toward the shore or shallow areas of the Upper Hudson River, it will not be able to operate where the post-dredging water depth is less than about 3 feet. The use of a hydraulic excavator or crane with a relatively long boom can extend the range of the mechanical dredge into shallow water to a limited extent but, even under these conditions, some areas of the river cannot be accessed by either a mechanical or hydraulic dredge unless some over-cutting of the riverbed is done.
Material removed by a mechanical dredge typically is deposited in a scow for transport to the treatment and shipping location. Typical scows designed for use on the Champlain Canal have a maximum draft, when loaded, of up to 12 feet and can accommodate a load of about 3,000 tons. An empty scow has a draft of about 1 foot. While a mechanical dredge can operate in post-dredging water depths of around 3 feet, a scow moored in 3 feet of water could not be loaded with more than about 500 tons of sediment and water. A scow located in 6 feet of water could be loaded with a little over 1,000 tons of sediment and water, and this is probably the practical minimum load that could economically be transported from a dredge site to an on-shore treatment and shipping location. Because the scow must be positioned within the reach of the dredge’s derrick, excavator arm or crane boom for loading, the area where a mechanical dredge can function effectively is constrained by the water depth required for the loaded scow. To overcome this difficulty, some dredge manufacturers, notably Bean Environmental and Dry-Dredge Systems, Inc., have constructed dredges that receive mechanically dredged sediment in a hopper where it is slurried and pumped through a dredge pipeline to the disposal or materials dewatering site. Such mechanical dredges with hydraulic transport may be useful in remediating portions of the Upper Hudson where the water is too shallow to provide access for loaded scows.
Where contaminated sediments extend to the shoreline or are found along the narrow beaches, which line portions of the Upper Hudson, their removal may require the use of land based equipment or amphibious equipment capable of operating either on land or in water such as that manufactured by Marsh Buggy, Inc. In some instances where access to the shoreline if relatively easy, the excavated material could be loaded on trucks for delivery to the sediment processing site. Where access cannot be obtained along the shore, the sediment may have to be loaded onto amphibious carriers and transferred to shallow draft scows located as close to the shoreline as possible. Small hydraulic cutterhead dredges typically have a draft of from 24 to 30 inches. These dredges can also work from deeper water to shallow areas to create the water depth

Malcolm Pirnie/TAMS-Earth Tech 12 Peer Review Draft – October 2003 Engineering Performance Standards Part 3: Dredging Productivity
required to prevent grounding and, because the slurry is pumped through a pipeline, the area in which they operate is not constrained by a need for sufficient water depth to float a scow.
• Distance to Treatment and Shipping Site: In the FS, it was assumed that two, on-shore sediment processing/transfer facilities would be constructed for the project. One facility was assumed to be located near the northern reach of the project and the second facility would be located in the Albany area. While the availability of two separate on-shore sediment processing/transfer facilities might provide more flexibility in the design of the dredging program and facilitate a higher productivity rate, the Productivity Standard was developed with consideration that only one sediment processing/transfer facility (located in River Section 1) might be available. The assumption of one facility was made to be conservative with respect to the schedule, in that it requires sufficient time for sediments removed from any location within the Upper Hudson to be transported to one location. Note, however, that the assumption does not reflect a worse case based on available information, which would be one facility at or below the southern extreme of the project area.
There is a practical distance limit that any given hydraulic dredge can pump sediments through a pipeline without the need for booster pumping stations. This limit is a function of the dredge pump and horsepower, the density of the slurry being pumped, the diameter of the dredge pipe, and any change in elevation between the dredge and the pipeline discharge point. As the distance pumped increases, the pump discharge rate decreases. Furthermore, to avoid plugging the dredge pipeline, it must be flushed of slurry before shutting down the dredge pump for maintenance, for moving the dredge to a new location or for adding slurry pipe. The time required to flush the pipeline increases with pipeline length and must be factored into any production schedule that anticipates shutting down the dredge for a period of time each day. Finally, the use of multiple booster pumping stations to extend the distance that a hydraulic dredge can work from the on-shore treatment and shipping location requires additional time in a dredge production schedule for starting, stopping and refueling, adds to the potential for operating problems that may stop production entirely until corrections can be made, and increases the time needed for mobilization and demobilization at the beginning and end of each dredging season. Experience has shown that each in-line booster pump can reduce the effective dredging time by from 5 to 10 percent.
Where the distance from the dredging location is too great for a hydraulic dredge and booster pumps to operate effectively, the dredge can pump to a scow located in deep water at the end of the dredge pipeline. However, the slurry contains a high percentage of water (usually from 85 to 90 percent of the flow) so the scows will only carry a small percentage of their normal load in terms of solids. Thus, hydraulic dredging with scow transport of the sediment will likely be restricted to small, difficult to access areas, if it is used at all. The production rate of mechanical dredges using scows to transport the sediment to the on-shore treatment and shipping locations and hydraulic dredges pumping to scows,
Malcolm Pirnie/TAMS-Earth Tech 13 Peer Review Draft – October 2003 Engineering Performance Standards Part 3: Dredging Productivity
which in turn are towed to the treatment and shipping sites, is only affected if an insufficient number of scows is available to ensure that the dredge is able to work continuously while scows are in transit. Provided that the movement of scows through the locks is not unduly restricted by the Canal operating schedule or by other navigation on the Canal, the distance from the dredge to a sediment processing/transfer facility should not have a major impact on production rates for a mechanical dredge or a hydraulic dredge with scow transport. However, as is noted above, the use of a hydraulic dredge with scows to transport the slurry will require a significantly greater number of scows, as each load will have a low solids content.
• Thickness of Sediment Layer to be Dredged: Both mechanical and hydraulic dredges are designed with an optimal depth of cut in mind. If a hydraulic dredge is designed to achieve optimal production at a cut of 2 feet per pass of the dredgehead, it will not be as efficient at deeper or shallower cut depths. At deeper cut depths, the operator may find that the cutterhead is overloaded or may clog the dredge discharge pipe by trying to pump too dense of a slurry at too low a velocity. At a shallower cut, the dredge head will not be completely immersed in the sediment and the slurry will contain a much higher ratio of water to solids than when in a production cut. Similarly, the bucket on a mechanical dredge is designed for a depth of cut that just fills the bucket when the jaws are moved from a fully open to a closed position. Allowing the bucket to penetrate further into the sediment before closing the jaws will cause the bucket to overflow, increasing the potential for resuspension or, if a completely enclosed bucket type is employed, may prevent the bucket from closing tightly. If a thinner layer of sediment is to be removed, the bucket will not be completely filled when it is closed, which would also reduce efficiency and thereby productivity.
The depth of contamination in the Upper Hudson River sediments varies from less than one foot to over 6 feet. If a hydraulic, cutterhead dredge designed for an optimal cut of 2 feet per pass is working in an area where three feet of sediment is targeted for removal, it may achieve a high production rate when removing the first two feet but a substantially lower production rate when it removes the remaining 1-foot layer. The same will be true for a mechanical dredge using an environmental bucket: it will be most efficient when operating at its optimal cut depth and less efficient when operating at shallower cut depths, as the bucket will not be completely filled when it closes.
• Boulders, Cobbles and Debris: Most of the dredging required to remediate the Upper Hudson River will occur in areas outside the navigation channel. The areas outside the channel have not been dredged in the past and are likely to contain a significant amount of debris.
The presence of boulders, cobbles and debris in the sediments has a significant impact on dredge production rates, especially for hydraulic dredges. Boulders, large numbers of cobbles, sunken logs, abandoned vehicles and other debris cannot be pumped and interfere with the progress of a hydraulic dredge. Other debris, such as tree roots and limbs, heavy growths of underwater weeds, old fence wire, cables and similar material

Malcolm Pirnie/TAMS-Earth Tech 14 Peer Review Draft – October 2003 Engineering Performance Standards Part 3: Dredging Productivity
can clog the cutterhead, intake pipe or main pump on a hydraulic dredge and force the operator to shut the dredge down until they can be cleared.
Boulders and debris can also interfere with mechanical dredge operations by preventing the bucket from closing tightly. If the bucket is not closed when retrieved, the sediment will fall back into the water and cause resuspension. If an environmental bucket is used, with controls and alarms to warn the operator when the bucket is not closed, the operator must reopen the bucket, shift its location and attempt to close it again until the operator is sure that it is sealed before lifting it from the river bottom.
For the most part, loose cobbles in the 1- foot diameter and smaller range do not interfere with mechanical dredges. Occasional cobbles in this size range will be tossed aside by the cutter on a cutterhead dredge, but numerous stones of this size will make it very difficult for the dredge to retrieve the sediment that generally surrounds the cobbles.
To minimize delays in dredging related to the presence of boulders and debris, visual surveys conducted by divers, ground penetrating radar and side scan sonar surveys are frequently used to determine where these adverse dredging conditions exist and to plan in advance for coping with them. Hydraulic excavators mounted on work boats and equipped with grapples or other material handling devices are generally used to remove sunken logs, appliances, and other debris, while heavy growths of weeds can be removed with weed harvesters. Boulders and cobbles can be moved to areas (outside of the navigation channel) that have already been dredged by a workboat operating in close coordination with the dredge, but a loss of production inevitably occurs under these conditions. Environmental buckets mounted on hydraulic excavator booms and equipped with hydraulic pistons to close the bucket can minimize the problem of debris for mechanical dredges but may have secondary problems of maintenance and repair that can impact overall production.
• Presence of Bedrock and Highly Compacted Sediments: Undulating and scalloped bedrock surfaces and compacted glacial till, which usually contains boulders and cobbles in the Hudson River valley, can impede dredge production rates if found at the base of a layer of contaminated sediment. It is very difficult to remove sediment from the uneven surface of water-eroded bedrock outcrops in the riverbed without leaving some material behind, regardless of the type of dredge employed. Following an uneven, hard surface with the dredgehead on a hydraulic dredge is very difficult and slow. The bucket on a mechanical dredge cannot remove sediment from small pockets and crevices in a bedrock surface and is not designed to sweep a hard, uneven surface clean of sediment. The problem of dealing with residual contamination located in a thin layer over a hard base material is a difficult one and multiple passes of a low production dredge or the need for small, diver assisted dredges should be expected in such areas if the target cleanup level is to be met.
Highly compacted glacial till located immediately below the contaminated sediment can also decrease dredge production rates. The environmental buckets currently in use for removing contaminated sediments by mechanical dredges are not efficient at cutting into

Malcolm Pirnie/TAMS-Earth Tech 15 Peer Review Draft – October 2003 Engineering Performance Standards Part 3: Dredging Productivity
highly compacted material. They are particularly inefficient when employed on a derrick dredge or crane, as these machines depend upon the weight of the bucket to penetrate the sediment. They are more effective if they are mounted on the boom of a hydraulic excavator that can apply downward pressure on the bucket to force it into the compacted material.
• Interference with Navigation: The Champlain Canal is a popular route for travelers from and to Canada, Lake Champlain and Albany. Freight traffic has all but ceased on the Canal in the last decade due, in part, to the fact that dredging by the New York State Canal Corporation to maintain a 12-foot minimum navigation depth has not been performed, largely due to PCB contamination of the sediments. Inasmuch as a number of communities and marinas along this route are dependent upon the dollars spent by tourists using the Canal system, the dredging operations will have to be conducted in a manner that minimizes interference with boat traffic. This includes sinking hydraulic dredge pipelines beneath the navigation channel, allowing tourists’ boats to pass through locks if they reach them ahead of scows carrying contaminated sediments, avoiding blocking the channel with work boats, and maintaining buoys, navigation lights, and markers identifying work zones to protect against accidents. The extent to which interference with navigation will impede dredging progress and productivity is very difficult to gauge as it is not known whether the fact that a major sediment remediation project is underway along the Canal will discourage tourists from using this route during the project or attract curiosity seekers who want to observe the work. Nevertheless, some delays must be expected due to navigation issues and should be included when estimating probable dredge production rates for development of a project schedule.
• Length of Dredging Season and Daily Operating Hours: The annual production rate
during dredging is dependent upon the length of the dredging season. At present, the New York State Canal Corporation opens the Champlain Canal during the first week of May each year, provided the high flows characteristic of spring runoff from the Adirondack Mountains have subsided, and closes the Canal to traffic in early November. Ice does not normally form until mid to late December, and it may be possible to extend the dredging season into early December if the Canal Corporation will agree to keep the locks staffed or by organizing the work such that all of the dredging takes place in a single pool between locks following closure of the Canal to normal traffic.
The daily production rate during dredging is greatly affected by the number of hours that the dredges can work in a day. Dredging projects frequently continue around the clock, seven days per week, although maintaining, refueling, and moving the dredges to new areas usually require that they be shut down for some time period on a periodic basis. The Canal Corporation currently staffs the locks on the Champlain Canal from 7:00 A.M. until 7:00 P.M each day, including weekends. Arrangements would have to be made to staff these locks during the night if transit through the locks is needed beyond the usual schedules (see RS, White Paper # 313398).
Malcolm Pirnie/TAMS-Earth Tech 16 Peer Review Draft – October 2003 Engineering Performance Standards Part 3: Dredging Productivity
2.2.2.3 Implications of Post Dredging Sampling and Re-dredging Sampling of the river bottom will be conducted when contaminated sediment has been removed from an area to the elevation established during design. If this sampling shows that residual contamination above the target cleanup level of 1 mg/kg PCB still exists, the contaminated areas can be re-dredged as discussed in the Performance Standard for Dredging Residuals. It is expected that, in order to avoid delays in the overall program, sampling will be conducted as soon as the design elevation has been achieved and dredging will continue while the samples are being analyzed. If extensive re-dredging is found to be necessary in an area, and if the remaining sediments are amenable to removal by the equipment employed for the initial, production dredging work, that equipment may be used for the re-dredging process and the project will experience some delay. If the sampling indicates that the residual contamination exists as a thin layer of sediment or small pockets of sediment surrounding obstacles such as large boulders, a different dredge may be employed to remove it while the primary dredging equipment proceeds to other areas of the Upper Hudson River targeted for dredging. If the river is to be remediated within the time frame established in the ROD, the project schedule must account for delays resulting from the need to re-dredge an area. The schedule should reflect the fact that silt barriers and other structures erected to prevent the loss of resuspended sediments downstream, if used, will remain in place until an area has been completely remediated. 2.2.2.4 Backfilling of Dredged Areas and Stabilizing Disturbed Shorelines The ROD requires that dredged areas outside the navigation channel of the Canal be backfilled, where appropriate, with one foot of clean soil. In addition, where dredging has resulted in undercutting banks along the shore, stone fill, gravel or other stabilizing material will have to be placed to prevent erosion and cave-ins. If the backfill material is fine-grained soil, placing this material is expected to create turbid conditions in the Upper Hudson River, and should be done while any silt barriers that may have been erected to isolate an area for dredging are still in place. The rate at which backfill or shoreline stabilizing material can be installed will be affected by the method of placing the material and whether the water depth is sufficient to allow barges loaded with soil to be moored within easy reach of the equipment used to place it. In order to minimize delays in dredging, it will be necessary for placement of the backfill and shoreline stabilization work to begin as soon as an area is deemed clean. This work is likely to have an impact on the rate that dredging can proceed, particularly toward the end of the dredging season, as all disturbed shorelines and all dredged areas should be backfilled before the work is shut down for the winter. Otherwise, banks areas may be eroded and residual contamination in sediments loosened by the dredges may be scoured and transported to downstream areas when high flows occur during the following spring runoff period. 2.2.2.5 Sediment Dewatering, Water Treatment, and Shipping Experience on other projects has shown that production bottlenecks most often occur in the dewatering of dredged sediments and treatment of the resulting water. In fact, many dredging projects involving small volumes of contaminated sediments have been designed such that the rate at which dredging can proceed is limited to the rate that the sediment can be dewatered. For these projects, it has been judged to be more economical to erect small, low capacity dewatering
Malcolm Pirnie/TAMS-Earth Tech 17 Peer Review Draft – October 2003 Engineering Performance Standards Part 3: Dredging Productivity
and water treatment facilities that operate 24 hours per day and limit dredging to less than 8 hours per day rather than to invest in large capacity dewatering and water treatment facilities capable of keeping up with the dredge over a 24 hour dredging period. Given the scale of the Upper Hudson River project, it is consistent with the ROD and should be economical to erect large, temporary dewatering and water treatment facilities with a capacity that is closely aligned to that of the dredge production rate so that the dredges can operate on a nearly continuous basis.
2.2.2.5.1 Mechanical Dewatering of Hydraulically Dredged Sediments It is expected that the sediment will be mechanically dewatered or otherwise treated for immediate shipment from the area. A number of mechanical systems have been proven effective for dewatering hydraulically dredged sediments. One system, used in a number of recent sediment remediation projects including Cumberland Bay, Deposit N and SMU 56/57 on the Fox River, and the General Motors Powertrain facility on the St. Lawrence River, employed shaker screens and hydrocyclones to separate sand and gravel from the dredge slurry and either belt filter presses or recessed cavity filter presses to dewater the silt and clay sized fraction. In this type of system, the dredge slurry is discharged onto a series of shaker screens consisting of a coarse bar screen to remove stones and debris, followed by finer screens that remove gravel and coarse sand. The effluent from the screens is discharged into a large hopper. From the hopper, the slurry is pumped through a series of hydrocyclones sized to remove the sand fraction, which is discharged onto another shaker screen equipped with a fine screen. The overflow from the hydrocyclones contains the silt and clay sized particles and is usually discharged into tanks where chemicals are added to promote dewatering. From these tanks, the conditioned slurry is pumped into filter presses to separate the solids from the water. These presses can usually produce a filter cake containing over 50 percent solids, by weight. The filtrate water is discharged to a water treatment system for additional treatment prior to discharge back to the river. A condition typically imposed on the dewatering system by designers and by operators of disposal facilities is that the solids must be dewatered to the point where they pass a paint filter test, i.e. the solids must be dry enough so that no free water will drip from them when placed in a paint filter (USEPA Method 9095). This is relatively easy and inexpensive to achieve when dewatering non-cohesive sediments consisting of sand and gravel, because these materials drain rapidly and are readily removed from the flow using hydrocyclones and shaker screens. Slurry can be pumped onto a shaker screen and through high capacity hydrocyclone at rates of 2500 gallons per minute and higher, so only a limited number would be required to handle the flow from a hydraulic dredge pumping 8,000 to 9,000 gallons per minute of slurry. However, nearly all sediments contain some amount of silt and clay sized particles, which must be dewatered using some type of filter press, a centrifuge, or other devise designed specifically to handle fine-grained material. Hydraulically dredged sediments containing a high percentage silts and clays are much more difficult and expensive to dewater than non-cohesive sediments because most of the dewatering must be accomplished in the filter presses. Capturing and dewatering the fine-grained sediments in recessed cavity filter presses or belt filter presses require careful attention to the chemical conditioning of the slurry and the operation of the equipment. It is slow and labor intensive when

Malcolm Pirnie/TAMS-Earth Tech 18 Peer Review Draft – October 2003 Engineering Performance Standards Part 3: Dredging Productivity
compared to using screens and hydrocyclones. Furthermore, the capacity of individual presses is low and cycle times can be long, so a large number are usually needed to keep up with the volume of slurry produced by the dredge. As might be expected, the sediments targeted for remediation in the Upper Hudson River include some deposits consisting of a high percentage of silts and clays and others that are primarily sand and gravel. Available data on the grain size distribution of the targeted sediments indicate that, on average, approximately 60 percent of the dredged material will be sand and gravel that can be dewatered using screens and hydrocyclones while 40 percent will be silts and clays that will have to be dewatered using filter presses or a similar technology (see FS, Appendix H). However, each deposit is different, and when the dredge is operating in an area where the sediment consists primarily of silt and clay, most of the material processed will have to be dewatered in the filter presses. Thus, if hydraulic dredging is used, the filter presses or other equipment selected to dewater the fine grained sediments should be sized to handle the maximum amount of fine material expected to be dredged on any given day. Because the slurry produced by a hydraulic dredge usually contains from 85 to 90 percent water, by weight, a great deal of water must be treated prior to returning it to the Upper Hudson River. Water treatment systems typically used in conjunction with mechanical dewatering systems for the remediation of PCB contaminated sediments employ chemical mixing tanks for coagulants, settling tanks with skimmers to remove settleable solids and any floating oils or foam, mixed media pressure filters to remove particulates, and granular activated carbon pressure filters to remove dissolved PCBs. These treatment systems generally produce an effluent with turbidity of less than one NTU and PCB concentrations less than 0.065 parts per billion, the normal limit for discharge to a surface water in New York State. The area requirements for dewatering and water treatment systems associated with a hydraulic dredging project are governed more by space needed for temporary staging of TSCA and non-TSCA sediments and rail or truck loading areas than for the actual dewatering and water treatment equipment. Typically, a mechanical dewatering system capable of handling 4000 to 5000 cubic yards of sediment per day requires about 3 acres of usable space and a water treatment system with a capacity of around 9000 gallons per minute can be constructed on 1.5 to 2 acres. Buffer space surrounding the facility, construction trailers, decontamination areas, equipment wash down areas, temporary staging areas, rail sidings and loading areas, etc, may require up to 10 additional acres, depending upon topography and layout. Overall, a location with about 15 acres of useable space will be needed if hydraulic dredging and mechanical dewatering is employed for those portions of the work within pumping distance of the material to be dredged.
2.2.2.5.2 Dewatering of Mechanically Dredged Sediments Mechanical dredges are capable of removing sediment at close to its in-situ solids content. As a result, the amount of water collected with the sediment is significantly less than with hydraulic dredges. Nevertheless, the dredged sediment delivered to the material processing site will be too wet to load directly into rail cars for shipment, and some dewatering and water treatment will be required.

Malcolm Pirnie/TAMS-Earth Tech 19 Peer Review Draft – October 2003 Engineering Performance Standards Part 3: Dredging Productivity
Mechanically dredged sediment will be delivered to the processing facility location by scow. If the trip from the dredging area to the site is long enough for the solids to settle in the scow, some of the supernatant water can be pumped off to a water treatment plant similar to that described for treating water from a hydraulic dredging operation. If the supernatant contains too high a concentration of suspended solids, the liquid can be passed through a filter press prior to delivery to the water treatment system. After decanting the supernatant, the sediment is unloaded and mixed with a chemical agent that adsorbs or binds up the remaining free water. The FS described a method of physically stabilizing mechanically dredged sediments by adding Portland cement to bind up the water and change the material into a low grade concrete. It was estimated that the amount of Portland cement needed would be approximately 8 percent of the weight of the sediment. A significant advantage of this method comes from the fact that storage silos for the cement and pug mills or other mixing equipment can be erected on a relatively small facility. The major disadvantage of this method of dewatering is that the weight of the material shipped to the disposal site is increased by the amount of cement added and the amount of water that is bound up in the mixture by the cement. Nevertheless, the addition of cement or another binder material to make the sediment pass a paint filter test can be a cost effective method of reducing the free water if transportation and tipping costs are low. Other methods of removing water from mechanically dredged sediments include spreading the sediment on sand beds constructed over a grid of perforated pipe and allowing it to drain by gravity for a few days prior to shipping, modifying the scows to provide better drainage during the trip from the dredging location to the unloading site, decanting the scows at the dredging site and treating the decant water at a floating treatment system, and processing the sediment in the same manner as used for hydraulically dredged sediments. The area required for dewatering mechanically dredged sediments is normally less than that required for hydraulically dredged sediments. As in the case of hydraulically dredged sediments, much of the area needed is for staging, loading and shipping facilities, and support facilities. Where mechanical dredging is employed and the scows are to be unloaded with clamshells, the sediment processing/transfer facility should be immediately adjacent to the Hudson River to avoid the necessity of double handling the sediment. Where hydraulic dredging is used, the facility can be located away from the Hudson River and the sediment pumped inland through the slurry pipeline.
2.2.2.5.3 Rail Shipping of Processed Sediment The ROD calls for the transportation of processed sediments to licensed off-site landfills by rail or barge. The use of trucks for transporting such a large volume of sediment was considered to be too disruptive. Rail facilities in the Upper Hudson River corridor were considered adequate to handle the additional traffic associated with the dredged sediments although there is limited room in existing local rail yards to make up a full train of loaded gondolas. An evaluation of the ability to process, load rail cars, and transport processed sediment from a candidate sediment transfer/processing facility at the northern end of the Thompson Island Pool,

Malcolm Pirnie/TAMS-Earth Tech 20 Peer Review Draft – October 2003 Engineering Performance Standards Part 3: Dredging Productivity
the Old Moreau Landfill, was presented in the FS and RS. The evaluation concluded that transporting 1,600 tons per day from this location should be possible. This evaluation has been revised to reflect the possibility of transporting all sediments - up to 4,500 tons per day - from this one location. The revised evaluation is presented in Attachment 41. This revised assessment indicates that there is sufficient land area available at this location to construct rail sidings capable of holding 45 rail cars simultaneously, together with the necessary sediment processing and water treatment facilities, but cautions that the ability of the Canadian Pacific Railroad to transfer the loaded cars1 to a local rail yard for assembly into a train needs to be confirmed. The ability to construct rail loading facilities of an adequate size and capacity to handle the expected volume of sediments will be dependent upon the location(s) ultimately selected for the sediment processing/transfer facility(ies), but it is expected that potential transportation problems can be satisfactorily addressed during facility selection and design. If necessary, processed sediment could be loaded into barges carrying 2,000 tons or more each and transported to another facility with adequate rail sidings and transfer equipment to meet the schedule. Even at a production rate of 6,000 tons of dewatered sediment per day, only three barges would be required, and this should not interfere significantly with the current low level of traffic on the Canal. 2.2.2.6 Quality of Life Factors Quality of life issues that may affect the time needed to complete the project include noise and lights from the dredges and ancillary equipment working on the Hudson River and from the sediment processing/transfer facility(ies), traffic delivering chemicals and fuel to the facility(ies), and similar factors. These factors are the subject of a separate study and report being performed by the USUSEPA. Quality of life performance standards will be established (under separate cover) to limit disturbance to the lifestyle of people and businesses along the river and in the immediate surroundings as much as practical. The effect of these “quality of life” standards on the dredging, treatment and shipping of contaminated sediments is not currently known, but will be taken into account in the schedule for the project as they are developed. The dredging sequence and operations may require adjustment in areas adjacent to population centers and operating marinas. 2.2.3 Example Production Schedule An example production schedule has been prepared to illustrate the feasibility of achieving the Performance Standards for Dredging Productivity using relatively conservative assumptions and at least one selection of equipment from the wide array of such equipment currently available and in use on environmental dredging projects. It should be clearly understood that an actual
1 This revised evaluation was performed to illustrate the feasibility of achieving the Performance Standard for Dredging Productivity under conservative assumption of one location, rather than a less conservative assumption of two or more locations. The location was selected near majority of dredging (in River Section 1). This evaluation does not suggest that USEPA has selected this location or that the location is considered preferable. Facility siting will be conducted in accordance with the procedures set for in Facility Siting, Concept Document (USEPA, 2002).

Malcolm Pirnie/TAMS-Earth Tech 21 Peer Review Draft – October 2003 Engineering Performance Standards Part 3: Dredging Productivity
project schedule will be developed during the design of the project and may be very different from this example. The actual volumes and locations of sediment to be dredged, the location(s) of the processing and transfer site(s), the need for containment of the dredging areas, the type and capacity of dredging equipment, among other major factors for which assumptions have been made in developing the example schedule, will all be determined during final design. The example schedule is discussed in some detail and presented in Attachment 1. Backup for the example schedule is presented in Attachment 2. A summary of the major assumptions that were made in developing this schedule and the results of this work is presented below while a more detailed list of the assumptions used is presented in the attachment. 2.2.3.1 Major Assumptions used in Development of Example Production Schedule
• The volume and location of the sediments to be dredged are as presented in the FS and are based on the analytical results for samples collected during a number of sampling events conducted over the last 25 years. The example schedule assumes that the volume will be 2.65 million cubic yards. However, as noted in Section 1 of this document, a new sampling program is underway and it is expected that the locations and volumes used for the example schedule will change when this work is complete.
• A single, sediment processing and transfer facility has been assumed to be located at the
northern end of the Thompson Island Pool. Although the FS assumed that two such facilities would be constructed, one at the northern end of the project area and one at the southern end, a single site has been assumed for development of the example schedule based on a belief that this would be a more conservative assumption. Furthermore, it has been assumed that the sediment processing and shipping facilities will be designed with sufficient capacity keep up with the rate at which sediment is delivered to the site.
• Dredging and similar work on the River will be conducted 24 hours per day, 6 days per
week. Conducting routine weekly maintenance tasks on dredges and ancillary equipment is anticipated to occur on the seventh day of the week. Note that this is a conservative assumption since it does not rely on a seventh day of dredging activity. If dredging were to occur 7 days per week, a higher rate of production would be achievable.
• Overall, it has been assumed that the effective time available for dredging will average 13
hours per day. No dredging will take place at all on many working days during a construction season, as a significant amount of time is needed to relocate the equipment from one dredging site to another, install and remove sediment barriers, etc.
• The New York State Canal Corporation normally opens the Champlain Canal to traffic
during the first week of May and closes the system in the first week of November. It has been assumed that the arrangements can be made with the Canal Corporation to extend the operating season until the end of November, and possibly longer during mild years, and that 24 –hour per day access through the locks will be provided to allow floating equipment to navigate the system. It has also been assumed that, following closure of the locks in the fall, work will still be permitted within a pool between locks for as long as weather and river conditions permit.
Malcolm Pirnie/TAMS-Earth Tech 22 Peer Review Draft – October 2003 Engineering Performance Standards Part 3: Dredging Productivity
• For development of the example production schedule, it has been assumed that silt
barriers would be used for all dredging work outside of the navigation channel and would not be removed until the dredging of that area was complete and backfill and shoreline stabilization work was finished. This assumption was made so that a conservative scenario could be developed to estimate productivity. The installation and use of silt barriers delays the start of dredging each spring, causes delays in production due to the need to enter the enclosed area through gates in the barrier, and requires the dredging contractor to cease dredging and place backfill over a dredged area early enough in each dredging season to be able to remove the silt barriers before ice forms on the river. Although the use of silt barriers should make it possible to remove debris from the river and dredge at a relatively high rate without as much concern about meeting the Resuspension Standard, the time required to install and remove the barriers detracts from the number of days available for dredging each season. A detailed evaluation of the cost effectiveness of installing silt barriers and a decision on their use will be made as part of the final design process.
• Mechanical dredging has been assumed for the development of the example production
schedule under the belief that mechanical dredging will be slower than hydraulic dredging in most instances where hydraulic dredging might be possible (see Attachment 3 for an evaluation of applicable dredging equipment). Two different size mechanical dredges have been assumed to be available:
1. A dredge consisting of a hydraulic excavator with an extended boom fitted with a
4 cubic yard, hydraulically activated environmental bucket has been assumed to be the primary production dredge used where the depth of water is at least 3 feet following dredging and the thickness of the contaminated sediment layer and volume of sediment to be removed are great enough to warrant such a dredge. A production rate of 82 cubic yards per hour of actual dredging work has been assumed for mechanical dredges of this size and type.
2. A dredge similar to that described above but with a 2 cubic yard, hydraulically activated environmental bucket has been assumed to be used in areas where the sediment layer to be dredged is less than about 2 feet, the water depth is less than that needed for the larger dredge, or the area and volume of sediment to be dredged is small. This dredge would also be used for redredging, if post-dredging sampling indicates that additional sediment must be removed from an area. A production rate of 27 cubic yards per hour has been assumed for this smaller dredge when dredging to achieve the original design cut lines. No production rate has been assumed for redredging an area using this dredge, as any production rate would be dependent upon the thickness of the sediment layer to be removed, the total area to be covered by the dredge, and the characteristics of the material to be removed. Rather than assuming a product rate for redredging in terms of cubic yards per hour and making additional assumptions regarding the amount of redredging that might be needed, the example production schedule assumes that redredging will require about one half as much time as needed to achieve the original design cuts established for the project, i.e., if 30 days are required to

Malcolm Pirnie/TAMS-Earth Tech 23 Peer Review Draft – October 2003 Engineering Performance Standards Part 3: Dredging Productivity
dredge an area to the design cut lines, 15 additional days have been allowed for redredging work in the same area following sampling and analysis of the initial results.
• The dredged sediment would be placed in scows located where a post-dredging water
depth of six feet or more is available to provide the necessary draft. The extended booms on the dredges will make it possible for these machines to excavate sediments located at a distance of up to 30 feet from the dredge in shallow water. Where the post-dredging water depth is too shallow to permit scows to be placed in reach of the dredge, other dredging equipment, such as described in Section 2.4.2, and small, shallow draft scows are assumed to be used. The assumed production rate for this equipment is 27 cubic yards per hour of actual dredging work.
• Conducting post-dredging soundings to confirm that the sediment has been removed to
the design depth and sampling to determine the level of residual contamination remaining, if any, is assumed to be carried out as soon as a sufficient area has been dredged to the design grade to permit this work to be done without interfering with the dredging effort. The example production schedule assumes that post-dredging sampling will be completed within a few days of completion of dredging in a particular area and prior to the removal of any silt barriers or other containment structures.
• If all the original inventory of contaminated sediment has been removed in accordance
with the final design and sampling and analysis of the remaining sediment indicates that re-dredging is required to achieve compliance with the Residuals Standards, the redredging effort will be limited to two attempts at achieving compliance. As has been noted above, for the purposes of preparing an example production schedule it has been assumed that the time required to re-dredge an area is equal to 50 percent of the time required for removal of the original inventory.
• Although the ROD states that dredged areas will be backfilled, as appropriate, the
Example Production Schedule assumes that all dredged areas will be backfilled. It is not possible to know, in advance, how much of the areas targeted for dredging will have to be backfilled, so a very conservative assumption has been made for the extent of this work.
• The shipping of dewatered or otherwise processed sediments from the processing and
transfer site to a final disposal site is assumed to be done continuously to meet the requirement that no processed sediments be stockpiled on the site at the end of a construction season for disposal the following year.
2.2.3.2 Results of Example Production Schedule The example production schedule, presented in Attachment 1, indicates that 4 primary (4 cubic yard bucket) and 6 alternative (2 cubic yard bucket) dredges will be needed for a significant portion of the time if the project is to be completed in the 6 year period stated in the ROD. However, the number of dredges in operation simultaneously may vary from zero to as many as 10, exclusive of any redredging equipment, for short periods of time. While this upper number

Malcolm Pirnie/TAMS-Earth Tech 24 Peer Review Draft – October 2003 Engineering Performance Standards Part 3: Dredging Productivity
could be reduced by using larger dredges in some areas, it indicates that very careful control and scheduling of the dredging effort will be required to minimize delays at locks, a backup of scows at the unloading location and similar problems. The example also illustrates that if redreding is required in a given area, it should take place while the production dredges continue to work downstream. If the dredging is stopped to await post-dredging sampling, analysis and evaluation, and a decision as to whether redredging will be necessary in a given area, the project will not be completed on time. Phase 1 work is anticipated to begin on or around the first of May and be completed by the early December. However, the example production schedule indicates that actual dredging would not begin until mid-June and would be completed by November 7. Mobilization and site preparation would be accomplished during the first 6 weeks of the Phase 1 construction season and shoreline stabilization, completion of backfilling, winterizing equipment to be left on site and demobilization would occur during the last 4 weeks or so. The example schedule indicates that, during the second year of the project when full scale dredging is underway, actual dredging should begin in early May and be completed by mid October. In the third year of the project, the dredging would begin by May 2 and end by November 12. In the next two years, dredging would begin in the first week of May and end by November 6 and September 29, respectively. In the last year of the project, dredging would be completed by the end of August. The fact that dredging continues late into the fall in some years and ends sooner in others results from the selection of areas to be dredged in a given year. A different sequence of dredging would result in different beginning and ending dates than those shown in the example, and any changes in the volume of material to be dredged in a given target area would extend or shorten the time needed to complete that area. A summary of the volumes assumed to be dredged, the area remediated, and completion date for work each calendar year, taken from the example schedule, is shown in Table 2-2. The example schedule was developed to meet or exceed the Performance Standards for Dredging Productivity set forth in Section 1. Table 2-3 compares the volumes dredged in the example production schedule with the Productivity Standards and illustrates that the schedule meets these standards in all years. While the example production schedule presented herein is based on a large number of assumptions, all of which will have to be confirmed during design of the project, it supports the belief that the project can be completed in the six-year time frame set forth in the ROD. It is anticipated that a final schedule for the project that meets these goals will be developed once sampling of the sediments has been completed, final designs have been prepared, and the work under Phase 1 has been completed and evaluated. 2.3 Rationale for the Development of the Performance Standard The Productivity Standard - Phase 1 is based on achieving 50% of the average annual production rate for Phase 2. It is, furthermore, based on the fact that, as identified in the ROD, Phase 1 will

Malcolm Pirnie/TAMS-Earth Tech 25 Peer Review Draft – October 2003 Engineering Performance Standards Part 3: Dredging Productivity
span one construction season and Phase 2 activities will span five construction seasons. Utilizing 2.65 million cubic yards as the total estimated project volume, the total production rates for Phase 1 and Phase 2 activities was calculated as follows:
• Phase 1 Required Production Volume = ½ x 2,650,000 / (5 + 0.5) = 240,000 CY • Phase 2 Required Production Volume = 2,650,000 – 240,000 = 2,410,000 CY or 480,000
CY annually. A target dredging rate has been developed and included in the standard to reflect the recommendation to attempt to complete the work ahead of schedule, with approximately ½ of a season’s worth of work being completed in the final season. The recommended target productivity rate was calculated as follows: Phase 2 Target Annual Production Volume (Seasons 1 through 4 of Phase 2): (2,650,000)/5 = 530,000 (Note: ½ a season’s worth or 265,000 CY is targeted to be performed in Phase 1 and ½ a season’s worth is targeted to be performed in the final season of Phase 2).

Malcolm Pirnie/TAMS-Earth Tech 26 Peer Review Draft – October 2003 Engineering Performance Standards Part 3: Dredging Productivity
3.0 Implementation of the Performance Standard for Dredging Productivity 3.1 Summary of the Standard The Performance Standard for Dredging Productivity is defined in Section 1 of this document, and is summaries here for convenience. The Performance Standard for Dredging Productivity – Phase 1, reduced scale dredging, is as follows:
1. The minimum volume of sediment to be removed, processed and shipped off-site during Phase 1 shall be about 240,000 cubic yards or about one-half the minimum annual productivity volume required for full scale dredging in Phase 2, whichever is less.
2. For a period of at least one month during Phase 1, the minimum production rate shall be the rate required to meet the Phase 2 Performance Standard in order to demonstrate the capabilities of the dredging equipment and the sediment processing and transportation systems; and
3. Stabilization of shorelines and backfilling of areas dredged during Phase 1, as
appropriate, shall be completed by the end of the calendar year and prior to the spring high flow period on the River. Processed sediment shall not be stockpiled and carried over to Phase 2 for disposal.
The Performance Standard for Dredging Productivity – Phase 2, full scale dredging, is as follows:
1. Based on an estimate of 2.65 million cubic yards of sediment, the minimum volume of sediment to be removed, processed and shipped off-site during each of the 5 years of Phase 2 (full scale dredging) shall be as shown in the middle column of Table 3-1. Furthermore, Phase 2 should be designed to meet the targeted removal volumes shown in the right-hand column of Table 3-1. If possible, the project should be completed ahead of schedule, or at least with a reduced required volume for the final season of the project (Year 6).
2. Stabilization of shorelines and backfilling, as appropriate, of areas dredged during a
dredging season in Phase 2 shall be completed by the end of the work season and prior to the spring high flow period in the River.
3. All dredged material should be processed and shipped for disposal by the end of each
calendar year. Processed sediment shall not be stockpiled for disposal the following dredging season.
Phase 1 activities will not only accomplish a portion of the work required to remediate the River, but will provide data that will be useful for planning the work in subsequent years. USEPA will select the areas to be dredged during Phase 1. It is expected that Phase 1 dredging will be

Malcolm Pirnie/TAMS-Earth Tech 27 Peer Review Draft – October 2003 Engineering Performance Standards Part 3: Dredging Productivity
performed in areas exhibiting a range of dredging conditions which might be expected during the full scale project including dredging in both deep and shallow areas of the river and in areas with differing bottom characteristics. It is further expected that the monitoring program conducted during this phase will provide sufficient productivity and other performance data to refine the project design, as necessary, for the full scale dredging work to be done in Phase 2 (years 2 through 6). The Productivity Standard (Phase 1 and Phase 2), as well as the recommended targeted productivity volumes, are expected to be recalculated during remedial design once the final estimated volume of sediments to be dredged has been approved by USEPA. The formulas used to develop the Performance Standards for Productivity and the recommended target productivity volumes are described in Section 4 of this document and should be used for recalculating these volumes. 3.2 Potential Impacts of Other Performance Standards on Productivity The Performance Standards for Resuspension and for Residuals must also be met while achieving the Performance Standards for Dredging Productivity. The Resuspension Standard controls PCB mass loss during project activities, requiring that the daily Total PCB mass loss be restricted to 600 g/day and project Total PCB mass loss be restricted to 650 kg over the course of the scheduled six-year duration. The Resuspension Standard also sets forth requirements and procedures for monitoring PCB concentrations in the water column downstream from the dredging operation. Failure to achieve the Performance Standard for Resuspension will require that steps be taken to reduce resuspension, and these steps may cause delays in dredging while engineering controls are put in place or result in the need to dredge at a slower rate than anticipated. The Performance Standard for Residuals establishes criteria for determining when dredging in an area of the River has achieved the target cleanup level. The Residuals Standard requires that a maximum of two attempts be made at redredging an area in order to achieve the cleanup standard following initial removal of the PCB contaminated sediment inventory. Failure to meet the standard after two attempts at redredging may result in additional backfilling requirements. Extensive redredging and complying with additional backfill requirements will slow completion of the project and may lead to a failure to meet the Performance Standard for Dredging Productivity. The example production schedule prepared during development of the Performance Standards for Dredging Productivity assumes that silt barriers would be employed to contain resuspended sediments in the immediate area being dredged. The use of such containment structures would reduce the potential for exceeding the maximum allowable release of 650 kg of total PCB to the lower River as defined in the Performance Standards for Resuspension. However, as noted in Section 2 of this document, the time needed to install (and remove) such barriers and the potential for work boats to resuspend sediments during their installation may actually delay the completion of dredging and lead to a greater loss of PCBs to the Lower River than if the project were completed without them.

Malcolm Pirnie/TAMS-Earth Tech 28 Peer Review Draft – October 2003 Engineering Performance Standards Part 3: Dredging Productivity
Furthermore, the example production schedule assumes that any containment structures employed during dredging would be left in place until shoreline stabilization and backfilling of the dredged area have been completed so that residual sediments loosened by the dredging operation would not be eroded and carried downstream, en mass, when the barriers were removed and normal river currents again passed over the dredged area. As shown in example production schedule, this assumption caused delays in the dredging schedule that may not be justified. The use of silt barriers is not mandated by the Productivity Standard, and the decision as to whether to install them will be made during final design. 3.3 Monitoring, Record Keeping and Reporting Requirements Implementation of the Performance Standards for Dredging Productivity will require certain monitoring, record keeping and reporting activities. At a minimum, the following requirements should be met:
• Dredging productivity shall be monitored and detailed records shall be maintained to document production throughout the duration of the project. Specific monitoring and record keeping requirements will depend upon the dredging methodology employed and will be determined during final design. At a minimum, however, daily records shall be kept of the location(s) of working dredges, the approximate number of hours of operation of the dredge(s), the approximate volume of material dredged, and the weight and moisture content of processed sediment transported off site.
• By March 1 of each year, the contractor shall provide USEPA with a production schedule
showing anticipated monthly sediment production for the upcoming dredging season. The schedule must meet or exceed the productivity requirements defined herein or as revised in accordance with USEPA-approved design documents.
• Monthly and annual productivity progress reports shall be submitted to the USEPA for
determining compliance with the Productivity Standard. Monthly productivity progress reports will be compared to the production schedule submitted by the contractor and will be the primary tool for demonstrating whether the project is on schedule. Annual production progress reports will determine compliance with the Productivity Standard and will be used to plan subsequent seasons’ dredging work.
• At the end of each month, a monthly progress report shall be prepared and submitted to
USEPA for review and comparison to expected production rates as described by the contractor in his anticipated schedule and required to meet the Productivity Standard. Monthly reports shall present monthly, dredging season, and project totals/information and shall include:
1. A summary of the estimated total volume of sediment dredged, as measured in-
situ in the River, 2. A map showing the locations where dredging, confirmatory sampling and
backfilling has been completed and where work is ongoing. The map shall display the general type of ongoing work in each area under remediation, confirmatory

Malcolm Pirnie/TAMS-Earth Tech 29 Peer Review Draft – October 2003 Engineering Performance Standards Part 3: Dredging Productivity
sampling, re-dredging, backfilling, etc. 3. The total weight and average moisture content of sediments shipped off site or
added to the temporary stockpiles on the site 4. A graph showing the anticipated cumulative dredging production as necessary to
meet the productivity performance standard and the actual cumulative production achieved to date.
5. A table, graph or other means of showing the cumulative total mass of PCB released to the lower river from the beginning of the project through the date of the monthly report, and a projection as to whether the cumulative PCB loss to the lower River will be below the of 650 kg restriction for the six-year scheduled duration of the project.
3.3.1 Action Levels As describe in Section 1 of this document, two action levels have been identified: a concern level and a control level. Implementation of the Performance Standards for Dredging Productivity requires the following actions if these action levels are exceeded.
1. Concern Level: In any given dredging season, whenever the monthly dredging
productivity falls below the anticipated productivity for that month by 10 percent or more, the contractor shall identify the cause of the shortfall and take immediate steps to correct the situation by adding additional equipment and crews, working extended hours, modifying his plant and equipment or approach to the work, or other steps needed to achieve the necessary production rate and erase the deficit in productivity over the following two months or by the end of the dredging season, whichever occurs sooner.
2. Control Level: If the monthly productivity falls below the anticipated productivity by 10
percent or more for two or more consecutive months, the Contractor shall provide a written report to USEPA’s site manager detailing steps underway or to be taken to erase the shortfall in production that season. If the contractor fails to erase the shortfall at the end of the dredging season, the Contractor will be subject to action taken by USEPA.
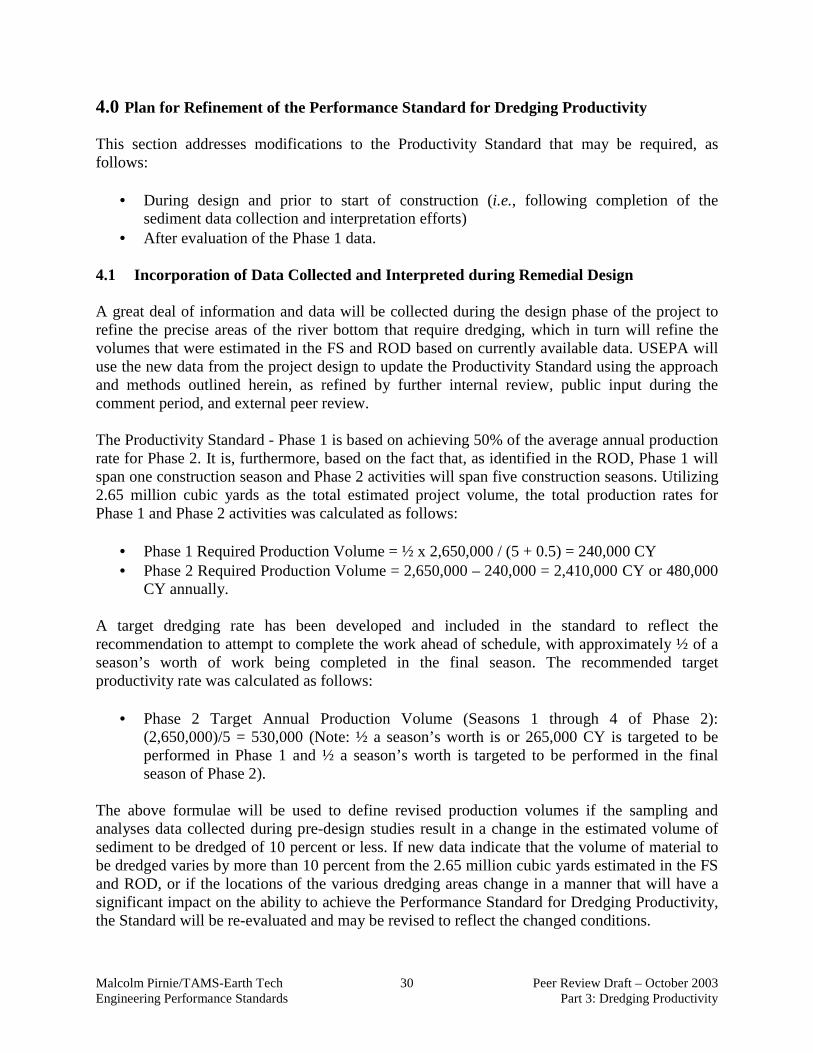
Malcolm Pirnie/TAMS-Earth Tech 30 Peer Review Draft – October 2003 Engineering Performance Standards Part 3: Dredging Productivity
4.0 Plan for Refinement of the Performance Standard for Dredging Productivity This section addresses modifications to the Productivity Standard that may be required, as follows:
• During design and prior to start of construction (i.e., following completion of the sediment data collection and interpretation efforts)
• After evaluation of the Phase 1 data. 4.1 Incorporation of Data Collected and Interpreted during Remedial Design A great deal of information and data will be collected during the design phase of the project to refine the precise areas of the river bottom that require dredging, which in turn will refine the volumes that were estimated in the FS and ROD based on currently available data. USEPA will use the new data from the project design to update the Productivity Standard using the approach and methods outlined herein, as refined by further internal review, public input during the comment period, and external peer review. The Productivity Standard - Phase 1 is based on achieving 50% of the average annual production rate for Phase 2. It is, furthermore, based on the fact that, as identified in the ROD, Phase 1 will span one construction season and Phase 2 activities will span five construction seasons. Utilizing 2.65 million cubic yards as the total estimated project volume, the total production rates for Phase 1 and Phase 2 activities was calculated as follows:
• Phase 1 Required Production Volume = ½ x 2,650,000 / (5 + 0.5) = 240,000 CY • Phase 2 Required Production Volume = 2,650,000 – 240,000 = 2,410,000 CY or 480,000
CY annually. A target dredging rate has been developed and included in the standard to reflect the recommendation to attempt to complete the work ahead of schedule, with approximately ½ of a season’s worth of work being completed in the final season. The recommended target productivity rate was calculated as follows:
• Phase 2 Target Annual Production Volume (Seasons 1 through 4 of Phase 2): (2,650,000)/5 = 530,000 (Note: ½ a season’s worth is or 265,000 CY is targeted to be performed in Phase 1 and ½ a season’s worth is targeted to be performed in the final season of Phase 2).
The above formulae will be used to define revised production volumes if the sampling and analyses data collected during pre-design studies result in a change in the estimated volume of sediment to be dredged of 10 percent or less. If new data indicate that the volume of material to be dredged varies by more than 10 percent from the 2.65 million cubic yards estimated in the FS and ROD, or if the locations of the various dredging areas change in a manner that will have a significant impact on the ability to achieve the Performance Standard for Dredging Productivity, the Standard will be re-evaluated and may be revised to reflect the changed conditions.

Malcolm Pirnie/TAMS-Earth Tech 31 Peer Review Draft – October 2003 Engineering Performance Standards Part 3: Dredging Productivity
4.2 Revisions to the Performance Standard for Dredging Productivity Following Phase 1 During Phase 1, it will be necessary to carefully track the progress and adherence to the Productivity Performance Standard. Key information will be collected during Phase 1, including:
• Setup time (mobilization, containment) hourly and daily production rates for the various types of dredging
• Downtime • Arial Coverage • Rate of Backfilling • Closure time (sampling, surveying, demobilization) • Number of redredge passes necessary. • Impact of Performance Standards for Resuspension, Residuals, and Quality of Life on
productivity. These data may be used to adjust the Productivity Standard for Phase 2. Any adjustments, modifications or refinements to the Productivity Standard as a result of Phase 1 work will be the subject of a second peer review by independent experts, as required by the ROD.
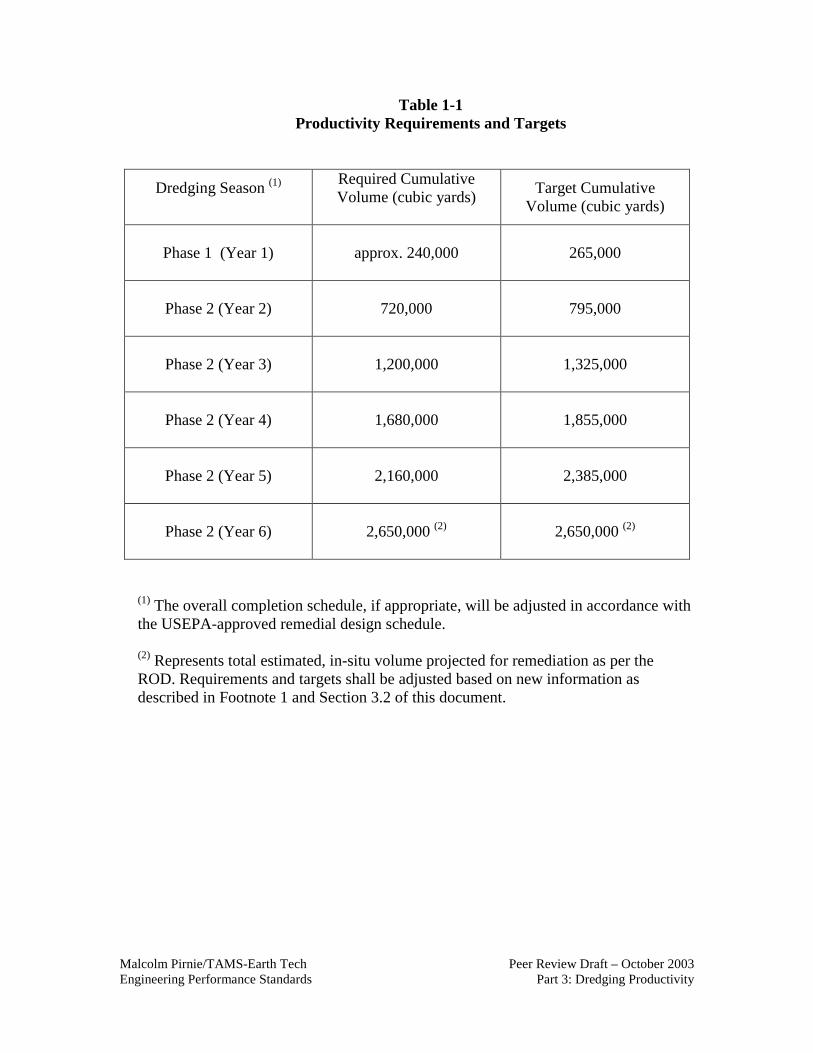
Malcolm Pirnie/TAMS-Earth Tech Peer Review Draft – October 2003 Engineering Performance Standards Part 3: Dredging Productivity
Table 1-1 Productivity Requirements and Targets
Dredging Season (1)
Required Cumulative Volume (cubic yards)
Target Cumulative Volume (cubic yards)
Phase 1 (Year 1)
approx. 240,000 265,000
Phase 2 (Year 2)
720,000 795,000
Phase 2 (Year 3)
1,200,000 1,325,000
Phase 2 (Year 4)
1,680,000 1,855,000
Phase 2 (Year 5)
2,160,000 2,385,000
Phase 2 (Year 6)
2,650,000 (2) 2,650,000 (2)
(1) The overall completion schedule, if appropriate, will be adjusted in accordance with the USEPA-approved remedial design schedule. (2) Represents total estimated, in-situ volume projected for remediation as per the ROD. Requirements and targets shall be adjusted based on new information as described in Footnote 1 and Section 3.2 of this document.

Malcolm Pirnie/TAMS-Earth Tech Peer Review Draft – October 2003 Engineering Performance Standards Part 3: Dredging Productivity
Table 1-2 Action Levels and Required Responses
Action Level
Situation
Response
Concern
Level
Monthly production rate falls 10% or more below scheduled rate.
Notify USEPA and take immediate steps to erase shortfall in production over next two months.
Control Level
Production falls below scheduled production by 10% or more for two or more consecutive months.
Submit an action plan to EPA explaining the reasons for the lower production and describing the engineering and management actions taken or underway to increases production and erase shortfall by end of the dredging season.
Standard Annual cumulative volume fails to meet production requirements.
USEPA action to be determined based on Agency review of specific circumstances.

Malcolm Pirnie/TAMS-Earth Tech Peer Review Draft – October 2003 Engineering Performance Standards Part 3: Dredging Productivity
Table 2-1 Phase 2 Productivity Parameters
Timeframe Required Production Rate Target Production Rate
Dredging Season 480,000 cy/season
530,000 cy for first four seasons of Phase 2, 270,000 cy for final season of Phase 2
Average Weekly (1) 16,000 cy/week 17,400 cy/week (3)
Average Daily (2) 2,300 cy/day 2,500 cy/day (3)
(1) Based on a 30-week schedule. (2) Based on a 7-day work week. (3) These are the rates for the 530,000-cy/year seasons.

Malcolm Pirnie/TAMS-Earth Tech Peer Review Draft – October 2003 Engineering Performance Standards Part 3: Dredging Productivity
Table 2-2 Mechanical Dredging Schedule by Phase and Year
Season Volume
Remediated (cubic yards)
Area Remediated
(acres)
Dredging Completion
Date
Work Completion
Date
Phase 1 (Year 1) 268,977 50 11/07/06 12/14/06
Phase 2 (Year 2) 529,440 78 10/15/07 12/20/07
Phase 2 (Year 3) 491,618 86 11/12/08 12/22/09
Phase 2 (Year 4) 548,535 62 11/06/09 12/22/09
Phase 2 (Year 5) 621,332 53 9/29/10 11/12/10
Phase 2 (Year 6) 128,983 63 8/30/11 11/12/11

Malcolm Pirnie/TAMS-Earth Tech Peer Review Draft – October 2003 Engineering Performance Standards Part 3: Dredging Productivity
Table 2-3 Cumulative Dredge Volumes
Season
Cumulative Volume From Example
Production Schedule (cubic
yards)
Required Cumulative Volume (cubic yards)
Target Cumulative Volume
(cubic yards)
Phase 1 (Year 1) 268,977 240,000 265,000
Phase 2 (Year 2) 798,417 720,000 795,000
Phase 2 (Year 3) 1,400,227 1,200,000 1,325,000
Phase 2 (Year 4) 1,964,760 1,680,000 1,855,000
Phase 2 (Year 5) 2,412,147 2,160,000 2,385,000
Phase 2 (Year 6) 2,650,000 2,650,000 2,650,000

Malcolm Pirnie/TAMS-Earth Tech Peer Review Draft – October 2003 Engineering Performance Standards Part 3: Dredging Productivity
Table 3-1 Productivity Requirements and Targets
Project Phase and Year (1) Required Cumulative Volume (cubic yards)
Target Cumulative Volume (cubic yards)
Phase 1 (Year 1) approximately 240,000 265,000
Phase 2 (Year 2) 720,000 795,000
Phase 2 (Year 3) 1,200,000 1,325,000
Phase 2 (Year 4) 1,680,000 1,855,000
Phase 2 (Year 5) 2,160,000 2,385,000
Phase 2 (Year 6) 2,650,000 (2) 2,650,000 (2)
(1) The overall completion schedule, if appropriate, will be adjusted in accordance with the USEPA-approved remedial design schedule.
(2) All productivity requirements and target volumes discussed herein are based on the volume estimate presented in the ROD (USEPA, 2001, 2002). The volume estimate of 2.65 million cubic yards is expected to be refined, as described in Section 4, as new sampling data are obtained and analyzed during remedial design.

Malcolm Pirnie/TAMS-Earth Tech 1 Peer Review Draft – October 2003 Engineering Performance Standards Part 3: Dredging Productivity – Attachment 1
Attachment 1.0 Production Schedule
In order to evaluate the feasibility of achieving the Performance Standards for Dredging Productivity, an example production schedule was prepared using Primavera Systems , Inc. project scheduling software. This production schedule is provided as a series of pullout sheets at the end of this Attachment 1. It should be clearly understood that an actual production schedule will be developed during final design of the project and may be significantly different from this example. In developing this example schedule, a large number of assumptions have been made that have an impact on dredging productivity. These assumptions are based on available information and, in some instances, are expected to change as the project is further developed during design. Where production rates have been assigned to particular aspects of the work, an attempt has been made to recognize the difficulty of the project and to be conservative in estimating the amount of work that can be accomplished in a given time period. 1.1 Assumptions Relating to Productivity 1.1.1 Locations and Volume of Sediment to be Dredged A major assumption that affects the time required to dredge the Upper Hudson is related to the actual volume of sediment to be dredged and the depth of water in which these sediments are located. The delineation of sediment to be removed was taken from the FS and was based on the analytical results for samples collected during a number of prior sampling events. The delineation may vary based on the outcome of GE’s sampling efforts, and the volume estimates will be adjusted accordingly. Given the distribution of targeted sediments presented in the FS, a preliminary assessment has been performed of the practical working limits of the dredging technologies that appear to be relevant to remedial work in the Upper Hudson River. For a mechanical dredging system it was assumed it could function in proximity to the river shoreline in those areas where there would be at least 6-feet of water after dredging. Also, it was further assumed that a mechanical dredge could effectively reach and remove sediments lying 30 feet beyond its location in shallow water. For a hydraulic dredging system is has been assumed that the system could successfully remove shoreline sediments where there would be as little as three feet of water in the post-dredging condition. Material not accessible by conventional mechanical and hydraulic technologies would have to be excavated by alternative specialty dredging systems. In River Section 1 (River Mile 188.5 upstream to the area around Rogers Island), a total of approximately 1.56 million cubic yards of sediment will be removed. Approximately 1.25 million cubic yards (about 80%) of this material could be removed using a mechanical dredge, while a hydraulic dredge could remove 1.39 million cubic yards (about 89%). An alternative dredge would be required for the remaining material (approximately 20%, or 0.31 million cubic yards, for mechanical dredging and 11%, or 0.17 million cubic yards, for hydraulic dredging).

Malcolm Pirnie/TAMS-Earth Tech 2 Peer Review Draft – October 2003 Engineering Performance Standards Part 3: Dredging Productivity – Attachment 1
In River Section 2 (River Mile 183.24 to River Mile 188.5), approximately 0.50 million cubic yards of sediment will be removed. Approximately 0.48 million cubic yards, or 95% of this material, can be removed using either a mechanical or hydraulic dredge. The remainder would have to be dredged using an alternative dredge. For River Section 3 (River Mile 163.25 to 170.25), approximately 0.56 million cubic yards of sediment will be removed. Of this, approximately 0.37 million cubic yards (about 65%) can be removed using a mechanical dredge, with the remaining 0.20 million cubic yards (35%) removed by an alternative dredge. The entire 0.56 million cubic yards of the material can be removed using a hydraulic dredge if processing and shipping sites are available within pumping distance of the dredge. A summary of dredge volumes (cubic yards) by location and method is provided in Table 1-1 of this Attachment 1 and in Tables 3B-1 and 3C-1 in Attachment 3. 1.1.2 Location of Processing Facilities The ROD assumed the establishment of two processing facilities, one near the northern extent of the project area and one near the southern extent of the project area. However, for the purpose of a conservative production estimate, it was assumed that only one facility would be available at the northern end of the project River Mile 194 on or near the Old Moreau Landfill or New Moreau Landfill. Under this assumption, all dredged sediments will have to be delivered to this one site for processing and shipping. The location was selected near the majority of dredging (in River Section 1). This selection does not suggest that USEPA has selected this location or that the location is considered preferable. Facility siting will be conducted in accordance with the procedures set forth in Facility Siting, Concept Document (USEPA, 2002). 1.1.3 Need for Silt Barriers/Curtains Silt barriers/curtains are most appropriate in water depths less than 21 feet and flow velocities less than 1.5 feet per second. For the purpose of the example production schedule development, it was assumed that silt barriers would be used for all dredging work outside of the navigation channel. This assumption was made so that a conservative, if not worse case, scenario could be developed to estimate productivity. The need for silt barriers/curtains should be determined during the design phase. The silt barrier type selected for preparation of the schedule presented herein consists of steel sheet piling at the upstream and downstream limit of the active work area. In shallow water areas, Jersey barrier or a similar portable barrier may be used. The steel sheeting would extend perpendicularly from the high water mark on the shoreline to the navigation channel or the limits of the active work area. The sheeting would then be installed parallel to the river channel and extended an additional 30 to 50 feet. The steel sheeting on the upstream end of the active work area would extend in a downstream direction and the steel sheeting on the downstream end of the active work area would extend in an upstream direction. High-Density Polyethylene (HDPE) geomembrane would be installed between the ends of the sheet piling. The HDPE sheeting would be supported at the top by a floatation boom and anchored or weighted to the riverbed to hold it in position. A sketch of an assumed silt barrier

Malcolm Pirnie/TAMS-Earth Tech 3 Peer Review Draft – October 2003 Engineering Performance Standards Part 3: Dredging Productivity – Attachment 1
installation is presented in Figure 1-1. This type of barrier differs from the conventional silt curtain in that its mode of failure is through submergence of the floatation boom rather than a lifting of the bottom of the curtain in response to pressure waves. 1.1.4 Dredging Procedure In developing tentative dredge production rates, it has been assumed that, where the thickness of the sediment layer exceeds 2 feet for hydraulic dredging or 1 foot for mechanical dredging, multiple passes of the dredge will be required to achieve the target removal depth, referred to herein as the “design cut.” By removing the sediment in two or more passes, taking shallow cuts each time rather than dredging to the design depth at one setup of the dredge, contaminated material that sloughs from the face of the cut during the first pass of the dredge will be excavated on the second pass. This reduces, but does not eliminate, the potential for contaminating the surface of the riverbed exposed by the dredge with contaminated material from above. Under this assumption, the dredge will make passes covering at least an acre before returning to begin another pass or passes as needed to achieve the design cut. 1.1.5 Need for Redredging Regardless of the dredging technology that is used, it should be assumed that some redredging will be required to achieve target cleanup levels in some areas of the River. It is very difficult to estimate the potential time required to redredge areas, which do not achieve the performance standard for residuals after initial dredging. The Project Completion Report on remediation of the St. Lawrence River at the former Reynolds Metals Site indicates that about 50 percent of the areas targeted for dredging achieved the target cleanup level of 1.0 mg/kg during initial dredging. A first attempt at redredging succeeded in achieving cleanup targets in an additional 30 percent of the areas, while two redredging attempts were needed to raise the total to 88 percent. Some areas were redredged 3 or more times and failed to meet the cleanup requirements. Ultimately, it was necessary to change the dredging method to achieve the target cleanup level in some areas with rocky and/or compacted till underlying the sediment (See Volume 4, Appendix: Case Studies of Environmental Dredging Projects). Satisfactory completion of the initial dredging to achieve the design cut and remediation goals will be determined based on the requirements set forth in the Performance Standard for Dredging Residuals. For the purposes of this productivity estimate, it has been assumed that redredging will require 50 percent of the time required to dredge to the design elevation, i.e. if 30 days are required to dredge a given subarea to the design elevation, an additional 15 days will be needed to redredge portions of this area to meet the target cleanup level. The validity of this assumption will be tested during Phase 1 of the project, provided that some areas require a second attempt at dredging during Phase 1. 1.1.6 Shoreline Stabilization In many areas, the defined limits of sediment removal may extend to, or beyond, the mean water level along the shoreline. For the purposes of devising a Production Schedule, it was assumed that all shoreline disturbances would be stabilized using one of three methodologies:

Malcolm Pirnie/TAMS-Earth Tech 4 Peer Review Draft – October 2003 Engineering Performance Standards Part 3: Dredging Productivity – Attachment 1
• Shoreline areas where the depth of sediment to be removed is less than 2 feet and
dredging can be conducted such that the post dredging river bottom slopes gently to the existing shoreline will be stabilized by hydro seeding any disturbed areas above the waterline.
• Shoreline areas where the sediment removal depth is greater than 2 feet and the dredge cut ends abruptly at a vertical face will be stabilized by placing a filet of stone fill with a slope of 1 vertical to 2 horizontal against the vertical face.
• Shoreline areas, which are currently stabilized with riprap, dumped stone fill, or similar armoring will be restored in-kind.
1.1.7 Wetland Restoration To estimate the effort associated with wetland restoration, the following assumptions have been made: following dredging activities, those areas identified as wetlands will be backfilled with a mixture of sand and fine material to achieve a water depth approximately equal to the pre-dredging depth. These areas will then be planted with appropriate wetland vegetation. 1.1.8 Weather and River Flow Issues Low temperatures, high winds, and high flow rates or flooding may occur during the dredging season. Based on meteorological data from the Glens Falls (Warren County) and Albany Airports for the years 1991 through 2000, it appears that low temperatures should not limit work during the proposed period. In fact, based on temperature data alone, it would appear that productive work could occur for 33 to 34 weeks per construction season (RS, White Paper #313398). The Upper Hudson River is relatively sheltered (compared to a bay or sound) and is not prone to wave formation. It is not expected that significant wind-related delays will occur. Between 1997 and 2001, the Canal Corporation issued one Memo to Mariners indicating that the canal system between Lock C-1 and Lock C-4 would be closed for a few days until water levels receded to safer levels and debris could be removed. Based on estimated river velocities and associated water depths, it has been assumed that dredging activities can be effectively conducted in river flows up to 10,000 cfs as measured at Fort Edward. Based on flow data collected at the USGS Fort Edward gauging station from 1978 to 2000, river flows in excess of 10,000 cfs occur approximately 5 percent of the time during the proposed dredging season (RS, White Paper #313398). 1.1.9 Canal Operating Schedule The canal operates approximately 29 weeks per year and generally has daily limits on passage through the Champlain Canal lock system. It has been assumed that the Canal Corporation will extend their operating season to provide a minimum of 30 weeks per year (and possibly longer during mild years) and that 24-hour per day access through the locks will be provided to allow loaded and empty scows to navigate the system. It is further assumed that working within a pool

Malcolm Pirnie/TAMS-Earth Tech 5 Peer Review Draft – October 2003 Engineering Performance Standards Part 3: Dredging Productivity – Attachment 1
between locks will be permitted even after the canal is closed to normal traffic in the fall (RS, White Paper #313398). The Canal Corporation conducts most major rehabilitation and repair activities on the lock system during the winter months to avoid impeding boat traffic. Repairs, largely limited to above-water work, are performed on a maintenance cycle throughout the operating season of the Canal. These repairs are not expected to inhibit travel. It is expected that the only repairs or maintenance activities that may inhibit use of the lock system would be emergency repairs, which have typically been very few. In addition, periodic events such as boat parades and land-based emergencies may also impede navigation. 1.1.10 Equipment-Related Delays Some level of downtime due to equipment malfunction is unavoidable. However, the duration of the downtime and the affect on the overall schedule can be largely overcome through proper planning and design. For the purpose of this productivity assessment, the production hours (effective time) for the most critical mechanical equipment (e.g., dredging equipment) have been de-rated to account for typical downtime (for further information see RS White Paper #313398). 1.1.11 Processing and Shipping Assumptions As noted in Section 2.1.4 of the main document, it has been assumed that the on-shore treatment and shipping facilities will be designed with adequate capacity to process the maximum daily output from the dredges. 1.1.12 Sequence of the Work In order to identify the major pieces of equipment needed to complete the project and develop a preliminary schedule to evaluate the feasibility of remediating the River within the time frame defined in the ROD, a plan must be developed regarding the sequence of work. The following sequence of work has been assumed for the full scale dredging program. Only the major, definable features of the work are listed, as these features generally control the overall production schedule. For the purposes of this example schedule, it has been assumed that turbidity barriers will be installed around each dredging area as this is a time consuming operation and will result in a conservative estimate of the amount of work that can be accomplished each season.. If turbidity barriers are not used on the project and the equipment selected for dredging is capable of being operated in conformance with the Performance Standards for Resuspension, it should be possible to shorten the schedule.
1. It has been assumed that mobilization will begin as soon as weather permits each spring, usually by the first week of April, and will concentrate on making the on-shore facilities ready for the dredging season. Dredges that were demobilized and removed from the site the previous winter will be mobilized on the first day that the canal opens in May.
2. The installation of turbidity barriers, if used, and monitoring equipment will begin as soon as flows in the River permit. Equipment needed to install these structures is assumed to have been trucked to the site prior to the opening of the Canal and installation

Malcolm Pirnie/TAMS-Earth Tech 6 Peer Review Draft – October 2003 Engineering Performance Standards Part 3: Dredging Productivity – Attachment 1
is assumed to start on or about the first of May each year. A gate will be constructed in any barrier around each major work area. Installation of a turbidity barrier around the next area designated for dredging will be done while the first area is being dredged.
3. Where hydraulic dredging is proposed, dredge pipe will be installed as the turbidity barrier is being constructed so that the necessary penetration of the barrier can be made. The pipe will be submerged where it crosses the navigation channel or obstructs private docks and marinas but will be floating or laid in shallow water along the river bank in most other areas.
4. Clearing and snagging fallen trees from the waters edge will be accomplished at the same time the turbidity barrier is installed so that dredging will not be delayed by this work.
5. Dredging will begin within one to two days of the arrival of the dredges on the site and will continue until the area enclosed by the turbidity barrier is dredged to the design elevations. Unless post-dredging sampling indicates that the production dredges will be required for redredging portions of the area that did not meet the residuals standards, they will move immediately to the next area designated for dredging.
6. Soundings will be taken at least weekly to confirm that the design elevations are being met as dredging proceeds in a given area. When a sufficient area is dredged to the design elevations, samples will be collected and analyzed for residual PCBs. Sampling should be done while the dredges are still working in an area and should follow the dredges by no more than a week.
7. The dredging will be divided into certification units for sampling of residuals. If redredging is required in a certification unit, , but sampling indicates that it should consist of a very shallow cut or of removing a very limited amount of residual sediment overlying clean sediment, or from a small portion of the acceptance area, the production dredges will move to the next acceptance area to be dredged and a smaller, alternative dredge will be employed for the redredging effort. It has been assumed that redredging will begin as soon as the need for it is identified in a certification unit rather than after an entire river reach has been completely dredged to the design elevations and all sampling has been completed in the large reach area.
8. Soundings will be taken as redredging proceeds in an area, and a second round of post-dredging samples will be collected as soon as the dredge completes a defined area.
9. Backfilling and shoreline stabilization will begin as soon as a portion of a work area has been determined to meet cleanup levels and generally while the production dredges are still working in the area. The example production schedule assumes that the backfill and shoreline stabilization work will be isolated from the dredging effort by conventional silt curtains installed within the overall area surrounded by the turbidity barrier.
10. As soon as a work area has been completely backfilled and shoreline stabilization work has been completed, removal of the turbidity barrier surrounding that work area will begin.
11. As the dredging season draws to a close, dredging will cease in time to permit backfilling and shoreline stabilization work to be completed in all areas dredged prior to demobilization for the winter.
12. Unless there is a specific reason for leaving a particular section of silt barrier in place over the winter and it can be shown that the barrier can withstand the spring runoff and ice movement, all silt barriers will be removed from the river at the end of each dredging season.

Malcolm Pirnie/TAMS-Earth Tech 7 Peer Review Draft – October 2003 Engineering Performance Standards Part 3: Dredging Productivity – Attachment 1
13. It has been assumed that demobilization of major pieces of dredging equipment that cannot be moved by truck will be moved out of the area on the last possible day of the canal operating season but that smaller dredges and work boats that can be transported by truck will remain on the site to complete any required work such as completing backfill and shoreline stabilization work, removing turbidity barriers, and dismantling dredge pipe for storage on site for the following year’s work. It has also been assumed that demobilizing and winterizing on-shore treatment and shipping facilities will occur after the canal has closed for the season.
1.2 Selection of Equipment and Estimates of Production Rates 1.2.1 Silt Barrier Installation and Removal Equipment required to install and remove the turbidity barrier consists of a work boat with a flat deck at least 100 feet long and equipped with a light crane for handling the HDPE barrier material. A hydraulic excavator type machine, similar to a Caterpillar 350 Materials Handler, would be mounted on a deck barge and equipped with a vibratory hammer or pile driver for installing steel sheet piling. The assumed production rate for this work is as follows:
• Installing sheet piling - 90 linear feet per day of wall per crew • Installing HDPE barrier - 200 linear feet of barrier per day per crew • Removing sheet piling - 130 linear feet per day per crew • Removing HDPE barrier - 300 linear feet per day per crew
1.2.2 Mechanical Dredging Two different size mechanical dredges have been selected for use wherever the water depth is great enough to permit access for scows. These are the same dredges as described in Appendix E-1 of the FS and are as follows: • A dredge consisting of a hydraulic excavator with an extended boom and fitted with a 4 cubic
yard, hydraulically actuated horizontal profiler bucket. The assumed effective production rate of this piece of equipment is 82 cubic yards per hour.
• A dredge consisting of a hydraulic excavator with an extended boom and fitted with a 2 cubic
yard, hydraulically actuated horizontal profiler bucket. The assumed effective production rate of this piece of equipment is 27 cubic yards per hour.
1.2.3 Hydraulic Dredging The hydraulic dredge selected for evaluation is the same dredge described in Appendix H-1 of the FS and consists of a 12 inch cutterhead dredge with a 600 HP pump and 200 HP auxiliaries, and 900 HP booster pumps where required. Typically, a dredge of this size has a capacity of from 400 to 575 cubic yards per hour depending upon the distance pumped and whether it is pumping sand and gravel or silts and clay sediments. However, because dredging contaminated sediments requires careful attention to cut depths and location, resuspension of sediments other

Malcolm Pirnie/TAMS-Earth Tech 8 Peer Review Draft – October 2003 Engineering Performance Standards Part 3: Dredging Productivity – Attachment 1
special issues, it has been assumed that the effective production rate for this dredge would be from 260 to 275 cubic yards per hour, depending upon the type of sediment and distance pumped. 1.2.4 Alternative Dredging Equipment Alternative dredging equipment will be required for use in areas where the post-dredging water depth is less than about 3 feet and for re-dredging areas where post dredging diver inspections and/or sampling indicates that a very shallow layer of sediment must still be removed, or where sediment remains in pockets in bedrock or is surrounded by boulders or other obstructions. Two types of equipment have been considered: an amphibious, hydraulic excavator with a hydraulically actuated, horizontal profiler bucket of about 1 cubic yard capacity; and a small, probably 8 or 10-inch, hydraulic dredge fitted with a cleanup dredge head or a plain suction mouth for cleanup work. The amphibious excavator would be used in conjunction with a scow with a capacity of from 500 to 1000 cubic yards and a draft, when empty, of less than 1 foot. The scow would be equipped with a hopper containing a screen to remove debris and would be towed into the shallow water and loaded with the hydraulic excavator until it sits on the river bottom. It would be unloaded in-place using a Toyo Pump that would transfer the sediment to a second scow located in the navigation channel which would carry the sediment to the on-shore processing facility. Alternatively, mechanical dredges, which utilize a hopper and hydraulic dredge pump to transfer mechanically dredged sediments to a scow located in deep water, could be used. This equipment typically incorporates specific gravity loops with provisions for adjusting the water content of the slurry as needed.
Small hydraulic dredges fitted with cleanup dredgeheads have been used to remove unconsolidated sediment deposits with high, in-situ moisture contents. These dredges are capable of effective production rates in the 100 to 120 cubic yards per hour range but would probably average no more than 40 to 60 cubic yards per hour under difficult dredging conditions or when used to redredge an area where the layer of sediment to be removed is less than one foot. Hydraulic dredges usually do not operate continuously for extended periods of time. Some down-time, usually on the order of 8 hours per week, is necessary for routine maintenance. It is also necessary to stop dredging to add slurry pipeline and booster pumping units as the equipment moves down the river, to remove debris that has become lodged in the intake, to relocate the dredge from one work area to another, and other reason. Accordingly, an allowance must be made for the time that the dredge is not actively removing sediment. In preparing the example production schedule, it has been assumed that dredging will be permitted 24 hours per day, six days per week and that routing weekly maintenance on the equipment will be accomplished on Sundays. Thus, the total time available for dredging would be 24 hours per day times 6 days per week or 144 hours per week. The length of the dredging season has been assumed to be 30 weeks, so the total available time for dredging over the entire season would be 30 weeks at 144 hours per week, or 4,320 hours per year. In order to meet the Performance Standard for Dredging Productivity of 480,000 cubic yards per year during Phase 2

Malcolm Pirnie/TAMS-Earth Tech 9 Peer Review Draft – October 2003 Engineering Performance Standards Part 3: Dredging Productivity – Attachment 1
of the project, a single production dredge working at a reduced rate of 260 cubic yards per hour would have to operate for 1,846 hours out of the 4,320 hours available, or about 43 percent of the total available time. To meet a target removal of 530,000 cubic yards in a year, the dredge would have to operate effectively for 2038 hours per year, or about 47 percent of the time. In actuality, with one “production” hydraulic dredge operating at about 260 cubic yards per hour and one alternative hydraulic dredge operating at about 50 cubic yards per hour, the two dredges would only have to operate about 36 percent of the time to meet the 480,000 cubic yard per year dredging productivity standard and 40 percent of the time to meet the 530,000 cubic yard per year target productivity rate. 1.2.5 Backfilling Two methods of placing backfill have been considered: mechanical placement using a clamshell bucket on a crane, and hydraulic placement with a sand spreader. Placement of backfill with a clamshell bucket has been demonstrated to be feasible at the Grasse River near Massena, NY and achieved a production rate of approximately 1200 square feet of coverage per hour for a 1-foot lift of backfill. The material was brought to the work area by barge and spread with a 2.5 cubic yard clamshell bucket on a crane. The crane boom was moved as the bucket was opened to spread the material, and produced a cap varying in thickness from about 6 inches to 18 inches with an average thickness of 1 foot. Obtaining complete coverage of the river bottom was assisted by the use of WINOPS GPS equipment to identify the location of each bucket full of soil placed. The proper placement of the backfill material at a reasonable production rate was highly dependent upon the skill of the crane operator.
Hydraulic equipment especially designed to spread backfill or capping material over a dredged bottom is available and has been used successfully on a number of projects. Typically, this equipment consists of a dredge pump to pump a sand slurry from a scow or a shoreline materials preparation area, dredge pipeline from the dredge pump to the spreader barge, and a spreading device mounted on a deck barge. The backfill material is hauled to the site in a barge or placed in a basin on shore close to the area to be backfilled. River water is pumped through high-pressure nozzles located at the dredge pump suction intake to create a slurry, and the slurry is pumped through a pipeline to the spreader. The spreader consists of a deck barge with a spreader pipes arrayed like fingers on a hand and connected to a splitter box. The slurry of backfill material is pumped into the splitter box and flows out through the spreader pipes. The spreader pipes protrude over the end of the deck barge and discharge below the water surface as the spreader barge is slowly moved over the area to be backfilled. Hydraulic spreaders are easily capable of placing sand or a silt-sand mixture of backfill at effective production rates in the 250 cubic yards per hour range and can cover over an acre per day or more with a 1-foot thick layer of backfill.
For the purposes of this document, it has been assumed that the river bottom can be backfilled at an effective production rate of 0.5 acres per day. It has also been assumed that backfilling will begin as soon as work in an certification unit has been determined to be complete.

Malcolm Pirnie/TAMS-Earth Tech 10 Peer Review Draft – October 2003 Engineering Performance Standards Part 3: Dredging Productivity – Attachment 1
1.3 Conceptual Production schedule Utilizing the production rates developed and presented above, an example production schedule has been developed for the mechanical dredging option using Primavera Systems©, Inc. software. This example schedule portrays the conceptual sequence and duration of one possible approach. The mechanical dredging option was selected for use in preparing a schedule because mechanical dredging is typically a slower process, and therefore more conservative, than hydraulic dredging. To verify the assumption that mechanical dredging is the slower option, a schedule of similar level of detail was developed that incorporates hydraulic dredges for use in River Section 1 only and mechanical dredges in all other River Sections plus any areas in River Section 1 that contain boulders or excessive debris. This example schedule was developed under the assumption that there would be only one processing site and that it would be located at the northerly limit of the Thompson Island Pool. The results of this analysis indicated that hydraulic dredging (including the additional effort of installing/removing dredge pipeline) is significantly faster than mechanical dredging, thus verifying the assumption. This holds true until distances from the dredge to the processing facility approach about 5 miles, the approximate distance from the Thompson Island Dam to the assumed processing site at the northerly end of the Thompson Island Pool. This example production schedule provided as a series of pullout sheets at the end of this Attachment 1. The production schedule backup, including estimates of volumes of sediment to be dredged mechanically, by phase and river mile, site preparation quantities, and site restoration (backfill) quantities, and maps of each one-mile reach of the river, are provided in Attachment 2. The estimated volumes of sediment to be dredged, by river mile, whether the sediment consists of cohesive or non-cohesive soil, and information on pre- and post-dredging water depths, together with maps of each one-mile reach of the river, are provided in Attachment 3 to this Part. The information on water depths, types of sediment, probable volumes to be dredged, etc, are all preliminary in nature and must be confirmed as part of the design. However, this information is judged to be accurate enough to support the development of an example schedule that illustrates the feasibility of completing the project in the time frame defined by the ROD. While changes in the percentage of cohesive or non-cohesive sediment, for instance, will affect the design of the sediment processing facility, they will have a relatively minor effect on the rate at which the sediment can be dredged. Table 1-2 summarizes the seasonal activities that would be completed if the project were implemented as shown on the example production schedule. The dredging work generally proceeds from upstream to downstream, and the work would be completed in 6 construction seasons. The volume remediated includes all targeted remediation and navigational dredging areas. The area remediated includes both standard and critical backfill areas. Critical backfill areas are defined as wetland areas that require additional backfill. These areas will in turn take longer to backfill due to their sensitive nature. The dredging completion date reflects the date when all dredging activities (including redredging after confirmatory sampling) would be completed. The work completion date reflects the time needed after dredging completion to complete site restoration activities (backfilling, post backfill surveying, obstruction replacement, shoreline stabilization, containment removal) and all demobilization activities.

Malcolm Pirnie/TAMS-Earth Tech 11 Peer Review Draft – October 2003 Engineering Performance Standards Part 3: Dredging Productivity – Attachment 1
Table 1-3 shows the amounts of dredging, taken from the example production schedule, that would be completed during Phase 1 broken down by different river conditions. Of the 268,980 cubic yards assumed to be dredged during Phase 1, about 246,065 cubic yards could be accomplished with the 2 cubic yard and 4 cubic yard mechanical dredges devoted to production work while about 22,910 cubic yards are located in shallow areas where alternative dredging equipment would be required. About 80,370 cubic yards of the “production” dredging is located in the navigation channel of the canal. The amount completed during Phase 1 in the example production schedule exceeds the 240,000 cubic yards established as the productivity standard for Phase 1. Table 1-4 presents the overall performance as shown in the example production schedule. The cumulative volume shown in the example production schedule exceeds the target cumulative volume requirement for both phases of dredging. The cumulative volumes presented in Table 1-4 include remediation and navigational dredging areas. The key assumptions and parameters used in developing the example production schedule are as follows:
• All three river sections (R1, R2, & R3), (total estimated volume of 2.65 million cubic yards, covering approximately 40 miles) are presented in the example production schedule.
• Mechanical dredging scenario is presented in the production schedule. • Dredging activities will generally proceed from upstream to downstream. • Where possible, contiguous dredge certification units are dredged sequentially. • Phase 1 will be completed during the first season. • The dredging crews must achieve the full production-dredging rate for at least a 30 day
period by end of the Phase 1 season, (min 240,000 cubic yards, dredging starting late ~ mid June 2006).
• Phase 2 will be completed during years 2 through 6, (min 480,000 cubic yards/year, work season from May 1 - Nov 30, 2007 to 2011).
• Dredging work will be done 6 working days/week, and that at least 13 hours of dredging can be achieved during a work day when dredging is taking place.
• Winterization of equipment can begin 10 days after completion of season’s dredging. • The production rate for critical area backfilling (1/2 acre/day) is based on half of the
production rate for general backfill areas (1 acre/day) due to additional time needed for shallow backfill areas and preparation time for future shoreline planting.
• The same crew(s) used for containment barrier placement will be used for containment barrier removal.
• Different crews will be used for shoreline stabilization/restoration tasks: backfilling, shoreline stabilization, and containment removal.

Malcolm Pirnie/TAMS-Earth Tech 12 Peer Review Draft – October 2003 Engineering Performance Standards Part 3: Dredging Productivity – Attachment 1
Production rate assumptions for site preparation, mechanical dredging, and site restoration activities are presented in Table 1-5. Production rates were used in the critical path schedule for each dredge certification unit. Depending on scheduling, work can be performed on more than one certification unit at a time; therefore the number of crews needed for site preparation, dredging, and site restoration activities can vary at any one point in the schedule (the average number of crews is presented in the key assumptions). Production rates based on linear footage of shoreline and shoreline obstacles were based on the figures presented in Attachment 2.

Tables 1-1 to 1-5
Production Schedule
Table 1-1: Hydraulic and Mechanical Dredge Volumes by Location Table 1-2: Mechanical Dredging Schedule by Phase Table 1-3: Phase I Dredging Quantities Table 1-4: Cumulative Dredge Volumes Table 1-5: Example Production Schedule Production Rates

Malcolm Pirnie/TAMS-Earth Tech Peer Review Draft – October 2003 Engineering Performance Standards Part 3: Dredging Productivity – Attachment 1
Table 1-1 Hydraulic and Mechanical Dredge Volumes by Location
Mechanical Dredge Hydraulic Dredge
River Section 4 C.Y. Dredge 2 C.Y. Dredge Total
Main Production
Dredge
Small, Cleanup Dredge
Total
1 1,256,000 (80%) 309,000 (20%) 1,565,000 1,390,000 (89%) 174,000 (11%) 1,564,000
2 475,000 (95%) 27,000 (5%) 502,000 480,000 (96%) 22,000 (4%) 502,000
3 366,000 (65%) 196,000 (35%) 562,000 562,000 (100%) 0 (0%) 562,000
Total 2,097,000 (80%) 532,000 (20%) 2,629,000 2,432,000 (93%) 196,000 (7%) 2,628,000
* Total volumes may not equal across dredging methods due to operational requirements of the equipment
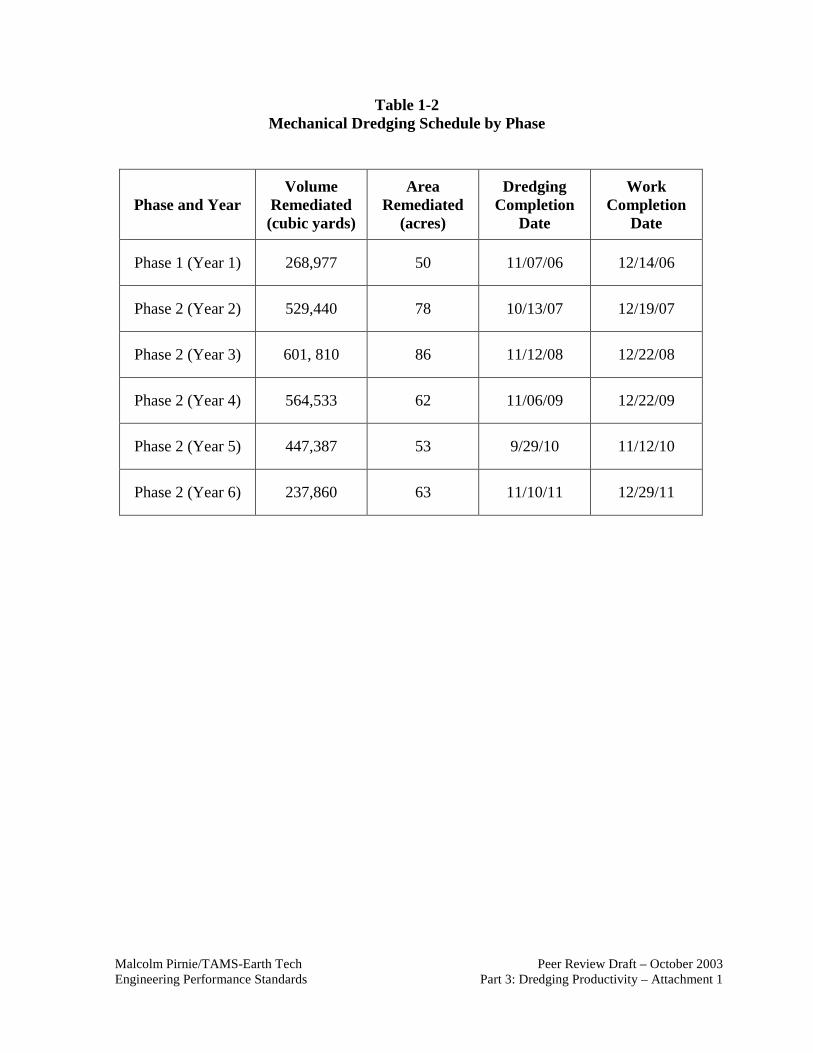
Malcolm Pirnie/TAMS-Earth Tech Peer Review Draft – October 2003 Engineering Performance Standards Part 3: Dredging Productivity – Attachment 1
Table 1-2 Mechanical Dredging Schedule by Phase
Phase and Year Volume
Remediated (cubic yards)
Area Remediated
(acres)
Dredging Completion
Date
Work Completion
Date
Phase 1 (Year 1) 268,977 50 11/07/06 12/14/06
Phase 2 (Year 2) 529,440 78 10/13/07 12/19/07
Phase 2 (Year 3) 601, 810 86 11/12/08 12/22/08
Phase 2 (Year 4) 564,533 62 11/06/09 12/22/09
Phase 2 (Year 5) 447,387 53 9/29/10 11/12/10
Phase 2 (Year 6) 237,860 63 11/10/11 12/29/11

Malcolm Pirnie/TAMS-Earth Tech Peer Review Draft – October 2003 Engineering Performance Standards Part 3: Dredging Productivity – Attachment 1
Table 1-3 Phase 1 Dredging Quantities
Phase 1 Activities
Amount Completed During Phase 1
Demonstrated by Production Schedule
Phase 1 Performance Standard Requirement
Total Dredging 268,977 cubic yards Approximately 240,000 cubic yards
Production Dredging 246,065 cubic yards Approximately 175,000 cubic yards
Alternative Dredging Equipment (Shallow areas) 22,911 cubic yards Approximately 15,000
cubic yards
Uncontained Dredging (Navigational Dredging) 80,366 cubic yards Approximately 50,000
cubic yards

Malcolm Pirnie/TAMS-Earth Tech Peer Review Draft – October 2003 Engineering Performance Standards Part 3: Dredging Productivity – Attachment 1
Table 1-4 Cumulative Dredge Volumes
Phase and Year
Cumulative Volume Shown in Example
Production Schedule (cubic yards)
Required Cumulative
Volume (cubic yards)
Target Cumulative Volume
(cubic yards)
Phase 1 (Year 1) 268,977 240,000 265,000
Phase 2, (Year 2) 798,417 720,000 795,000
Phase 2, (Year 3) 1,400,227 1,200,000 1,325,000
Phase 2, (Year 4) 1,964,760 1,680,000 1,855,000
Phase 2, (Year 5) 2,412,147 2,160,000 2,385,000
Phase 2, (Year 6) 2,650,000 2,650,000 2,650,000

Table 1-5 Example Production Schedule Production Rates
Malcolm Pirnie/TAMS-Earth Tech Peer Review Draft – October 2003 Engineering Performance Standards Part 3: Dredging Productivity – Attachment 1
Site Preparation
Work Element Production Rate
Key Assumptions
Installing Containment Barriers: Steel Sheet Piling HDPE Barriers
90 l.f./day 200 l.f./day
Jersey barriers may be used in lieu of sheet piling in areas < 2’ deep. HDPE silt barrier and steel sheet piling are not needed for navigational dredging areas or in areas of rock outcrops. Steel sheet piling installation assumes 1 crew (max 2 crews), 8 hours production time per day. HDPE silt barrier installation assumes 2 crews (minimum 1 crew, maximum 4 crews), 8 hours production time per day.
Clearing and Snagging Shoreline
400 l.f./day
Assumes <2 trees/down trees/logs on average per 100 l.f. shoreline. Assumes 8 hours production time per day. Clearing and Snagging Shoreline assumes 1 crew (maximum 2 crews).
Remove Obstacles
1/2 day/ obstruction plus 1 day/ dock removal
Assumes 8 hours production time per day, assumes 1 crew.
Dredging Work Element Production
Rate Key Assumptions

Table 1-5 Example Production Schedule Production Rates
Malcolm Pirnie/TAMS-Earth Tech Peer Review Draft – October 2003 Engineering Performance Standards Part 3: Dredging Productivity – Attachment 1
Mechanical Dredging Production Equipment Dredging Alternative Equipment Dredging1 Additional Duration for Obstruction Dredging
82 CY/hr or 1066 CY/day 27 CY/hr or 351 CY/day
Schedule based on 13 hr day Schedule based on 13 hr day of effective dredging time when dredging is actually under way. Alternative dredge(s) start work in an area 3 days after production dredge. 1/2 day delay per obstruction.
Confirmatory Testing and Surveying
Calculated lag Starts 2 days after Alternative dredge starts and finishes 2 days after dredging is completed. Schedule assumes 1 crew, 13 hour days. Minimum one day for surveying for all areas less than 30 acres (approximately 30 acres/day).
Redredging Calculated lag
Re-dredging (equipment will vary) schedule equal to ½ the total number of days required for design cut with the primary and alternative dredges.. Re-dredging finishes 10 days after sampling completed. Schedule assumes 13 hours of effective dredging per day..
Additional Confirmatory Testing and Surveying
Calculated lag Starts 2 days after Redredging starts and finish 2 days after re-dredging is completed. Schedule assumes 1 crew, 13 hour days.
Site Restoration Work Element Production
Rate Key Assumptions
Backfilling Non-Critical Sub-sites
1 acre/day
Backfilling finishes 7 days after re-confirmatory testing and surveying ends. Assumes closure areas managed in less than 5 acre areas. Schedule assumes maximum 2 crews for non-critical backfill areas, 8 hours per day.
1 As discussed in Attachment 3, for the mechanical dredging scenario presented in the Productivity Schedule, it is assumed that areas with a post-dredging water depth of 6' or greater (deep areas) would be performed by the large production dredge and areas with shallow post-dredging water depth of less that 6' (shallow areas) would be performed by the small alternative dredge. Due the large volume (approximately 155,000 CY) of shallow area material in the backwater area behind (west) of Griffin Island, an exception to this assumption was made in development of the Productivity Schedule. Specifically, we have assumed the utilization of a production dredge, or a different dredge with a production rate equal to or greater than the production dredge's 82 CY/hour rate. Furthermore, transport of the sediment would be accomplished using a technique such as pumping to scows in deeper water, pumping to the processing/transfer facility, partially loading scows, using enhanced-floation deck barges, hauling in trucks across Griffin Island to load onto scows in deeper water, or some combination of these techniques. The underlying assumption is that these modified techniques would be less costly and more practical than having numerous (up to 4) small alternate dredges to accomplish the same volume.

Table 1-5 Example Production Schedule Production Rates
Malcolm Pirnie/TAMS-Earth Tech Peer Review Draft – October 2003 Engineering Performance Standards Part 3: Dredging Productivity – Attachment 1
Critical Sub-sites
1/2 acre/day
Schedule assumes maximum 3 crews for critical backfill areas, 8 hours per day.
Shoreline Stabilization/ Restoration
150 l.f./day
Assumes 8 hours production time per day. Assumes fine stone fill, 50 c.y./day; 9 c.f. per linear foot of shoreline; placed from water. Shoreline restoration assumes maximum 2 crews. Assumes 8 hours per day. Shoreline restoration included for navigational dredging areas that are not contained but are adjacent to the shoreline.
Post Backfill Surveying Non-Critical Sub-sites Critical Sub-sites
Calculated lag Starts 2 days after the start of backfilling. Schedule assumes 1 crew (maximum 2 crews) 8 hours per day. Schedule assumes 1 crew (maximum 3 crews) 8 hours per day.
Removing Containment Barriers Steel Sheet Piling HDPE Barrier
130 l.f./day 300 l.f./day
Removal of containment barriers will occur after backfill stabilization. Containment will be extracted and salvaged. Schedule assumes 1 crew (maximum 2 crews) will be used for Steel Sheet Piling removal. Assumes 8 hours per day. Schedule assumes 2 crews (minimum 1 crew, maximum 4 crews) will be used for Steel Sheet Piling removal. Assumes 8 hours per day.
Obstruction Replacement 1 day/dock
Obstruction Replacement assumes 1 crew 8 hours per day.

Figure 1-1
Silt Barrier
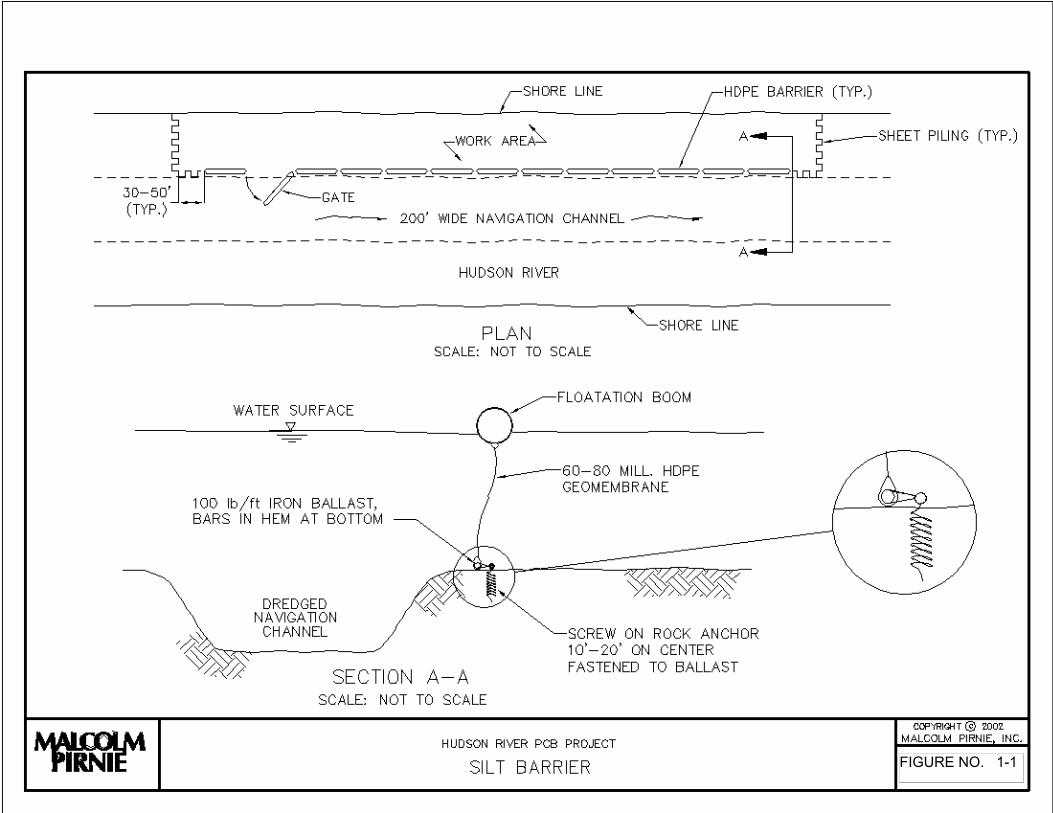
FIGURE NO. 1-1

Production Schedule:
Phase 1 (Year 1)

ActivityID
ActivityDescription
CalID
WBSPH SITETASKOrigDur
PredecessorsSuccessorsResourceID
Units perTime Period
RemDur
% EarlyStart
EarlyFinish
Phase IAround Rogers Island RM 193.75 - 194.5Site Summary 00000 Phase I (Year 1) (Summary) 195* 195* 0 02MAY06 14DEC06
00040 Site 1 (Summary) 149* 149* 0 02MAY06 21OCT06
Mobilization 00005 Mobilization (Summary) 30 30 0 02MAY06 05JUN06
00020 Mobilize Equipment 20 20 0 02MAY06 24MAY06
00030 Activiate Infrastructure 30 30 0 02MAY06 05JUN06
Site Preparation 00050 Site Preparation (Summary) 9 9 0 06JUN06 15JUN06
00060 Install Steel Sheet Piling 9 9 0 06JUN06 15JUN06
00070 Install HDPE Silt Barriers 2 2 0 14JUN06 15JUN06
00080 Clearing and Snagging Shoreline 1 1 0 15JUN06 15JUN06
00090 Remove Obstacles 3 3 0 13JUN06 15JUN06
Dredging 00100 Dredging (Summary) 76 76 0 16JUN06 12SEP06
00110 Design Cut(s) - (1) Primary Dredge 61 61 0 16JUN06 25AUG06
00120 Design Cut(s) - (1) Alternate Dredge 36 36 0 20JUN06 31JUL06
00130 Add. Alternate Dredging Around Obstructions 2 2 0 01AUG06 02AUG06
00140 Confirmation Testing/Surveying - Primary Dredge 61 61 0 19JUN06 28AUG06
00150 Confirmation Testing/Surveying - Alt. Dredge 36 36 0 24JUN06 04AUG06
00160 Redredging 49 49 0 14JUL06 08SEP06
00170 Additional Confirmation Testing/Surveying 49 49 0 18JUL06 12SEP06
Restoration 00180 Restoration (Summary) 44 44 0 01SEP06 21OCT06
00190 Backfill Non-Critical Areas 11 11 0 02SEP06 14SEP06
00200 Backfill Critical Areas 8 8 0 06SEP06 14SEP06
00210 Post Backfilling Survey (Non Critical Areas) 11 11 0 05SEP06 16SEP06
00220 Post Backfilling Survey (Critical Areas) 8 8 0 08SEP06 16SEP06
00225 Replace Obstructions 1 1 0 01SEP06 01SEP06
00230 Restore Shoreline 44 44 0 01SEP06 21OCT06
00240 Remove Sheet Piling 6 6 0 18SEP06 23SEP06
00250 Remove HPDE Silt Fences 1 1 0 18SEP06 18SEP06
RM 193.5 - 193.75Site Summary 00260 Site 2 (Summary) 38* 38* 0 07SEP06 20OCT06
Site Preparation 00270 Site Preparation (Summary) 5 5 0 07SEP06 12SEP06
00280 Install Steel Sheet Piling 5 5 0 07SEP06 12SEP06
00290 Install HDPE Silt Barriers 3 3 0 09SEP06 12SEP06
00300 Clearing and Snagging Shoreline 1 1 0 12SEP06 12SEP06
00310 Remove Obstacles 1 1 0 12SEP06 12SEP06
Dredging 00320 Dredging (Summary) 27 27 0 13SEP06 13OCT06
00330 Design Cut(s) - (1) Primary Dredge 12 12 0 13SEP06 26SEP06
00350 Add. Alternate Dredging Around Obstructions 1 1 0 16SEP06 16SEP06
00360 Confirmation Testing/Surveying - Primary Dredge 12 12 0 15SEP06 28SEP06
00370 Confirmation Testing/Surveying - Alt. Dredge 1 1 0 19SEP06 19SEP06
00380 Redredging 6 6 0 04OCT06 10OCT06
00390 Additional Confirmation Testing/Surveying 6 6 0 07OCT06 13OCT06
2006 2007APR MAY JUN JUL AUG SEP OCT NOV DEC JAN FEB MAR
27 3 10 17 24 1 8 15 22 29 5 12 19 26 3 10 17 24 31 7 14 21 28 4 11 18 25 2 9 16 23 30 6 13 20 27 4 11 18 25 1 8 15 22 29 5 12 19 26 5 12 19 26
Phase I (Year 1) (Summary)Site 1 (Summary)
Mobilization (Summary)Mobilize Equipment
Activiate Infrastructure
Site Preparation (Summary)Install Steel Sheet PilingInstall HDPE Silt BarriersClearing and Snagging ShorelineRemove Obstacles
Dredging (Summary)Design Cut(s) - (1) Primary Dredge
Design Cut(s) - (1) Alternate DredgeAdd. Alternate Dredging Around Obstructions
Confirmation Testing/Surveying - Primary DredgeConfirmation Testing/Surveying - Alt. Dredge
RedredgingAdditional Confirmation Testing/Surveying
Restoration (Summary)Backfill Non-Critical AreasBackfill Critical Areas
Post Backfilling Survey (Non Critical Areas)Post Backfilling Survey (Critical Areas)
Replace ObstructionsRestore Shoreline
Remove Sheet PilingRemove HPDE Silt Fences
Site 2 (Summary)
Site Preparation (Summary)Install Steel Sheet PilingInstall HDPE Silt BarriersClearing and Snagging ShorelineRemove Obstacles
Dredging (Summary)Design Cut(s) - (1) Primary Dredge
Add. Alternate Dredging Around ObstructionsConfirmation Testing/Surveying - Primary Dredge
Confirmation Testing/Surveying - Alt. DredgeRedredging
Additional Confirmation Testing/Surveying
© Primavera Systems, Inc.
Start Date 18APR05Finish Date 15NOV11Data Date 18APR05Run Date 22APR03 10:25
HPCB
Malcolm Pirnie, Inc.
Hudson River PCB Dredging
Phase I (Year 1)
Sheet 1 of 3Date Revision Checked Approved

ActivityID
ActivityDescription
CalID
WBSPH SITETASKOrigDur
PredecessorsSuccessorsResourceID
Units perTime Period
RemDur
% EarlyStart
EarlyFinish
Restoration 00400 Restoration (Summary) 8 8 0 14OCT06 23OCT06
00410 Backfill Non-Critical Areas 2 2 0 16OCT06 17OCT06
00430 Post Backfilling Survey (Non Critical Areas) 2 2 0 18OCT06 19OCT06
00450 Restore Shoreline 6 6 0 14OCT06 20OCT06
00460 Remove Sheet Piling 3 3 0 20OCT06 23OCT06
00470 Remove HPDE Silt Fences 2 2 0 20OCT06 21OCT06
RM 192.5 - 193.5 WSite Summary 00480 Site 3 (Summary) 83* 83* 0 10AUG06 14NOV06
Site Preparation 00490 Site Preparation (Summary) 8 8 0 13SEP06 21SEP06
00500 Install Steel Sheet Piling 6 6 0 15SEP06 21SEP06
00510 Install HDPE Silt Barriers 8 8 0 13SEP06 21SEP06
00520 Clearing and Snagging Shoreline 1 1 0 21SEP06 21SEP06
00530 Remove Obstacles 1 1 0 21SEP06 21SEP06
Dredging 00540 Dredging (Summary) 73 73 0 10AUG06 02NOV06
00550 Design Cut(s) - (2) Primary Dredges 58 58 0 10AUG06 16OCT06
00560 Design Cut(s) - (2) Alternate Dredges 10 10 0 22SEP06 03OCT06
00580 Confirmation Testing/Surveying - Primary Dredge 58 58 0 12AUG06 18OCT06
00590 Confirmation Testing/Surveying - Alt. Dredge 10 10 0 25SEP06 05OCT06
00600 Redredging 34 34 0 21SEP06 30OCT06
00610 Additional Confirmation Testing/Surveying 34 34 0 25SEP06 02NOV06
Restoration 00620 Restoration (Summary) 28 28 0 20OCT06 21NOV06
00640 Backfill Critical Areas 14 14 0 20OCT06 04NOV06
00660 Post Backfilling Survey (Critical Areas) 14 14 0 23OCT06 07NOV06
00670 Restore Shoreline 15 15 0 04NOV06 21NOV06
00680 Remove Sheet Piling 4 4 0 08NOV06 11NOV06
00690 Remove HPDE Silt Fences 6 6 0 08NOV06 14NOV06
RM 191.5 - 192.5 W Part 1Site Summary 07000 Site 5 (Part1) (Summary) 59* 59* 0 14SEP06 21NOV06
Site Preparation 07010 Site Preparation (Summary) 13* 13* 0 12SEP06 26SEP06
07020 Install Steel Sheet Piling 11 11 0 14SEP06 26SEP06
07030 Install HDPE Silt Barriers 13 13 0 12SEP06 26SEP06
07040 Clearing and Snagging Shoreline 1 1 0 26SEP06 26SEP06
07050 Remove Obstacles 2 2 0 25SEP06 26SEP06
Dredging 07060 Dredging (Summary) 36* 36* 0 27SEP06 07NOV06
07070 Design Cut(s) - (2) Primary Dredge 21 21 0 27SEP06 20OCT06
07075 Design Cut(s) - (2) Alternate Dredges 4 4 0 30SEP06 04OCT06
07090 Confirmation Testing/Surveying - Primary Dredge 12 12 0 10OCT06 23OCT06
07100 Confirmation Testing/Surveying - Alt. Dredge 4 4 0 03OCT06 06OCT06
07110 Redredging 13 13 0 20OCT06 03NOV06
07120 Additional Confirmation Testing/Surveying 13 13 0 24OCT06 07NOV06
Restoration 07130 Restoration (Summary) 18* 18* 0 01NOV06 21NOV06
07140 Backfill Non-Critical Areas 27 27 0 01NOV06 01DEC06
07160 Restore Shoreline 19 19 0 31OCT06 21NOV06
2006 2007APR MAY JUN JUL AUG SEP OCT NOV DEC JAN FEB MAR
27 3 10 17 24 1 8 15 22 29 5 12 19 26 3 10 17 24 31 7 14 21 28 4 11 18 25 2 9 16 23 30 6 13 20 27 4 11 18 25 1 8 15 22 29 5 12 19 26 5 12 19 26
Restoration (Summary)Backfill Non-Critical Areas
Post Backfilling Survey (Non Critical Areas)Restore Shoreline
Remove Sheet PilingRemove HPDE Silt Fences
Site 3 (Summary)
Site Preparation (Summary)Install Steel Sheet PilingInstall HDPE Silt BarriersClearing and Snagging ShorelineRemove Obstacles
Dredging (Summary)Design Cut(s) - (2) Primary Dredges
Design Cut(s) - (2) Alternate DredgesConfirmation Testing/Surveying - Primary Dredge
Confirmation Testing/Surveying - Alt. DredgeRedredging
Additional Confirmation Testing/Surveying
Restoration (Summary)Backfill Critical Areas
Post Backfilling Survey (Critical Areas)Restore Shoreline
Remove Sheet PilingRemove HPDE Silt Fences
Site 5 (Part1) (Summary)
Site Preparation (Summary)Install Steel Sheet PilingInstall HDPE Silt BarriersClearing and Snagging ShorelineRemove Obstacles
Dredging (Summary)Design Cut(s) - (2) Primary Dredge
Design Cut(s) - (2) Alternate DredgesConfirmation Testing/Surveying - Primary Dredge
Confirmation Testing/Surveying - Alt. DredgeRedredging
Additional Confirmation Testing/Surveying
Restoration (Summary)Backfill Non-Critical Areas
Restore Shoreline
© Primavera Systems, Inc.
Start Date 18APR05Finish Date 15NOV11Data Date 18APR05Run Date 22APR03 10:25
HPCB
Malcolm Pirnie, Inc.
Hudson River PCB Dredging
Phase I (Year 1)
Sheet 2 of 3Date Revision Checked Approved

ActivityID
ActivityDescription
CalID
WBSPH SITETASKOrigDur
PredecessorsSuccessorsResourceID
Units perTime Period
RemDur
% EarlyStart
EarlyFinish
07170 Remove Sheet Piling 8 8 0 03NOV06 11NOV06
07180 Remove HPDE Silt Fences 8 8 0 03NOV06 11NOV06
Demobilization 00695 Winterize Infrastructure 20 20 0 04NOV06 27NOV06
00696 Demobilize Equipment 20 20 0 22NOV06 14DEC06
2006 2007APR MAY JUN JUL AUG SEP OCT NOV DEC JAN FEB MAR
27 3 10 17 24 1 8 15 22 29 5 12 19 26 3 10 17 24 31 7 14 21 28 4 11 18 25 2 9 16 23 30 6 13 20 27 4 11 18 25 1 8 15 22 29 5 12 19 26 5 12 19 26Remove Sheet PilingRemove HPDE Silt Fences
Winterize InfrastructureDemobilize Equipment
© Primavera Systems, Inc.
Start Date 18APR05Finish Date 15NOV11Data Date 18APR05Run Date 22APR03 10:25
HPCB
Malcolm Pirnie, Inc.
Hudson River PCB Dredging
Phase I (Year 1)
Sheet 3 of 3Date Revision Checked Approved
Production Schedule:
Phase 2 (Year 2)

ActivityID
ActivityDescription
CalID
WBSPH SITETASKOrigDur
PredecessorsSuccessorsResourceID
Units perTime Period
RemDur
% EarlyStart
EarlyFinish
Phase IIRM 191.5 - 192.5 W Part 2Site Summary 00918 Phase II (Year 2) (Summary) 217* 217* 0 11APR07 19DEC07 00920 Site 5 (Part 2) (Summary) 144 144 0 11APR07 25SEP07
Mobilization 00702 Seasonal Mobilization 20 20 0 11APR07* 03MAY07 00704 Activate Infrastructure 30 30 0 11APR07 15MAY07
Site Preparation 00930 Site Preparation (Summary) 14 14 0 04MAY07 19MAY07 00940 Install Steel Sheet Piling 2 2 0 18MAY07 19MAY07 00950 Install HDPE Silt Barriers 14 14 0 04MAY07 19MAY07 00960 Clearing and Snagging Shoreline 1 1 0 19MAY07 19MAY07 00970 Remove Obstacles 0 0 0 21MAY07 19MAY07
Dredging 00980 Dredging (Summary) 70 70 0 21MAY07 09AUG07 00990 Design Cut(s) - (2) Primary Dredges 55 55 0 21MAY07 23JUL07 01000 Design Cut(s) - (2) Alternate Dredges 28 28 0 24MAY07 25JUN07 01010 Add. Alternate Dredging Around Obstructions 0 0 0 26JUN07 25JUN07 01020 Confirmation Testing/Surveying - Primary Dredge 55 55 0 23MAY07 25JUL07 01030 Confirmation Testing/Surveying - Alt. Dredge 27 27 0 28MAY07 27JUN07 01040 Redredging 41 41 0 20JUN07 06AUG07 01050 Additional Confirmation Testing/Surveying 41 41 0 23JUN07 09AUG07
Restoration 01060 Restoration (Summary) 74 74 0 02JUL07 25SEP07 01070 Backfill Non-Critical Areas 0 0 0 13AUG07 11AUG07 01080 Backfill Critical Areas 36 36 0 02JUL07 11AUG07 01090 Post Backfilling Survey (Non Critical Areas) 26 26 0 15AUG07 13SEP07 01100 Post Backfilling Survey (Critical Areas) 36 36 0 04JUL07 14AUG07 01105 Replace Obstructions 0 0 0 11AUG07 10AUG07 01110 Restore Shoreline 21 21 0 11AUG07 04SEP07 01120 Remove Sheet Piling 1 1 0 14SEP07 14SEP07 01130 Remove HPDE Silt Fences 10 10 0 14SEP07 25SEP07
RM 189.5 - 190.5 WSite Summary 01800 Site 10 (Summary) 177 177 0 04MAY07 26NOV07
Site Preparation 01810 Site Preparation (Summary) 13 13 0 04MAY07 18MAY07 01820 Install Steel Sheet Piling 6 6 0 12MAY07 18MAY07 01830 Install HDPE Silt Barriers 13 13 0 04MAY07 18MAY07 01840 Clearing and Snagging Shoreline 1 1 0 18MAY07 18MAY07 01850 Remove Obstacles 0 0 0 19MAY07 18MAY07
Dredging 01860 Dredging (Summary) 127 127 0 19MAY07 13OCT07 01870 Design Cut(s) - (2) Primary Dredges 19 19 0 19MAY07 09JUN07 01880 Design Cut(s) - (1) Primary, (1) Alt. Dredges 109 109 0 23MAY07 26SEP07 01890 Add. Alternate Dredging Around Obstructions 0 0 0 27SEP07 26SEP07 01900 Confirmation Testing/Surveying - Primary Dredge 19 19 0 22MAY07 12JUN07 01910 Confirmation Testing/Surveying - Alt. Dredge 109 109 0 25MAY07 28SEP07 01920 Redredging 64 64 0 28JUL07 10OCT07 01930 Additional Confirmation Testing/Surveying 64 64 0 01AUG07 13OCT07
2007 2008APR MAY JUN JUL AUG SEP OCT NOV DEC JAN FEB MAR
2 9 16 23 30 7 14 21 28 4 11 18 25 2 9 16 23 30 6 13 20 27 3 10 17 24 1 8 15 22 29 5 12 19 26 3 10 17 24 31 7 14 21 28 4 11 18 25 3 10 17 24 31
Phase II (Year 2) (Summary)Site 5 (Part 2) (Summary)
Seasonal MobilizationActivate Infrastructure
Site Preparation (Summary)Install Steel Sheet PilingInstall HDPE Silt BarriersClearing and Snagging ShorelineRemove Obstacles
Dredging (Summary)Design Cut(s) - (2) Primary Dredges
Design Cut(s) - (2) Alternate DredgesAdd. Alternate Dredging Around Obstructions
Confirmation Testing/Surveying - Primary DredgeConfirmation Testing/Surveying - Alt. Dredge
RedredgingAdditional Confirmation Testing/Surveying
Restoration (Summary)Backfill Non-Critical Areas
Backfill Critical AreasPost Backfilling Survey (Non Critical Areas)
Post Backfilling Survey (Critical Areas)Replace Obstructions
Restore ShorelineRemove Sheet Piling
Remove HPDE Silt Fences
Site 10 (Summary)
Site Preparation (Summary)Install Steel Sheet PilingInstall HDPE Silt BarriersClearing and Snagging ShorelineRemove Obstacles
Dredging (Summary)Design Cut(s) - (2) Primary Dredges
Design Cut(s) - (1) Primary, (1) Alt. DredgesAdd. Alternate Dredging Around Obstructions
Confirmation Testing/Surveying - Primary DredgeConfirmation Testing/Surveying - Alt. Dredge
RedredgingAdditional Confirmation Testing/Surveying
© Primavera Systems, Inc.
Start Date 18APR05Finish Date 23JAN12Data Date 18APR05Run Date 02SEP03 13:58
HPCB
Malcolm Pirnie, Inc.
Hudson River PCB Dredging
Phase II (Year 2)
Sheet 1 of 3Date Revision Checked Approved

ActivityID
ActivityDescription
CalID
WBSPH SITETASKOrigDur
PredecessorsSuccessorsResourceID
Units perTime Period
RemDur
% EarlyStart
EarlyFinish
Restoration 01940 Restoration (Summary) 90 90 0 14AUG07 26NOV07 01950 Backfill Non-Critical Areas 0 0 0 17OCT07 16OCT07 01960 Backfill Critical Areas 54 54 0 15AUG07 16OCT07 01970 Post Backfilling Survey (Non Critical Areas) 0 0 0 19OCT07 18OCT07 01980 Post Backfilling Survey (Critical Areas) 54 54 0 17AUG07 18OCT07 01985 Replace Obstructions 0 0 0 14AUG07 13AUG07 01990 Restore Shoreline 90 90 0 14AUG07 26NOV07 02000 Remove Sheet Piling 4 4 0 19OCT07 23OCT07 02010 Remove HPDE Silt Fences 8 8 0 19OCT07 27OCT07
RM 190.5 - 191.5 WSite Summary 01580 Site 8 (Summary) 113 113 0 18MAY07 26SEP07
Site Preparation 01590 Site Preparation (Summary) 20 20 0 18MAY07 09JUN07 01600 Install Steel Sheet Piling 13 13 0 26MAY07 09JUN07 01610 Install HDPE Silt Barriers 20 20 0 18MAY07 09JUN07 01620 Clearing and Snagging Shoreline 1 1 0 09JUN07 09JUN07 01630 Remove Obstacles 0 0 0 11JUN07 09JUN07
Dredging 01640 Dredging (Summary) 74 74 0 11JUN07 04SEP07 01650 Design Cut(s) - (2) Primary Dredges 59 59 0 11JUN07 17AUG07 01660 Design Cut(s) - (1) Alternate Dredges 10 10 0 14JUN07 25JUN07 01670 Add. Alternate Dredging Around Obstructions 0 0 0 26JUN07 25JUN07 01680 Confirmation Testing/Surveying - Primary Dredge 59 59 0 13JUN07 20AUG07 01690 Confirmation Testing/Surveying - Alt. Dredge 10 10 0 16JUN07 27JUN07 01700 Redredging 32 32 0 26JUL07 31AUG07 01710 Additional Confirmation Testing/Surveying 32 32 0 30JUL07 04SEP07
Restoration 01720 Restoration (Summary) 29 29 0 24AUG07 26SEP07 01730 Backfill Non-Critical Areas 11 11 0 25AUG07 06SEP07 01740 Backfill Critical Areas 8 8 0 29AUG07 06SEP07 01750 Post Backfilling Survey (Non Critical Areas) 11 11 0 28AUG07 08SEP07 01760 Post Backfilling Survey (Critical Areas) 8 8 0 31AUG07 08SEP07 01765 Replace Obstructions 1 1 0 24AUG07 24AUG07 01770 Restore Shoreline 29 29 0 24AUG07 26SEP07 01780 Remove Sheet Piling 9 9 0 10SEP07 19SEP07 01790 Remove HPDE Silt Fences 13 13 0 10SEP07 24SEP07
RM 188.5 - 198.5 WSite Summary 02460 Site 12 (Summary) 99 99 0 03JUL07 25OCT07
Site Preparation 02470 Site Preparation (Summary) 18 18 0 03JUL07 23JUL07 02480 Install Steel Sheet Piling 6 6 0 17JUL07 23JUL07 02490 Install HDPE Silt Barriers 18 18 0 03JUL07 23JUL07 02500 Clearing and Snagging Shoreline 1 1 0 23JUL07 23JUL07 02510 Remove Obstacles 0 0 0 24JUL07 23JUL07
Dredging 02520 Dredging (Summary) 44 44 0 24JUL07 12SEP07 02530 Design Cut(s) - (2) Primary Dredges 29 29 0 24JUL07 25AUG07 02540 Design Cut(s) - (1) Alternate Dredge 20 20 0 27JUL07 18AUG07 02550 Add. Alternate Dredging Around Obstructions 0 0 0 20AUG07 18AUG07
2007 2008APR MAY JUN JUL AUG SEP OCT NOV DEC JAN FEB MAR
2 9 16 23 30 7 14 21 28 4 11 18 25 2 9 16 23 30 6 13 20 27 3 10 17 24 1 8 15 22 29 5 12 19 26 3 10 17 24 31 7 14 21 28 4 11 18 25 3 10 17 24 31
Restoration (Summary)Backfill Non-Critical AreasBackfill Critical Areas
Post Backfilling Survey (Non Critical Areas)Post Backfilling Survey (Critical Areas)
Replace ObstructionsRestore Shoreline
Remove Sheet PilingRemove HPDE Silt Fences
Site 8 (Summary)
Site Preparation (Summary)Install Steel Sheet PilingInstall HDPE Silt BarriersClearing and Snagging ShorelineRemove Obstacles
Dredging (Summary)Design Cut(s) - (2) Primary Dredges
Design Cut(s) - (1) Alternate DredgesAdd. Alternate Dredging Around Obstructions
Confirmation Testing/Surveying - Primary DredgeConfirmation Testing/Surveying - Alt. Dredge
RedredgingAdditional Confirmation Testing/Surveying
Restoration (Summary)Backfill Non-Critical AreasBackfill Critical Areas
Post Backfilling Survey (Non Critical Areas)Post Backfilling Survey (Critical Areas)
Replace ObstructionsRestore Shoreline
Remove Sheet PilingRemove HPDE Silt Fences
Site 12 (Summary)
Site Preparation (Summary)Install Steel Sheet PilingInstall HDPE Silt BarriersClearing and Snagging ShorelineRemove Obstacles
Dredging (Summary)Design Cut(s) - (2) Primary Dredges
Design Cut(s) - (1) Alternate DredgeAdd. Alternate Dredging Around Obstructions
© Primavera Systems, Inc.
Start Date 18APR05Finish Date 23JAN12Data Date 18APR05Run Date 02SEP03 13:58
HPCB
Malcolm Pirnie, Inc.
Hudson River PCB Dredging
Phase II (Year 2)
Sheet 2 of 3Date Revision Checked Approved

ActivityID
ActivityDescription
CalID
WBSPH SITETASKOrigDur
PredecessorsSuccessorsResourceID
Units perTime Period
RemDur
% EarlyStart
EarlyFinish
02560 Confirmation Testing/Surveying - Primary Dredge 29 29 0 26JUL07 28AUG07 02570 Confirmation Testing/Surveying - Alt. Dredge 20 20 0 30JUL07 21AUG07 02580 Redredging 20 20 0 17AUG07 08SEP07 02590 Additional Confirmation Testing/Surveying 20 20 0 21AUG07 12SEP07
Restoration 02600 Restoration (Summary) 50 50 0 29AUG07 25OCT07 02610 Backfill Non-Critical Areas 0 0 0 15SEP07 14SEP07 02620 Backfill Critical Areas 38 38 0 29AUG07 11OCT07 02630 Post Backfilling Survey (Non Critical Areas) 0 0 0 18SEP07 17SEP07 02640 Post Backfilling Survey (Critical Areas) 36 36 0 31AUG07 11OCT07 02645 Replace Obstructions 0 0 0 14SEP07 13SEP07 02650 Restore Shoreline 23 23 0 14SEP07 10OCT07 02660 Remove Sheet Piling 4 4 0 12OCT07 16OCT07 02670 Remove HPDE Silt Fences 12 12 0 12OCT07 25OCT07
Demobilization 02232 Winterize Infrastructure 20 20 0 11OCT07 02NOV07 02234 Demobilize Equipment 20 20 0 27NOV07 19DEC07
2007 2008APR MAY JUN JUL AUG SEP OCT NOV DEC JAN FEB MAR
2 9 16 23 30 7 14 21 28 4 11 18 25 2 9 16 23 30 6 13 20 27 3 10 17 24 1 8 15 22 29 5 12 19 26 3 10 17 24 31 7 14 21 28 4 11 18 25 3 10 17 24 31Confirmation Testing/Surveying - Primary Dredge
Confirmation Testing/Surveying - Alt. DredgeRedredging
Additional Confirmation Testing/Surveying
Restoration (Summary)Backfill Non-Critical Areas
Backfill Critical AreasPost Backfilling Survey (Non Critical Areas)
Post Backfilling Survey (Critical Areas)Replace Obstructions
Restore ShorelineRemove Sheet Piling
Remove HPDE Silt Fences
Winterize InfrastructureDemobilize Equipment
© Primavera Systems, Inc.
Start Date 18APR05Finish Date 23JAN12Data Date 18APR05Run Date 02SEP03 13:58
HPCB
Malcolm Pirnie, Inc.
Hudson River PCB Dredging
Phase II (Year 2)
Sheet 3 of 3Date Revision Checked Approved

Production Schedule:
Phase 2 (Year 3)

ActivityID
ActivityDescription
CalID
WBSPH SITETASKOrigDur
PredecessorsSuccessorsResourceID
Units perTime Period
RemDur
% EarlyStart
EarlyFinish
Phase IIRM 192.5 - 193.5 ESite Summary 00699 Phase II (Year 3) (Summary) 226* 226* 0 03APR08 22DEC08 00700 Site 4 (Summary) 109 109 0 03APR08 07AUG08 01801 Seasonal Mobilization 20 20 0 03APR08* 25APR08 01802 Activate Infrastructure 30 30 0 03APR08 07MAY08
Site Preparation 00710 Site Preparation (Summary) 17 17 0 26APR08 15MAY08 00720 Install Steel Sheet Piling 2 2 0 14MAY08 15MAY08 00730 Install HDPE Silt Barriers 17 17 0 26APR08 15MAY08 00740 Clearing and Snagging Shoreline 1 1 0 15MAY08 15MAY08 00750 Remove Obstacles 1 1 0 15MAY08 15MAY08
Dredging 00760 Dredging (Summary) 40 40 0 16MAY08 01JUL08 00770 Design Cut(s) - (2) Primary Dredges 25 25 0 16MAY08 13JUN08 00780 Design Cut(s) - (2) Alternate Dredges 2 2 0 20MAY08 21MAY08 00790 Add. Alternate Dredging Around Obstructions 0 0 0 22MAY08 21MAY08 00800 Confirmation Testing/Surveying - Primary Dredge 25 25 0 19MAY08 16JUN08 00810 Confirmation Testing/Surveying - Alt. Dredge 2 2 0 22MAY08 23MAY08 00820 Redredging 14 14 0 12JUN08 27JUN08 00830 Additional Confirmation Testing/Surveying 14 14 0 16JUN08 01JUL08
Restoration 00840 Restoration (Summary) 40 40 0 23JUN08 07AUG08 00850 Backfill Non-Critical Areas 25 25 0 24JUN08 22JUL08 00860 Backfill Critical Areas 0 0 0 04JUL08 03JUL08 00870 Post Backfilling Survey (Non Critical Areas) 25 25 0 26JUN08 24JUL08 00880 Post Backfilling Survey (Critical Areas) 0 0 0 07JUL08 05JUL08 00885 Replace Obstructions 1 1 0 23JUN08 23JUN08 00890 Restore Shoreline 23 23 0 23JUN08 18JUL08 00900 Remove Sheet Piling 1 1 0 25JUL08 25JUL08 00910 Remove HPDE Silt Fences 12 12 0 25JUL08 07AUG08
RM 191.5 - 192.5 ESite Summary 01140 Site 6 (Summary) 163 163 0 26APR08 01NOV08
Site Preparation 01150 Site Preparation (Summary) 25 25 0 26APR08 24MAY08 01160 Install Steel Sheet Piling 11 11 0 13MAY08 24MAY08 01170 Install HDPE Silt Barriers 25 25 0 26APR08 24MAY08 01180 Clearing and Snagging Shoreline 1 1 0 24MAY08 24MAY08 01190 Remove Obstacles 7 7 0 17MAY08 24MAY08
Dredging 01200 Dredging (Summary) 110 110 0 26MAY08 30SEP08 01210 Design Cut(s) - (2) Primary Dredges 84 84 0 26MAY08 30AUG08 01220 Design Cut(s) - (2) Alternate Dredges 94 94 0 29MAY08 15SEP08 01230 Add. Alternate Dredging Around Obstructions 0 0 0 16SEP08 15SEP08 01240 Confirmation Testing/Surveying - Primary Dredge 84 84 0 28MAY08 02SEP08 01250 Confirmation Testing/Surveying - Alt. Dredge 94 94 0 31MAY08 17SEP08 01260 Redredging 89 89 0 16JUN08 26SEP08 01270 Additional Confirmation Testing/Surveying 89 89 0 19JUN08 30SEP08
Restoration 01280 Restoration (Summary) 73 73 0 09AUG08 01NOV08
2008 2009M APR MAY JUN JUL AUG SEP OCT NOV DEC JAN FEB MAR
24 31 7 14 21 28 5 12 19 26 2 9 16 23 30 7 14 21 28 4 11 18 25 1 8 15 22 29 6 13 20 27 3 10 17 24 1 8 15 22 29 5 12 19 26 2 9 16 23 2 9 16 23 30
Phase II (Year 3) (Summary)Site 4 (Summary)
Seasonal MobilizationActivate Infrastructure
Site Preparation (Summary)Install Steel Sheet PilingInstall HDPE Silt BarriersClearing and Snagging ShorelineRemove Obstacles
Dredging (Summary)Design Cut(s) - (2) Primary Dredges
Design Cut(s) - (2) Alternate DredgesAdd. Alternate Dredging Around Obstructions
Confirmation Testing/Surveying - Primary DredgeConfirmation Testing/Surveying - Alt. Dredge
RedredgingAdditional Confirmation Testing/Surveying
Restoration (Summary)Backfill Non-Critical Areas
Backfill Critical AreasPost Backfilling Survey (Non Critical Areas)
Post Backfilling Survey (Critical Areas)Replace Obstructions
Restore ShorelineRemove Sheet Piling
Remove HPDE Silt Fences
Site 6 (Summary)
Site Preparation (Summary)Install Steel Sheet PilingInstall HDPE Silt BarriersClearing and Snagging ShorelineRemove Obstacles
Dredging (Summary)Design Cut(s) - (2) Primary Dredges
Design Cut(s) - (2) Alternate DredgesAdd. Alternate Dredging Around Obstructions
Confirmation Testing/Surveying - Primary DredgeConfirmation Testing/Surveying - Alt. Dredge
RedredgingAdditional Confirmation Testing/Surveying
Restoration (Summary)
© Primavera Systems, Inc.
Start Date 18APR05Finish Date 12NOV11Data Date 18APR05Run Date 28AUG03 14:46
HPCB
Malcolm Pirnie, Inc.
Hudson River PCB Dredging
Phase II (Year 3)
Sheet 1 of 4Date Revision Checked Approved

ActivityID
ActivityDescription
CalID
WBSPH SITETASKOrigDur
PredecessorsSuccessorsResourceID
Units perTime Period
RemDur
% EarlyStart
EarlyFinish
01290 Backfill Non-Critical Areas 0 0 0 03OCT08 02OCT08 01300 Backfill Critical Areas 46 46 0 11AUG08 02OCT08 01310 Post Backfilling Survey (Non Critical Areas) 0 0 0 06OCT08 04OCT08 01320 Post Backfilling Survey (Critical Areas) 46 46 0 13AUG08 04OCT08 01325 Replace Obstructions 7 7 0 09AUG08 16AUG08 01330 Restore Shoreline 73 73 0 09AUG08 01NOV08 01340 Remove Sheet Piling 8 8 0 06OCT08 14OCT08 01350 Remove HPDE Silt Fences 17 17 0 06OCT08 24OCT08
RM 109.5 - 191.5 ESite Summary 01360 Site 7 (Summary) 101 101 0 14JUN08 09OCT08
Site Preparation 01370 Site Preparation (Summary) 16 16 0 09JUL08 26JUL08 01380 Install Steel Sheet Piling 8 8 0 18JUL08 26JUL08 01390 Install HDPE Silt Barriers 16 16 0 09JUL08 26JUL08 01400 Clearing and Snagging Shoreline 1 1 0 26JUL08 26JUL08 01410 Remove Obstacles 0 0 0 28JUL08 26JUL08
Dredging 01420 Dredging (Summary) 86 86 0 14JUN08 22SEP08 01430 Design Cut(s) - (2) Primary Dredges 71 71 0 14JUN08 04SEP08 01440 Design Cut(s) - (2) Alternate Dredges 3 3 0 18JUN08 20JUN08 01450 Add. Alternate Dredging Around Obstructions 0 0 0 21JUN08 20JUN08 01460 Confirmation Testing/Surveying - Primary Dredge 71 71 0 17JUN08 06SEP08 01470 Confirmation Testing/Surveying - Alt. Dredge 3 3 0 20JUN08 23JUN08 01480 Redredging 37 37 0 07AUG08 18SEP08 01490 Additional Confirmation Testing/Surveying 37 37 0 11AUG08 22SEP08
Restoration 01500 Restoration (Summary) 22 22 0 15SEP08 09OCT08 01510 Backfill Non-Critical Areas 8 8 0 16SEP08 24SEP08 01520 Backfill Critical Areas 0 0 0 25SEP08 24SEP08 01530 Post Backfilling Survey (Non Critical Areas) 8 8 0 18SEP08 26SEP08 01540 Post Backfilling Survey (Critical Areas) 0 0 0 27SEP08 26SEP08 01545 Replace Obstructions 0 0 0 15SEP08 13SEP08 01550 Restore Shoreline 22 22 0 15SEP08 09OCT08 01560 Remove Sheet Piling 6 6 0 27SEP08 03OCT08 01570 Remove HPDE Silt Fences 11 11 0 27SEP08 09OCT08
RM 187.5 - 188.5 WSite Summary 02680 Site 13 (Summary) 37 37 0 26APR08 07JUN08
Site Preparation 02690 Site Preparation (Summary) 5 5 0 26APR08 01MAY08 02700 Install Steel Sheet Piling 5 5 0 26APR08 01MAY08 02710 Install HDPE Silt Barriers 4 4 0 28APR08 01MAY08 02720 Clearing and Snagging Shoreline 1 1 0 01MAY08 01MAY08 02730 Remove Obstacles 0 0 0 02MAY08 01MAY08
Dredging 02740 Dredging (Summary) 21 21 0 02MAY08 26MAY08 02750 Design Cut(s) - (2) Primary Dredges 6 6 0 02MAY08 08MAY08 02760 Design Cut(s) - (2) Alternate Dredges 1 1 0 06MAY08 06MAY08 02770 Add. Alternate Dredging Around Obstructions 0 0 0 07MAY08 06MAY08 02780 Confirmation Testing/Surveying - Primary Dredge 6 6 0 05MAY08 10MAY08 02790 Confirmation Testing/Surveying - Alt. Dredge 1 1 0 08MAY08 08MAY08
2008 2009M APR MAY JUN JUL AUG SEP OCT NOV DEC JAN FEB MAR
24 31 7 14 21 28 5 12 19 26 2 9 16 23 30 7 14 21 28 4 11 18 25 1 8 15 22 29 6 13 20 27 3 10 17 24 1 8 15 22 29 5 12 19 26 2 9 16 23 2 9 16 23 30Backfill Non-Critical AreasBackfill Critical Areas
Post Backfilling Survey (Non Critical Areas)Post Backfilling Survey (Critical Areas)
Replace ObstructionsRestore Shoreline
Remove Sheet PilingRemove HPDE Silt Fences
Site 7 (Summary)
Site Preparation (Summary)Install Steel Sheet PilingInstall HDPE Silt BarriersClearing and Snagging ShorelineRemove Obstacles
Dredging (Summary)Design Cut(s) - (2) Primary Dredges
Design Cut(s) - (2) Alternate DredgesAdd. Alternate Dredging Around Obstructions
Confirmation Testing/Surveying - Primary DredgeConfirmation Testing/Surveying - Alt. Dredge
RedredgingAdditional Confirmation Testing/Surveying
Restoration (Summary)Backfill Non-Critical AreasBackfill Critical AreasPost Backfilling Survey (Non Critical Areas)Post Backfilling Survey (Critical Areas)
Replace ObstructionsRestore Shoreline
Remove Sheet PilingRemove HPDE Silt Fences
Site 13 (Summary)
Site Preparation (Summary)Install Steel Sheet PilingInstall HDPE Silt BarriersClearing and Snagging ShorelineRemove Obstacles
Dredging (Summary)Design Cut(s) - (2) Primary Dredges
Design Cut(s) - (2) Alternate DredgesAdd. Alternate Dredging Around Obstructions
Confirmation Testing/Surveying - Primary DredgeConfirmation Testing/Surveying - Alt. Dredge
© Primavera Systems, Inc.
Start Date 18APR05Finish Date 12NOV11Data Date 18APR05Run Date 28AUG03 14:46
HPCB
Malcolm Pirnie, Inc.
Hudson River PCB Dredging
Phase II (Year 3)
Sheet 2 of 4Date Revision Checked Approved

ActivityID
ActivityDescription
CalID
WBSPH SITETASKOrigDur
PredecessorsSuccessorsResourceID
Units perTime Period
RemDur
% EarlyStart
EarlyFinish
02800 Redredging 4 4 0 19MAY08 22MAY08 02810 Additional Confirmation Testing/Surveying 4 4 0 22MAY08 26MAY08
Restoration 02820 Restoration (Summary) 9 9 0 29MAY08 07JUN08 02830 Backfill Non-Critical Areas 3 3 0 30MAY08 02JUN08 02840 Backfill Critical Areas 0 0 0 30MAY08 29MAY08 02850 Post Backfilling Survey (Non Critical Areas) 3 3 0 02JUN08 04JUN08 02860 Post Backfilling Survey (Critical Areas) 0 0 0 02JUN08 31MAY08 02865 Replace Obstructions 0 0 0 29MAY08 28MAY08 02870 Restore Shoreline 9 9 0 29MAY08 07JUN08 02880 Remove Sheet Piling 3 3 0 05JUN08 07JUN08 02890 Remove HPDE Silt Fences 3 3 0 05JUN08 07JUN08
RM 186.5 - 187.5 WSite Summary 02900 Site 14 (Summary) 75 75 0 14AUG08 08NOV08
Site Preparation 02910 Site Preparation (Summary) 15 15 0 14AUG08 30AUG08 02920 Install Steel Sheet Piling 8 8 0 22AUG08 30AUG08 02930 Install HDPE Silt Barriers 15 15 0 14AUG08 30AUG08 02940 Clearing and Snagging Shoreline 1 1 0 30AUG08 30AUG08 02950 Remove Obstacles 1 1 0 30AUG08 30AUG08
Dredging 02960 Dredging (Summary) 31 31 0 01SEP08 06OCT08 02970 Design Cut(s) - (2) Primary Dredges 16 16 0 01SEP08 18SEP08 02980 Design Cut(s) - (2) Alternate Dredges 8 8 0 04SEP08 12SEP08 02990 Add. Alternate Dredging Around Obstructions 0 0 0 13SEP08 12SEP08 03000 Confirmation Testing/Surveying - Primary Dredge 16 16 0 03SEP08 20SEP08 03010 Confirmation Testing/Surveying - Alt. Dredge 8 8 0 06SEP08 15SEP08 03020 Redredging 12 12 0 19SEP08 02OCT08 03030 Additional Confirmation Testing/Surveying 12 12 0 23SEP08 06OCT08
Restoration 03040 Restoration (Summary) 35 35 0 30SEP08 08NOV08 03050 Backfill Non-Critical Areas 8 8 0 01OCT08 09OCT08 03060 Backfill Critical Areas 22 22 0 01OCT08 25OCT08 03070 Post Backfilling Survey (Non Critical Areas) 8 8 0 03OCT08 11OCT08 03080 Post Backfilling Survey (Critical Areas) 22 22 0 03OCT08 28OCT08 03085 Replace Obstructions 1 1 0 30SEP08 30SEP08 03090 Restore Shoreline 20 20 0 30SEP08 22OCT08 03100 Remove Sheet Piling 5 5 0 29OCT08 03NOV08 03110 Remove HPDE Silt Fences 10 10 0 29OCT08 08NOV08
RM 183.25 - 184.25 WSite Summary 03780 Site 18 (Summary) 80 80 0 28AUG08 28NOV08
Site Preparation 03790 Site Preparation (Summary) 7 7 0 28AUG08 04SEP08 03800 Install Steel Sheet Piling 4 4 0 01SEP08 04SEP08 03810 Install HDPE Silt Barriers 7 7 0 28AUG08* 04SEP08 03820 Clearing and Snagging Shoreline 1 1 0 04SEP08 04SEP08 03830 Remove Obstacles 4 4 0 01SEP08 04SEP08
Dredging 03840 Dredging (Summary) 59 59 0 05SEP08 12NOV08 03850 Design Cut(s) - (2) Primary Dredges 44 44 0 05SEP08 25OCT08
2008 2009M APR MAY JUN JUL AUG SEP OCT NOV DEC JAN FEB MAR
24 31 7 14 21 28 5 12 19 26 2 9 16 23 30 7 14 21 28 4 11 18 25 1 8 15 22 29 6 13 20 27 3 10 17 24 1 8 15 22 29 5 12 19 26 2 9 16 23 2 9 16 23 30Redredging
Additional Confirmation Testing/Surveying
Restoration (Summary)Backfill Non-Critical Areas
Backfill Critical AreasPost Backfilling Survey (Non Critical Areas)
Post Backfilling Survey (Critical Areas)Replace Obstructions
Restore ShorelineRemove Sheet PilingRemove HPDE Silt Fences
Site 14 (Summary)
Site Preparation (Summary)Install Steel Sheet PilingInstall HDPE Silt BarriersClearing and Snagging ShorelineRemove Obstacles
Dredging (Summary)Design Cut(s) - (2) Primary Dredges
Design Cut(s) - (2) Alternate DredgesAdd. Alternate Dredging Around Obstructions
Confirmation Testing/Surveying - Primary DredgeConfirmation Testing/Surveying - Alt. Dredge
RedredgingAdditional Confirmation Testing/Surveying
Restoration (Summary)Backfill Non-Critical Areas
Backfill Critical AreasPost Backfilling Survey (Non Critical Areas)
Post Backfilling Survey (Critical Areas)Replace Obstructions
Restore ShorelineRemove Sheet Piling
Remove HPDE Silt Fences
Site 18 (Summary)
Site Preparation (Summary)Install Steel Sheet PilingInstall HDPE Silt BarriersClearing and Snagging ShorelineRemove Obstacles
Dredging (Summary)Design Cut(s) - (2) Primary Dredges
© Primavera Systems, Inc.
Start Date 18APR05Finish Date 12NOV11Data Date 18APR05Run Date 28AUG03 14:47
HPCB
Malcolm Pirnie, Inc.
Hudson River PCB Dredging
Phase II (Year 3)
Sheet 3 of 4Date Revision Checked Approved

ActivityID
ActivityDescription
CalID
WBSPH SITETASKOrigDur
PredecessorsSuccessorsResourceID
Units perTime Period
RemDur
% EarlyStart
EarlyFinish
03860 Design Cut(s) - (2) Alternate Dredges 3 3 0 13SEP08 16SEP08 03870 Add. Alternate Dredging Around Obstructions 0 0 0 17SEP08 16SEP08 03880 Confirmation Testing/Surveying - Primary Dredge 44 44 0 08SEP08 28OCT08 03890 Confirmation Testing/Surveying - Alt. Dredge 3 3 0 16SEP08 18SEP08 03900 Redredging 23 23 0 14OCT08 08NOV08 03910 Additional Confirmation Testing/Surveying 23 23 0 17OCT08 12NOV08
Restoration 03920 Restoration (Summary) 20 20 0 06NOV08 28NOV08 03930 Backfill Non-Critical Areas 7 7 0 07NOV08 14NOV08 03940 Backfill Critical Areas 0 0 0 15NOV08 14NOV08 03950 Post Backfilling Survey (Non Critical Areas) 7 7 0 10NOV08 17NOV08 03960 Post Backfilling Survey (Critical Areas) 0 0 0 18NOV08 17NOV08 03970 Restore Shoreline 20 20 0 06NOV08 28NOV08 03980 Remove Sheet Piling 3 3 0 18NOV08 20NOV08 03990 Remove HPDE Silt Fences 4 4 0 18NOV08 21NOV08
Demobilization 01572 Winterize Infrastructure 20 20 0 10NOV08 02DEC08 01574 Demobilize Equipment 20 20 0 29NOV08 22DEC08
2008 2009M APR MAY JUN JUL AUG SEP OCT NOV DEC JAN FEB MAR
24 31 7 14 21 28 5 12 19 26 2 9 16 23 30 7 14 21 28 4 11 18 25 1 8 15 22 29 6 13 20 27 3 10 17 24 1 8 15 22 29 5 12 19 26 2 9 16 23 2 9 16 23 30Design Cut(s) - (2) Alternate DredgesAdd. Alternate Dredging Around Obstructions
Confirmation Testing/Surveying - Primary DredgeConfirmation Testing/Surveying - Alt. Dredge
RedredgingAdditional Confirmation Testing/Surveying
Restoration (Summary)Backfill Non-Critical AreasBackfill Critical Areas
Post Backfilling Survey (Non Critical Areas)Post Backfilling Survey (Critical Areas)
Restore ShorelineRemove Sheet PilingRemove HPDE Silt Fences
Winterize InfrastructureDemobilize Equipment
© Primavera Systems, Inc.
Start Date 18APR05Finish Date 12NOV11Data Date 18APR05Run Date 28AUG03 14:47
HPCB
Malcolm Pirnie, Inc.
Hudson River PCB Dredging
Phase II (Year 3)
Sheet 4 of 4Date Revision Checked Approved

Production Schedule:
Phase 2 (Year 4)

ActivityID
ActivityDescription
CalID
WBSPH SITETASKOrigDur
PredecessorsSuccessorsResourceID
Units perTime Period
RemDur
% EarlyStart
EarlyFinish
Phase IIRM 185.25 - 186.25 ESite Summary 02019 Phase II (Year 4) (Summary) 228* 228* 0 01APR09 22DEC09
03120 Site 15 (Summary) 172 172 0 01APR09 17OCT09
03121 Seasonal Mobilization 20 20 0 01APR09* 23APR09
03122 Activate Infrastructure 30 30 0 01APR09 05MAY09
Site Preparation 03130 Site Preparation (Summary) 10 10 0 24APR09 05MAY09
03140 Install Steel Sheet Piling 6 6 0 29APR09 05MAY09
03150 Install HDPE Silt Barriers 10 10 0 24APR09 05MAY09
03160 Clearing and Snagging Shoreline 1 1 0 05MAY09 05MAY09
03170 Remove Obstacles 6 6 0 29APR09 05MAY09
Dredging 03180 Dredging (Summary) 131 131 0 06MAY09 05OCT09
03190 Design Cut(s) - (2) Primary Dredges 116 116 0 06MAY09 17SEP09
03200 Design Cut(s) - (2) Alternate Dredges 8 8 0 09MAY09 18MAY09
03210 Add. Alternate Dredging Around Obstructions 1 1 0 19MAY09 19MAY09
03220 Confirmation Testing/Surveying - Primary Dredge 116 116 0 08MAY09 19SEP09
03230 Confirmation Testing/Surveying - Alt. Dredge 8 8 0 13MAY09 21MAY09
03240 Redredging 62 62 0 22JUL09 01OCT09
03250 Additional Confirmation Testing/Surveying 62 62 0 25JUL09 05OCT09
Restoration 03260 Restoration (Summary) 33 33 0 10SEP09 17OCT09
03270 Backfill Non-Critical Areas 23 23 0 11SEP09 07OCT09
03280 Backfill Critical Areas 0 0 0 08OCT09 07OCT09
03290 Post Backfilling Survey (Non Critical Areas) 23 23 0 14SEP09 09OCT09
03300 Post Backfilling Survey (Critical Areas) 0 0 0 10OCT09 09OCT09
03305 Replace Obstructions 5 5 0 10SEP09 15SEP09
03310 Restore Shoreline 20 20 0 10SEP09 02OCT09
03320 Remove Sheet Piling 4 4 0 10OCT09 14OCT09
03330 Remove HPDE Silt Fences 7 7 0 10OCT09 17OCT09
RM 189.5 - 190.5 ESite Summary 02020 Site 9 (Summary) 123 123 0 24APR09 14SEP09
Site Preparation 02030 Site Preparation (Summary) 16 16 0 24APR09 12MAY09
02040 Install Steel Sheet Piling 5 5 0 07MAY09 12MAY09
02050 Install HDPE Silt Barriers 16 16 0 24APR09 12MAY09
02060 Clearing and Snagging Shoreline 1 1 0 12MAY09 12MAY09
02070 Remove Obstacles 3 3 0 09MAY09 12MAY09
Dredging 02080 Dredging (Summary) 92 92 0 13MAY09 27AUG09
02090 Design Cut(s) - (2) Primary Dredges 77 77 0 13MAY09 10AUG09
02100 Design Cut(s) - (2) Alternate Dredges 6 6 0 16MAY09 22MAY09
02110 Add. Alternate Dredging Around Obstructions 0 0 0 23MAY09 22MAY09
02120 Confirmation Testing/Surveying - Primary Dredge 77 77 0 15MAY09 12AUG09
02130 Confirmation Testing/Surveying - Alt. Dredge 6 6 0 19MAY09 25MAY09
02140 Redredging 41 41 0 08JUL09 24AUG09
02150 Additional Confirmation Testing/Surveying 41 41 0 11JUL09 27AUG09
Restoration 02160 Restoration (Summary) 38 38 0 01AUG09 14SEP09
2009 2010M APR MAY JUN JUL AUG SEP OCT NOV DEC JAN FEB MAR
23 30 6 13 20 27 4 11 18 25 1 8 15 22 29 6 13 20 27 3 10 17 24 31 7 14 21 28 5 12 19 26 2 9 16 23 30 7 14 21 28 4 11 18 25 1 8 15 22 1 8 15 22 29
Phase II (Year 4) (Summary)Site 15 (Summary)
Seasonal MobilizationActivate Infrastructure
Site Preparation (Summary)Install Steel Sheet PilingInstall HDPE Silt BarriersClearing and Snagging ShorelineRemove Obstacles
Dredging (Summary)Design Cut(s) - (2) Primary Dredges
Design Cut(s) - (2) Alternate DredgesAdd. Alternate Dredging Around Obstructions
Confirmation Testing/Surveying - Primary DredgeConfirmation Testing/Surveying - Alt. Dredge
RedredgingAdditional Confirmation Testing/Surveying
Restoration (Summary)Backfill Non-Critical AreasBackfill Critical AreasPost Backfilling Survey (Non Critical Areas)Post Backfilling Survey (Critical Areas)
Replace ObstructionsRestore Shoreline
Remove Sheet PilingRemove HPDE Silt Fences
Site 9 (Summary)
Site Preparation (Summary)Install Steel Sheet PilingInstall HDPE Silt BarriersClearing and Snagging ShorelineRemove Obstacles
Dredging (Summary)Design Cut(s) - (2) Primary Dredges
Design Cut(s) - (2) Alternate DredgesAdd. Alternate Dredging Around Obstructions
Confirmation Testing/Surveying - Primary DredgeConfirmation Testing/Surveying - Alt. Dredge
RedredgingAdditional Confirmation Testing/Surveying
Restoration (Summary)
© Primavera Systems, Inc.
Start Date 18APR05Finish Date 15NOV11Data Date 18APR05Run Date 22APR03 11:36
HPCB
Malcolm Pirnie, Inc.
Hudson River PCB Dredging
Phase II (Year 4)
Sheet 1 of 2Date Revision Checked Approved

ActivityID
ActivityDescription
CalID
WBSPH SITETASKOrigDur
PredecessorsSuccessorsResourceID
Units perTime Period
RemDur
% EarlyStart
EarlyFinish
02170 Backfill Non-Critical Areas 24 24 0 03AUG09 29AUG09
02180 Backfill Critical Areas 0 0 0 31AUG09 29AUG09
02190 Post Backfilling Survey (Non Critical Areas) 24 24 0 05AUG09 01SEP09
02200 Post Backfilling Survey (Critical Areas) 0 0 0 02SEP09 01SEP09
02205 Replace Obstacles 3 3 0 01AUG09 04AUG09
02210 Restore Shoreline 24 24 0 01AUG09 28AUG09
02220 Remove Sheet Piling 3 3 0 02SEP09 04SEP09
02230 Remove HPDE Silt Fences 11 11 0 02SEP09 14SEP09
RM 188.5 - 189.5 ESite Summary 02240 Site 11 (Summary) 137 137 0 16JUL09 22DEC09
Site Preparation 02250 Site Preparation (Summary) 22 22 0 16JUL09 10AUG09
02260 Install Steel Sheet Piling 22 22 0 16JUL09 10AUG09
02270 Install HDPE Silt Barriers 15 15 0 24JUL09 10AUG09
02280 Clearing and Snagging Shoreline 1 1 0 10AUG09 10AUG09
02290 Remove Obstacles 1 1 0 10AUG09 10AUG09
Dredging 02300 Dredging (Summary) 76 76 0 11AUG09 06NOV09
02310 Design Cut(s) - (2) Primary Dredges 61 61 0 11AUG09 20OCT09
02320 Design Cut(s) - (2) Alternate Dredges 19 19 0 14AUG09 04SEP09
02330 Add. Alternate Dredging Around Obstructions 1 1 0 05SEP09 05SEP09
02340 Confirmation Testing/Surveying - Primary Dredge 61 61 0 13AUG09 22OCT09
02350 Confirmation Testing/Surveying - Alt. Dredge 19 19 0 18AUG09 08SEP09
02360 Redredging 40 40 0 18SEP09 03NOV09
02370 Additional Confirmation Testing/Surveying 40 40 0 22SEP09 06NOV09
Restoration 02380 Restoration (Summary) 32 32 0 23OCT09 28NOV09
02390 Backfill Non-Critical Areas 14 14 0 24OCT09 09NOV09
02400 Backfill Critical Areas 0 0 0 10NOV09 09NOV09
02410 Post Backfilling Survey (Non Critical Areas) 14 14 0 27OCT09 11NOV09
02420 Post Backfilling Survey (Critical Areas) 0 0 0 12NOV09 11NOV09
02425 Replace Obstacles 1 1 0 23OCT09 23OCT09
02430 Restore Shoreline 29 29 0 23OCT09 25NOV09
02440 Remove Sheet Piling 15 15 0 12NOV09 28NOV09
02450 Remove HPDE Silt Fences 10 10 0 12NOV09 23NOV09
Demobilization 04872 Winterize Infrastructure 20 20 0 04NOV09 26NOV09
04874 Demobilize Equipment 20 20 0 30NOV09 22DEC09
2009 2010M APR MAY JUN JUL AUG SEP OCT NOV DEC JAN FEB MAR
23 30 6 13 20 27 4 11 18 25 1 8 15 22 29 6 13 20 27 3 10 17 24 31 7 14 21 28 5 12 19 26 2 9 16 23 30 7 14 21 28 4 11 18 25 1 8 15 22 1 8 15 22 29Backfill Non-Critical AreasBackfill Critical AreasPost Backfilling Survey (Non Critical Areas)Post Backfilling Survey (Critical Areas)
Replace ObstaclesRestore Shoreline
Remove Sheet PilingRemove HPDE Silt Fences
Site 11 (Summary)
Site Preparation (Summary)Install Steel Sheet PilingInstall HDPE Silt BarriersClearing and Snagging ShorelineRemove Obstacles
Dredging (Summary)Design Cut(s) - (2) Primary Dredges
Design Cut(s) - (2) Alternate DredgesAdd. Alternate Dredging Around Obstructions
Confirmation Testing/Surveying - Primary DredgeConfirmation Testing/Surveying - Alt. Dredge
RedredgingAdditional Confirmation Testing/Surveying
Restoration (Summary)Backfill Non-Critical AreasBackfill Critical AreasPost Backfilling Survey (Non Critical Areas)Post Backfilling Survey (Critical Areas)
Replace ObstaclesRestore Shoreline
Remove Sheet PilingRemove HPDE Silt Fences
Winterize InfrastructureDemobilize Equipment
© Primavera Systems, Inc.
Start Date 18APR05Finish Date 15NOV11Data Date 18APR05Run Date 22APR03 11:36
HPCB
Malcolm Pirnie, Inc.
Hudson River PCB Dredging
Phase II (Year 4)
Sheet 2 of 2Date Revision Checked Approved

Production Schedule:
Phase 2 (Year 5)

ActivityID
ActivityDescription
CalID
WBSPH SITETASKOrigDur
PredecessorsSuccessorsResourceID
Units perTime Period
RemDur
% EarlyStart
EarlyFinish
Phase IIRM 184.25 - 185.25 ESite Summary 03339 Phase II (Year 5) (Summary) 185* 185* 0 12APR10 12NOV10
03340 Site 16 (Summary) 74 74 0 12APR10 06JUL10
03562 Seasonal Mobilization 20 20 0 12APR10* 04MAY10
03564 Activate Infrastructure 30 30 0 12APR10 15MAY10
Site Preparation 03350 Site Preparation (Summary) 11 11 0 05MAY10 17MAY10
03360 Install Steel Sheet Piling 4 4 0 13MAY10 17MAY10
03370 Install HDPE Silt Barriers 11 11 0 05MAY10 17MAY10
03380 Clearing and Snagging Shoreline 1 1 0 17MAY10 17MAY10
03390 Remove Obstacles 0 0 0 18MAY10 17MAY10
Dredging 03400 Dredging (Summary) 29 29 0 18MAY10 19JUN10
03410 Design Cut(s) - (2) Primary Dredges 14 14 0 18MAY10 02JUN10
03420 Design Cut(s) - (0) Alternate Dredges 0 0 0 21MAY10 20MAY10
03430 Add. Alternate Dredging Around Obstructions 0 0 0 21MAY10 20MAY10
03440 Confirmation Testing/Surveying - Primary Dredge 14 14 0 20MAY10 04JUN10
03450 Confirmation Testing/Surveying - Alt. Dredge 0 0 0 24MAY10 22MAY10
03460 Redredging 7 7 0 09JUN10 16JUN10
03470 Additional Confirmation Testing/Surveying 7 7 0 12JUN10 19JUN10
Restoration 03480 Restoration (Summary) 15 15 0 19JUN10 06JUL10
03490 Backfill Non-Critical Areas 3 3 0 21JUN10 23JUN10
03500 Backfill Critical Areas 0 0 0 23JUN10 22JUN10
03510 Post Backfilling Survey (Non Critical Areas) 3 3 0 23JUN10 25JUN10
03520 Post Backfilling Survey (Critical Areas) 0 0 0 25JUN10 24JUN10
03525 Replace Obstructions 0 0 0 19JUN10 18JUN10
03530 Restore Shoreline 15 15 0 19JUN10 06JUL10
03540 Remove Sheet Piling 3 3 0 26JUN10 29JUN10
03550 Remove HPDE Silt Fences 7 7 0 26JUN10 03JUL10
RM 183.25 - 184.25 ESite Summary 03560 Site 17 (Summary) 93 93 0 05MAY10 20AUG10
Site Preparation 03570 Site Preparation (Summary) 13 13 0 05MAY10 19MAY10
03580 Install Steel Sheet Piling 13 13 0 05MAY10 19MAY10
03590 Install HDPE Silt Barriers 13 13 0 05MAY10 19MAY10
03600 Clearing and Snagging Shoreline 1 1 0 19MAY10 19MAY10
03610 Remove Obstacles 0 0 0 20MAY10 19MAY10
Dredging 03620 Dredging (Summary) 52 52 0 20MAY10 19JUL10
03630 Design Cut(s) - (2) Primary Dredges 37 37 0 20MAY10 01JUL10
03640 Design Cut(s) - (2) Alternate Dredges 20 20 0 24MAY10 15JUN10
03650 Add. Alternate Dredging Around Obstructions 0 0 0 16JUN10 15JUN10
03660 Confirmation Testing/Surveying - Primary Dredge 37 37 0 22MAY10 03JUL10
03670 Confirmation Testing/Surveying - Alt. Dredge 20 20 0 26MAY10 17JUN10
03680 Redredging 28 28 0 14JUN10 15JUL10
03690 Additional Confirmation Testing/Surveying 28 28 0 17JUN10 19JUL10
Restoration 03700 Restoration (Summary) 49 49 0 25JUN10 20AUG10
2010 2011APR MAY JUN JUL AUG SEP OCT NOV DEC JAN FEB MAR A
29 5 12 19 26 3 10 17 24 31 7 14 21 28 5 12 19 26 2 9 16 23 30 6 13 20 27 4 11 18 25 1 8 15 22 29 6 13 20 27 3 10 17 24 31 7 14 21 28 7 14 21 28
Phase II (Year 5) (Summary)Site 16 (Summary)
Seasonal MobilizationActivate Infrastructure
Site Preparation (Summary)Install Steel Sheet PilingInstall HDPE Silt BarriersClearing and Snagging ShorelineRemove Obstacles
Dredging (Summary)Design Cut(s) - (2) Primary Dredges
Design Cut(s) - (0) Alternate DredgesAdd. Alternate Dredging Around Obstructions
Confirmation Testing/Surveying - Primary DredgeConfirmation Testing/Surveying - Alt. Dredge
RedredgingAdditional Confirmation Testing/Surveying
Restoration (Summary)Backfill Non-Critical AreasBackfill Critical Areas
Post Backfilling Survey (Non Critical Areas)Post Backfilling Survey (Critical Areas)
Replace ObstructionsRestore Shoreline
Remove Sheet PilingRemove HPDE Silt Fences
Site 17 (Summary)
Site Preparation (Summary)Install Steel Sheet PilingInstall HDPE Silt BarriersClearing and Snagging ShorelineRemove Obstacles
Dredging (Summary)Design Cut(s) - (2) Primary Dredges
Design Cut(s) - (2) Alternate DredgesAdd. Alternate Dredging Around Obstructions
Confirmation Testing/Surveying - Primary DredgeConfirmation Testing/Surveying - Alt. Dredge
RedredgingAdditional Confirmation Testing/Surveying
Restoration (Summary)
© Primavera Systems, Inc.
Start Date 18APR05Finish Date 15NOV11Data Date 18APR05Run Date 22APR03 12:12
HPCB
Malcolm Pirnie, Inc.
Hudson River PCB Dredging
Phase II (Year 5)
Sheet 1 of 7Date Revision Checked Approved

ActivityID
ActivityDescription
CalID
WBSPH SITETASKOrigDur
PredecessorsSuccessorsResourceID
Units perTime Period
RemDur
% EarlyStart
EarlyFinish
03710 Backfill Non-Critical Areas 0 0 0 22JUL10 21JUL10
03720 Backfill Critical Areas 38 38 0 25JUN10 07AUG10
03730 Post Backfilling Survey (Non Critical Areas) 0 0 0 24JUL10 23JUL10
03740 Post Backfilling Survey (Critical Areas) 38 38 0 28JUN10 10AUG10
03750 Restore Shoreline 26 26 0 21JUL10 19AUG10
03760 Remove Sheet Piling 9 9 0 11AUG10 20AUG10
03770 Remove HPDE Silt Fences 9 9 0 11AUG10 20AUG10
RM 176.75 - 177.25 NAVSite Summary 04000 Site 19 (Summary) 26 26 0 05MAY10 03JUN10
Site Preparation 04010 Site Preparation (Summary) 0 0 0 05MAY10 04MAY10
04020 Install Steel Sheet Piling 0 0 0 05MAY10 04MAY10
04030 Install HDPE Silt Barriers 0 0 0 05MAY10 04MAY10
04040 Clearing and Snagging Shoreline 0 0 0 05MAY10 04MAY10
04050 Remove Obstacles 0 0 0 05MAY10 04MAY10
Dredging 04060 Dredging (Summary) 19 19 0 05MAY10 26MAY10
04070 Design Cut(s) - (2) Primary Dredges 4 4 0 05MAY10 08MAY10
04080 Design Cut(s) - (0) Alternate Dredges 0 0 0 08MAY10 07MAY10
04090 Add. Alternate Dredging Around Obstructions 0 0 0 10MAY10 08MAY10
04100 Confirmation Testing/Surveying - Primary Dredge 4 4 0 07MAY10 11MAY10
04110 Confirmation Testing/Surveying - Alt. Dredge 0 0 0 11MAY10 10MAY10
04120 Redredging 2 2 0 21MAY10 22MAY10
04130 Additional Confirmation Testing/Surveying 2 2 0 25MAY10 26MAY10
Restoration 04150 Backfill Non-Critical Areas 0 0 0 02JUN10 01JUN10
04160 Backfill Critical Areas 0 0 0 02JUN10 01JUN10
04170 Post Backfilling Survey (Non Critical Areas) 0 0 0 04JUN10 03JUN10
04180 Post Backfilling Survey (Critical Areas) 0 0 0 04JUN10 03JUN10
04190 Restore Shoreline 0 0 0 01JUN10 31MAY10
04200 Remove Sheet Piling 0 0 0 04JUN10 03JUN10
04210 Remove HPDE Silt Fences 0 0 0 04JUN10 03JUN10
RM 175.00 - 175.25 NAVSite Summary 04220 Site 20 (Summary) 26 26 0 05MAY10 03JUN10
Site Preparation 04230 Site Preparation (Summary) 0 0 0 05MAY10 04MAY10
04240 Install Steel Sheet Piling 0 0 0 05MAY10 04MAY10
04250 Install HDPE Silt Barriers 0 0 0 05MAY10 04MAY10
04260 Clearing and Snagging Shoreline 0 0 0 05MAY10 04MAY10
04270 Remove Obstacles 0 0 0 05MAY10 04MAY10
Dredging 04280 Dredging (Summary) 19 19 0 05MAY10 26MAY10
04290 Design Cut(s) - (2) Primary Dredges 4 4 0 05MAY10 08MAY10
04300 Design Cut(s) - (0) Alternate Dredges 0 0 0 08MAY10 07MAY10
04310 Add. Alternate Dredging Around Obstructions 0 0 0 10MAY10 08MAY10
04320 Confirmation Testing/Surveying - Primary Dredge 4 4 0 07MAY10 11MAY10
04330 Confirmation Testing/Surveying - Alt. Dredge 0 0 0 11MAY10 10MAY10
04340 Redredging 2 2 0 21MAY10 22MAY10
04350 Additional Confirmation Testing/Surveying 2 2 0 25MAY10 26MAY10
2010 2011APR MAY JUN JUL AUG SEP OCT NOV DEC JAN FEB MAR A
29 5 12 19 26 3 10 17 24 31 7 14 21 28 5 12 19 26 2 9 16 23 30 6 13 20 27 4 11 18 25 1 8 15 22 29 6 13 20 27 3 10 17 24 31 7 14 21 28 7 14 21 28Backfill Non-Critical Areas
Backfill Critical AreasPost Backfilling Survey (Non Critical Areas)
Post Backfilling Survey (Critical Areas)Restore ShorelineRemove Sheet PilingRemove HPDE Silt Fences
Site 19 (Summary)
Site Preparation (Summary)Install Steel Sheet PilingInstall HDPE Silt BarriersClearing and Snagging ShorelineRemove Obstacles
Dredging (Summary)Design Cut(s) - (2) Primary DredgesDesign Cut(s) - (0) Alternate Dredges
Add. Alternate Dredging Around ObstructionsConfirmation Testing/Surveying - Primary DredgeConfirmation Testing/Surveying - Alt. Dredge
RedredgingAdditional Confirmation Testing/Surveying
Backfill Non-Critical AreasBackfill Critical AreasPost Backfilling Survey (Non Critical Areas)Post Backfilling Survey (Critical Areas)
Restore ShorelineRemove Sheet PilingRemove HPDE Silt Fences
Site 20 (Summary)
Site Preparation (Summary)Install Steel Sheet PilingInstall HDPE Silt BarriersClearing and Snagging ShorelineRemove Obstacles
Dredging (Summary)Design Cut(s) - (2) Primary DredgesDesign Cut(s) - (0) Alternate Dredges
Add. Alternate Dredging Around ObstructionsConfirmation Testing/Surveying - Primary DredgeConfirmation Testing/Surveying - Alt. Dredge
RedredgingAdditional Confirmation Testing/Surveying
© Primavera Systems, Inc.
Start Date 18APR05Finish Date 15NOV11Data Date 18APR05Run Date 22APR03 12:13
HPCB
Malcolm Pirnie, Inc.
Hudson River PCB Dredging
Phase II (Year 5)
Sheet 2 of 7Date Revision Checked Approved

ActivityID
ActivityDescription
CalID
WBSPH SITETASKOrigDur
PredecessorsSuccessorsResourceID
Units perTime Period
RemDur
% EarlyStart
EarlyFinish
Restoration 04370 Backfill Non-Critical Areas 0 0 0 02JUN10 01JUN10
04380 Backfill Critical Areas 0 0 0 02JUN10 01JUN10
04390 Post Backfilling Survey (Non Critical Areas) 0 0 0 04JUN10 03JUN10
04400 Post Backfilling Survey (Critical Areas) 0 0 0 04JUN10 03JUN10
04410 Restore Shoreline 0 0 0 01JUN10 31MAY10
04420 Remove Sheet Piling 0 0 0 04JUN10 03JUN10
04430 Remove HPDE Silt Fences 0 0 0 04JUN10 03JUN10
RM 171.5 - 172.00 NAVSite Summary 04440 Site 21 (Summary) 26 26 0 10MAY10 08JUN10
Site Preparation 04450 Site Preparation (Summary) 0 0 0 10MAY10 09MAY10
04460 Install Steel Sheet Piling 0 0 0 10MAY10 08MAY10
04470 Install HDPE Silt Barriers 0 0 0 10MAY10 08MAY10
04480 Clearing and Snagging Shoreline 0 0 0 10MAY10 08MAY10
04490 Remove Obstacles 0 0 0 10MAY10 08MAY10
Dredging 04500 Dredging (Summary) 19 19 0 10MAY10 31MAY10
04510 Design Cut(s) - (2) Primary Dredges 4 4 0 10MAY10 13MAY10
04520 Design Cut(s) - (0) Alternate Dredges 0 0 0 13MAY10 12MAY10
04530 Add. Alternate Dredging Around Obstructions 0 0 0 14MAY10 13MAY10
04540 Confirmation Testing/Surveying - Primary Dredge 4 4 0 12MAY10 15MAY10
04550 Confirmation Testing/Surveying - Alt. Dredge 0 0 0 15MAY10 14MAY10
04560 Redredging 2 2 0 26MAY10 27MAY10
04570 Additional Confirmation Testing/Surveying 2 2 0 29MAY10 31MAY10
Restoration 04590 Backfill Non-Critical Areas 0 0 0 07JUN10 05JUN10
04600 Backfill Critical Areas 0 0 0 07JUN10 05JUN10
04610 Post Backfilling Survey (Non Critical Areas) 0 0 0 09JUN10 08JUN10
04620 Post Backfilling Survey (Critical Areas) 0 0 0 09JUN10 08JUN10
04630 Restore Shoreline 0 0 0 05JUN10 04JUN10
04640 Remove Sheet Piling 0 0 0 09JUN10 08JUN10
04650 Remove HPDE Silt Fences 0 0 0 09JUN10 08JUN10
RM 169.25 - 170.25 ESite Summary 04660 Site 22 (Summary) 142 142 0 08MAY10 20OCT10
Site Preparation 04670 Site Preparation (Summary) 22 22 0 08MAY10 02JUN10
04680 Install Steel Sheet Piling 7 7 0 26MAY10 02JUN10
04690 Install HDPE Silt Barriers 22 22 0 08MAY10 02JUN10
04700 Clearing and Snagging Shoreline 1 1 0 02JUN10 02JUN10
04710 Remove Obstacles 1 1 0 02JUN10 02JUN10
Dredging 04720 Dredging (Summary) 102 102 0 03JUN10 29SEP10
04730 Design Cut(s) - (2) Primary Dredges 87 87 0 03JUN10 11SEP10
04740 Design Cut(s) - (2) Alternate Dredges 84 84 0 07JUN10 11SEP10
04750 Add. Alternate Dredging Around Obstructions 0 0 0 13SEP10 11SEP10
04760 Confirmation Testing/Surveying - Primary Dredge 87 87 0 05JUN10 14SEP10
04770 Confirmation Testing/Surveying - Alt. Dredge 84 84 0 09JUN10 14SEP10
04780 Redredging 85 85 0 19JUN10 25SEP10
04790 Additional Confirmation Testing/Surveying 85 85 0 23JUN10 29SEP10
2010 2011APR MAY JUN JUL AUG SEP OCT NOV DEC JAN FEB MAR A
29 5 12 19 26 3 10 17 24 31 7 14 21 28 5 12 19 26 2 9 16 23 30 6 13 20 27 4 11 18 25 1 8 15 22 29 6 13 20 27 3 10 17 24 31 7 14 21 28 7 14 21 28
Backfill Non-Critical AreasBackfill Critical AreasPost Backfilling Survey (Non Critical Areas)Post Backfilling Survey (Critical Areas)
Restore ShorelineRemove Sheet PilingRemove HPDE Silt Fences
Site 21 (Summary)
Site Preparation (Summary)Install Steel Sheet PilingInstall HDPE Silt BarriersClearing and Snagging ShorelineRemove Obstacles
Dredging (Summary)Design Cut(s) - (2) Primary DredgesDesign Cut(s) - (0) Alternate DredgesAdd. Alternate Dredging Around ObstructionsConfirmation Testing/Surveying - Primary DredgeConfirmation Testing/Surveying - Alt. Dredge
RedredgingAdditional Confirmation Testing/Surveying
Backfill Non-Critical AreasBackfill Critical AreasPost Backfilling Survey (Non Critical Areas)Post Backfilling Survey (Critical Areas)
Restore ShorelineRemove Sheet PilingRemove HPDE Silt Fences
Site 22 (Summary)
Site Preparation (Summary)Install Steel Sheet PilingInstall HDPE Silt BarriersClearing and Snagging ShorelineRemove Obstacles
Dredging (Summary)Design Cut(s) - (2) Primary DredgesDesign Cut(s) - (2) Alternate DredgesAdd. Alternate Dredging Around ObstructionsConfirmation Testing/Surveying - Primary DredgeConfirmation Testing/Surveying - Alt. Dredge
RedredgingAdditional Confirmation Testing/Surveying
© Primavera Systems, Inc.
Start Date 18APR05Finish Date 15NOV11Data Date 18APR05Run Date 22APR03 12:13
HPCB
Malcolm Pirnie, Inc.
Hudson River PCB Dredging
Phase II (Year 5)
Sheet 3 of 7Date Revision Checked Approved
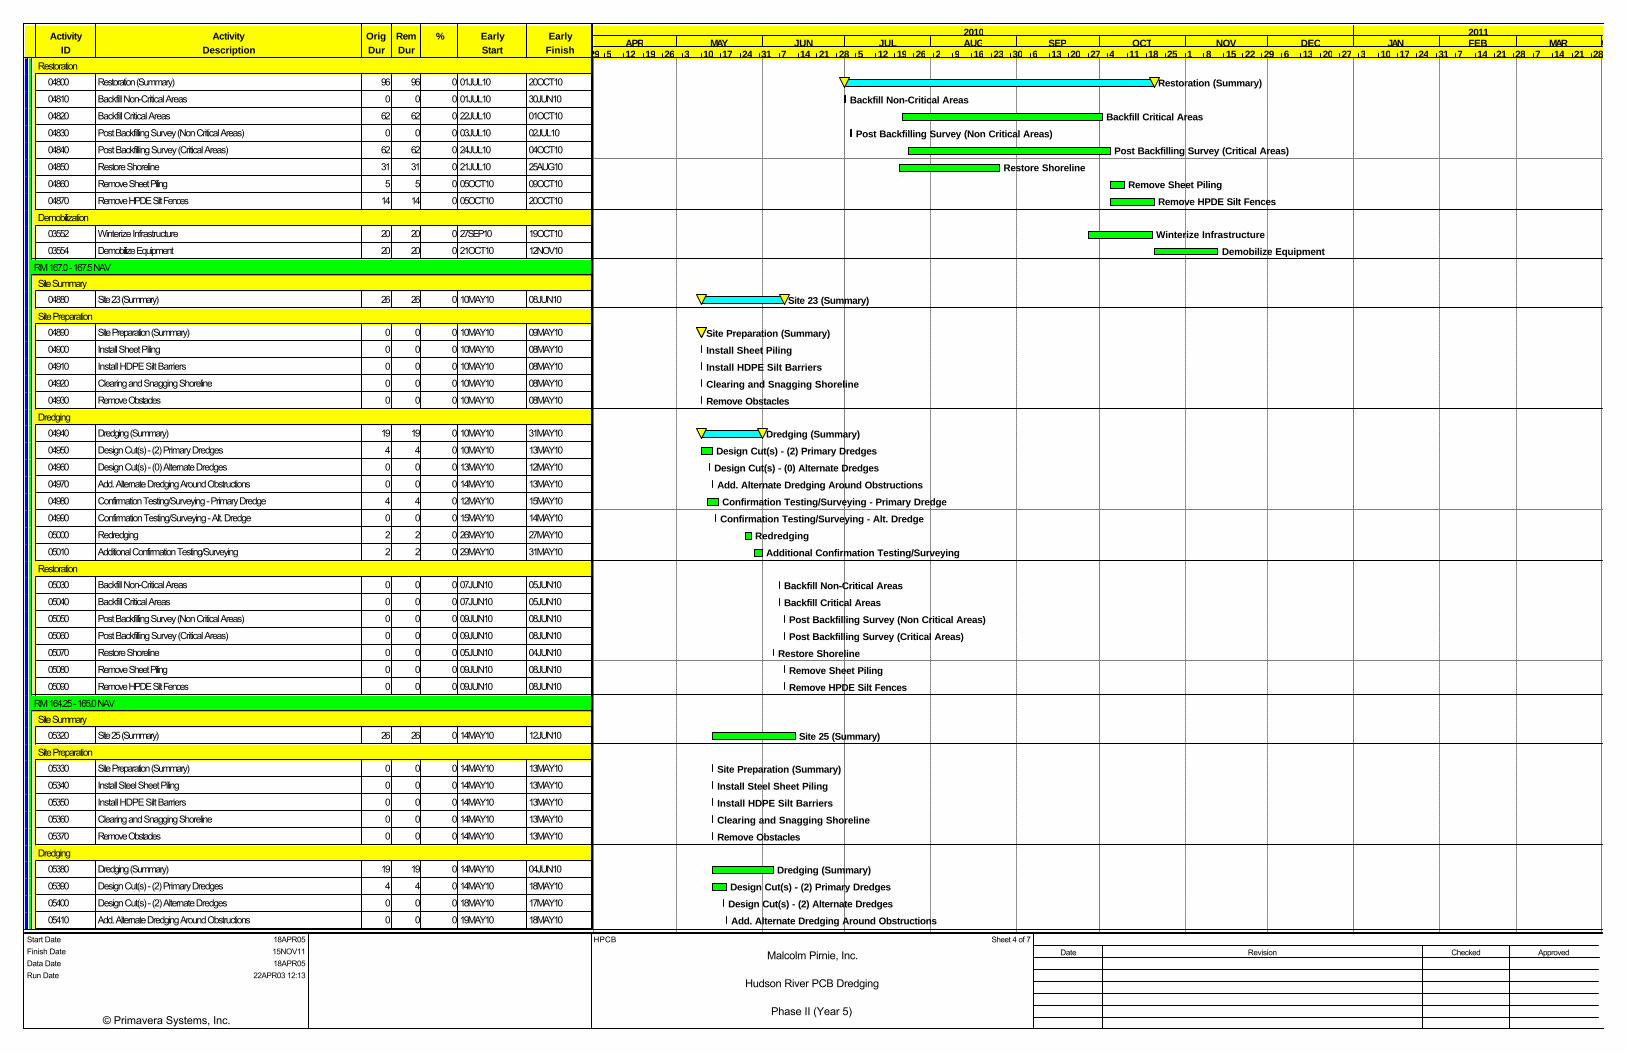
ActivityID
ActivityDescription
CalID
WBSPH SITETASKOrigDur
PredecessorsSuccessorsResourceID
Units perTime Period
RemDur
% EarlyStart
EarlyFinish
Restoration 04800 Restoration (Summary) 96 96 0 01JUL10 20OCT10
04810 Backfill Non-Critical Areas 0 0 0 01JUL10 30JUN10
04820 Backfill Critical Areas 62 62 0 22JUL10 01OCT10
04830 Post Backfilling Survey (Non Critical Areas) 0 0 0 03JUL10 02JUL10
04840 Post Backfilling Survey (Critical Areas) 62 62 0 24JUL10 04OCT10
04850 Restore Shoreline 31 31 0 21JUL10 25AUG10
04860 Remove Sheet Piling 5 5 0 05OCT10 09OCT10
04870 Remove HPDE Silt Fences 14 14 0 05OCT10 20OCT10
Demobilization 03552 Winterize Infrastructure 20 20 0 27SEP10 19OCT10
03554 Demobilize Equipment 20 20 0 21OCT10 12NOV10
RM 167.0 - 167.5 NAVSite Summary 04880 Site 23 (Summary) 26 26 0 10MAY10 08JUN10
Site Preparation 04890 Site Preparation (Summary) 0 0 0 10MAY10 09MAY10
04900 Install Sheet Piling 0 0 0 10MAY10 08MAY10
04910 Install HDPE Silt Barriers 0 0 0 10MAY10 08MAY10
04920 Clearing and Snagging Shoreline 0 0 0 10MAY10 08MAY10
04930 Remove Obstacles 0 0 0 10MAY10 08MAY10
Dredging 04940 Dredging (Summary) 19 19 0 10MAY10 31MAY10
04950 Design Cut(s) - (2) Primary Dredges 4 4 0 10MAY10 13MAY10
04960 Design Cut(s) - (0) Alternate Dredges 0 0 0 13MAY10 12MAY10
04970 Add. Alternate Dredging Around Obstructions 0 0 0 14MAY10 13MAY10
04980 Confirmation Testing/Surveying - Primary Dredge 4 4 0 12MAY10 15MAY10
04990 Confirmation Testing/Surveying - Alt. Dredge 0 0 0 15MAY10 14MAY10
05000 Redredging 2 2 0 26MAY10 27MAY10
05010 Additional Confirmation Testing/Surveying 2 2 0 29MAY10 31MAY10
Restoration 05030 Backfill Non-Critical Areas 0 0 0 07JUN10 05JUN10
05040 Backfill Critical Areas 0 0 0 07JUN10 05JUN10
05050 Post Backfilling Survey (Non Critical Areas) 0 0 0 09JUN10 08JUN10
05060 Post Backfilling Survey (Critical Areas) 0 0 0 09JUN10 08JUN10
05070 Restore Shoreline 0 0 0 05JUN10 04JUN10
05080 Remove Sheet Piling 0 0 0 09JUN10 08JUN10
05090 Remove HPDE Silt Fences 0 0 0 09JUN10 08JUN10
RM 164.25 - 165.0 NAVSite Summary 05320 Site 25 (Summary) 26 26 0 14MAY10 12JUN10
Site Preparation 05330 Site Preparation (Summary) 0 0 0 14MAY10 13MAY10
05340 Install Steel Sheet Piling 0 0 0 14MAY10 13MAY10
05350 Install HDPE Silt Barriers 0 0 0 14MAY10 13MAY10
05360 Clearing and Snagging Shoreline 0 0 0 14MAY10 13MAY10
05370 Remove Obstacles 0 0 0 14MAY10 13MAY10
Dredging 05380 Dredging (Summary) 19 19 0 14MAY10 04JUN10
05390 Design Cut(s) - (2) Primary Dredges 4 4 0 14MAY10 18MAY10
05400 Design Cut(s) - (2) Alternate Dredges 0 0 0 18MAY10 17MAY10
05410 Add. Alternate Dredging Around Obstructions 0 0 0 19MAY10 18MAY10
2010 2011APR MAY JUN JUL AUG SEP OCT NOV DEC JAN FEB MAR A
29 5 12 19 26 3 10 17 24 31 7 14 21 28 5 12 19 26 2 9 16 23 30 6 13 20 27 4 11 18 25 1 8 15 22 29 6 13 20 27 3 10 17 24 31 7 14 21 28 7 14 21 28
Restoration (Summary)Backfill Non-Critical Areas
Backfill Critical AreasPost Backfilling Survey (Non Critical Areas)
Post Backfilling Survey (Critical Areas)Restore Shoreline
Remove Sheet PilingRemove HPDE Silt Fences
Winterize InfrastructureDemobilize Equipment
Site 23 (Summary)
Site Preparation (Summary)Install Sheet PilingInstall HDPE Silt BarriersClearing and Snagging ShorelineRemove Obstacles
Dredging (Summary)Design Cut(s) - (2) Primary DredgesDesign Cut(s) - (0) Alternate DredgesAdd. Alternate Dredging Around ObstructionsConfirmation Testing/Surveying - Primary DredgeConfirmation Testing/Surveying - Alt. Dredge
RedredgingAdditional Confirmation Testing/Surveying
Backfill Non-Critical AreasBackfill Critical AreasPost Backfilling Survey (Non Critical Areas)Post Backfilling Survey (Critical Areas)
Restore ShorelineRemove Sheet PilingRemove HPDE Silt Fences
Site 25 (Summary)
Site Preparation (Summary)Install Steel Sheet PilingInstall HDPE Silt BarriersClearing and Snagging ShorelineRemove Obstacles
Dredging (Summary)Design Cut(s) - (2) Primary DredgesDesign Cut(s) - (2) Alternate DredgesAdd. Alternate Dredging Around Obstructions
© Primavera Systems, Inc.
Start Date 18APR05Finish Date 15NOV11Data Date 18APR05Run Date 22APR03 12:13
HPCB
Malcolm Pirnie, Inc.
Hudson River PCB Dredging
Phase II (Year 5)
Sheet 4 of 7Date Revision Checked Approved

ActivityID
ActivityDescription
CalID
WBSPH SITETASKOrigDur
PredecessorsSuccessorsResourceID
Units perTime Period
RemDur
% EarlyStart
EarlyFinish
05420 Confirmation Testing/Surveying - Primary Dredge 4 4 0 17MAY10 20MAY10
05430 Confirmation Testing/Surveying - Alt. Dredge 0 0 0 20MAY10 19MAY10
05440 Redredging 2 2 0 31MAY10 01JUN10
05450 Additional Confirmation Testing/Surveying 2 2 0 03JUN10 04JUN10
Restoration 05470 Backfill Non-Critical Areas 0 0 0 11JUN10 10JUN10
05480 Backfill Critical Areas 0 0 0 11JUN10 10JUN10
05490 Post Backfilling Survey (Non Critical Areas) 0 0 0 14JUN10 12JUN10
05500 Post Backfilling Survey (Critical Areas) 0 0 0 14JUN10 12JUN10
05510 Restore Shoreline 0 0 0 10JUN10 09JUN10
05520 Remove Sheet Piling 0 0 0 14JUN10 12JUN10
05530 Remove HPDE Silt Fences 0 0 0 14JUN10 12JUN10
RM 164.0 - 164.25 NAVSite Summary 05540 Site 26 (Summary) 26 26 0 02JUL10 31JUL10
Site Preparation 05550 Site Preparation (Summary) 0 0 0 02JUL10 01JUL10
05560 Install Steel Sheet Piling 0 0 0 02JUL10 01JUL10
05570 Install HDPE Silt Barriers 0 0 0 02JUL10 01JUL10
05580 Clearing and Snagging Shoreline 0 0 0 02JUL10 01JUL10
05590 Remove Obstacles 0 0 0 02JUL10 01JUL10
Dredging 05600 Dredging (Summary) 19 19 0 02JUL10 23JUL10
05610 Design Cut(s) - (2) Primary Dredges 4 4 0 02JUL10 06JUL10
05620 Design Cut(s) - (0) Alternate Dredges 0 0 0 06JUL10 05JUL10
05630 Add. Alternate Dredging Around Obstructions 0 0 0 06JUL10 05JUL10
05640 Confirmation Testing/Surveying - Primary Dredge 4 4 0 05JUL10 08JUL10
05650 Confirmation Testing/Surveying - Alt. Dredge 0 0 0 08JUL10 07JUL10
05660 Redredging 2 2 0 19JUL10 20JUL10
05670 Additional Confirmation Testing/Surveying 2 2 0 22JUL10 23JUL10
Restoration 05690 Backfill Non-Critical Areas 0 0 0 30JUL10 29JUL10
05700 Backfill Critical Areas 0 0 0 30JUL10 29JUL10
05710 Post Backfilling Survey (Non Critical Areas) 0 0 0 02AUG10 31JUL10
05720 Post Backfilling Survey (Critical Areas) 0 0 0 02AUG10 31JUL10
05730 Restore Shoreline 0 0 0 29JUL10 28JUL10
05740 Remove Sheet Piling 0 0 0 02AUG10 31JUL10
05750 Remove HPDE Silt Fences 0 0 0 02AUG10 31JUL10
RM 162.25 - 162.75 NAVSite Summary 05980 Site 28 (Summary) 33 33 0 07JUL10 13AUG10
Site Preparation 05990 Site Preparation (Summary) 0 0 0 07JUL10 06JUL10
06000 Install Steel Sheet Piling 0 0 0 07JUL10 06JUL10
06010 Install HDPE Silt Barriers 0 0 0 07JUL10 06JUL10
06020 Clearing and Snagging Shoreline 0 0 0 07JUL10 06JUL10
06030 Remove Obstacles 0 0 0 07JUL10 06JUL10
Dredging 06040 Dredging (Summary) 21 21 0 07JUL10 30JUL10
06050 Design Cut(s) - (2) Primary Dredges 6 6 0 07JUL10 13JUL10
06060 Design Cut(s) - (0) Alternate Dredges 0 0 0 10JUL10 09JUL10
06070 Add. Alternate Dredging Around Obstructions 0 0 0 14JUL10 13JUL10
2010 2011APR MAY JUN JUL AUG SEP OCT NOV DEC JAN FEB MAR A
29 5 12 19 26 3 10 17 24 31 7 14 21 28 5 12 19 26 2 9 16 23 30 6 13 20 27 4 11 18 25 1 8 15 22 29 6 13 20 27 3 10 17 24 31 7 14 21 28 7 14 21 28Confirmation Testing/Surveying - Primary DredgeConfirmation Testing/Surveying - Alt. Dredge
RedredgingAdditional Confirmation Testing/Surveying
Backfill Non-Critical AreasBackfill Critical Areas
Post Backfilling Survey (Non Critical Areas)Post Backfilling Survey (Critical Areas)
Restore ShorelineRemove Sheet PilingRemove HPDE Silt Fences
Site 26 (Summary)
Site Preparation (Summary)Install Steel Sheet PilingInstall HDPE Silt BarriersClearing and Snagging ShorelineRemove Obstacles
Dredging (Summary)Design Cut(s) - (2) Primary DredgesDesign Cut(s) - (0) Alternate DredgesAdd. Alternate Dredging Around Obstructions
Confirmation Testing/Surveying - Primary DredgeConfirmation Testing/Surveying - Alt. Dredge
RedredgingAdditional Confirmation Testing/Surveying
Backfill Non-Critical AreasBackfill Critical Areas
Post Backfilling Survey (Non Critical Areas)Post Backfilling Survey (Critical Areas)
Restore ShorelineRemove Sheet PilingRemove HPDE Silt Fences
Site 28 (Summary)
Site Preparation (Summary)Install Steel Sheet PilingInstall HDPE Silt BarriersClearing and Snagging ShorelineRemove Obstacles
Dredging (Summary)Design Cut(s) - (2) Primary Dredges
Design Cut(s) - (0) Alternate DredgesAdd. Alternate Dredging Around Obstructions
© Primavera Systems, Inc.
Start Date 18APR05Finish Date 15NOV11Data Date 18APR05Run Date 22APR03 12:13
HPCB
Malcolm Pirnie, Inc.
Hudson River PCB Dredging
Phase II (Year 5)
Sheet 5 of 7Date Revision Checked Approved

ActivityID
ActivityDescription
CalID
WBSPH SITETASKOrigDur
PredecessorsSuccessorsResourceID
Units perTime Period
RemDur
% EarlyStart
EarlyFinish
06080 Confirmation Testing/Surveying - Primary Dredge 6 6 0 09JUL10 15JUL10
06090 Confirmation Testing/Surveying - Alt. Dredge 0 0 0 13JUL10 12JUL10
06100 Redredging 3 3 0 24JUL10 27JUL10
06110 Additional Confirmation Testing/Surveying 3 3 0 28JUL10 30JUL10
Restoration 06120 Restoration (Summary) 9 9 0 04AUG10 13AUG10
06130 Backfill Non-Critical Areas 0 0 0 05AUG10 04AUG10
06140 Backfill Critical Areas 0 0 0 05AUG10 04AUG10
06150 Post Backfilling Survey (Non Critical Areas) 0 0 0 07AUG10 06AUG10
06160 Post Backfilling Survey (Critical Areas) 0 0 0 07AUG10 06AUG10
06170 Restore Shoreline 0 0 0 04AUG10 03AUG10
06180 Remove Sheet Piling 0 0 0 07AUG10 06AUG10
06190 Remove HPDE Silt Fences 0 0 0 07AUG10 06AUG10
RM 159.25 - 159.75 NAVSite Summary 06200 Site 29 (Summary) 27 27 0 14JUL10 13AUG10
Site Preparation 06210 Site Preparation (Summary) 0 0 0 14JUL10 13JUL10
06220 Install Steel Sheet Piling 0 0 0 14JUL10 13JUL10
06230 Install HDPE Silt Barriers 0 0 0 14JUL10 13JUL10
06240 Clearing and Snagging Shoreline 0 0 0 14JUL10 13JUL10
06250 Remove Obstacles 0 0 0 14JUL10 13JUL10
Dredging 06260 Dredging (Summary) 21 21 0 14JUL10 06AUG10
06270 Design Cut(s) - (2) Primary Dredges 6 6 0 14JUL10 20JUL10
06280 Design Cut(s) - (0) Alternate Dredges 0 0 0 17JUL10 16JUL10
06290 Add. Alternate Dredging Around Obstructions 0 0 0 21JUL10 20JUL10
06300 Confirmation Testing/Surveying - Primary Dredge 6 6 0 16JUL10 22JUL10
06310 Confirmation Testing/Surveying - Alt. Dredge 0 0 0 20JUL10 19JUL10
06320 Redredging 3 3 0 31JUL10 03AUG10
06330 Additional Confirmation Testing/Surveying 3 3 0 04AUG10 06AUG10
Restoration 06340 Restoration (Summary) 2 2 0 12AUG10 13AUG10
06350 Backfill Non-Critical Areas 0 0 0 12AUG10 11AUG10
06360 Backfill Critical Areas 0 0 0 12AUG10 11AUG10
06370 Post Backfilling Survey (Non Critical Areas) 0 0 0 14AUG10 13AUG10
06380 Post Backfilling Survey (Critical Areas) 0 0 0 14AUG10 13AUG10
06390 Restore Shoreline 0 0 0 11AUG10 10AUG10
06400 Remove Sheet Piling 0 0 0 14AUG10 13AUG10
06410 Remove HPDE Silt Fences 0 0 0 14AUG10 13AUG10
RM 158.5 - 159.25 NAVSite Summary 06420 Site 30 (Summary) 27 27 0 21JUL10 20AUG10
Site Preparation 06430 Site Preparation (Summary) 0 0 0 21JUL10 20JUL10
06440 Install Steel Sheet Piling 0 0 0 21JUL10 20JUL10
06450 Install HDPE Silt Barriers 0 0 0 21JUL10 20JUL10
06460 Clearing and Snagging Shoreline 0 0 0 21JUL10 20JUL10
06470 Remove Obstacles 0 0 0 21JUL10 20JUL10
Dredging 06480 Dredging (Summary) 21 21 0 21JUL10 13AUG10
06490 Design Cut(s) - (2) Primary Dredges 6 6 0 21JUL10 27JUL10
2010 2011APR MAY JUN JUL AUG SEP OCT NOV DEC JAN FEB MAR A
29 5 12 19 26 3 10 17 24 31 7 14 21 28 5 12 19 26 2 9 16 23 30 6 13 20 27 4 11 18 25 1 8 15 22 29 6 13 20 27 3 10 17 24 31 7 14 21 28 7 14 21 28Confirmation Testing/Surveying - Primary Dredge
Confirmation Testing/Surveying - Alt. DredgeRedredging
Additional Confirmation Testing/Surveying
Restoration (Summary)Backfill Non-Critical AreasBackfill Critical Areas
Post Backfilling Survey (Non Critical Areas)Post Backfilling Survey (Critical Areas)
Restore ShorelineRemove Sheet PilingRemove HPDE Silt Fences
Site 29 (Summary)
Site Preparation (Summary)Install Steel Sheet PilingInstall HDPE Silt BarriersClearing and Snagging ShorelineRemove Obstacles
Dredging (Summary)Design Cut(s) - (2) Primary Dredges
Design Cut(s) - (0) Alternate DredgesAdd. Alternate Dredging Around ObstructionsConfirmation Testing/Surveying - Primary Dredge
Confirmation Testing/Surveying - Alt. DredgeRedredging
Additional Confirmation Testing/Surveying
Restoration (Summary)Backfill Non-Critical AreasBackfill Critical Areas
Post Backfilling Survey (Non Critical Areas)Post Backfilling Survey (Critical Areas)
Restore ShorelineRemove Sheet PilingRemove HPDE Silt Fences
Site 30 (Summary)
Site Preparation (Summary)Install Steel Sheet PilingInstall HDPE Silt BarriersClearing and Snagging ShorelineRemove Obstacles
Dredging (Summary)Design Cut(s) - (2) Primary Dredges
© Primavera Systems, Inc.
Start Date 18APR05Finish Date 15NOV11Data Date 18APR05Run Date 22APR03 12:13
HPCB
Malcolm Pirnie, Inc.
Hudson River PCB Dredging
Phase II (Year 5)
Sheet 6 of 7Date Revision Checked Approved

ActivityID
ActivityDescription
CalID
WBSPH SITETASKOrigDur
PredecessorsSuccessorsResourceID
Units perTime Period
RemDur
% EarlyStart
EarlyFinish
06500 Design Cut(s) - (0) Alternate Dredges 0 0 0 24JUL10 23JUL10
06510 Add. Alternate Dredging Around Obstructions 0 0 0 28JUL10 27JUL10
06520 Confirmation Testing/Surveying - Primary Dredge 6 6 0 23JUL10 29JUL10
06530 Confirmation Testing/Surveying - Alt. Dredge 0 0 0 27JUL10 26JUL10
06540 Redredging 3 3 0 07AUG10 10AUG10
06550 Additional Confirmation Testing/Surveying 3 3 0 11AUG10 13AUG10
Restoration 06570 Backfill Non-Critical Areas 0 0 0 19AUG10 18AUG10
06580 Backfill Critical Areas 0 0 0 19AUG10 18AUG10
06590 Post Backfilling Survey (Non Critical Areas) 0 0 0 21AUG10 20AUG10
06600 Post Backfilling Survey (Critical Areas) 0 0 0 21AUG10 20AUG10
06610 Restore Shoreline 0 0 0 18AUG10 17AUG10
06620 Remove Sheet Piling 0 0 0 21AUG10 20AUG10
06630 Remove HPDE Silt Fences 0 0 0 21AUG10 20AUG10
2010 2011APR MAY JUN JUL AUG SEP OCT NOV DEC JAN FEB MAR A
29 5 12 19 26 3 10 17 24 31 7 14 21 28 5 12 19 26 2 9 16 23 30 6 13 20 27 4 11 18 25 1 8 15 22 29 6 13 20 27 3 10 17 24 31 7 14 21 28 7 14 21 28Design Cut(s) - (0) Alternate Dredges
Add. Alternate Dredging Around ObstructionsConfirmation Testing/Surveying - Primary Dredge
Confirmation Testing/Surveying - Alt. DredgeRedredging
Additional Confirmation Testing/Surveying
Backfill Non-Critical AreasBackfill Critical AreasPost Backfilling Survey (Non Critical Areas)Post Backfilling Survey (Critical Areas)
Restore ShorelineRemove Sheet PilingRemove HPDE Silt Fences
© Primavera Systems, Inc.
Start Date 18APR05Finish Date 15NOV11Data Date 18APR05Run Date 22APR03 12:13
HPCB
Malcolm Pirnie, Inc.
Hudson River PCB Dredging
Phase II (Year 5)
Sheet 7 of 7Date Revision Checked Approved

Production Schedule:
Phase 2 (Year 6)

ActivityID
ActivityDescription
CalID
WBSPH SITETASKOrigDur
PredecessorsSuccessorsResourceID
Units perTime Period
RemDur
% EarlyStart
EarlyFinish
Phase IIRM 165.75 - 166.75 WSite Summary 05099 Phase II (Year 6) 226* 226* 0 11APR11 29DEC11 05100 Site 24 (Summary) 172 172 0 11APR11 27OCT11 05101 Seasonal Mobilization 20 20 0 11APR11* 03MAY11 05102 Activate Infrastructure 30 30 0 11APR11 14MAY11
Site Preparation 05110 Site Preparation (Summary) 15 15 0 04MAY11 20MAY11 05120 Install Steel Sheet Piling 7 7 0 13MAY11 20MAY11 05130 Install HDPE Silt Barriers 15 15 0 04MAY11 20MAY11 05140 Clearing and Snagging Shoreline 1 1 0 20MAY11 20MAY11 05150 Remove Obstacles 2 2 0 19MAY11 20MAY11
Dredging 05160 Dredging (Summary) 109 109 0 21MAY11 24SEP11 05170 Design Cut(s) - (2) Primary Dredges 28 28 0 21MAY11 22JUN11 05180 Design Cut(s) - (3) Alternate Dredges 89 89 0 25MAY11 05SEP11 05190 Add. Alternate Dredging Around Obstructions 2 2 0 06SEP11 07SEP11 05200 Confirmation Testing/Surveying - Primary Dredge 28 28 0 24MAY11 24JUN11 05210 Confirmation Testing/Surveying - Alt. Dredge 89 89 0 30MAY11 09SEP11 05220 Redredging 58 58 0 16JUL11 21SEP11 05230 Additional Confirmation Testing/Surveying 58 58 0 20JUL11 24SEP11
Restoration 05240 Restoration (Summary) 80 80 0 27JUL11 27OCT11 05250 Backfill Non-Critical Areas 0 0 0 28SEP11 27SEP11 05260 Backfill Critical Areas 62 62 0 28JUL11 07OCT11 05270 Post Backfilling Survey (Non Critical Areas) 0 0 0 30SEP11 29SEP11 05280 Post Backfilling Survey (Critical Areas) 62 62 0 30JUL11 10OCT11 05285 Replace Obstructions 0 0 0 27JUL11 26JUL11 05290 Restore Shoreline 23 23 0 27JUL11 22AUG11 05300 Remove Sheet Piling 5 5 0 11OCT11 15OCT11 05310 Remove HPDE Silt Fences 15 15 0 11OCT11 27OCT11
RM 163.25 - 164.25 WSite Summary 05760 Site 27 (Summary) 190 190 0 04MAY11 10DEC11
Site Preparation 05770 Site Preparation (Summary) 16 16 0 04MAY11 21MAY11
2011 2012APR MAY JUN JUL AUG SEP OCT NOV DEC JAN FEB MAR
28 4 11 18 25 2 9 16 23 30 6 13 20 27 4 11 18 25 1 8 15 22 29 5 12 19 26 3 10 17 24 31 7 14 21 28 5 12 19 26 2 9 16 23 30 6 13 20 27 5 12 19 26
Phase II (Year 6)Site 24 (Summary)
Seasonal MobilizationActivate Infrastructure
Site Preparation (Summary)Install Steel Sheet PilingInstall HDPE Silt BarriersClearing and Snagging ShorelineRemove Obstacles
Dredging (Summary)Design Cut(s) - (2) Primary Dredges
Design Cut(s) - (3) Alternate DredgesAdd. Alternate Dredging Around Obstructions
Confirmation Testing/Surveying - Primary DredgeConfirmation Testing/Surveying - Alt. Dredge
RedredgingAdditional Confirmation Testing/Surveying
Restoration (Summary)Backfill Non-Critical Areas
Backfill Critical AreasPost Backfilling Survey (Non Critical Areas)
Post Backfilling Survey (Critical Areas)Replace Obstructions
Restore ShorelineRemove Sheet Piling
Remove HPDE Silt Fences
Site 27 (Summary)
Site Preparation (Summary)
© Primavera Systems, Inc.
Start Date 18APR05Finish Date 29DEC11Data Date 18APR05Run Date 08OCT03 14:28
HPCB
Malcolm Pirnie, Inc.
Hudson River PCB Dredging
Phase II (Year 6)
Sheet 1 of 2Date Revision Checked Approved
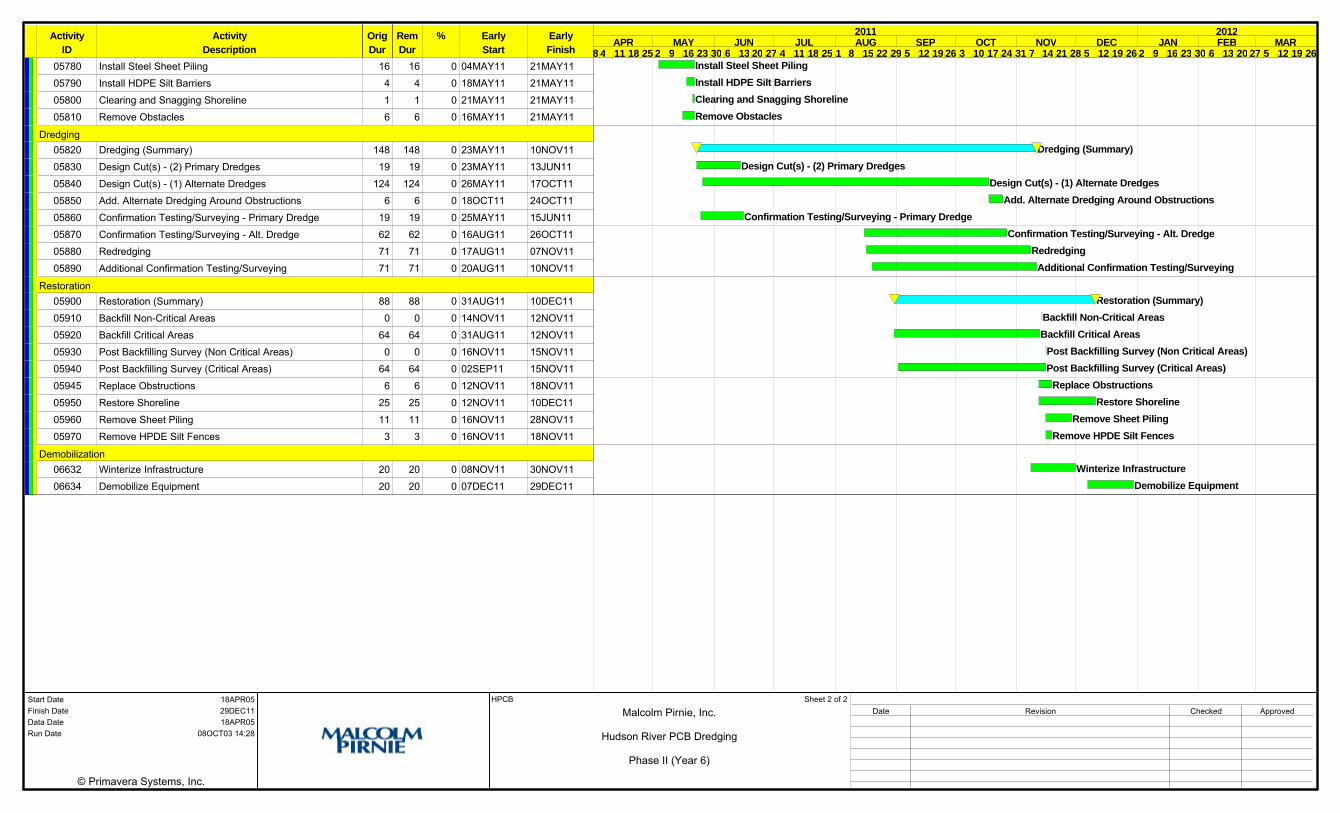
ActivityID
ActivityDescription
CalID
WBSPH SITETASKOrigDur
PredecessorsSuccessorsResourceID
Units perTime Period
RemDur
% EarlyStart
EarlyFinish
05780 Install Steel Sheet Piling 16 16 0 04MAY11 21MAY11 05790 Install HDPE Silt Barriers 4 4 0 18MAY11 21MAY11 05800 Clearing and Snagging Shoreline 1 1 0 21MAY11 21MAY11 05810 Remove Obstacles 6 6 0 16MAY11 21MAY11
Dredging 05820 Dredging (Summary) 148 148 0 23MAY11 10NOV11 05830 Design Cut(s) - (2) Primary Dredges 19 19 0 23MAY11 13JUN11 05840 Design Cut(s) - (1) Alternate Dredges 124 124 0 26MAY11 17OCT11 05850 Add. Alternate Dredging Around Obstructions 6 6 0 18OCT11 24OCT11 05860 Confirmation Testing/Surveying - Primary Dredge 19 19 0 25MAY11 15JUN11 05870 Confirmation Testing/Surveying - Alt. Dredge 62 62 0 16AUG11 26OCT11 05880 Redredging 71 71 0 17AUG11 07NOV11 05890 Additional Confirmation Testing/Surveying 71 71 0 20AUG11 10NOV11
Restoration 05900 Restoration (Summary) 88 88 0 31AUG11 10DEC11 05910 Backfill Non-Critical Areas 0 0 0 14NOV11 12NOV11 05920 Backfill Critical Areas 64 64 0 31AUG11 12NOV11 05930 Post Backfilling Survey (Non Critical Areas) 0 0 0 16NOV11 15NOV11 05940 Post Backfilling Survey (Critical Areas) 64 64 0 02SEP11 15NOV11 05945 Replace Obstructions 6 6 0 12NOV11 18NOV11 05950 Restore Shoreline 25 25 0 12NOV11 10DEC11 05960 Remove Sheet Piling 11 11 0 16NOV11 28NOV11 05970 Remove HPDE Silt Fences 3 3 0 16NOV11 18NOV11
Demobilization 06632 Winterize Infrastructure 20 20 0 08NOV11 30NOV11 06634 Demobilize Equipment 20 20 0 07DEC11 29DEC11
2011 2012APR MAY JUN JUL AUG SEP OCT NOV DEC JAN FEB MAR
28 4 11 18 25 2 9 16 23 30 6 13 20 27 4 11 18 25 1 8 15 22 29 5 12 19 26 3 10 17 24 31 7 14 21 28 5 12 19 26 2 9 16 23 30 6 13 20 27 5 12 19 26Install Steel Sheet PilingInstall HDPE Silt BarriersClearing and Snagging ShorelineRemove Obstacles
Dredging (Summary)Design Cut(s) - (2) Primary Dredges
Design Cut(s) - (1) Alternate DredgesAdd. Alternate Dredging Around Obstructions
Confirmation Testing/Surveying - Primary DredgeConfirmation Testing/Surveying - Alt. Dredge
RedredgingAdditional Confirmation Testing/Surveying
Restoration (Summary)Backfill Non-Critical AreasBackfill Critical Areas
Post Backfilling Survey (Non Critical Areas)Post Backfilling Survey (Critical Areas)
Replace ObstructionsRestore Shoreline
Remove Sheet PilingRemove HPDE Silt Fences
Winterize InfrastructureDemobilize Equipment
© Primavera Systems, Inc.
Start Date 18APR05Finish Date 29DEC11Data Date 18APR05Run Date 08OCT03 14:28
HPCB
Malcolm Pirnie, Inc.
Hudson River PCB Dredging
Phase II (Year 6)
Sheet 2 of 2Date Revision Checked Approved