drawing firmer conclusions: autistic children show no
TRANSCRIPT
ORIGINAL PAPER
Drawing Firmer Conclusions: Autistic Children Show NoEvidence of a Local Processing Bias in a Controlled Copying Task
Alastair D. Smith1 • Lorcan Kenny2 • Anna Rudnicka2 • Josie Briscoe3 •
Elizabeth Pellicano2,4
Published online: 17 August 2016
� The Author(s) 2016. This article is published with open access at Springerlink.com
Abstract Drawing tasks are frequently used to test com-
peting theories of visuospatial skills in autism. Yet,
methodological differences between studies have led to
inconsistent findings. To distinguish between accounts
based on local bias or global deficit, we present a simple
task that has previously revealed dissociable local/global
impairments in neuropsychological patients. Autistic and
typical children copied corner elements, arranged in a
square configuration. Grouping cues were manipulated to
test whether global properties affected the accuracy of
reproduction. All children were similarly affected by these
manipulations. There was no group difference in the
reproduction of local elements, although global accuracy
was negatively related to better local processing for autistic
children. These data speak against influential theories of
visuospatial differences in autism.
Keywords Autism � Drawing � Global � Local �Coherence � Grouping
Introduction
Drawing is a common everyday activity that is unique to
humans (La Femina et al. 2009). Graphic production is
particularly interesting because it requires synthesis of a
number of component functions, including visual percep-
tion, mental imagery, memory, attention and action (see
Smith 2009). Accordingly, drawing is commonly used as a
laboratory tool to study a variety of behavioural features,
from the development of reasoning abilities in childhood
(e.g., Preissler and Bloom 2008) to the decline of motor
coordination in old age (e.g., Morgan et al. 1994). It is for
these reasons that drawing production has proved to be an
important facet of autism research.
Cognitive and perceptual processing has long been
known to be unusual in autistic individuals (Frith 1989).
Performance on visuospatial tasks appears to illustrate a
particular profile of strengths and weaknesses, with par-
ticipants on the autism spectrum sometimes performing at a
level superior to that of typical individuals of similar age
and ability (for review, see Simmons et al. 2009). These
strengths have been demonstrated in tasks such as pattern
discrimination (Plaisted et al. 1998), block design (Shah
and Frith 1993) and detecting embedded figures (Jolliffe
and Baron-Cohen 1997; Pellicano et al. 2006).
It is likely that interest in assessing drawing behaviour in
autistic people was initially sparked by observations of
artistic savant abilities in some individuals (e.g., Mottron
and Belleville 1995; Selfe 1977). Such cases are rare,
although group-based studies of drawing behaviour in
autism have also reported superior performance relative to
typical individuals. For example, Mottron et al. (1999)
conducted a copying task, where autistic adults and ado-
lescents were required to reproduce impossible figures (i.e.,
three-dimensional designs where the global form does not
& Alastair D. Smith
1 School of Psychology, University of Nottingham, University
Park, Nottingham NG7 2RD, UK
2 Centre for Research in Autism and Education (CRAE), UCL
Institute of Education, University College London, London,
UK
3 Department of Experimental Psychology, University of
Bristol, Bristol, UK
4 School of Psychology, University of Western Australia,
Perth, Australia
123
J Autism Dev Disord (2016) 46:3481–3492
DOI 10.1007/s10803-016-2889-z
conform to geometric rules, but the local parts do). Both
groups copied possible figures with equal speed and
accuracy, but autistic individuals copied impossible fig-
ures significantly faster than typical individuals. Another
study by Sheppard et al. (2007) required autistic children
and adolescents to copy meaningful and non-meaningful
figures (constructed using the same line components) that
were either two-dimensional or three-dimensional. Both
autistic and typical groups produced more accurate copies
of meaningful figures, compared to non-meaningful, and
also of two-dimensional, compared to three-dimensional
stimuli. Importantly, however, autistic children were less
affected by dimensionality than typical children, and more
accurately depicted projection and perspective for three-
dimensional figures. This is in line with another study
(Sheppard et al. 2009a), which found that autistic partici-
pants were less affected by dimensionality than typical
participants when copying line-drawn figures, but not real
objects.
Explanations for autistic individuals’ greater accuracy in
copying tasks have focused on a potential bias towards
processing local perceptual features. The weak central
coherence (WCC) account (Frith 1989; Frith and Happe
1994; Happe and Frith 2006) is based on the behavioural
tendency to focus on details, at the expense of a coherent
global gestalt. This propensity is held to occur at the per-
ceptual level, but might also be manifest in more cognitive
behaviours, such as extracting gist in language. In contrast,
the Enhanced Perceptual Functioning (EPF) account
(Mottron and Burack 2001; Mottron et al. 2006; see also
Wang et al. 2007) specifically posits that superiorities in
information processing extend beyond the realm of local
processing to include basic perceptual functions, such as
detection, recognition and discrimination, as a result of
enhancements in bottom-up, feed-forward perceptual
operations. Although both accounts predict a focus on local
perceptual features, WCC proposes that superiorities in
local processing go hand-in-hand with difficulties in global
processing, whereas EPF posits that autistic perception
defaults to the local level, with global integration being
intact but not mandatory (for a fuller discussion of EPF see
Wang et al. 2007).
In response to these divergent predictions, a number of
studies have directly tested the veracity of the theories by
using drawing tasks. Sheppard et al. (2009b) studied
drawing strategies to assess whether adolescents with aut-
ism organised their copied renditions according to an
appreciation of the whole figure, or on a part-by-part basis.
Autistic participants were no more likely to use a local
strategy than those without autism and, since there was no
group difference at the global level (also see Jolliffe and
Baron-Cohen 2001; Ropar and Mitchell 2001), the authors
argued that these data provided evidence for the EPF
account. In contrast, other studies have reported clear dif-
ficulties in producing the global properties of drawings,
which lie in favour of the WCC account. For example, in
their copying task, Booth et al. (2003) found that autistic
children were more likely to begin their renditions with a
local detail, compared to both typical children and children
diagnosed with Attention Deficit Hyperactivity Disorder.
Autistic children were also more likely to draw in a
piecemeal fashion, yielding a final global configuration that
was incorrect. Similarly, Drake and Winner’s (2011)
autistic savant artist (a 10-year-old boy of average intelli-
gence) used a local strategy to complete drawings of three-
dimensional objects to a greater extent than a comparison
group of children with autism but without a drawing talent.
He also performed particularly well on tasks of local per-
ception (embedded figures, block design) and poorly on a
global task (classification of impossible figures).
It is therefore clear that evidence from existing studies
fails to yield consistent support for either account of
visuospatial processing in autism. Furthermore, some
studies report no group differences in drawing speed or
accuracy (e.g., Eames and Cox 1994; Mottron et al. 1999)
and others report poorer performance in autistic groups
(e.g., Booth et al. 2003). There are a number of potential
reasons for these differences. First, autism is a condition
that involves substantial heterogeneity. As a result, neither
the genetic (e.g. Ronald et al. 2006) nor the behavioural
and cognitive profile (e.g. Pellicano 2010) is likely to be
universal. Second, different studies have selected compar-
ison groups according to different principles. So, for
example, whereas Mottron et al. (1999) matched their
groups according to chronological age and non-verbal
mental age, Sheppard et al. (2009a, b) also matched theirs
according to verbal mental age. The ability to accurately
draw real objects has been related to vocabulary skills,
especially in younger children (e.g., Toomela 2002), and so
differences in the verbal skills of autistic participants might
impact upon the behaviours measured. Third, and most
importantly, the nature of the drawing tests themselves
have likely given rise to these differences in performance.
Some studies have used two-dimensional figures whereas
others have used three-dimensional figures. The inclusion
of dimensionality is a relatively advanced component of
drawing, especially for children (Willats 1977), which may
mask more subtle indices or variation. Equally, some
studies have used meaningful stimuli whereas others have
used more abstract ones. When meaning is not controlled
for, it may introduce additional conceptual components
that affect the planning and production of the drawing (van
Sommers 1984). Furthermore, not all studies include blind
rating of participant drawings. Preconceptions of group
differences can affect the assessment of drawing output,
irrespective of the measures used (Leek et al. 2000).
3482 J Autism Dev Disord (2016) 46:3481–3492
123
Finally, studies have tended to employ dependent measures
that conflate global and local processing, making it difficult
to dissociate their impact. For example, beginning draw-
ings at the local level (e.g., Booth et al. 2003; Drake and
Winner 2011) could either reflect enhanced local process-
ing or poor global processing.
We suggest that some of these problems can be over-
come by adopting methods and approaches used to study
similar behaviours in neuropsychological patients (i.e.,
individuals who have sustained neurological damage).
Graphic production tasks are ubiquitous in patient assess-
ment and there has been much interest in devising objective
quantitative measures of drawing that can inform the
delineation of fine-grained distinctions between both
functional components of behaviour and diagnostic cate-
gories themselves (Leek et al. 2000; Smith 2009). In the
present study, we therefore used a drawing task that was
originally designed to assess the influence of grouping cues
on drawing impairments in constructional apraxia, an
acquired dysfunction of the ability to construct a coherent
global form from local elements (in the absence of a per-
ceptual or motor deficit). This is most likely to be observed
in tasks such as drawing or arranging blocks and is asso-
ciated with damage to parietal and frontal cortices (see
Guerin et al. 1999). Smith and Gilchrist (2005a) presented
two adult patients with figures constructed of four L-shaped
corner elements, arranged to form a square. Grouping was
manipulated by skewing two or more of the part elements,
disrupting good continuation. Patient copies were scored
according to their reproduction at both the local level (i.e.,
the presence or absence of local elements) and the scalar
properties of the global form (i.e., internal angular accu-
racy, height-width ratio). Although the patients performed
similarly on other qualitative measures of drawing pro-
duction, measurements revealed an important dissociation
between them: patient ECR tended to complete across gaps
between elements to form a global square form, whereas
patient RA represented individual part elements but with a
poor global configuration (akin to some of the autistic
copies illustrated by Booth et al. 2003). This study pro-
vided evidence for a finer-grained distinction within the
broad category of constructional apraxia and also showed
that local and global processing can be dissociated in the
visuomotor domain.
In the present study, we used Smith andGilchrist’s (2005a)
methodology to assess drawing production in children on the
autism spectrum. The benefits of using this task were that it:
(1) provided a fine-grained parametric approach that is
specifically focused on the impact of grouping on drawing
production, enabling study of the process in the absence of
potentially confounding factors such as meaning or linear
perspective; (2) allowed us to dissociate global–local pro-
cessing by yielding several variables of interest, tapping either
local processing or global processing, but not both; and, (3)
enabled blind and detailed objective assessment of the draw-
ings. Copies were compared between a Grouped condition,
where gestalt properties of good continuation favoured a
strongwhole, and a Skewed condition, where those cues were
reduced by rotating some or all of the local elements. Criti-
cally, the vertices of the elements always formed the same
square configuration, andwemeasured the deviation from this
global square. If autistic children demonstrate a reduced
appreciation of the gestalt properties of the image, as predicted
byWCC, thenwewould expect the accuracy of their copies to
be less affected by the reduction of grouping cues than that of
typical children of similar age and ability. Insensitivity to
grouping cues in children with autism would also be manifest
in reduced scalar accuracy of the global configuration com-
pared to typical children. If, however, autistic children exhibit
global accuracy equal to that of typical children, and are
similarly affected by the reduction of global cues, then this
would provide evidence for the EPF account. Since both
theories predict strength in the processing of local informa-
tion, one should expect autistic children to perform more
accurately than typical children in the production of part
elements (i.e., fewer omissions of line segments).
In addition to the drawing task, we also investigated
individual differences in drawing ability by examining the
relationship between our key drawing indices (accuracy of
global and local reproduction) and performance onmeasures
tapping processes thought to underpin drawing ability (e.g.,
local processing and planning ability). Local processing was
measured using the Children’s Embedded Figures Test
(Witkin et al. 1971). Autistic children have repeatedly been
shown to outperform typical children on this test (e.g. Pel-
licano et al. 2006; although seeWhite and Saldana 2011) and
so it was of particular interest to assess whether any per-
ceptual strength in the detection of local form would be
reflected in visuomotor performance on our drawing task.
Planning ability was measured using the Tower of London
task (based on Shallice 1982). Harris and Leevers (2000)
argue that poor planning abilities are responsible for some
drawing difficulties in autism. However, Booth et al. (2003)
found that planning abilities were unrelated to drawing
performance in their tasks, despite the fact that such planning
was poorer in their autistic sample. We therefore examined
whether planning ability might be related to the more subtle
metric indices of drawing that we were measuring.
Method
Participants
Participant descriptives are shown in Table 1. 21 children
on the autism spectrum (two girls) and 21 typical children
J Autism Dev Disord (2016) 46:3481–3492 3483
123
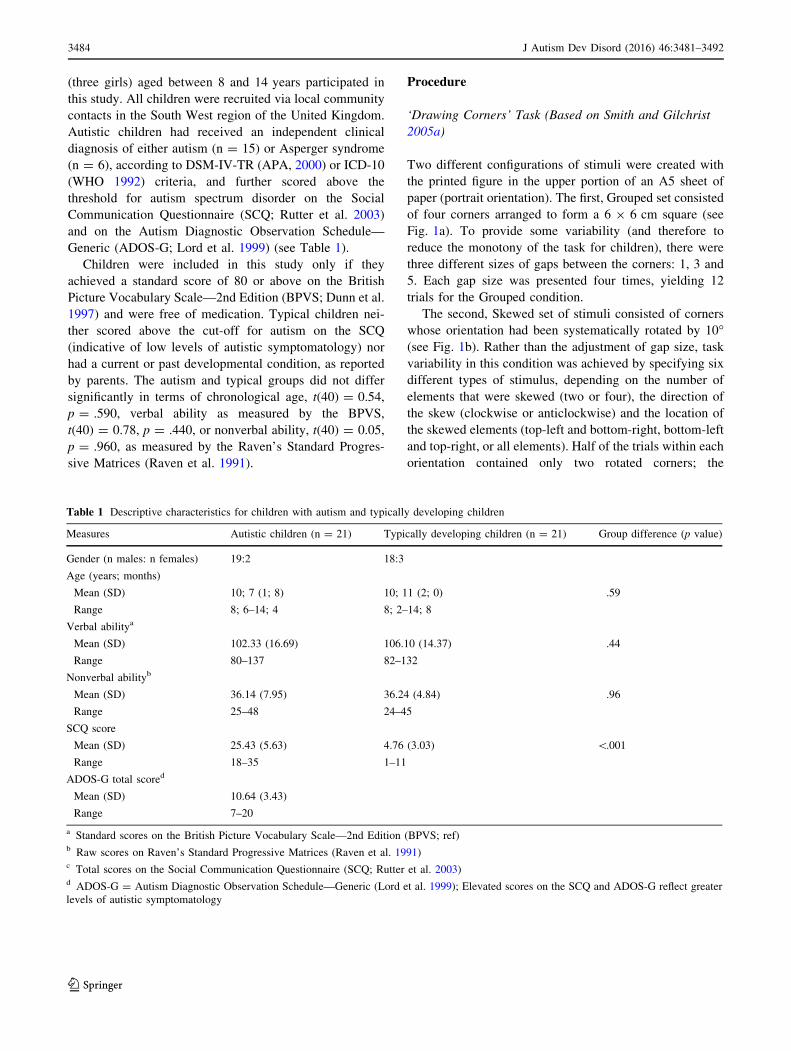
(three girls) aged between 8 and 14 years participated in
this study. All children were recruited via local community
contacts in the South West region of the United Kingdom.
Autistic children had received an independent clinical
diagnosis of either autism (n = 15) or Asperger syndrome
(n = 6), according to DSM-IV-TR (APA, 2000) or ICD-10
(WHO 1992) criteria, and further scored above the
threshold for autism spectrum disorder on the Social
Communication Questionnaire (SCQ; Rutter et al. 2003)
and on the Autism Diagnostic Observation Schedule—
Generic (ADOS-G; Lord et al. 1999) (see Table 1).
Children were included in this study only if they
achieved a standard score of 80 or above on the British
Picture Vocabulary Scale—2nd Edition (BPVS; Dunn et al.
1997) and were free of medication. Typical children nei-
ther scored above the cut-off for autism on the SCQ
(indicative of low levels of autistic symptomatology) nor
had a current or past developmental condition, as reported
by parents. The autism and typical groups did not differ
significantly in terms of chronological age, t(40) = 0.54,
p = .590, verbal ability as measured by the BPVS,
t(40) = 0.78, p = .440, or nonverbal ability, t(40) = 0.05,
p = .960, as measured by the Raven’s Standard Progres-
sive Matrices (Raven et al. 1991).
Procedure
‘Drawing Corners’ Task (Based on Smith and Gilchrist
2005a)
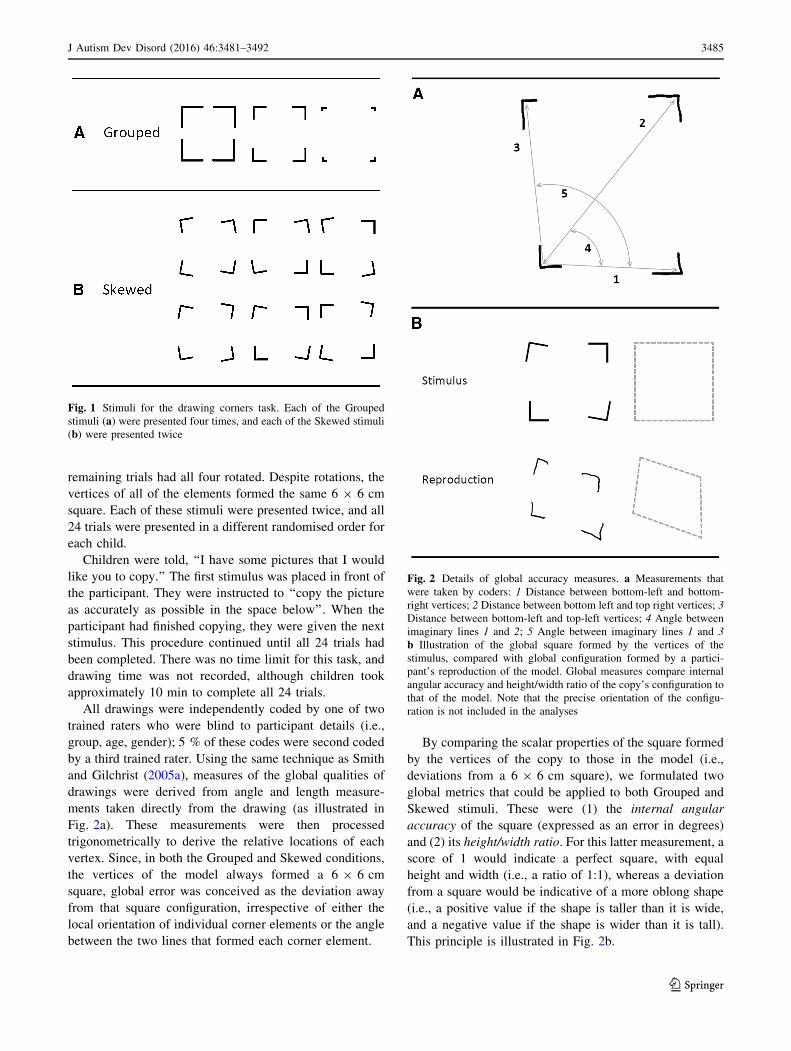
Two different configurations of stimuli were created with
the printed figure in the upper portion of an A5 sheet of
paper (portrait orientation). The first, Grouped set consisted
of four corners arranged to form a 6 9 6 cm square (see
Fig. 1a). To provide some variability (and therefore to
reduce the monotony of the task for children), there were
three different sizes of gaps between the corners: 1, 3 and
5. Each gap size was presented four times, yielding 12
trials for the Grouped condition.
The second, Skewed set of stimuli consisted of corners
whose orientation had been systematically rotated by 10�(see Fig. 1b). Rather than the adjustment of gap size, task
variability in this condition was achieved by specifying six
different types of stimulus, depending on the number of
elements that were skewed (two or four), the direction of
the skew (clockwise or anticlockwise) and the location of
the skewed elements (top-left and bottom-right, bottom-left
and top-right, or all elements). Half of the trials within each
orientation contained only two rotated corners; the
Table 1 Descriptive characteristics for children with autism and typically developing children
Measures Autistic children (n = 21) Typically developing children (n = 21) Group difference (p value)
Gender (n males: n females) 19:2 18:3
Age (years; months)
Mean (SD) 10; 7 (1; 8) 10; 11 (2; 0) .59
Range 8; 6–14; 4 8; 2–14; 8
Verbal abilitya
Mean (SD) 102.33 (16.69) 106.10 (14.37) .44
Range 80–137 82–132
Nonverbal abilityb
Mean (SD) 36.14 (7.95) 36.24 (4.84) .96
Range 25–48 24–45
SCQ score
Mean (SD) 25.43 (5.63) 4.76 (3.03) \.001
Range 18–35 1–11
ADOS-G total scored
Mean (SD) 10.64 (3.43)
Range 7–20
a Standard scores on the British Picture Vocabulary Scale—2nd Edition (BPVS; ref)b Raw scores on Raven’s Standard Progressive Matrices (Raven et al. 1991)c Total scores on the Social Communication Questionnaire (SCQ; Rutter et al. 2003)d ADOS-G = Autism Diagnostic Observation Schedule—Generic (Lord et al. 1999); Elevated scores on the SCQ and ADOS-G reflect greater
levels of autistic symptomatology
3484 J Autism Dev Disord (2016) 46:3481–3492
123
remaining trials had all four rotated. Despite rotations, the
vertices of all of the elements formed the same 6 9 6 cm
square. Each of these stimuli were presented twice, and all
24 trials were presented in a different randomised order for
each child.
Children were told, ‘‘I have some pictures that I would
like you to copy.’’ The first stimulus was placed in front of
the participant. They were instructed to ‘‘copy the picture
as accurately as possible in the space below’’. When the
participant had finished copying, they were given the next
stimulus. This procedure continued until all 24 trials had
been completed. There was no time limit for this task, and
drawing time was not recorded, although children took
approximately 10 min to complete all 24 trials.
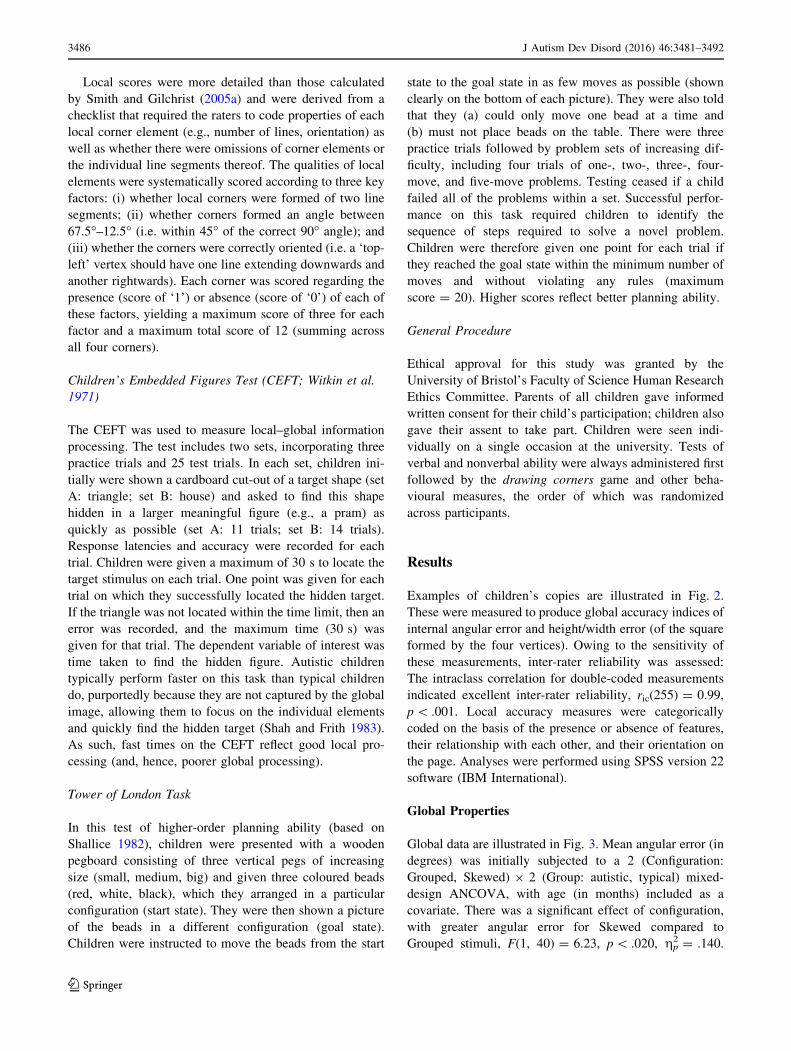
All drawings were independently coded by one of two
trained raters who were blind to participant details (i.e.,
group, age, gender); 5 % of these codes were second coded
by a third trained rater. Using the same technique as Smith
and Gilchrist (2005a), measures of the global qualities of
drawings were derived from angle and length measure-
ments taken directly from the drawing (as illustrated in
Fig. 2a). These measurements were then processed
trigonometrically to derive the relative locations of each
vertex. Since, in both the Grouped and Skewed conditions,
the vertices of the model always formed a 6 9 6 cm
square, global error was conceived as the deviation away
from that square configuration, irrespective of either the
local orientation of individual corner elements or the angle
between the two lines that formed each corner element.
By comparing the scalar properties of the square formed
by the vertices of the copy to those in the model (i.e.,
deviations from a 6 9 6 cm square), we formulated two
global metrics that could be applied to both Grouped and
Skewed stimuli. These were (1) the internal angular
accuracy of the square (expressed as an error in degrees)
and (2) its height/width ratio. For this latter measurement, a
score of 1 would indicate a perfect square, with equal
height and width (i.e., a ratio of 1:1), whereas a deviation
from a square would be indicative of a more oblong shape
(i.e., a positive value if the shape is taller than it is wide,
and a negative value if the shape is wider than it is tall).
This principle is illustrated in Fig. 2b.
Fig. 1 Stimuli for the drawing corners task. Each of the Grouped
stimuli (a) were presented four times, and each of the Skewed stimuli
(b) were presented twice
Fig. 2 Details of global accuracy measures. a Measurements that
were taken by coders: 1 Distance between bottom-left and bottom-
right vertices; 2 Distance between bottom left and top right vertices; 3
Distance between bottom-left and top-left vertices; 4 Angle between
imaginary lines 1 and 2; 5 Angle between imaginary lines 1 and 3
b Illustration of the global square formed by the vertices of the
stimulus, compared with global configuration formed by a partici-
pant’s reproduction of the model. Global measures compare internal
angular accuracy and height/width ratio of the copy’s configuration to
that of the model. Note that the precise orientation of the configu-
ration is not included in the analyses
J Autism Dev Disord (2016) 46:3481–3492 3485
123
Local scores were more detailed than those calculated
by Smith and Gilchrist (2005a) and were derived from a
checklist that required the raters to code properties of each
local corner element (e.g., number of lines, orientation) as
well as whether there were omissions of corner elements or
the individual line segments thereof. The qualities of local
elements were systematically scored according to three key
factors: (i) whether local corners were formed of two line
segments; (ii) whether corners formed an angle between
67.5�–12.5� (i.e. within 45� of the correct 90� angle); and(iii) whether the corners were correctly oriented (i.e. a ‘top-
left’ vertex should have one line extending downwards and
another rightwards). Each corner was scored regarding the
presence (score of ‘1’) or absence (score of ‘0’) of each of
these factors, yielding a maximum score of three for each
factor and a maximum total score of 12 (summing across
all four corners).
Children’s Embedded Figures Test (CEFT; Witkin et al.
1971)
The CEFT was used to measure local–global information
processing. The test includes two sets, incorporating three
practice trials and 25 test trials. In each set, children ini-
tially were shown a cardboard cut-out of a target shape (set
A: triangle; set B: house) and asked to find this shape
hidden in a larger meaningful figure (e.g., a pram) as
quickly as possible (set A: 11 trials; set B: 14 trials).
Response latencies and accuracy were recorded for each
trial. Children were given a maximum of 30 s to locate the
target stimulus on each trial. One point was given for each
trial on which they successfully located the hidden target.
If the triangle was not located within the time limit, then an
error was recorded, and the maximum time (30 s) was
given for that trial. The dependent variable of interest was
time taken to find the hidden figure. Autistic children
typically perform faster on this task than typical children
do, purportedly because they are not captured by the global
image, allowing them to focus on the individual elements
and quickly find the hidden target (Shah and Frith 1983).
As such, fast times on the CEFT reflect good local pro-
cessing (and, hence, poorer global processing).
Tower of London Task
In this test of higher-order planning ability (based on
Shallice 1982), children were presented with a wooden
pegboard consisting of three vertical pegs of increasing
size (small, medium, big) and given three coloured beads
(red, white, black), which they arranged in a particular
configuration (start state). They were then shown a picture
of the beads in a different configuration (goal state).
Children were instructed to move the beads from the start
state to the goal state in as few moves as possible (shown
clearly on the bottom of each picture). They were also told
that they (a) could only move one bead at a time and
(b) must not place beads on the table. There were three
practice trials followed by problem sets of increasing dif-
ficulty, including four trials of one-, two-, three-, four-
move, and five-move problems. Testing ceased if a child
failed all of the problems within a set. Successful perfor-
mance on this task required children to identify the
sequence of steps required to solve a novel problem.
Children were therefore given one point for each trial if
they reached the goal state within the minimum number of
moves and without violating any rules (maximum
score = 20). Higher scores reflect better planning ability.
General Procedure
Ethical approval for this study was granted by the
University of Bristol’s Faculty of Science Human Research
Ethics Committee. Parents of all children gave informed
written consent for their child’s participation; children also
gave their assent to take part. Children were seen indi-
vidually on a single occasion at the university. Tests of
verbal and nonverbal ability were always administered first
followed by the drawing corners game and other beha-
vioural measures, the order of which was randomized
across participants.
Results
Examples of children’s copies are illustrated in Fig. 2.
These were measured to produce global accuracy indices of
internal angular error and height/width error (of the square
formed by the four vertices). Owing to the sensitivity of
these measurements, inter-rater reliability was assessed:
The intraclass correlation for double-coded measurements
indicated excellent inter-rater reliability, ric(255) = 0.99,
p\ .001. Local accuracy measures were categorically
coded on the basis of the presence or absence of features,
their relationship with each other, and their orientation on
the page. Analyses were performed using SPSS version 22
software (IBM International).
Global Properties
Global data are illustrated in Fig. 3. Mean angular error (in
degrees) was initially subjected to a 2 (Configuration:
Grouped, Skewed) 9 2 (Group: autistic, typical) mixed-
design ANCOVA, with age (in months) included as a
covariate. There was a significant effect of configuration,
with greater angular error for Skewed compared to
Grouped stimuli, F(1, 40) = 6.23, p\ .020, gp2 = .140.
3486 J Autism Dev Disord (2016) 46:3481–3492
123
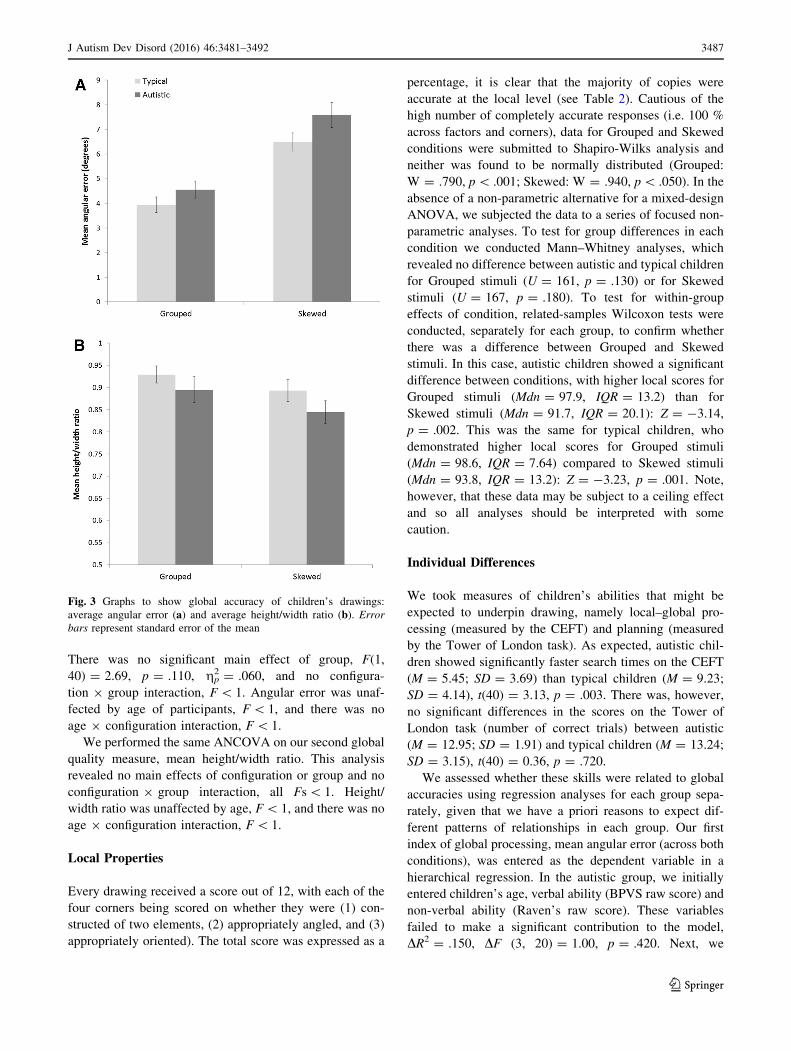
There was no significant main effect of group, F(1,
40) = 2.69, p = .110, gp2 = .060, and no configura-
tion 9 group interaction, F\ 1. Angular error was unaf-
fected by age of participants, F\ 1, and there was no
age 9 configuration interaction, F\ 1.
We performed the same ANCOVA on our second global
quality measure, mean height/width ratio. This analysis
revealed no main effects of configuration or group and no
configuration 9 group interaction, all Fs\ 1. Height/
width ratio was unaffected by age, F\ 1, and there was no
age 9 configuration interaction, F\ 1.
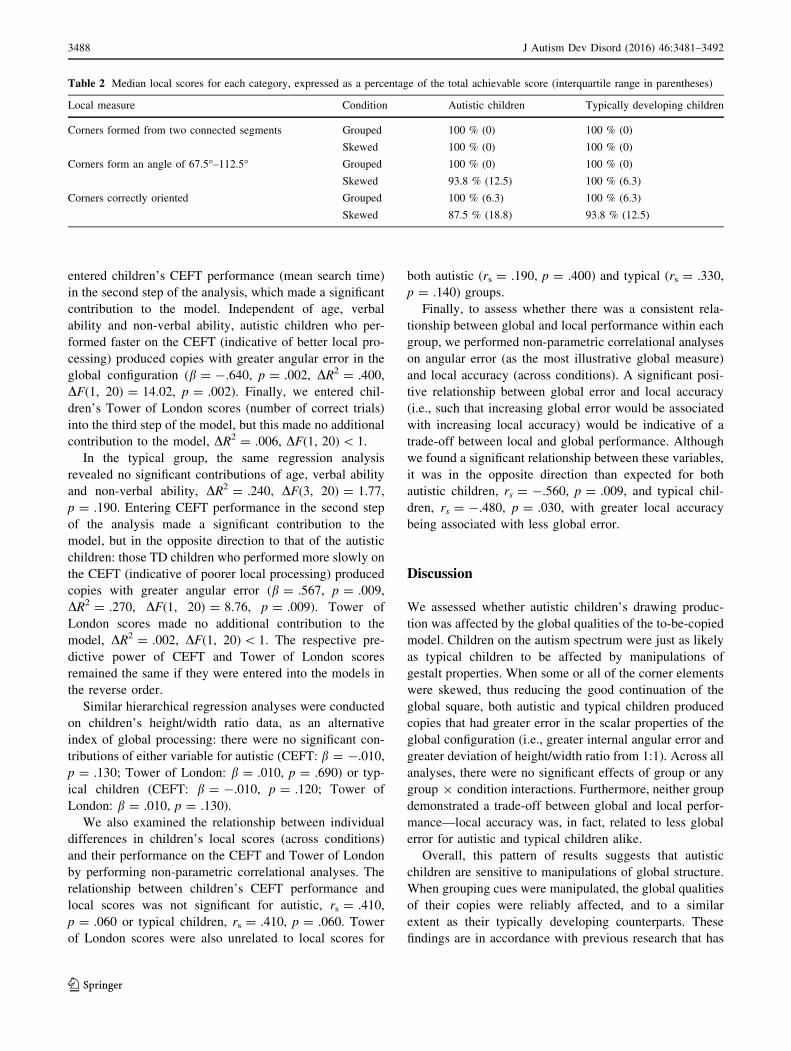
Local Properties
Every drawing received a score out of 12, with each of the
four corners being scored on whether they were (1) con-
structed of two elements, (2) appropriately angled, and (3)
appropriately oriented). The total score was expressed as a
percentage, it is clear that the majority of copies were
accurate at the local level (see Table 2). Cautious of the
high number of completely accurate responses (i.e. 100 %
across factors and corners), data for Grouped and Skewed
conditions were submitted to Shapiro-Wilks analysis and
neither was found to be normally distributed (Grouped:
W = .790, p\ .001; Skewed: W = .940, p\ .050). In the
absence of a non-parametric alternative for a mixed-design
ANOVA, we subjected the data to a series of focused non-
parametric analyses. To test for group differences in each
condition we conducted Mann–Whitney analyses, which
revealed no difference between autistic and typical children
for Grouped stimuli (U = 161, p = .130) or for Skewed
stimuli (U = 167, p = .180). To test for within-group
effects of condition, related-samples Wilcoxon tests were
conducted, separately for each group, to confirm whether
there was a difference between Grouped and Skewed
stimuli. In this case, autistic children showed a significant
difference between conditions, with higher local scores for
Grouped stimuli (Mdn = 97.9, IQR = 13.2) than for
Skewed stimuli (Mdn = 91.7, IQR = 20.1): Z = -3.14,
p = .002. This was the same for typical children, who
demonstrated higher local scores for Grouped stimuli
(Mdn = 98.6, IQR = 7.64) compared to Skewed stimuli
(Mdn = 93.8, IQR = 13.2): Z = -3.23, p = .001. Note,
however, that these data may be subject to a ceiling effect
and so all analyses should be interpreted with some
caution.
Individual Differences
We took measures of children’s abilities that might be
expected to underpin drawing, namely local–global pro-
cessing (measured by the CEFT) and planning (measured
by the Tower of London task). As expected, autistic chil-
dren showed significantly faster search times on the CEFT
(M = 5.45; SD = 3.69) than typical children (M = 9.23;
SD = 4.14), t(40) = 3.13, p = .003. There was, however,
no significant differences in the scores on the Tower of
London task (number of correct trials) between autistic
(M = 12.95; SD = 1.91) and typical children (M = 13.24;
SD = 3.15), t(40) = 0.36, p = .720.
We assessed whether these skills were related to global
accuracies using regression analyses for each group sepa-
rately, given that we have a priori reasons to expect dif-
ferent patterns of relationships in each group. Our first
index of global processing, mean angular error (across both
conditions), was entered as the dependent variable in a
hierarchical regression. In the autistic group, we initially
entered children’s age, verbal ability (BPVS raw score) and
non-verbal ability (Raven’s raw score). These variables
failed to make a significant contribution to the model,
DR2 = .150, DF (3, 20) = 1.00, p = .420. Next, we
Fig. 3 Graphs to show global accuracy of children’s drawings:
average angular error (a) and average height/width ratio (b). Error
bars represent standard error of the mean
J Autism Dev Disord (2016) 46:3481–3492 3487
123
entered children’s CEFT performance (mean search time)
in the second step of the analysis, which made a significant
contribution to the model. Independent of age, verbal
ability and non-verbal ability, autistic children who per-
formed faster on the CEFT (indicative of better local pro-
cessing) produced copies with greater angular error in the
global configuration (b = -.640, p = .002, DR2 = .400,
DF(1, 20) = 14.02, p = .002). Finally, we entered chil-
dren’s Tower of London scores (number of correct trials)
into the third step of the model, but this made no additional
contribution to the model, DR2 = .006, DF(1, 20)\ 1.
In the typical group, the same regression analysis
revealed no significant contributions of age, verbal ability
and non-verbal ability, DR2 = .240, DF(3, 20) = 1.77,
p = .190. Entering CEFT performance in the second step
of the analysis made a significant contribution to the
model, but in the opposite direction to that of the autistic
children: those TD children who performed more slowly on
the CEFT (indicative of poorer local processing) produced
copies with greater angular error (b = .567, p = .009,
DR2 = .270, DF(1, 20) = 8.76, p = .009). Tower of
London scores made no additional contribution to the
model, DR2 = .002, DF(1, 20)\ 1. The respective pre-
dictive power of CEFT and Tower of London scores
remained the same if they were entered into the models in
the reverse order.
Similar hierarchical regression analyses were conducted
on children’s height/width ratio data, as an alternative
index of global processing: there were no significant con-
tributions of either variable for autistic (CEFT: b = -.010,
p = .130; Tower of London: b = .010, p = .690) or typ-
ical children (CEFT: b = -.010, p = .120; Tower of
London: b = .010, p = .130).
We also examined the relationship between individual
differences in children’s local scores (across conditions)
and their performance on the CEFT and Tower of London
by performing non-parametric correlational analyses. The
relationship between children’s CEFT performance and
local scores was not significant for autistic, rs = .410,
p = .060 or typical children, rs = .410, p = .060. Tower
of London scores were also unrelated to local scores for
both autistic (rs = .190, p = .400) and typical (rs = .330,
p = .140) groups.
Finally, to assess whether there was a consistent rela-
tionship between global and local performance within each
group, we performed non-parametric correlational analyses
on angular error (as the most illustrative global measure)
and local accuracy (across conditions). A significant posi-
tive relationship between global error and local accuracy
(i.e., such that increasing global error would be associated
with increasing local accuracy) would be indicative of a
trade-off between local and global performance. Although
we found a significant relationship between these variables,
it was in the opposite direction than expected for both
autistic children, rs = -.560, p = .009, and typical chil-
dren, rs = -.480, p = .030, with greater local accuracy
being associated with less global error.
Discussion
We assessed whether autistic children’s drawing produc-
tion was affected by the global qualities of the to-be-copied
model. Children on the autism spectrum were just as likely
as typical children to be affected by manipulations of
gestalt properties. When some or all of the corner elements
were skewed, thus reducing the good continuation of the
global square, both autistic and typical children produced
copies that had greater error in the scalar properties of the
global configuration (i.e., greater internal angular error and
greater deviation of height/width ratio from 1:1). Across all
analyses, there were no significant effects of group or any
group 9 condition interactions. Furthermore, neither group
demonstrated a trade-off between global and local perfor-
mance—local accuracy was, in fact, related to less global
error for autistic and typical children alike.
Overall, this pattern of results suggests that autistic
children are sensitive to manipulations of global structure.
When grouping cues were manipulated, the global qualities
of their copies were reliably affected, and to a similar
extent as their typically developing counterparts. These
findings are in accordance with previous research that has
Table 2 Median local scores for each category, expressed as a percentage of the total achievable score (interquartile range in parentheses)
Local measure Condition Autistic children Typically developing children
Corners formed from two connected segments Grouped 100 % (0) 100 % (0)
Skewed 100 % (0) 100 % (0)
Corners form an angle of 67.5�–112.5� Grouped 100 % (0) 100 % (0)
Skewed 93.8 % (12.5) 100 % (6.3)
Corners correctly oriented Grouped 100 % (6.3) 100 % (6.3)
Skewed 87.5 % (18.8) 93.8 % (12.5)
3488 J Autism Dev Disord (2016) 46:3481–3492
123
reported no group difference in drawing performance at the
global level (e.g., Mottron et al. 1999; Sheppard et al.
2007). Taken together, these findings speak against the
WCC account (Happe and Frith 2006), which states that
individuals on the autism spectrum are less sensitive to
global structure than typical individuals. Furthermore, our
findings do not support those of Booth et al. (2003), who
reported poor configural properties of reproductions. One
reason for the discrepancy in findings is that our stimuli
were representationally simpler (i.e., two-dimensional
geometric forms) and were not supported by a semantic
interpretation. For example, whilst Booth et al. (2003)
asked participants to draw, say, a house, we simply asked
children to copy what they could see. Despite the relative
simplicity of our stimuli, however, the global manipula-
tions were sufficiently strong to modulate copying beha-
viour in both typical and autistic children, which warrants
confidence in our findings. It is perhaps the case that
reported drawing differences between autistic and typical
children are a result of semantic factors relating to the
planning of drawings (see van Sommers 1984), rather than
purely visuospatial components.
There is, however, an aspect of our results that could be
taken as support for the WCC account, namely, autistic
children’s CEFT performance. First, they were signifi-
cantly faster to find the hidden figure than typical children,
replicating previous findings (Jolliffe and Baron-Cohen
1997; Pellicano et al. 2006) and demonstrating a local bias
in the visual domain (i.e. search) that was not observed in
the visuomotor domain (i.e. drawing accuracy). Second,
there was a significant relationship between CEFT perfor-
mance and copying accuracy in the autistic children in the
predicted direction: those who displayed a local bias in the
task, by locating the local shape more rapidly, were more
likely to demonstrate global inaccuracies in their copies.
Interestingly, this pattern was reversed in typical children,
such that those who displayed a local bias in the task were
less likely to demonstrate global inaccuracies. This CEFT-
drawing relationship suggests that relative strengths in one
visuospatial task (emphasising the local level) might be
associated with relative weaknesses in another (requiring
attention to the global level), in a manner consistent with
the predictions of WCC. This was observed for our autistic
sample, and the relationship is in accordance with previous
findings that local bias in the CEFT is associated with
inefficiencies in large-scale spatial learning (Pellicano et al.
2011). It is therefore possible that the autistic children were
using different cognitive strategies to produce their copies.
Although this may have only been evident in a discrete
aspect of their global performance, the unique negative
relationship between global accuracy and local bias may be
indicative of a different approach to the analysis and
reproduction of figures. The positive relationship between
CEFT performance and average angular error in typical
children is less in-line with our predictions, although it may
instead reflect a general relationship between performance
levels across tasks (i.e. those children who performed more
efficiently in the CEFT were also more accurate at the
copying task) (see Pellicano 2010, for a discussion of the
relationship between CEFT and other skills). In future
research, it would be beneficial to record the time-course of
children’s copying behaviour, which might shed further
light on potential qualitative differences between autistic
and typical children’s drawing skills.
In contrast with CEFT performance, planning abilities
(as measured by children’s Tower of London scores) did
not predict performance in either group. Furthermore,
unlike Booth et al. (2003), we did not find a group dif-
ference on planning abilities, although this could be related
to the fact that we used a different measure. While they
measured planning in relation to the drawing task itself, our
measure of higher-order planning (the Tower of London)
required children to plan a longer sequence of moves. Our
assay of planning was therefore potentially more diffi-
cult—for both groups of children—than the one used by
Booth et al. (2003).
The Enhanced Perceptual Functioning (EPF) account of
visuospatial behaviour in autism (Mottron et al. 2006)
explicitly states that superiorities at the local level are
distinct from global processing skills, which are held to be
intact. The findings regarding the relationship between
autistic children’s drawing performance and the CEFT are
therefore contrary to those predictions. Nevertheless, the
overarching picture created by the data is one of no group
differences in drawing performance—neither in terms of
their attention to the global configuration nor to the indi-
vidual constituent elements. These data, therefore, do not
support an argument for local superiority in drawing pro-
duction, as proposed by previous graphic production
studies that favour the EPF account (e.g. Mottron et al.
1999; Sheppard et al. 2009b). However, it is important to
note that these data may be subject to a ceiling effect, since
the majority of drawings were produced without error at
the local level. Future studies should, therefore, take an
even more fine-grained approach, particularly with regard
to angular deviation at the local level, to examine further
potential differences in drawing skills. More subtle dif-
ferences between groups may also be observable at a
graphomotor level of explanation. For example, greater
error in the Skewed condition not only relates to the
reduction of grouping cues but also to the presence of
oblique lines, which were not present in the Grouped
condition. Oblique lines are more difficult to plan or exe-
cute than horizontal and vertical lines (Broderick and
Laszlo 1987, 1988), although it is interesting that there did
not seem to be any observable differences between autistic
J Autism Dev Disord (2016) 46:3481–3492 3489
123
and typical groups in the representation of oblique orien-
tations (c.f. Smith and Gilchrist 2005b)
Taken together, these findings in the visuomotor domain
suggest that the two main accounts of visuospatial pro-
cessing in autism (WCC and EPF) may not sufficiently
capture drawing behaviour. It might therefore be useful for
developmental psychologists to reconceptualise their
approach to hierarchical perception and incorporate exist-
ing models of attention and perception from allied fields of
psychology. For example, Humphreys (1998) draws the
distinction between within-object coding (i.e., parallel
coding of parts within objects) and between-object coding
(i.e., parallel coding of multiple separate objects). These
processes are conceptually similar to, respectively, global
and local processing. However, in developmental accounts,
global processing tends to be conceived as a parallel pro-
cess, whereas local encoding is thought to rely on a serial
individuation of separate smaller elements. The account
put forward by Humphreys (1998) states that both pro-
cesses occur in parallel (with global perception not being
reliant upon the local level) and can be separately disrupted
by damage to different brain regions. A recent meta-anal-
ysis of hierarchical visual processing in autism echoes this
viewpoint (Van der Hallen et al. 2015). The authors report
neither superior local visual processing nor a deficit in
global processing in autism, and instead report a difference
in the speed at which autistic people perceive the global
form when there is interference from local details (e.g., in
the Navon task and the CEFT). Our findings suggest that
this distinction extends to the visuomotor domain, and
future work in this area should aim to clarify whether
perceptual differences between groups are reflected in the
motor components of drawing production.
It may therefore be beneficial to take a wider perspective
when constructing theories of visuospatial behaviour in
autism, incorporating findings and theories from similar
explorations in different populations. A recent study by
D’Souza et al. (2016) compared global and local perfor-
mance in participants with autism, Williams Syndrome and
Down Syndrome, across a battery of tasks. They found
both local and global biases in all three populations,
depending on the nature of the task, and argued that a broad
global/local distinction between syndromes is inappropri-
ate. This suggests that it may be useful to consider the
encoding of spatial relations within and between objects as
something that is separable from the perception and
detection of local features (see also Farran et al. 2003). By
considering how these processes interact with each other,
we can therefore move towards an account of visuospatial
behaviour that encapsulates the variety of reported find-
ings. It should also ensure that autism research is appro-
priately informed by advances in vision research,
neuropsychology, and cognitive neuroscience, just as those
areas have been fundamentally informed by autism
research.
Acknowledgments We thank Laurie Ledger-Hardy, Victoria Wise
and Kaatje Verlinden for help with testing; Janina Brede and Rebecca
McMillin for help with developing the coding scheme; Danielle
Ropar for useful discussions about the data; Marc Stears for thorough
comments on the manuscript; and all of the children and families who
so generously gave up their time to participate in this project. This
work was funded by the UK’s Experimental Psychology Society.
Research at CRAE is also supported by The Clothworkers’ Founda-
tion and Pears Foundation. AS designed the study, collected data,
coded and analysed data, and drafted the manuscript; LK coded and
analysed data, and contributed to the manuscript; AR coded and
analysed data, and contributed to the manuscript; JB collected data
and contributed to the manuscript; EP designed the study, collected
data, and contributed to the manuscript.
Open Access This article is distributed under the terms of the
Creative Commons Attribution 4.0 International License (http://crea
tivecommons.org/licenses/by/4.0/), which permits unrestricted use,
distribution, and reproduction in any medium, provided you give
appropriate credit to the original author(s) and the source, provide a
link to the Creative Commons license, and indicate if changes were
made.
References
American Psychiatric Association (2000). Diagnostic and statistical
manual of mental disorders (4th edition, text revision; DSM-IV-
TR) Washington, D.C.
Booth, R., Charlton, R., Hughes, C., & Happe, F. (2003). Disentan-
gling weak coherence and executive dysfunction: Planning
drawing in autism and attention–deficit/hyperactivity disorder.
Philosophical Transactions of the Royal Society B: Biological
Sciences, 358, 387–392.
Broderick, P., & Laszlo, J. I. (1987). The drawing of squares and
diamonds: A perceptual-motor task analysis. Journal of Exper-
imental Child Psychology, 43(1), 44–61.
Broderick, P., & Laszlo, J. I. (1988). The effects of varying planning
demands on drawing components of squares and diamonds.
Journal of Experimental Child Psychology, 45(1), 18–27.
Drake, J. E., & Winner, E. (2011). Superior visual analysis and
imagery in an Autistic child with drawing talent. Imagination,
Cognition and Personality, 3, 9–29.
D’Souza, D., Booth, R., Connolly, M., Happe, F., & Karmiloff-Smith,
A. (2016). Rethinking the concepts of ‘local or global proces-
sors’: Evidence from Williams syndrome, Down syndrome, and
Autism Spectrum Disorders. Developmental Science, 19,
452–468.
Dunn, L., Dunn, L., Whetton, C., & Burley, J. (1997). British
Picture Vocabulary Scale II. Windsor, UK: NFER-Nelson.
Eames, K., & Cox, M. V. (1994). Visual realism in the drawings of
autistic, Down’s syndrome and normal children. British Journal
of Developmental Psychology, 12, 235–239.
Farran, E. K., Jarrold, C., & Gathercole, S. E. (2003). Divided
attention, selective attention and drawing: Processing prefer-
ences in Williams syndrome are dependent on the task admin-
istered. Neuropsychologia, 41, 676–687.
Frith, U. (1989). Autism: Explaining the enigma. Oxford: Basil
Blackwell.
Frith, U., & Happe, F. (1994). Autism: Beyond ‘‘theory of mind’’.
Cognition, 50(1), 115–132.
3490 J Autism Dev Disord (2016) 46:3481–3492
123
Guerin, F., Ska, B., & Belleville, S. (1999). Cognitive processing of
drawing abilities. Brain and Cognition, 40, 464–478.
Happe, F., & Frith, U. (2006). The weak coherence account: Detail-
focused cognitive style in autism spectrum disorders. Journal of
Autism and Developmental Disorders, 36(1), 5–25.
Harris, P. L., & Leevers, H. J. (2000). Pretending, imagery and self-
awareness in autism. In S. Baron-Cohen, H. Tager-Flusberg, &
D. J. Cohen (Eds.), Understanding other minds: Perspectives
from autism and developmental cognitive neuroscience (2nd ed.,
pp. 182–202). Oxford: Oxford University Press.
Humphreys, G. W. (1998). Neural representation of objects in space:
A dual coding account. Philosophical Transactions of the Royal
Society B: Biological Sciences, 353(1373), 1341–1351.
Jolliffe, T., & Baron-Cohen, S. (1997). Are people with autism and
Asperger syndrome faster than normal on the Embedded
Figures Test? Journal of Child Psychology and Psychiatry, 38,
527–534.
Jolliffe, T., & Baron-Cohen, S. (2001). A test of Central Coherence
Theory: Can adults with high-functioning autism or Asperger
Syndrome integrate objects in context? Visual Cognition, 8,
67–101.
La Femina, F., Senese, V. P., Grossi, D., & Venuti, P. (2009). A
battery for the assessment of visuo-spatial abilities involved in
drawing tasks. The Clinical Neuropsychologist, 23(4), 691–714.
Leek, E. C., Rapp, B. C., & Turnbull, O. H. (2000). The analysis of
drawing from memory performance in brain-damaged patients.
Brain and Cognition, 43, 310–315.
Lord, C., Rutter, M., DiLavore, P. D., & Risi, S. (1999). Autism
diagnostic observation schedule—Generic. Los Angeles, CA:
Western Psychological Services.
Morgan, M., Phillips, J. G., Bradshaw, J. L., Mattingley, J. B., Iansek,
R., & Bradshaw, J. A. (1994). Age-related motor slowness:
Simply strategic? Journal of Gerontology, 49, M133–M139.
Mottron, L., & Belleville, S. (1995). Perspective production in a
savant autistic draughtsman. Psychological Medicine, 25,
639–648.
Mottron, L., Belleville, S., & Menard, E. (1999). Local bias in autistic
subjects as evidenced by graphic tasks: Perceptual hierarchiza-
tion or working memory deficit? Journal of Child Psychology
and Psychiatry, 40, 743–755.
Mottron, L., & Burack, J. (2001). Enhanced perceptual functioning in
the development of autism. In J. A. Burack, T. Charman, N.
Yirmiya, & P. R. Zelazo (Eds.), The development of autism:
Perspectives from theory and research (pp. 131–148). Mahwah,
NJ: Erlbaum.
Mottron, L., Dawson, M., Soulieres, I., Hubert, B., & Burack, J.
(2006). Enhanced perceptual functioning in autism: An update,
and eight principles of autistic perception. Journal of Autism and
Developmental Disorders, 36(1), 27–43.
Pellicano, E. (2010). The development of core cognitive skills in
autism: A 3-year prospective study. Child Development, 81(5),
1400–1416.
Pellicano, E., Maybery, M., Durkin, K., & Maley, A. (2006). Multiple
cognitive capabilities/deficits in children with an autism spec-
trum disorder: ‘Weak’ central coherence and its relationship to
theory of mind and executive control. Development and
Psychopathology, 18, 77–98.
Pellicano, E., Smith, A. D., Cristino, F., Hood, B. M., Briscoe, J., &
Gilchrist, I. D. (2011). Children with autism are neither
systematic nor optimal foragers. Proceedings of the National
Academy of Sciences, 108(1), 421–426.
Plaisted, K., O’Riordan, M., & Baron-Cohen, S. (1998). Enhanced
discrimination of novel, highly similar stimuli by adults with
autism during a perceptual learning task. Journal of Child
Psychology and Psychiatry, 39, 765–775.
Preissler, M. A., & Bloom, P. (2008). Two-year-olds use artist
intention to understand drawings. Cognition, 106(1), 512–518.
Raven, J. C., Court, J. H., & Raven, J. (1991). Standard progressive
matrices. Oxford: Oxford University Press.
Ronald, A., Happe, F., Bolton, P., Butcher, L. M., Price, T. S.,
Wheelwright, S., et al. (2006). Genetic heterogeneity between
the three components of the autism spectrum: A twin study.
Journal of the American Academy of Child and Adolescent
Psychiatry, 45(6), 691–699.
Ropar, D., & Mitchell, P. (2001). Susceptibility to illusions and
performance on visuospatial tasks in individuals with autism.
Journal of Child Psychology and Psychiatry, 42, 539–549.
Rutter, M., Bailey, A., & Lord, C. (2003). SCQ: Social Communi-
cation Questionnaire. Los Angeles, CA: Western Psychological
Services.
Selfe, L. (1977). Nadia: A case of extraordinary drawing ability in an
autistic child. London: Academic Press.
Shah, A., & Frith, U. (1983). An islet of ability in autistic children: A
research note. Journal of Child Psychology and Psychiatry,
24(4), 613–620.
Shah, A., & Frith, U. (1993). Why do autistic individuals show
superior performance on the block design task? Journal of Child
Psychology and Psychiatry, 34, 1351–1364.
Shallice, T. (1982). Specific impairments in planning. Philosophical
Transactions of the Royal Society of London B, 298, 199–209.
Sheppard, E., Ropar, D., & Mitchell, P. (2007). The impact of
meaning and dimensionality on copying accuracy in individuals
with autism. Journal of Autism and Developmental Disorders,
37, 1913–1924.
Sheppard, E., Ropar, D., & Mitchell, P. (2009a). Autism and
dimensionality: Differences between copying and drawing tasks.
Journal of Autism and Developmental Disorders, 39,
1039–1046.
Sheppard, E., Ropar, D., & Mitchell, P. (2009b). Perceiving the
impossible. How individuals with autism copy paradoxical
figures. Autism, 13, 435–452.
Simmons, D. R., Robertson, A. E., McKay, L. S., Toal, E., McAleer,
P., & Pollick, F. E. (2009). Vision in autism spectrum disorders.
Vision Research, 49(22), 2705–2739.
Smith, A. D. (2009). On the use of drawing tasks in neuropsycho-
logical assessment. Neuropsychology, 23, 231–239.
Smith, A. D., & Gilchrist, I. D. (2005a). Within-object and between-
object coding deficits in drawing production. Cognitive Neu-
ropsychology, 22, 523–537.
Smith, A. D., & Gilchrist, I. D. (2005b). Drawing from childhood
experience: Constructional apraxia and the production of oblique
lines. Cortex, 41(2), 195–204.
Toomela, A. (2002). Drawing as a verbally mediated activity: A study
of relationships between verbal, motor, and visuospatial skills
and drawing in children. International Journal of Behavioral
Development, 26(3), 234–247.
Van der Hallen, R., Evers, K., Brewaeys, K., Van den Noortgate, W.,
& Wagemans, J. (2015). Global processing takes time: A meta-
analysis on local–global visual processing in ASD. Psycholog-
ical Bulletin, 141(3), 549–573.
Van Sommers, P. (1984). Drawing and cognition: Descriptive and
experimental studies of graphic production processes. New
York: Cambridge University Press.
Wang, L., Mottron, L., Peng, D., Berthiaume, C., & Dawson, M.
(2007). Local bias and local-to-global interference without
global deficit: A robust finding in autism under various
conditions of attention, exposure time, and visual angle.
Cognitive Neuropsychology, 24(5), 550–574.
White, S. J., & Saldana, D. (2011). Performance of children with
autism on the Embedded Figures Test: A closer look at a popular
J Autism Dev Disord (2016) 46:3481–3492 3491
123

task. Journal of Autism and Developmental Disorders, 41(11),
1565–1572.
Willats, J. (1977). How children learn to draw realistic pictures. The
Quarterly Journal of Experimental Psychology, 29, 367–382.
Witkin, H. A., Oltman, P. K., Raskin, E., & Karp, S. (1971). A manual
for the embedded figures test. Palo Alto, CA: Consulting
Psychologists Press.
World Health Organization. (1992). The ICD-10 classification of
mental and behavioural disorders: Clinical descriptions and
diagnostic guidelines. Geneva: World Health Organization.
3492 J Autism Dev Disord (2016) 46:3481–3492
123