drakenstein municipality integrated waste management … · 2017-08-15 · this integrated waste...
TRANSCRIPT

DRAKENSTEIN MUNICIPALITY
INTEGRATED WASTE MANAGEMENT PLAN (2nd version)
DECEMBER 2009
Compiled by:
JAN PALM CONSULTING ENGINEERS P O Box 931
BRACKENFELL, 7561
Tel: (021) 982 6570 Fax: (021) 981 0868
E-pos: [email protected]
In association with:
Naude & Associates
-i-
\\Titan\public\Projdata\A021\IWMP\Drakenstein IWMP_Version2_10122009.docx\jm
DRAKENSTEIN MUNICIPALITY
INTEGRATED WASTE MANAGEMENT PLAN
INDEX
1. PREFACE ................................................................................................................................................. 3 1.1 INTRODUCTION ...................................................................................................................................... 3 1.2 GENERAL DESCRIPTION ....................................................................................................................... 3 1.2.1 TOPOGRAPHY AND CLIMATE ............................................................................................................. 3 1.2.2 GEOLOGY AND HYDROGEOLOGY ..................................................................................................... 5 1.2.3 HYDROLOGY ........................................................................................................................................ 5 1.3 DEMOGRAPHICS .................................................................................................................................... 9 1.4 INDUSTRY .............................................................................................................................................. 11 1.5 LAND-USE .............................................................................................................................................. 11 1.6 TRANSPORT INFRASTRUCTURE ........................................................................................................ 11 1.7 BACKGROUND POLICY AND LEGISLATION ...................................................................................... 11 1.7.1 CONSTITUTION OF THE REPUBLIC OF SOUTH AFRICA ............................................................... 11 1.7.2 NATIONAL ENVIRONMENTAL MANAGEMENT ACT ........................................................................ 13 1.7.3 ENVIRONMENT CONSERVATION ACT, 1989 (ACT NO. 73 OF 1989) ............................................ 15 1.7.4 THE DWAF’S MINIMUM REQUIREMENTS (1998) ............................................................................ 15 1.7.5 THE WESTERN CAPE HEALTH CARE WASTE MANAGEMENT ACT, 2007 (ACT 7 OF 2007) ...... 17 1.7.6 NATIONAL WATER ACT (ACT NO. 36 OF 1998) ............................................................................... 18 1.7.7 NATIONAL ENVIRONMENT MANAGEMENT: AIR QUALITY ACT 2004 ( ACT NO. 39 OF 2004) .... 18 1.7.8 MUNICIPAL BY-LAWS ......................................................................................................................... 18 1.7.9 NATIONAL WASTE MANAGEMENT STRATEGY .............................................................................. 19 1.7.10 WHITE PAPER ON EDUCATION AND TRAINING (1995) ................................................................. 19 1.7.11 THE MUNICIPAL SYSTEMS ACT (ACT 32 OF 2000) ........................................................................ 20 1.7.12 THE MUNICIPAL STRUCTURES ACT, 1998 (ACT NO. 117 OF 1998) ............................................. 20 1.7.13 NATIONAL ENVIRONMENTAL MANAGEMENT: WASTE ACT, 2008 ( ACT NO. 59 OF 2008)
(“THE WASTE ACT”) ........................................................................................................................... 20 1.7.14 WHITE PAPER: POLICY ON POLLUTION PREVENTION, WASTE MINIMISATION, IMPACT
MANAGEMENT AND REMEDIATION (MARCH 2000) ....................................................................... 22 1.7.15 PLANNING DOCUMENTS ................................................................................................................... 23 2. EXISTING WASTE MANAGEMENT IN DRAKENSTEIN MUNICIPALITY ........................................... 24 2.1 WASTE QUANTITIES AND TYPES ....................................................................................................... 24 2.1.1 METHODOLOGY FOR GENERAL WASTE SURVEY ........................................................................ 24 2.1.2 VOLUMES OF GENERAL WASTE GENERATED .............................................................................. 24 2.1.3 RECOVERABLE MATERIALS ............................................................................................................. 26 2.1.4 SPECIAL WASTE STREAMS .............................................................................................................. 28 2.1.5 METHODOLOGY FOR HAZARDOUS WASTE SURVEY ................................................................... 29 2.2 WASTE AVOIDANCE ............................................................................................................................. 57 2.2.1 EXISTING WASTE AVOIDANCE IN DRAKENSTEIN ......................................................................... 57 2.3 COLLECTION SYSTEMS ....................................................................................................................... 59 2.3.1 OPERATIONAL DETAIL FOR COLLECTION VEHICLES .................................................................. 59 2.3.2 COLLECTION CALENDER .................................................................................................................. 61 2.3.3 STREET CLEANING AND CLEAN GREEN ........................................................................................ 62 2.3.4 STREET SWEEPING ........................................................................................................................... 63

-ii-
\\Titan\public\Projdata\A021\IWMP\Drakenstein IWMP_Version2_10122009.docx\jm
2.4 WASTE REDUCTION ............................................................................................................................. 73 2.4.1 RECYCLING ........................................................................................................................................ 73 2.4.2 COMPOSTING ..................................................................................................................................... 74 2.5 WASTE DISPOSAL ................................................................................................................................ 76 2.5.1 OPERATING LANDFILLS .................................................................................................................... 76 2.5.2 CLOSED LANDFILLS .......................................................................................................................... 77 2.5.3 BUILDER’S RUBBLE SITES ................................................................................................................ 77 2.5.4 WASTE TRANSFER STATIONS ......................................................................................................... 77 2.5.5 PUBLIC DROP-OFF FACILITIES ........................................................................................................ 78 2.5.6 DISPOSAL FACILITIES USED OUTSIDE THE DRAKENSTEIN BOUNDARIES ............................... 78 2.6 CURRENT WASTE MANAGEMENT CHALLENGES ............................................................................ 79 2.7 WASTE MANAGEMENT STRATEGIC OBJECTIVES ........................................................................... 80 2.7.1 STRATEGIC OBJECTIVES ................................................................................................................. 81 2.8 ROLE OF DRAKENSTEIN MUNICIPALITY ........................................................................................... 81 3. DRAKENSTEIN MUNICIPALITY’S IMLEMENTATION INSTRUMENTS ............................................. 82 3.1 IMPLEMENTATION INSTRUMENTS FOR WASTE AVOIDANCE ........................................................ 82 3.2 IMPLEMENTATION INSTRUMENTS FOR WASTE REDUCTION ........................................................ 85 3.3 IMPLEMENTATION INSTRUMENTS FOR WASTE DISPOSAL ........................................................... 86 3.4 IMPLEMENTATION INSTRUMENTS FOR WASTE MANAGEMENT IN GENERAL ............................ 87 4. DRAKENSTEIN MUNICIPALITY’S IMLEMENTATION SCHEDULE .................................................... 89 5. CONCLUSIONS AND RECOMMENDATIONS ...................................................................................... 90 5.1 CONCLUSIONS ...................................................................................................................................... 90 5.2 RECOMMENDATIONS........................................................................................................................... 91

-3-
\\Titan\public\Projdata\A021\IWMP\Drakenstein IWMP_Version2_10122009.docx\jm
DRAKENSTEIN MUNICIPALITY
INTEGRATED WASTE MANAGEMENT PLAN
1. PREFACE
1.1 INTRODUCTION This Integrated Waste Management Plan has been formulated on behalf of Drakenstein Municipality, to address the challenge of waste management in Drakenstein, home to some 194 419 people. The Plan is born out of the requirements of the National Waste Management Strategy and forms the first action plan in terms of this strategy. The Plan takes particular note of importance of local authority waste management planning. This document underlines the following principles of the National Waste Management Strategy: • The prevention of waste generation; • The recovery of waste of which the generation can not be prevented, and • The safe disposal of waste that can not be recovered The Plan will address all areas of waste management – from waste prevention and Minimisation (Waste avoidance), to its collection, treatment, recovery and final disposal. It will not only address the practicalities of waste management, but also the issues of public education and changing concepts, as these are vital to a successful management system. The cost of and data of waste management will also be explored. The Plan is guided by national and provincial legislation and new municipal by-laws will be drafted to enforce the recommendations of the Plan.
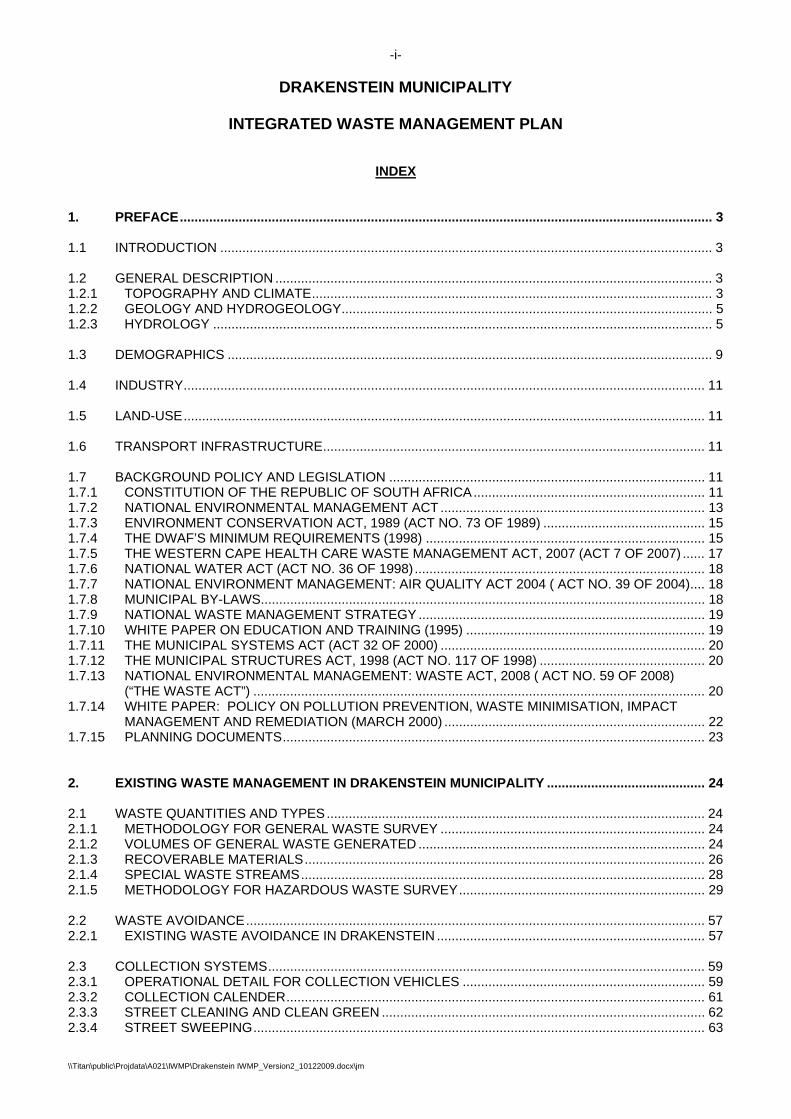
1.2 GENERAL DESCRIPTION Drakenstein Municipality is the eastern- north-eastern neighbour of the City of Cape Town, comprising approximately 47,8 km2. It is an area noted for its vineyards, wheat farms, mountains and the second largest granite outcrop in the world. The name Drakenstein came from the name of the great estate in Holland belonging to the Lords of Mydrecht. Originally wagon building was the major trade of the area since this was the last stop-over before the mountains were crossed into the African interior. The area is also well known for its Afrikaans language monument which reflects the important role the people of Paarl played in the development of the Afrikaans language. Today the Drakenstein area host many industries, but wine related industries still appear to be the main stream. Due to the colourful history of this area, tourism is a fast growing industry in Drakenstein. The Drakenstein Municipality was established in December 2000 through the amalgamation of the former municipalities and towns of Paarl, Wellington, Hermon Gouda and Saron. Refer to Figure 1.1 for a Plan of the Study Area.
1.2.1 Topography and Climate The main feature of the Drakenstein landscape is the long mountain range that forms its eastern boundary and the Berg River that runs northwards parallel to this mountain range. Paarl Mountain with its magnificent granite outcrop is also one of the unique features of this area. The remainder of the municipal area are relatively flat and slopes towards the Berg River.
-4-
\\Titan\public\Projdata\A021\IWMP\Drakenstein IWMP_Version2_10122009.docx\jm

-5-
\\Titan\public\Projdata\A021\IWMP\Drakenstein IWMP_Version2_10122009.docx\jm
The area has a Mediterranean type climate and is known for its hot summer days. Average annual rainfall is approximately 700 mm, with the southern portion receiving more than the northern portion. The evaporation is high, approximately 1900 mm per annum, which is more than double the rainfall.
1.2.2 Geology and Hydrogeology
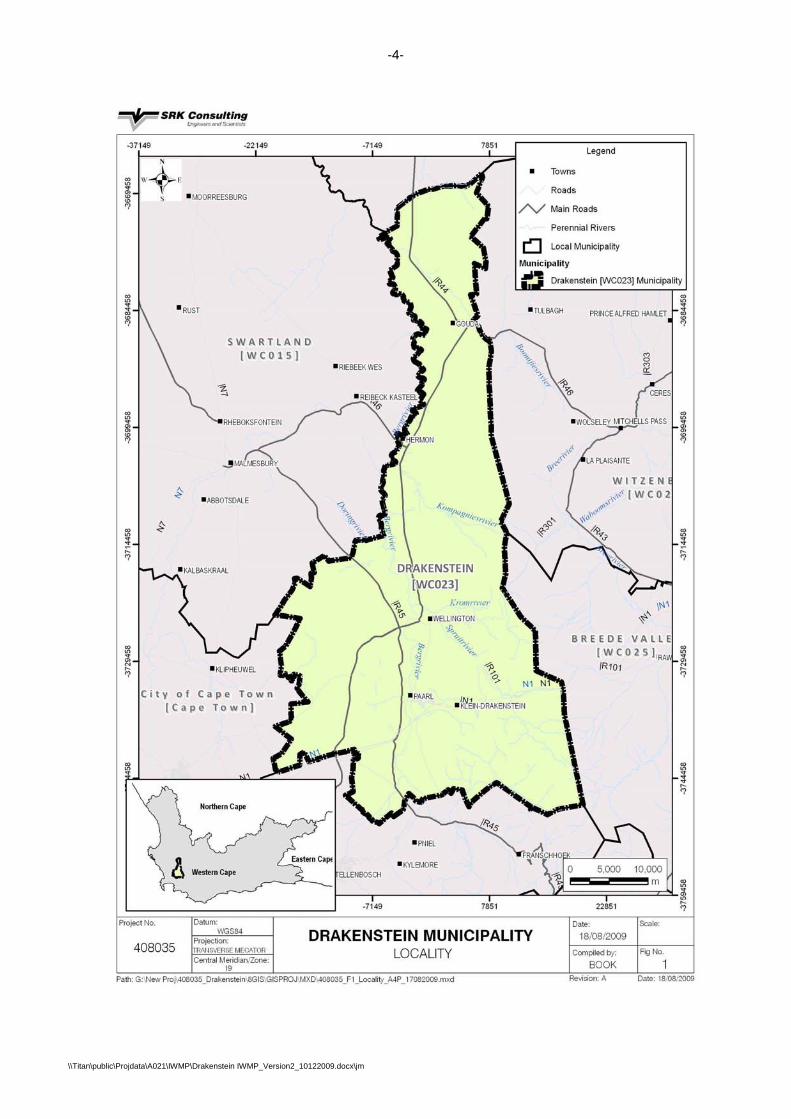
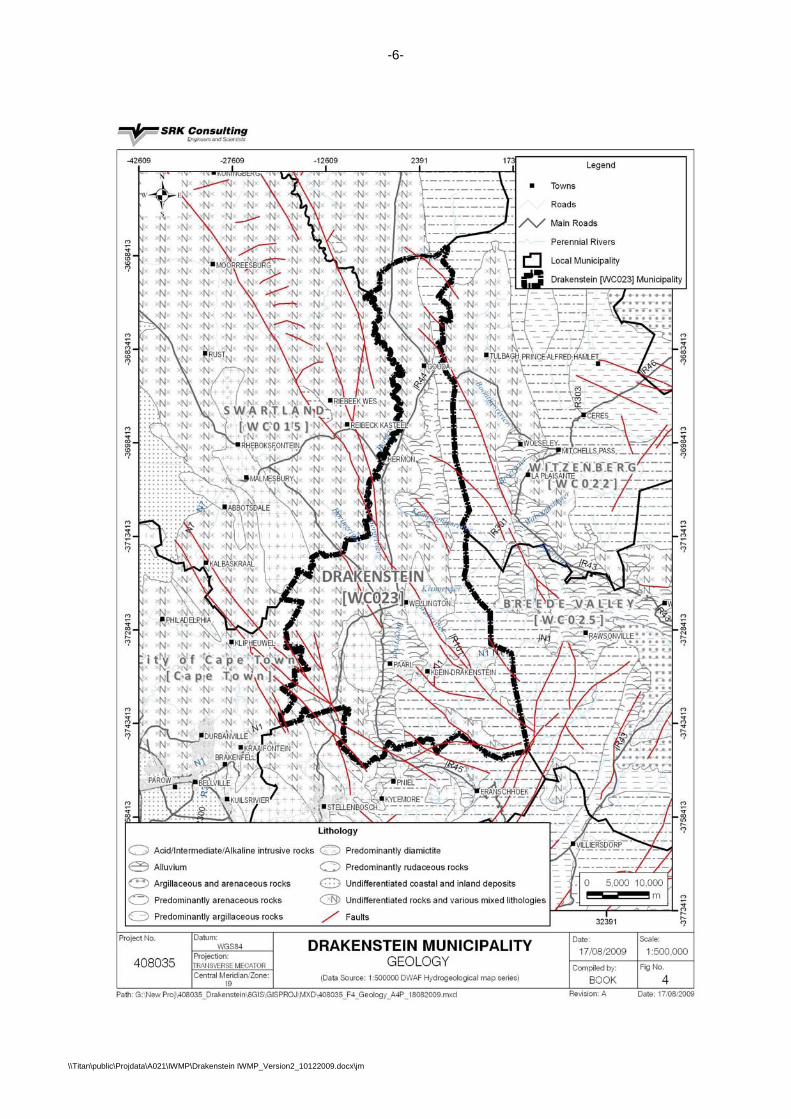
The Drakenstein Municipal area is underlain by rocks of three geological formations. From oldest to youngest these are the Malmesbury Group, Cape Granite Suite and Table Mountain Group. Recent deposits of river alluvium and scree cover these rocks in places to varying thicknesses. The low-lying areas are underlain by rocks of the Malmesbury Group. These are very old rocks, >600 million years, which have been compacted over this long time period into mostly impermeable rocks such as phyllites and slates. Clayey soils are developed on these rocks. Granite intrusives were emplaced into the Malmesbury rocks about 600 million years ago. These rocks form Paarl Mountain and also underly the high-lying area to the east of Wellington. Sandy soils are developed on these rocks. Resistant quartzitic sandstones of the Table Mountain Group (TMG) form the bounding mountains to the east of Wellington and Saron. These form the spine of the western limb of the Cape Fold Belt. The two main components of the TMG are the Peninsula Formation (~1500 m thick) and the Nardouw Subgroup (~500 m thick). These are separated by the Pakhuis and Cedarberg Formations, which are mainly shaley in nature. The resistant sandstones form the rugged grey mountain crags typical of the Western Cape scenery. Very thin sandy soils are developed in the mountainous areas, with boulder scree developed on the western facing slopes between Wellington and Voёlvlei Dam. Sandy and boulder alluvium is developed in the floodplain of the Berg River along the central parts of the area. In terms of groundwater, the main aquifer formation in the area is the TMG Aquifer. However, this aquifer is mostly inaccessible by direct drilling from the Wellington-Saron side of the mountains. This formation is being targeted by Cape Town Municipality for the development of additional water supply to Cape Town. Borehole yields of >10 ℓ/s are common in this aquifer. However, target yields for production boreholes in the Cape Town study are 100 ℓ/s! The groundwater has a very low salinity with Total Dissolved Solids commonly being <100 mg/ℓ/s. However, the pH is also very low and the water is thus corrosive to metal pipes and fittings. High dissolved iron is also a common problem, causing aesthetic problems of taste, staining and clogging. Groundwater potential and quality in the Malmesbury Group is very variable. Close to the contact with the TMG Aquifer, in fault zones and sandstone horizons, yields can be relatively high and groundwater quality moderate to good. However, away from such zones and in the lower rainfall areas of the central-northern areas, yields and quality are poor, generally <1 ℓ/s and >2000 mg/ℓ/s. Groundwater potential associated with the granites is moderate to poor in terms of yield and moderate in terms of quality. Target areas are the contact zone with the Malmesbury Group and zones of deep weathering and/or fracturing. Shallow groundwater is associated with the alluvial deposits but these are mostly of limited extent and thickness. There are no significant wellfields developed within the area. Existing groundwater use is mainly for farm domestic and stockwatering use.
1.2.3 Hydrology The Berg River is the only significant river that flows through the Drakenstein area and is listed as a sensitive river by the Department of Water Affairs and Forestry, which means that the water quality is critical. Two major storage dams for potable water to the Cape Peninsula are located within the boundaries of the Drakenstein Municipality. The northern portion of Drakenstein, between Hermon and Gouda, hosts the Voёlvlei Dam and the southern portion, towards Franschhoek, hosts the Wemmershoek Dam.
-6-
\\Titan\public\Projdata\A021\IWMP\Drakenstein IWMP_Version2_10122009.docx\jm

-7-
\\Titan\public\Projdata\A021\IWMP\Drakenstein IWMP_Version2_10122009.docx\jm
-8-
\\Titan\public\Projdata\A021\IWMP\Drakenstein IWMP_Version2_10122009.docx\jm

-9-
\\Titan\public\Projdata\A021\IWMP\Drakenstein IWMP_Version2_10122009.docx\jm
These three water bodies result in virtually the whole of Drakenstein being located in a sensitive catchment area and as such increases the importance of proper waste management within Drakenstein.
1.3 DEMOGRAPHICS The statistics relating to population were taken from Statistics SA’s 2001 Census figures. The total population of Drakenstein Municipality, according to the 2001 Census, was 194,423. The figures have been adjusted with the expected average growth rate of 1.8% (taken from the Spatial Development Framework of the District) to indicate the current and future population figures. These figures are displayed in Table 1.1.
Table 1-1: Population of Drakenstein Municipality per Voting Ward Area 2001 2009 2010 2015 2020 2025 2030
Ward 1 – Rural West 5,695 6,569 6,687 7,311 7,993 8,739 9,554 Ward 2 - Wellington 4,563 5,263 5,358 5,858 6,404 7,002 7,655 Ward 3 - Agter Paarl 7,704 8,886 9,046 9,890 10,812 11,821 12,924 Ward 4 - Paarl 5,790 6,678 6,798 7,433 8,126 8,884 9,713 Ward 5 - Mbekweni 3,698 4,265 4,342 4,747 5,190 5,674 6,204 Ward 6 - Mbekweni 6,086 7,020 7,146 7,813 8,542 9,339 10,210 Ward 7 - Mbekweni 6,339 7,311 7,443 8,137 8,897 9,727 10,634 Ward 8 - Mbekweni 7,829 9,030 9,193 10,050 10,988 12,013 13,134 Ward 9 - Mbekweni 4,499 5,189 5,283 5,775 6,314 6,903 7,547 Ward 10 - Hillcrest 6,593 7,604 7,741 8,464 9,253 10,116 11,060 Ward 11 - Newton 6,565 7,572 7,708 8,428 9,214 10,074 11,013 Ward 12 - Mbekweni 8,399 9,687 9,862 10,782 11,788 12,888 14,090 Ward 13 - Paarl 2,625 3,028 3,082 3,370 3,684 4,028 4,404 Ward 14 - Paarl 7,409 8,546 8,699 9,511 10,398 11,369 12,429 Ward 15 - Paarl 5,702 6,577 6,695 7,320 8,003 8,749 9,566 Ward 16 - Paarl 8,524 9,832 10,009 10,942 11,963 13,079 14,300 Ward 17 - Paarl 5,171 5,964 6,072 6,638 7,257 7,935 8,675 Ward 18 - Rural North 7,121 8,213 8,361 9,141 9,994 10,927 11,946 Ward 19 - Paarl 4,163 4,802 4,888 5,344 5,843 6,388 6,984 Ward 20 - Paarl 4,518 5,211 5,305 5,800 6,341 6,933 7,579 Ward 21 - Paarl 8,119 9,365 9,533 10,422 11,395 12,458 13,620 Ward 22 - Paarl 8,213 9,473 9,643 10,543 11,527 12,602 13,778 Ward 23 - Paarl 5,375 6,200 6,311 6,900 7,544 8,248 9,017 Ward 24 - Paarl 5,027 5,798 5,903 6,453 7,055 7,714 8,433 Ward 25 - Paarl 9,290 10,715 10,908 11,926 13,038 14,255 15,585 Ward 26 - Paarl 5,654 6,521 6,639 7,258 7,935 8,676 9,485 Ward 27 - Paarl 3,087 3,561 3,625 3,963 4,333 4,737 5,179 Ward 28 - Rural South 8,122 9,368 9,537 10,426 11,399 12,463 13,625 Ward 29 - Rural East 5,158 5,949 6,056 6,621 7,239 7,915 8,653 Ward 30 - Saron 7,315 8,437 8,589 9,390 10,266 11,224 12,272 Ward 31 - Rural North 10,070 11,615 11,824 12,927 14,133 15,452 16,893 Total 194,423 224,249 228,285 249,584 272,870 298,328 326,162
Due to the fact that Drakenstein Municipality is made up of two large towns, Paarl and Wellington, and a large rural area inclusive of villages such as Saron, Gouda, Hermon and Simondium and other hamlets such as Slot-van-die-Paarl in Agter Paarl, it is important to consider the population distribution across these towns as this is an indication where the waste will be generated. Table 1-1 shows that approximately 78% of the population of Drakenstein resides in Paarl and Wellington. The socio-economic profile of the population in 2001, according to annual household income, is displayed in Table 1-2.

\\
\Titan\public\Projdata
AreaWard 1 – RuraWard 2 - WelliWard 3 - AgteWard 4 - PaarWard 5 - MbekWard 6 - MbekWard 7 - MbekWard 8 - MbekWard 9 - MbekWard 10 - HillcWard 11 - NewWard 12 - MbeWard 13 - PaaWard 14 - PaaWard 15 - PaaWard 16 - PaaWard 17 - PaaWard 18 - RurWard 19 - PaaWard 20 - PaaWard 21 - PaaWard 22 - PaaWard 23 - PaaWard 24 - PaaWard 25 - PaaWard 26 - PaaWard 27 - PaaWard 28 - RurWard 29 - RurWard 30 - Saro
Ward 31 - Rur
Total
a\A021\IWMP\Draken
Table 1-2: S
a Hal West ington r Paarl l kweni kweni kweni kweni kweni crest
wton ekweni arl arl arl arl arl ral North arl arl arl arl arl arl arl arl arl ral South ral East on
ral North
M
nstein IWMP_Versio
Socio-Econ
No of Households
1,362 1,769 1,625 1,875 844
1,651 1,291 2,030 976
1,271 1,375 1,724 718
1,695 1,786 2,062 1,355 1,912 1,468 827
1,654 1,939 1,299 1,021 1,784 1,194 626
1,397 1,398 2,017
2,165
46,110
Figure
Middle Income16.9%
HigHigh
1
n2_10122009.docx\j
omic Profile
Population 5,695 4,563 7,704 5,790 3,698 6,086 6,339 7,829 4,499 6,593 6,565 8,399 2,625 7,409 5,702 8,524 5,171 7,121 4,163 4,518 8,119 8,213 5,375 5,027 9,290 5,654 3,087 8,122 5,158 7,315
10,070
194,423
1-1: Socio-E
e
gh ‐ Very h Income18.9%
-10-
m
e of Voting WPersons
per Household
4.2 2.6 4.7 3.1 4.4 3.7 4.9 3.9 4.6 5.2 4.8 4.9 3.7 4.4 3.2 4.1 3.8 3.7 2.8 5.5 4.9 4.2 4.1 4.9 5.2 4.7 4.9 5.8 3.7 3.6
4.7
4.2
Economic D
Wards in 20Very Low anLow IncomR0 - R3840
69.2% 40.4% 75.6% 29.6% 92.4% 95.5% 55.2% 90.4% 87.4% 62.7% 50.5% 90.8% 92.6% 76.5% 29.7% 79.4% 37.6% 62.6% 33.3% 66.3% 76.1% 34.9% 29.6% 66.2% 69.2% 55.9% 70.4% 61.8% 50.3% 87.9%
82.3%
64.2%
Distribution o
001 nd
me Middle00 R38401
171414187.3.
327.9.
26306.6.
161815171724201825232118272121167.
10
16
of Populatio
e Income H
- R76800 7.8% 4.1% 4.3% 8.7% .3% .8%
2.1% .0% .2%
6.6% 0.0% .7% .4%
6.9% 8.9% 5.2% 7.3% 7.3% 4.6% 0.3% 8.9% 5.2% 3.5%
.2% 8.5% 7.1%
.9%
.7% 6.7% .4%
0.4%
6.9%
on (2001)
Very Low & Low Income
64.2%
High and Very Income
R76801 or mo13.0% 45.5% 10.2% 51.7% 0.2% 0.7%
12.8% 2.5% 3.4%
10.7% 19.5% 2.6% 1.0% 6.6%
51.5% 5.4%
45.0% 20.1% 42.1% 13.4% 5.0%
40.0% 47.0% 12.6% 12.3% 17.0% 7.7%
16.5% 33.0% 4.7%
7.3%
18.9%
e
High
ore

-11-
\\Titan\public\Projdata\A021\IWMP\Drakenstein IWMP_Version2_10122009.docx\jm
1.4 INDUSTRY The largest employer in the industrial sector is agriculture with an employment of 23.8%, followed by the manufacturing industry with 21.1% and the social services industry with 16.0% of the employed population. With the persons aged fifteen and younger at approximately 30% of the total population, the unemployment figure for Drakenstein could be calculated at approximately 50% of the economical active population (persons aged fifteen and older) or 35% of the total population.
1.5 LAND-USE The greatest use made of the land in Drakenstein is by agriculture. The remainder of the area is used either for residential housing or industry.
1.6 TRANSPORT INFRASTRUCTURE The road network of Drakenstein can best be described as rural. The major road is the north-south R44 which links all the towns within the Drakenstein Municipal boundaries. Railway lines only connect the towns of Paarl, Wellington, Hermon and Gouda. Saron is not served by rail.
1.7 BACKGROUND POLICY AND LEGISLATION The fragmented and uncoordinated way pollution and waste has been dealt with, as well as insufficient resources to implement and monitor existing legislation, contributes largely to the unacceptably high levels of pollution and waste in South Africa. Through the promulgation and implementation of various pieces of policies, legislation, standards and guidelines as well as the implementation of co-operative governance as envisaged in the Constitution this situation will be improved. The current fragmentation, duplication and lack of co-ordination will be eliminated. Pollution and waste management is not the exclusive preserve of government. The private sector and civil society have crucial roles to play. The fostering of partnerships between government and the private sector is a prerequisite for sustainable and effective pollution and waste management to take place. Similarly, the spirit of partnerships and co-operative governance between organs of state is equally important due to the crosscutting nature of pollution and waste management.
1.7.1 Constitution of the Republic of South Africa In 1996 the new Constitution created a fundamental right to the environment. This fundamental right to the environment ensures everyone’s right to an environment that is not harmful to their health or well-being. South African law, the environment and all South Africans have a constitutional right to have the environment protected for present and future generations. This means that there must be reasonable legal and other measures to prevent ecological degradation, promote conservation and secure ecologically sustainable development and use of natural resources while promoting justifiable economic and social development. All legislation has to fall within the stipulations of the Constitution. The following sections are of particular relevance where waste is concerned: • Section 24(a)
Provides everyone the right to an environment that is not harmful to a person’s health and well-being.
• Section 24(b)
Provides everyone the right to have the environment protected through reasonable legislative and other measures. The implementation of section 21, 22 and 26 of the Environment Conservation Act, 1989 is such a legislative measure to protect the environment.

-12-
\\Titan\public\Projdata\A021\IWMP\Drakenstein IWMP_Version2_10122009.docx\jm
• Section 25
Provides for property rights. The Constitution makes provision for both property rights and the right to a healthy environment. A situation may arise in extreme cases where there is a conflict due to rejecting an application for a listed activity from taking place. In such cases it will be up to the court to decide whether the interest of the community (right to a healthy environment) weights heavier than the right of the individual.
• Section 32
Provides the right to access to information. The lack of information is one of the major obstacles in environmental impact management. The Bill of Rights enshrines the right of access to information held by the State, or any other person, which is required for the exercise of any right. The section imposes a duty on the State to enact legislation to give effect to the right. The integrated pollution and waste management policy includes provisions concerning access to information insofar as it relates to future integrated pollution and waste management legislation.
• Section 38
Provides locus standii or the ‘right to get involved" to any member of the public. This means that any member of the public has the right to take appropriate action to prevent environmental damage. This may include taking action against the relevant authority for failing to perform its duties in preventing environmental damage or an individual or authority that is in the process of undertaking listed activities in terms of the NEMA EIA Regulations, without the necessary authorisation to undertake such activities.
• Section 41
Provides principles for co-operative governance and intergovernmental relations. The Constitution allocates legislative authority as well as executive and administrative powers to all three levels of government. Schedules 4 and 5 determine the functional areas of government. For example, Schedule 5 allocates to Overstrand Municipality, as a local municipality, the function of “refuse removal, rubbish dumps and solid waste disposal”.
The environment is a cross-sectoral matter and it is therefore important that co-operation between government on all levels is necessary. Furthermore, Chapter 7 of the Constitution of South Africa (Act 108 of 1996) describes the role and responsibilities of Local Government, which include the objectives in Section 152: “The objects of local government are: • to promote social and economic development. • to promote a safe and healthy environment...”. These principles are further developed in the National Environmental Management Act 1998 (Act 107 of 1998). The Constitution (Act No. 108 of 1996) is relevant to pollution and waste management for two reasons. Firstly, the Bill of Rights (Chapter Two of the Constitution) contains a number of rights relevant to integrated pollution and waste management, to the extent that an Act or particular statutory provision that does not uphold these rights, is unconstitutional. Secondly, the Constitution provides the legal basis for allocating powers to different spheres of government, and is thus relevant to the institutional regulation of integrated pollution and waste management. Sovereign The Constitution states that South Africa is a sovereign, democratic State. In terms of environmental management, it is important to recognize that sovereignty includes the ability to limit sovereign powers by entering into international agreements where the need arises.

-13-
\\Titan\public\Projdata\A021\IWMP\Drakenstein IWMP_Version2_10122009.docx\jm
The Bill of Rights The most pertinent fundamental right in the context of integrated pollution and Waste Management is the Environmental Right (Section 24), which provides that: “Everyone has the right (a) to an environment that is not harmful to their health or well-being; and (b) to have the environment protected, for the benefit of present and future generation
through reasonable legislative and other measures that –
(i) prevent pollution and ecological degradation; (ii) promote conservation; and (iii) secure ecologically sustainable development and the use of natural resources while
promoting sustainable economic and social development. ” This section of the Bill of Rights specifically imposes a duty on the State to promulgate legislation and take other steps to ensure that the right is upheld and that, among other things, pollution and ecological degradation are prevented.
1.7.2 National Environmental Management Act The NEMA provides for co-operative environmental governance by establishing principles for decision making on matters affecting the environment, institutions that will promote co-operative governance and procedures for co-ordinating environmental functions exercised by organs of state; and to provide for matters connected therewith. As the principal framework act for environmental issues, it has direct relevance to the implementation of the National Waste Management Strategy (NWMS), one of the key implications being the designation of the DEAT as lead agent for the environment. Chapter 7 of NEMA has important direct implications for the achievement of the NWMS initiative. The environment as defined in NEMA is the natural environment along with its physical chemical, aesthetic and cultural properties that influence human health and well-being. NEMA contains the following environmental principles: • Environmental management must put people and their needs at the forefront, and must serve
their interest fairly. • Development must be socially, environmentally and economically sustainable. This means that
the following things must be considered before there is development:
a) Disturbance of ecosystems and loss of biodiversity b) Pollution and degradation of the environment c) Disturbance of landscapes and sites where the nation’s cultural heritage is found d) Non-renewable resources must be used responsibly e) The precautionary principle must be applied f) Negative impacts must be anticipated and prevented and if they can’t be prevented they must
be minimized or remedied. • Environmental management must be integrated. The best practical environmental option must
be pursued. • Environmental justice must be pursued so that there is not unfair discrimination in the way that
negative environmental impacts are distributed • There should be equitable access to environmental resources, benefits and services to meet
basic human needs. Special measures may be taken to ensure access for persons disadvantaged by unfair discrimination.
• Responsibility for environmental health and safety of any policy, programme or project must continue throughout the life cycle of a project
• Public participation in environmental decision-making must be promoted. The participation of vulnerable and disadvantaged groups must be ensured

-14-
\\Titan\public\Projdata\A021\IWMP\Drakenstein IWMP_Version2_10122009.docx\jm
• Decisions must take into account the interests, needs and values of all interested and affected parties. This includes recognizing all forms of knowledge including traditional and ordinary knowledge
• Community well being and empowerment must be promoted through environmental education • The social, economic and environmental impacts of the activities must be assessed • The rights of workers to refuse to do work that is harmful to human health or the environment
and to be informed of dangers must be respected • Decisions must be taken in an open and transparent manner and access to information provided
in accordance with the law • There must be inter government co-ordination and harmonization of policies and laws • Actual or potential conflicts of interest between organs of state must be resolved through conflict
resolution procedures • Global and international responsibilities relating to the environment must be discharged in the
national interest • The environment is held in a public trust for the people and the use of environmental resources
must serve the public interest, and be protected as the people’s common heritage • The polluter must pay for the costs of remedying pollution, environmental degradation and
adverse health impacts • The vital role of youth and women in environmental management must be recognized and their
full participation promoted • Sensitive or stressed ecosystems must receive special attention in planning which might affect
them especially when they are subject to significant resource usage and development pressure. NEMA also stipulates in Section 24 that there must be an environmental impact assessment before any activity or development that needs permission by law and which may significantly affect the environment. Section 28 places a specific duty of care on every person to prevent, or mitigate and remediate, environmental damage and pollution. Any person, who was responsible for, or directly or indirectly contributed to the pollution, can be held liable. This includes the owner of the land at the time the pollution occurred or their successor in title, a person in control of the land at that time, or any person who negligently failed to prevent the situation. The public can use NEMA to exercise their rights when they believe that the right procedures were not followed. Therefore it is extremely important to make sure that when there is a proposed development where the municipality is involved e.g. change of land-use – to make sure that the consultant and/or developers follow the right procedures. The NEMA Environmental Impact Assessment Regulations Sections 24 and 44 of NEMA make provision for the promulgation of regulations that identify activities that may not commence without environmental authorisation or existing activities in respect of which an application for environmental authorisation is required. In this context, EIA Regulations contained in three General Notices in terms of NEMA (GN R385, 386 and 387) (came into force on 3 July 2006.) GN R 385 lays out two alternative authorisation processes. Depending on the type of activity that is proposed, either a Basic Assessment process or a Scoping and EIA. The regulations for both alternative processes stipulate that: • Public participation must be undertaken at various stages of the assessment process; • The assessment must be conducted by an independent Environmental Assessment Practitioner; • The relevant authorities respond to the applications and submissions within stipulated time
frames; and • Decisions taken by the authorities can be appealed by the proponent or any other interested and
affected party. GN R 385 also makes provision for appeal against any decision issued by the competent authority. In terms of the Regulations, a notice of intention to appeal has to be lodged with the competent authority in writing within ten days of the notification of the issue of the Record of Decision. The appeal must be lodged within 30 days of the submission of the notice of intention to appeal.

-15-
\\Titan\public\Projdata\A021\IWMP\Drakenstein IWMP_Version2_10122009.docx\jm
On 3 July 2009 amendments to the list of activities, which many not commence without environmental authorisation as identified in terms of the National Environmental Management Act, 1998 (Act No. 107 of 1998)(NEMA) were published. The following activities were omitted from Government Notice No. R 386:
▪ 1(o), 1(p), 1(s), 23(d), 23(e), 23(f) and 23 (g); and
▪ if the facility for the process or activity is included in the list of waste management activities published in terms of the Waste Act, then 24(c) and 25 are also excluded.
The following activities were omitted from Government Notice No. R 387:
▪ 1(f), 1(g), 1(o), 1(p), 1(q), and 1(r), and if the process or activity is included in the list of waste management activities published in terms of the Waste Act, then 1(e) is also excluded.
1.7.3 Environment Conservation Act, 1989 (Act No. 73 of 1989) On 1 July 2009 the National Environmental Management: Waste Act, 2008 (Act No. 59 of 2008) (“the Waste Act”) came into effect. The Waste Act repealed Section 20 of the Environment Conservation Act, 1989 (Act No. 73 of 1989) (“ECA”) and introduces new provisions regarding the licensing of waste management activities. The Environment Conservation Act, 1989 Waste Tyre Regulations (2009) which were published on 13 February 2009 came into effect on 30 June 2009, and makes provision for effective and integrated management of waste tyres in the country. It provides regulations for tyre producers, tyre dealers and waste tyre stockpile owners. The regulations furthermore require the compilation of industry waste tyre management plans and waste tyre stockpile abatement plans and details the requirements for waste tyre storage areas.
1.7.4 The DWAF’s Minimum Requirements (1998)
DWAF has compiled a set of guidelines called “The Minimum Requirements” of which the second edition was published in 1998. These guidelines are implemented through and enforced by the Landfill Site Permit. Once a Minimum Requirement is included in a Landfill Site Permit, it is legally enforceable.
1.7.4.1 Waste Classification Waste types are graded into two classes, General (G) and Hazardous (H). • General Waste (G) is a generic term applied to all urban waste that is produced within the
domain of local authorities. It comprises rubble, garden, domestic, commercial and general dry industrial waste. It may also contain small quantities of household hazardous waste substances disposed within it e.g. batteries, insecticides, etc.
General waste may be disposed of on any permitted landfill. However, General Waste sites
located in areas with a positive climatic water balance must have leachate management systems, since General Waste can produce leachate with unacceptably high pollution potential.
• Hazardous Waste (H) is waste which has the potential, even at low concentrations, to have a
significant adverse effect on public health and/or the environment. The following types of waste should be regarded as potentially hazardous, namely:
Hazardous Waste is further classified in terms of Hazard Ratings, based on Acute Mammalian Toxicity, Ecotoxicity, Environmental bioaccumulation in the food chain and Chronic Toxicity. Hazardous Waste is thus classified into:
Hazard Rating 1: Extreme Hazard Hazard Rating 2: High Hazard Hazard Rating 3: Moderate Hazard Hazard Rating 4: Low Hazard

-16-
\\Titan\public\Projdata\A021\IWMP\Drakenstein IWMP_Version2_10122009.docx\jm
1.7.4.1.1 Definition of Hazardous Waste
A Hazardous Waste is defined as: “an inorganic or organic element or compound that, because of its toxicological, physical, chemical or persistency properties, may exercise detrimental acute of chronic impacts on human health and the environment. It can be generated from a wide range of commercial, industrial, agricultural and domestic activities and may take the form of liquid, sludge or solid. These characteristics contribute not only to degree of hazard, but are also of great importance in the ultimate choice of a safe and environmentally acceptable method of disposal.” Further to this, a Hazardous Waste can be defined as a waste that directly or indirectly represents a threat to human health or the environment by introducing one or more of the following risks: • Explosion or fire; • Infections, pathogens, parasites or their vectors; • Chemical instability, reactions or corrosion; • Acute or chronic toxicity; • Cancer, mutations or birth defects; • Toxicity, or damage to the ecosystems or natural resources; • Accumulation in biological food chains, persistence in the environment, or multiple effects to
the extent that it requires special attention and cannot be released into the environment or be added to sewage or be stored in a situation which is either open to air or from which aqueous Leachate could emanate.
The definition of Hazardous Waste is very broad, since wastes can vary substantially in nature, composition, size, volume, appearance and degree of harmfulness. In terms of the Minimum Requirements, therefore, Hazardous Wastes are grouped into four Hazard Ratings This further classification, termed the Hazard Rating, differentiates between a Hazardous Waste that is fairly or moderately hazardous and one that is very or extremely hazardous. The Hazard Rating also indicates the class of Hazardous Waste landfill at which the waste may be disposed. Hazard Rating 1 (extreme risk) Hazard Rating 2 (high risk) = H:H Landfill Hazard Rating 3 (moderate risk) Hazard Rating 4 (low risk) = H:H or H:h Landfill An H:H landfill is more stringently designed, operated and monitored than an H:h landfill.
1.7.4.1.2 Classification of Hazardous Waste There are four steps in the classification of a Hazardous Waste • Identification of the waste or waste stream as probably Hazardous. • Testing and analysis to determine the hazardous properties, characteristics and components of
a waste. This will confirm whether the waste is Hazardous or not. • Classification and treatment in accordance with SANS Code 0228 “The Identification and
Classification of Dangerous Substances and Goods”. • Analysis and Hazard Rating of the waste or its residue, in order to determine the Hazard Rating
and the Minimum Requirements for disposal. An additional step would be re-examination of an existing classification with the objective of possible delisting and reclassification. This would apply in cases where, because of pre-treatment, low concentration, low mobility or other applicable factors, waste can delist to a lower Hazard Rating.

-17-
\\Titan\public\Projdata\A021\IWMP\Drakenstein IWMP_Version2_10122009.docx\jm
1.7.4.1.3 Analysis to confirm that a waste is a Hazardous Waste If it is probable that the waste is a Hazardous Waste, it must be tested for its properties and analysed for its substances. These are then compared to the lists of characteristics, properties and substances in SANS Code 0228, the Basal Convention, and the Waste Classification Tables in the Minimum Requirements. If the properties and substances of the waste are not listed in SANS Code 0228, but conform to the Basel Convention or one of the nine classes in the Code, the waste is probably a Hazardous Waste. The Department should then be approached for guidance.
1.7.4.1.4 SANS Code 0228 SANS Code 0228: “The Identification and Classification of Dangerous Goods and Substances” is a system for classifying hazardous substances for transport purposes. In the Code, hazardous substances are given an identification number and divided into nine classes: Class 1 Explosives Class 2 Gases Class 3 Flammable liquids Class 4 Flammable solids Class 5 Oxidising substances and organic peroxides Class 6 Toxic and infectious substances Class 7 Radioactive substances Class 8 Corrosives Class 9 Other miscellaneous substances. The waste must be tested against the nine classes, to see into which class it falls (it may fall into more than one class). The Minimum Requirements for that class must then be complied with. The Hazardous Waste classification table is derived from SANS Code 0228. The typical generators of Hazardous Waste are divided into typical industrial groups. The groups indicate an industry which is expected to generate the largest quantity of Hazardous Waste material. The key to Industrial Groups used in Appendix 9.2 of the Minimum Requirements is attached as Error! Reference source not found..
1.7.5 The Western Cape Health Care Waste Management Act, 2007 (Act 7 of 2007) In the Western Cape, a Health Care Management Bill was submitted to Parliament. The Health Care Management Bill provides for the effective handling, storage, collection, transportation, treatment and disposal of health care waste by all persons in the Province of the Western Cape; and provides for matters incidental thereto. The object of this Act is to promote integrated health care waste management and thereby— (a) reduce the risks of health care waste to human health; (b) prevent the degradation of the environment; (c) prevent the illegal dumping of health care waste; (d) promote sustainable development, and (e) ensure responsible management of health care waste within the Province. Under this Act a Municipality must: (a) enforce the relevant provisions of this Act within its area of jurisdiction; (b) perform audits of generators, transporters, treaters or disposers of health care waste within its
area of jurisdiction to ensure compliance with the provisions of this Act; (c) report annually to the Provincial Minister on the number of incidents of illegal dumping of health
care risk waste within its area of jurisdiction, the number of incidents of illegal dumping of health care risk waste pursued in a court of law, and the number of incidents of illegal dumping of health care risk waste successfully convicted in a court of law.
Health Care Waste is produced by hospitals, clinics, physicians, offices, dentists, funeral homes, veterinary clinics and medical- and research laboratories.

-18-
\\Titan\public\Projdata\A021\IWMP\Drakenstein IWMP_Version2_10122009.docx\jm
Currently only 10-15% of medical waste is considered infectious. The enormous volumes of health care waste requiring special handling and disposal for all infectious and pathological waste are responsible for the current re-evaluation of the terminology for health care waste. The modern trend in infection control is dictated by the risk posed by the procedure and not by the diagnoses. Thus health care waste is divided into Health Care General Waste (HCGW) and Health Care Risk Waste (HEALTH CARE RISK WASTE). Health Care Risk Waste generally indicates infectious waste, pathological waste, sharps, chemical and pharmaceutical waste, radioactive and cytotoxic waste.
1.7.6 National Water Act (Act no. 36 of 1998)
The purpose of the Act is to ensure that the Municipality’s water resources are protected, used, developed and conserved in ways which take into account the protection of aquatic and associated ecosystems; that addresses basic human needs; that ensures the reduction and prevention of pollution; and that meets international obligations. Section 19 of the NWA deals with landowners and users involved in any activity or process which causes, has caused or is likely to cause pollution of water resources. Such landowners and users are obliged to take all reasonable measures to prevent any such pollution from occurring, continuing or recurring. This includes measures to comply with any prescribed waste standard or management practice. Furthermore, the NWA requires anyone who intends undertaking a water use, as defined, to obtain a licence. The water uses that may be relevant to waste management activities are: • discharging waste or water containing waste into a water resource through a pipe, canal, sewer,
sea outfall or other conduit; and • disposing of waste in a manner which may detrimentally impact on a water resource. The applications for permits, licenses and exemptions made before the promulgation of this Act could still be dealt with in terms of the Water Act 1956 (Act No. 54 of 1956).
1.7.7 National Environment Management: Air Quality Act 2004 ( Act No. 39 of 2004) This Act has been promulgated in order to reform the law regulating air quality in order to protect the environment by providing reasonable measures for the prevention of pollution and ecological degradation and for securing ecologically sustainable development while promoting justifiable economic and social development. It also provides for national norms and standards regulating air quality monitoring, management and control by all spheres of government; for specific air quality measures; and for matters incidental thereto.
The object of this Act is: (a) to protect the environment by providing reasonable measures for-
(i) the protection and enhancement of the quality of air in the Republic; (ii) the prevention of air pollution and ecological degradation; and (iii) securing ecologically sustainable development while promoting justifiable economic and
social development; and
(b) generally to give effect to section 24(b) of the Constitution in order to enhance the quality of ambient air for the sake of securing an environment that is not harmful to the health and well-being of people.
1.7.8 Municipal By-Laws
Municipal By-Laws regulating waste removal only exist in the former municipalities of Paarl (Provincial Notice 624 of 1972) and Wellington (Provincial Notice 394 of 1982). Paarl’s existing By-laws regulated backyard collection in refuse bins and, probably by accident, do not include waste generated at residential dwellings in its definition of “Domestic waste”. The regulation of waste disposal is also outdated as it originates from a pre-Minimum Requirements period.

-19-
\\Titan\public\Projdata\A021\IWMP\Drakenstein IWMP_Version2_10122009.docx\jm
Wellington’s existing By-laws are significantly more comprehensive than that of Paarl and regulates sidewalk collection in bags. The regulation of waste disposal is also outdated. New By-laws will have to be drafted after the completion of this Integrated Waste Management Plan and its subsequent Action Plans.
1.7.9 National Waste Management Strategy The National Waste Management Strategy (1999) presents Government’s strategy for integrated waste management for South Africa. The National Waste Management Strategy presents a long-term plan (up to the year 2010) for addressing key issues, needs and problems experienced with waste management in South Africa. The strategy gives effect to the Bill of Rights, Constitution of South Africa, Act 108 of 1996, on the basis of which the people of South Africa have the right to an environment that is not detrimental to their health. Furthermore, the strategy translates into action Government’s policy on waste as set out in the Draft White Paper on Integrated Pollution and Waste Management for South Africa (published in 1998). The objective of integrated pollution and waste management is to move away from fragmented and uncoordinated waste management to integrated waste management. Such a holistic and integrated management approach extends over the entire waste cycle from cradle to grave, and covers the prevention, generation, collection, transportation, treatment and final disposal of waste. Integrated waste management thus represents a paradigm shift in South Africa’s approach to waste management, by moving away from waste management through impact management and remediation and establishing instead a waste management system which focuses on waste prevention and waste minimisation. The strategy aims to reduce both the generation and the environmental impact of waste. It presents a plan for ensuring that the socio-economic development of South Africa, the health of its people and the quality of its environmental resources are no longer adversely affected by uncontrolled and uncoordinated waste management. It establishes a waste management system that concentrates on avoiding, preventing and minimising waste and makes provision for waste management services for all by extending an acceptable standard of waste collection, as well as transportation, treatment and disposal services to all communities. While the long-term objective of the strategy is waste prevention and minimisation, a number of remediative actions such as improved waste collection and waste treatment are required in the shorter term due to prevailing inadequate waste management practices.
1.7.10 White Paper on Education and Training (1995) The 1995 White Paper on Education and Training states that “environmental education, involving an interdisciplinary, integrated and active approach to learning, must be a vital element of all levels and programmes of the education and training system, in order to create environmentally literate and active citizens and ensure that all South Africans, present and future, enjoy a decent quality of life through the sustainable use of resources”. The White Paper advocates environmental education and training at all levels. This would include the local government sphere, particularly when it comes to the environmental education & training of government officials and workers. The education of the youth is the responsibility of national and provincial government. However, the Constitution does state that where the capacity exists, functions can be delegated to local government, and that the spheres of government, while distinctive, are interdependent and interrelated. Local government should support the other spheres of government (such as the national Department of Education, DoE) in areas of its own focus, such as environmental management and sustainable development.

-20-
\\Titan\public\Projdata\A021\IWMP\Drakenstein IWMP_Version2_10122009.docx\jm
1.7.11 The Municipal Systems Act (Act 32 of 2000)
This policy outlines the role and responsibilities of local governments as to: Provide democratic and accountable government for local communities; Ensure the provision of services to communities in a sustainable manner; Promote social and economic development; Promote a safe and healthy environment; Encourage the involvement of communities and community organisations in the matters of local
government, and Strive, within its financial and administrative capacity, to achieve the objectives above.
These responsibilities indicate a need for an environmentally educated work force (accountable) as well as an environmentally educated public (involvement). The Municipal Systems Act (32 of 2000) requires municipalities to promote public participation and to build the capacity of residents, councillors and municipal officials to engage in participatory processes. As a means of tracking progress in this area, the executive of a municipality is obliged to report annually on the level of public participation in municipal matters. Each Municipality must include in its integrated development plan contemplated in Chapter 5 of the Municipal Systems Act, an integrated waste management plan that is consistent with the relevant provincial integrated waste management plan. The annual performance report which must be prepared in terms of section 46 of the Municipal Systems Act must contain information on the implementation of the municipal integrated waste management plan.
1.7.12 The Municipal Structures Act, 1998 (Act No. 117 of 1998)
This Act makes provision for the establishment of municipalities in accordance with the requirements relating to categories and types of municipality. It establishes criteria for determining the category of municipality to be established in an area and defines the types of municipality that may be established within each category. The Act furthermore provides for an appropriate division of functions and powers between categories of Municipality and regulates the internal systems, structures and office-bearers of the municipalities. It also provides for appropriate electoral systems for matters in connection therewith.
1.7.13 National Environmental Management: Waste Act, 2008 ( Act No. 59 of 2008) (“The Waste Act”)
On 1 July 2009 the National Environmental Management: Waste Act, 2008 (Act No. 59 of 2008) (“the Waste Act”) came into effect. The Waste Act repealed Section 20 of the Environment Conservation Act, 1989 (Act No. 73 of 1989) (“ECA”) and introduces new provisions regarding the licensing of waste management activities. Provision has been made in the form of legislative and regulatory tools to facilitate and ensure implementation of the Act by all spheres of government. The Waste Act was published to reform the law regulating waste management in order to protect the health of the environment by providing reasonable measures for the prevention of pollution and ecological degradation and for securing ecologically sustainable development. The purpose of this Act is to protect health, well-being and the environment by providing reasonable measures for - • the minimisation of the consumption of natural resources; • the avoidance and minimisation of the generation of waste; • the recovery, re-use and recycling of waste; • the treatment and safe disposal of waste as a last resort; • the prevention of pollution and ecological degradation; • securing ecologically sustainable development while promoting justifiable economic and social
development; • promoting and ensuring the effective delivery of waste services; • remediating land where contamination presents, or may present, a significant risk of harm; • achieving integrated waste management reporting and planning; • to ensure that people are aware of the impacts of waste on health and the environment;

-21-
\\Titan\public\Projdata\A021\IWMP\Drakenstein IWMP_Version2_10122009.docx\jm
• to provide for compliance and generally to give effect to section 24 of the Constitution in order to secure an environment that is not harmful to the health and well-being of people.
The interpretation and application of this Act must be guided by the national environmental management principles set out in section 2 of the National Environmental Management Act. The Waste Act allows for the compilation of a Waste Management Strategy, national, provincial and local standards. Municipalities must in terms of their by-laws: • establish service standards and levels of service for the collection of waste; • may identify requirements in respect of the separation, compacting and storage of waste; • may identify requirements for the management of waste, including requirements in respect of the
avoidance of the generation of waste and the recovery, reuse and recycling of waste; • the requirements in respect of the directing of waste to specific treatment and disposal facilities. Each Municipality must include in its integrated development plan contemplated in Chapter 5 of the Municipal Systems Act, an integrated waste management plan that is consistent with the relevant provincial integrated waste management plan. The annual performance report which must be prepared in terms of section 46 of the Municipal Systems Act must contain information on the implementation of the municipal integrated waste management plan. Municipalities must also in terms of the Act: • conduct municipal activities in accordance with the National Waste Management Strategy and any
national or provincial norms and standards; • compile an integrated waste management plan; • ensure that waste management services are provided within the municipality in a manner which
prioritises the recovery, re-use or recycling of waste and provides for the treatment and safe disposal of waste as a last resort;
• designate a waste management officer; • ensure that provision is made for the management and collection of litter; • secure compliance with the objects of this Act that are in the domain of the municipality; and • implement any other measures that are necessary for securing the objects of this Act that are
within the domain of the municipality. Duty to provide collection services - Every municipality has an obligation to progressively ensure that efficient, effective and affordable waste collection services are provided in its area. A municipality may, by notice, require any person making use of the municipal collection service to separate specified types of waste from the general waste for the purposes of recovery, re-use or recycling. In terms of Section 19(1) of the Waste Act, the Minister may publish a list of waste management activities that have, or are likely to have, a detrimental effect on the environment. In terms of Section 20 of the Waste Act no person may commence, undertake or conduct a waste management activity except in accordance with the following:
▪ the requirements or standards determined in terms of Section 19(3) of the Waste Act for that activity; or
▪ a waste management license issued in respect of that activity, if a license is required. On 3 July 2009 a list of waste management activities were published. These activities were published in Government Notice 178 in Government Gazette No. 32368 of 3 July 2009. No person may commence with, undertake or conduct these activities unless a waste management license is issued in respect of the activity. A person who wishes to commence, undertake or conduct an activity listed under Category A must conduct a Basic Assessment process whilst activities listed under Category B requires a Scoping and EIA process to be undertaken.

-22-
\\Titan\public\Projdata\A021\IWMP\Drakenstein IWMP_Version2_10122009.docx\jm
In terms of Section 49(2) of the Waste Act a decision to grant a waste management license in respect of a waste disposal facility is subject to the concurrence of the Minister responsible for Water Affairs. The Waste Act further specifies that the issuing of a waste management license for a waste disposal facility is subject of the inclusion in the license of any conditions contained in a Record of Decision issued by the Minister responsible for Water Affairs regarding any measures that the Minister responsible for Water Affairs considers necessary to protect a water resource as defined in the National Water Act, 1998 (Act No. 36 of 1998).
1.7.14 White Paper: Policy on Pollution Prevention, Waste Minimisation, Impact Management and
Remediation (March 2000) In line with international trends and our national objectives of efficient and effective management of our nation’s resources, priority is given to prevention of waste. Unlike previous policies that focused predominantly on so called “end of pipe” treatment, this White Paper underscores the importance of preventing pollution and waste and avoiding environment degradation. Effective mechanisms to deal with unavoidable waste will remain necessary, but much greater attention must be directed to the introduction of preventative strategies aimed at waste minimisation and pollution prevention. Ever increasing urban and industrial development throughout the world is leading to levels of pollution, which seriously threaten the natural resources upon which humankind depends for its survival. Although South Africa has extensive environment, pollution and waste management legislation, responsibility for its implementation is scattered over a number of departments and institutions. The fragmented and uncoordinated way pollution and waste is currently being dealt with, as well as the insufficient resources to implement and monitor existing legislation, contributes largely to the unacceptably high levels of pollution and waste in South Africa. The White Paper on Integrated Pollution and Waste Management will result in a review of the existing legislation and the preparation of a single piece of legislation dealing with waste and pollution matters. Pollution and waste management is not the exclusive preserve of government. The private sector and civil society have crucial roles to play. The fostering of partnerships between government and the private sector is a prerequisite for sustainable and effective pollution and waste management to take place. Similarly, the spirit of partnerships and co-operative governance between organs of state is equally important due to the crosscutting nature of pollution and waste management. Monitoring and collection of information on pollution and waste generation are crucial for the implementation of pollution and waste reduction measures. Moreover, the sharing of such information and creating awareness about the issues will enable all stakeholders, including communities, to gain a better understanding of the relation between pollution, waste management and the quality of life. The White Paper proposes a number of tools to implement the objectives of the policy it sets out. The most significant of these is a legislative programme that will culminate in new pollution and waste legislation. This proposed legislation, amongst other things, will address current legislative gaps, and clarify and allocate responsibilities within government for pollution and waste management. The policy presents seven strategic goals, which are as follows: Goal 1: Effective Institutional Framework and Legislation Goal 2: Pollution Prevention, Waste Minimisation, Impact Management and Remediation Goal 3: Holistic and Integrated Planning Goal 4: Participation and Partnerships Governance in Integrated Pollution and Waste Management Goal 5: Empowerment and Education in Integrated Pollution and waste Management Goal 6: Information Management Goal 7: International Cooperation The role of Local Government Municipalities will be responsible for providing waste management services, and managing waste disposal facilities. Specific functions to be carried out by municipalities will include: • compiling and implementing general waste management plans, with assistance from provincial
government

-23-
\\Titan\public\Projdata\A021\IWMP\Drakenstein IWMP_Version2_10122009.docx\jm
• implementing public awareness campaigns • collecting data for the Waste Information System • providing general waste collection services and managing waste disposal facilities within their
areas of jurisdiction • implementing and enforcing appropriate waste minimisation and recycling initiatives, such as
promoting the development of voluntary partnerships with industry, including the introduction of waste minimisation clubs where possible, regional planning, establishment and management of landfill sites, especially for regionally based general waste landfills.
1.7.15 Planning Documents
The Provincial Spatial Development Framework (November 2005)
The PSDF states that there is a concern that a number of waste landfill sites are not properly managed. In addition to the challenges of managing increasing waste volumes and decreasing land available for waste disposal, the Western Cape, along with other Provinces, has to deal with waste management problems caused by inequitable development and inadequate service delivery. Waste issues are often closely associated with poverty, environmental health and social justice issues. The following Policies have particular reference: RC32 All municipalities shall follow an integrated hierarchical approach to waste management
consisting of the following, avoidance/reduce, reuse, recycle, composting, treatment and final disposal. The Waste Management System shall consist of a collection service from the source, (domestic, office or factory) transfer stations and waste disposal sites. (M)
RC33 Waste separation at source shall be mandatory in all domestic households and institutions
and businesses including high density and multi-storey buildings from a date to be announced. Initially only organic (vegetable and plant matter) and inorganic (usually dry, cardboard, glass, plastics, paper, builders’ rubble) waste shall be separated. (M)
RC34 Material Recovery Facilities shall be established at all Transfer Stations. (M) RC35 Engage with the raw material and packaging industries and reach agreement to ensure
demand for recycled products. (G) RC36 Every urban settlement should have a Transfer Station within a maximum of 5kms from the
town centre, inside the Urban Edge. These Transfer Stations shall be properly managed according to best practice so as to minimise nuisance to surrounding neighbours. They should also be open after hours and on the weekends and their locations shall be well publicised so as to ensure that the community uses them. Furthermore, charges should not be levied on loads brought to transfer stations. Micro enterprises wanting to process waste and trade second hand materials on site should be encouraged. (G)
RC37 Every municipality shall have a Waste Disposal facility site located and operated according to
DWAF’s minimum requirements that will service the Transfer stations in the urban settlements in that municipality. These sites may or may not be located within the Urban Edge of urban settlements. The main criteria for their location will be to meet satisfactory environmental and transport requirements. (M)
It is the intention of the Western Cape Government to make relevant policies contained in the WCPSDF mandatory in terms of legislation and to include these policies in appropriate legislation. These policies are indicated with a 'M' next to the applicable policy in Chapter 8 of this report. The balance of the policies is indicated with a 'G' to indicate that they are guiding principles. The distinction should be understood as follows: Mandatory (M) measures refer to policies that are regarded as being of sufficient social, economic or environmental importance as to demand that every effort possible should be made to effectively implement that policy. Guidelines (G) refer to policies that are intended as general developmental goals and whose detailed implementation may vary due to place specific conditions and therefore requiring a certain amount of flexibility in their application.

\\
2
2
2
2
2
\Titan\public\Projdata
2. EX
2.1 WA
2.1.1 Me
Forfrom(MS Wetheloadnotcom
2.1.2 Vol
2.1.2.1 Do Usimu
TabH
GeCitywaswou
Thefor and
a\A021\IWMP\Draken
ISTING WAS
ASTE QUAN
thodology f
r the purposem census (reSW), using ty
eighbridges h latter has nds at the lant exist. The mpanies deliv
lumes of Ge
mestic Was
ng the follonicipalities, t ble 2-1: GeHigh and Ve
Income G
2.2
neral Wastey of Cape Toste type comuld approxim
e compositioDrakenstein
d is of the sa
Gar10
nstein IWMP_Versio
STE MANAG
TITIES AND
for General W
e of determinefer Paragraypical waste
have been inot yet been c
ndfill, that porwaste rece
vering their o
eneral Waste
ste
owing Genethe overall G
eneric Wasteery High Group
is made upown, verifyinmposition in
mately be as
Figu
n of the Genn has been cme order of
rden0%
BuilRub17
n2_10122009.docx\j
GEMENT IN
D TYPES
Waste Surv
ning the Genaph 1.3) were
generation f
nstalled at bocommissionertion of the wived at the own waste a
e Generated
eral Waste gGeneral Wast
e GenerationMedium Inc
Group
1.1
p from varioung waste dat
General Windicated in
re 2-1: Gene
neral Waste scompared wmagnitude.
Industry27%
der's bble7%
-24-
m
DRAKENST
vey
neral Wastee used to cafigures per p
oth the Paared. Since alwaste streamPaarl Transfnd weighed a
d
generation fte figure (for
n Figures pecome Low
In
us waste typta for the the
Waste in DrakFigure 2-1
eral Waste C
stream as indith the estim
Cleansing3%
TEIN MUNIC
quantities inalculate the terson of eac
rl Transfer Sll the municip
m is not weigfer Station isat the weigh
figures deriv2009) was c
er Person (kw and Very Lncome Grou
0.5
pes and basee Tygerberg kenstein with
Composition
dicated in Figmated volume
CIPALITY
Drakensteintotal tonnagech economic
tation and thpal collectionhed and thers delivered bridge.
ved from sicalculated.
kg/d) Low p
ed on an extcatchment, h its mix of
n for Draken
gure 2-1: Gees received
n, the populae of municipasector of the
he Wellingtonn vehicles disrefore accuraby the publi
milar exerci
tensive studit can be deresidential
nstein
eneral Wasteat the Welli
Domest43%
ation statistical solid waste community
n Landfill, buspose of theate data doec and privat
ises in othe
y done in therived that th
and industry
e Compositiongton Landf
tic
cs te
y.
ut eir es te
er
he he y,
on fill

-25-
\\Titan\public\Projdata\A021\IWMP\Drakenstein IWMP_Version2_10122009.docx\jm
Table 2-2: Calculated General Waste Volumes based on 2009 Population
Area Waste Generated
t/a t/w t/weekday kg/p/d Ward 1 - Rural West 2,048 39.4 7.9 1.14 Ward 2 - Wellington 2,659 51.1 10.2 1.85 Ward 3 - Agter Paarl 2,545 48.9 9.8 1.05 Ward 4 - Paarl 3,700 71.1 14.2 2.02 Ward 5 - Mbekweni 894 17.2 3.4 0.77 Ward 6 - Mbekweni 1,436 27.6 5.5 0.75 Ward 7 - Mbekweni 2,498 48.0 9.6 1.25 Ward 8 - Mbekweni 2,015 38.7 7.7 0.82 Ward 9 - Mbekweni 1,211 23.3 4.7 0.85 Ward 10 - Hillcrest 2,409 46.3 9.3 1.16 Ward 11 - Newton 2,867 55.1 11.0 1.38 Ward 12 - Mbekweni 2,156 41.5 8.3 0.81 Ward 13 - Paarl 642 12.4 2.5 0.78 Ward 14 - Paarl 2,308 44.4 8.9 0.99 Ward 15 - Paarl 3,635 69.9 14.0 2.02 Ward 16 - Paarl 2,544 48.9 9.8 0.95 Ward 17 - Paarl 3,038 58.4 11.7 1.86 Ward 18 - Rural North 2,915 56.0 11.2 1.30 Ward 19 - Paarl 2,435 46.8 9.4 1.85 Ward 20 - Paarl 1,667 32.1 6.4 1.17 Ward 21 - Paarl 2,475 47.6 9.5 0.97 Ward 22 - Paarl 4,691 90.2 18.0 1.81 Ward 23 - Paarl 3,316 63.8 12.8 1.96 Ward 24 - Paarl 1,837 35.3 7.1 1.16 Ward 25 – Rural East 3,313 63.7 12.7 1.13 Ward 26 - Paarl 2,327 44.8 9.0 1.30 Ward 27 - Paarl 1,024 19.7 3.9 1.05 Ward 28 - Rural South 3,202 61.6 12.3 1.25 Ward 29 - Rural East 2,578 49.6 9.9 1.58 Ward 30 - Saron 2,005 38.6 7.7 0.87 Ward 31 - Rural North 3,022 58.1 11.6 0.95 Total 75,413 1450 290.1 1.23
What is important to realise from the data in Table 2.2 is that this includes all general waste generated in the municipal area, also the waste generated in the rural areas. Waste is not collected from the agricultural sector although their household waste is included in the above figures. With the weighbridge at the Wellington Landfill being commissioned at the start of January 2010, the above volumes will be verified with actual data once available. Factoring Figure 2-1 into Table 2-2 results in the Domestic Waste in Drakenstein totalling some 32,428 tons per annum.
2.1.2.2 Commercial and Industrial Waste
Commercial and Industrial Waste is difficult to analyse as no specific composition studies have been done anywhere to date on this waste type. Based on the Tygerberg study Drakenstein should generate 27% or 20,362 tons of industrial and commercial waste per annum.
2.1.2.3 Builder’s Rubble Builder’s rubble is generally dependant on the economic activity of the area but based on the volumes (not weighed) received at the Wellington Landfill, approximately 17% of the General Waste stream or 12,820 tons of builder’s rubble would be generated per annum.

-26-
\\Titan\public\Projdata\A021\IWMP\Drakenstein IWMP_Version2_10122009.docx\jm
2.1.2.4 Public Cleansing Waste No accurate data is available on the volume of Cleansing Waste generated, but considering the estimated volumes received at the Wellington Landfill, this waste type can be estimated at 2,262 tons per annum.
2.1.2.5 Garden Waste Garden Waste are either delivered to the Wellington landfill or the Paarl Transfer Station by the public and Garden Services Contractors or put out by residents as part of their weekly collection. The portion that is not part of the weekly collection amounts to approximately 10% of the General Waste stream or 7,541 tons per annum. Garden Waste is one of the main contaminators of recoverable material and a strategy must be developed to reduce the amount of garden waste in the collection rounds.
2.1.3 Recoverable Materials
The typical composition of the municipal solid waste in Drakenstein was calculated using the most recent waste composition studies done for the City of Cape Town in the Tygerberg catchment. These studies have determined the waste composition per Income Group as follows:
Table 2-3: Waste Composition per Income Group Income Group
Paper and Cardboard Plastic Metal Glass Food Garden Other
Very Low 13.0% 24.0% 4.0% 6.0% 16.0% 7.0% 29.0%Low 25.0% 17.0% 5.0% 7.0% 10.0% 13.0% 23.0%Middle 27.0% 17.0% 6.0% 7.0% 11.0% 10.0% 22.0%High 30.0% 16.0% 6.0% 8.0% 10.0% 11.0% 20.0%
Applying Table 2-3 to Table 1-2 shows the availability of recoverable materials in Drakenstein’s Domestic waste stream to be as follows:
Table 2-4: Availability of Recoverables in Drakenstein’s Domestic Waste Income Group
Paper and Cardboard Plastic Metal Glass Food Garden Other
Drakenstein 23.5% 18.5% 5.1% 7.0% 11.6% 10.7% 23.7%
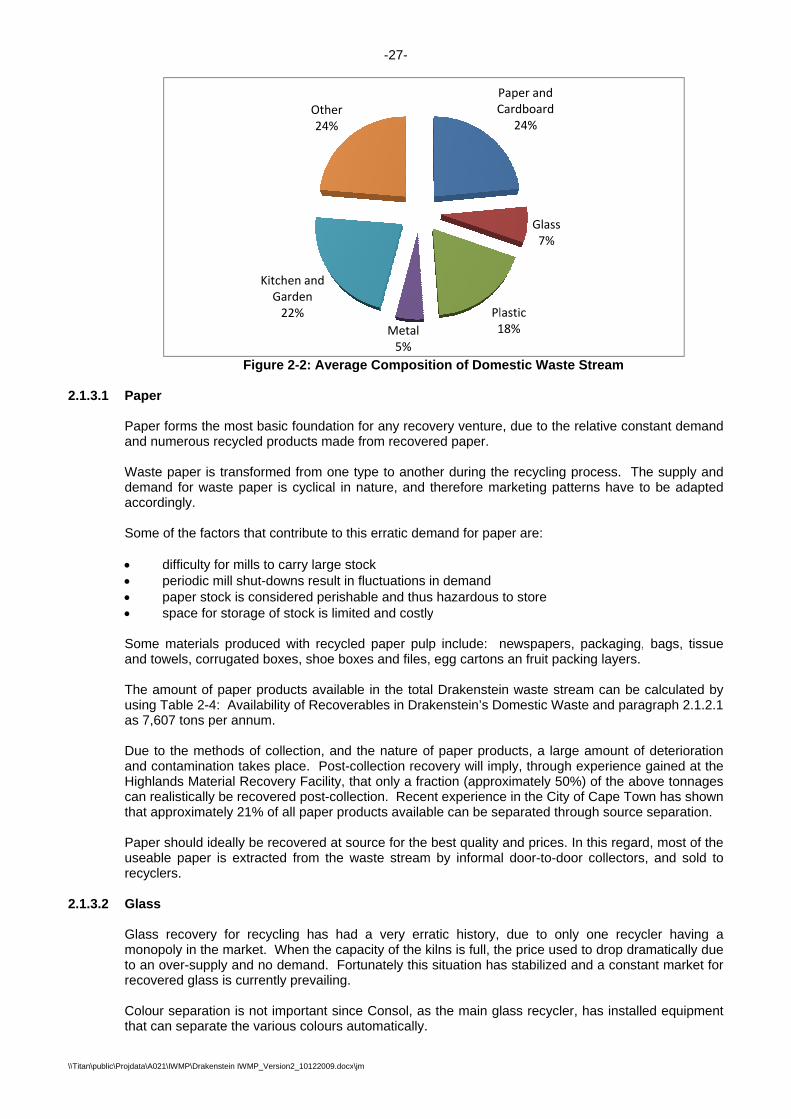
Table 2-4 is graphically displayed in Figure 2-2: Average Composition of Domestic Waste Stream:
\\
2
2
\Titan\public\Projdata
2.1.3.1 Pap Papand Wademacc Som • • • • Somand Theusinas 7 DueandHigcantha Papuserec
2.1.3.2 Gla Glamoto arec Coltha
a\A021\IWMP\Draken
per
per forms thed numerous r
aste paper ismand for wacordingly.
me of the fac
difficulty fperiodic mpaper stospace for
me materialsd towels, cor
e amount of ng Table 2-47,607 tons p
e to the metd contaminatghlands Maten realisticallyt approximat
per should ideable paper yclers.
ass
ass recoverynopoly in thean over-suppovered glass
lour separatit can separa
nstein IWMP_Versio
Figure
e most basicrecycled pro
s transformedaste paper is
ctors that con
for mills to camill shut-dowock is considr storage of s
s produced rugated boxe
paper produ4: Availabilityper annum.
thods of colletion takes plaerial Recovery be recoveretely 21% of a
deally be recis extracted
y for recycline market. Wply and no des is currently
ion is not imate the variou
KitchGa2
n2_10122009.docx\j
2-2: Averag
c foundation ducts made
d from one ts cyclical in n
ntribute to th
arry large stowns result in ered perishastock is limite
with recyclees, shoe box
ucts availably of Recover
ection, and tace. Post-cory Facility, thed post-collecall paper prod
overed at so from the w
ng has hadWhen the capa
emand. Forty prevailing.
portant sinceus colours au
hen and arden22%
Other24%
-27-
m
ge Composit
for any recofrom recove
ype to anothnature, and
is erratic dem
ock fluctuations
able and thused and costly
d paper pulxes and files,
e in the totarables in Dra
the nature oollection recohat only a fraction. Recenducts availab
ource for the waste stream
a very erracity of the ktunately this
e Consol, asutomatically.
Metal5%
tion of Dom
very venturered paper.
her during ththerefore ma
mand for pap
in demand s hazardous y
p include: n, egg cartons
al Drakensteikenstein’s D
of paper prodovery will im
action (appront experienceble can be se
best quality m by informa
atic history, kilns is full, thsituation ha
s the main gl
PC
Pl1
mestic Waste
e, due to the
he recycling parketing patt
per are:
to store
newspapers,s an fruit pac
in waste streDomestic Was
ducts, a largmply, through oximately 50%e in the City eparated thro
and prices. l door-to-doo
due to onlhe price useds stabilized a
lass recycler
Paper and Cardboard
24%
Glass7%
astic18%
e Stream
relative cons
process. Thterns have to
, packaging,cking layers.
eam can be ste and para
e amount ofexperience
%) of the abof Cape Towough source
In this regardor collectors
y one recycd to drop draand a consta
r, has installe
stant deman
he supply ano be adapte
bags, tissu
calculated bagraph 2.1.2.
f deterioratiogained at thove tonnage
wn has showseparation.
d, most of ths, and sold t
cler having amatically duant market fo
ed equipmen
nd
nd ed
ue
by 1
on he es wn
he to
a ue or
nt
-28-
\\Titan\public\Projdata\A021\IWMP\Drakenstein IWMP_Version2_10122009.docx\jm
The amount of glass available in Drakenstein’s Domestic waste can be calculated at 2,255 tons per annum. Experience at Highlands has shown that only 10% of the available glass gets recovered during manual post-collection separation whereas the recent statistics in Cape Town show a 44% reduction of glass through source separation.
2.1.3.3 Plastic Several types of plastics are typically recycled, including PET, HDPE (milk containers), and mixed plastics. Recycled PET is used in the manufacture of small moulded products, such as handles, sporting goods and furniture. Recycled HDPE is used for producing flowerpots, dustbins and a variety of other containers. Mixed plastics are normally used for the manufacture of outdoor furniture, pallets, and plastic timber. The recent introduction of a levy on shopping bags has resulted that the amount of plastic arriving at the landfill reduced dramatically. Less plastic bags are disposed of, as they are re-used and are now manufactured of better quality and thicker plastic that can be recycled. In order to recycle plastics successfully, it has to be sorted into the various categories, and washed if contaminated by the other wastes. According to the plastic recyclers the demand for “clean” plastic remains high, whereas dirty plastic are difficult to sell at breakeven prices. The mass of plastics of the various grades that are available for recovery is calculated at 5,986 tons per annum. The experience at the Highlands MRF has shown that manual post-collection recovery can achieve only 6% of the plastics whereas the recent experience in the City of Cape Town also indicates a recovery rate of 6% through source separation.
2.1.3.4 Metal
Metals are the single most recoverable item in the waste stream. Very little degradation takes place during collection. It follows that a relatively small amount ends up in the waste stream, as all types of metal are removed for re-sale at various stages of the waste handling process. One of the major components of ferrous wastes is the steel can (95% of all cans in the Metropolitan Areas). Non-ferrous metals such as Aluminium and Copper are very scarce in our waste streams, due to its extremely high salvaging value. These are usually removed at source.
Tonnages of mixed metals available in the Drakenstein domestic waste stream is calculated to be 1,661 tons per annum. Post-collection recovery at Highlands has shown that approximately 10% of the metals can be recovered whereas Cape Town’s recent experience with source separation indicates only 5% recovery of metals.
. 2.1.4 Special Waste Streams
2.1.4.1 Electrical and Electronic Equipment No accurate data exists, although studies in the City of Cape Town indicate that this waste stream can amount to 2%-4% of the General Waste Stream.
2.1.4.2 Scrap Motor Vehicles No accurate data exists.
2.1.4.3 Tyres No accurate data exists. In accordance with the recently published Tyre Regulations the disposal of tyres to landfill in its current format is only allowed up to June 2011, whereafter all tyres that are

-29-
\\Titan\public\Projdata\A021\IWMP\Drakenstein IWMP_Version2_10122009.docx\jm
landfilled, must be quartered. After June 2014 no tyres, quartered or otherwise, may be landfilled. The municipality will have to develop an action plan in accordance with the Tyre Regulations to manage tyres generated within the municipal area.
2.1.4.4 Batteries No accurate data exists.
2.1.4.5 Waste Oils Waste oils generated by industry are managed in a responsible manner, when encountered. Eight industries in Paarl generate waste oils. Six of the eight industries make use of Oilkol, one generates very little and one disposes of the oil at VWMF. One of the Oilkol users take the oil to Paarl Motors where Oilkol collects, the other have Oilkol containers on site. No waste oils were mentioned by the Wellington or Gouda industries. Waste Oil Facts Summary: Total known quantity of recyclable waste oils: 10.50 kℓ pa. Total recycled: as above. Origin of waste oils: Paarl Recycler: Oilkol in Cape Town Total known quantity chemical contaminated waste oils: 120.00 kℓ pa. Total disposed of: as above Origin of contaminated oil: Paarl Disposal site: VWMF in Cape Town Contractor: Wasteman
2.1.5 Methodology for Hazardous Waste Survey The Hazardous Waste component in the Drakenstein was broken down into facets, namely: • Industries producing Hazardous Waste • Health care waste management • Cellar effluent management. Since far less information exists on the generation of hazardous wastes than on general waste and since hazardous wastes consist of various ratings, each requiring different treatment and/or handling, the methodology is described in significantly more detail.
2.1.5.1 Industries and Businesses Producing Hazardous Waste
The modus operandi was to travel every possible road listed in the road-map indicating Paarl and Wellington industries. A list was compiled based on the physical survey for each town, called Paarl-, and Wellington total survey. All the possible industries were listed. However, not all businesses were listed as some were regarded as non-Hazardous Waste producers due to their nature of business size, physical structure, etc. The second list which was prepared consists of all the possible industries and Hazardous Waste producing industries in Paarl and Wellington. Each concern listed in the Hazardous Waste survey list was interviewed, telephonically and/or in person. A few of the concerns were responding per electronic mail.

-30-
\\Titan\public\Projdata\A021\IWMP\Drakenstein IWMP_Version2_10122009.docx\jm
2.1.5.1.1 Introduction
Hazardous Waste Management in the industrial area of Drakenstein Municipal is often based on goodwill and the environmental responsibility of industry. The major industries mostly have in-house chemical treatment plants and control the pH and COD of the effluent prior to municipal sewer discharge. A large range of industries were identified when compared to the Key Industries of the Minimum Requirements of 1998 by DWAF (Hazardous Waste Volume 2, appendix A9-3), the industries identified are broadly defined as in Table 2-5 below: Table 2-5: Drakenstein: Key Industries
KEY: MINIMUM REQUIREMENT CODE A1 Agriculture, Forest Management, Fisheries A2 Animal & Vegetable Products from Food Sector A3 Drink Industry D3 Foundary & Metal Workings D4 Metal Finishing and Electro Plating F7 Rubber and Plastic Materials G1 Mechanical Engineering G2 Electronic and Electrical Engineering H1 Textile, Clothing and Foot Wear Industry H2 Hide and Leather Industry H3 Timber, Wood and Furniture Industry I1* Vehicle spraying and washings J2 Printing, Publishing and Photographic Laboratories K1 Health, Hospitals, Medical Centres and Laboratories
Key: * Added to Minimum Requirements 1998, DWAF, 2nd Edition by author.
2.1.5.1.2 Key Industries and Related Hazardous Waste Types
The industries in the Drakenstein Region are discussed below in terms of the Key industrial Group and Process. Reference is made to each individual process and quantities generated. The Hazard Rating is designated by the author and is a mere indication. The largest sector is A: Agriculture, Forestry and Food.
2.1.5.1.3 Industrial Groups1
A. AGRICULTURE, FORESTRY & FOOD PRODUCTION A1 : Agriculture, Forest Management and Fisheries
In Table 2-6 below is a summary of the A1 industries and the Hazardous Waste types produced: Table 2-6: A1 Industries – Agriculture, Forest Management and Fisheries
KEY INDUSTRY PROCESS GENERATING HAZARDOUS WASTE
HA
ZAR
D
RA
TIN
G
SAN
S 02
28
MAJOR CONSTITUENTS PER STREAM GENERATOR
PAARL British American Tobacco
Tobacco Processing 4 1 1 1
9
3,6,9 6 6
• Washing of water soluble glue pots
• Waste chemicals • Fluorescent tubes • Industrial Clinic health
care waste Foodcan Canning of fruit and food 1
3
3 3
• Solvents and cleaning chemicals from washing of equipment
• Machine oil

-31-
\\Titan\public\Projdata\A021\IWMP\Drakenstein IWMP_Version2_10122009.docx\jm
KEY INDUSTRY PROCESS GENERATING HAZARDOUS WASTE
HA
ZAR
D
RA
TIN
G
SAN
S 02
28
MAJOR CONSTITUENTS PER STREAM GENERATOR
Kynoch Repacking of fertilizer 4 9 • Sweepings containing dry fertilizer spills
Neo Novo Deciduous fruit distributors (local and export)
4 9 • Reject fruit • Off-spec fruit
Paarl Abattoir Slaughter house 3 3
9 9
• Blood and paunch content • Effluent from washing of
slaughter house GOUDA No A1 industry - - - - SARON/HERMON No A1 industry - - - -
Comments: The 5 main industries are situated in Paarl. The Hazardous Waste types are all
clearly defined.
A2 : Animal, Vegetable Products from Food Sector In Table 2-7 below is a summary of the A2 industries and the Hazardous Waste types produced. Table 2-7: A2 Industries: Animal, Vegetable products from Food Sector
KEY INDUSTRY PROCESS GENERATING HAZARDOUS WASTE
HA
ZAR
D
RA
TIN
G
SAN
S 02
28
MAJOR CONSTITUENTS PER STREAM GENERATOR
PAARL Langeberg Foods = Tiger Food Brands
Food processing: Production of jams, tomato paste and pasta cooking sauce.
4 3 3 4 3
9 9 9 9 9
• Effluent containing fruit pulp residue and cleaning chemicals. The effluent is pre-treated in situ by G E Betz. Filtrate and filter cake results.
• Caustic effluents during fig jam production. Pre-treated by G E Betz (in situ)
• Annual bottle washing producing caustic effluent. Pre-treated by G E Betz (in situ)
• Reject stock • Machine oil
Meadow Foods Food processing: Production of Animal feed
4 4 4 4
9 9 9 9
• Blocked drains in plant caused by wet feed accumulation
• Truck washings giving rise to wet feed in water
• Industrial storm water containing traces of molasses
• Grain spills (wet) waste Sasko Milling and Baking
Milling and storing of grain 4 9 • Wash water containing flour
WELLINGTON Boland Pulp Production of fruit pulp 4
4
9 9
• Fruit pips dried and re-process
• Fruit peels

-32-
\\Titan\public\Projdata\A021\IWMP\Drakenstein IWMP_Version2_10122009.docx\jm
KEY INDUSTRY PROCESS GENERATING HAZARDOUS WASTE
HA
ZAR
D
RA
TIN
G
SAN
S 02
28
MAJOR CONSTITUENTS PER STREAM GENERATOR
SAD Food processing: Production of chutney, chilli sauce and Worcester sauce
4 4
9 9
• Effluent with fruit residue. Pre-screened by a 80 micron screen prior to discharge
• Screened solids Trufruco Food processing:
Production of fruit bars by dry blending
- - • Dry process. No effluent
GOUDA Delmonté Fresh Produce
Food processing: Washing of export fruit and food
4 4
2/3
2/3
9 9 9 9
• Effluent containing 100 – 150 ppm chlorine from drenching of crates on vehicles.
• Effluent containing 100 -150 ppm chlorine from washing dust off fresh fruit
• Degreening effluent containing chemicals
• Drenching and spraying effluent arising from fungicide application to fruit on conveyor
SARON/HERMON No A2 industry - - - -
Comments: The 7 industries are spread across the Drakenstein area. The two dominant
production processes are deciduous fruit processing and milling of grain. The agricultural nature of the area is strongly represented.
A3 : Drink Industry The production of drinks in the industrial areas of Paarl and Wellington are discussed in Table 2-8 below: Table 2-8: A3 Industries: Drinks
KEY INDUSTRY PROCESS GENERATING HAZARDOUS WASTE
HA
ZAR
D
RA
TIN
G
SAN
S 02
28
MAJOR CONSTITUENTS PER STREAM GENERATOR
PAARL Boland Cellar Wine Making 4 9 • Water, soap, wine and
lees KWV Paarl Wine Cellars
Wine pressing, fermenting and distillation
4 3 4
9 3 9
• Pre-Cellar grape pips and peels
• Machine oils • Cellar effluent: COD
2000 to 10 000 ppm. Monis/Distell Wine blending. Juice
production closed 4 9 • Cider lees
WELLINGTON James Sedgwick Distillery
Mashing and fermenting of maze. Wine making
4 4
9 9
• Grain solids and effluent from still bottoms
• Anaerobic digester treated wine making effluents with pH 6 and COD 1 500 – 1 800 ppm.
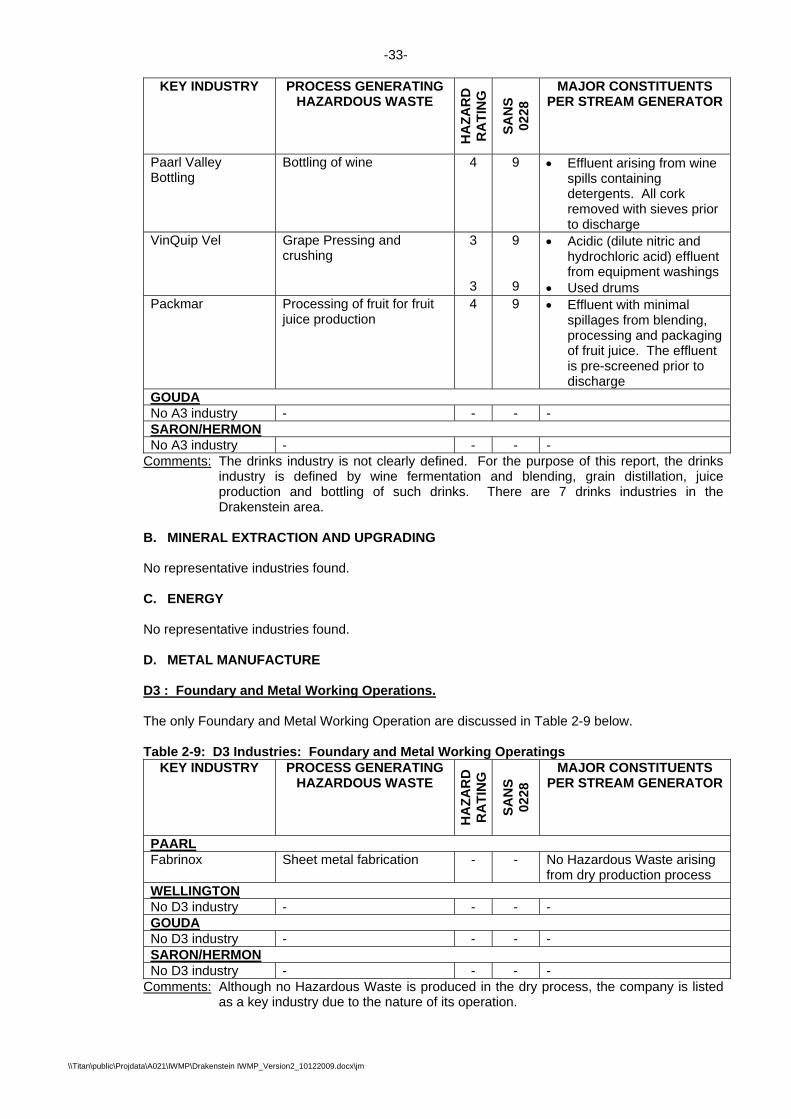
-33-
\\Titan\public\Projdata\A021\IWMP\Drakenstein IWMP_Version2_10122009.docx\jm
KEY INDUSTRY PROCESS GENERATING HAZARDOUS WASTE
HA
ZAR
D
RA
TIN
G
SAN
S 02
28
MAJOR CONSTITUENTS PER STREAM GENERATOR
Paarl Valley Bottling
Bottling of wine 4 9 • Effluent arising from wine spills containing detergents. All cork removed with sieves prior to discharge
VinQuip Vel Grape Pressing and crushing
3 3
9 9
• Acidic (dilute nitric and hydrochloric acid) effluent from equipment washings
• Used drums Packmar Processing of fruit for fruit
juice production 4 9 • Effluent with minimal
spillages from blending, processing and packaging of fruit juice. The effluent is pre-screened prior to discharge
GOUDA No A3 industry - - - - SARON/HERMON No A3 industry - - - -
Comments: The drinks industry is not clearly defined. For the purpose of this report, the drinks industry is defined by wine fermentation and blending, grain distillation, juice production and bottling of such drinks. There are 7 drinks industries in the Drakenstein area.
B. MINERAL EXTRACTION AND UPGRADING No representative industries found. C. ENERGY No representative industries found.
D. METAL MANUFACTURE D3 : Foundary and Metal Working Operations. The only Foundary and Metal Working Operation are discussed in Table 2-9 below. Table 2-9: D3 Industries: Foundary and Metal Working Operatings
KEY INDUSTRY PROCESS GENERATING HAZARDOUS WASTE
HA
ZAR
D
RA
TIN
G
SAN
S 02
28
MAJOR CONSTITUENTS PER STREAM GENERATOR
PAARL Fabrinox Sheet metal fabrication - - No Hazardous Waste arising
from dry production process WELLINGTON No D3 industry - - - - GOUDA No D3 industry - - - - SARON/HERMON No D3 industry - - - -
Comments: Although no Hazardous Waste is produced in the dry process, the company is listed as a key industry due to the nature of its operation.

-34-
\\Titan\public\Projdata\A021\IWMP\Drakenstein IWMP_Version2_10122009.docx\jm
D4 : Metal Finishing and Electroplating The only electroplater in Drakenstein is discussed in Table 2-10 below. Table 2-10: D4 Industries: Metal Finishing and Electoplating
KEY INDUSTRY PROCESS GENERATING HAZARDOUS WASTE
HA
ZAR
D
RA
TIN
G
SAN
S 02
28
MAJOR CONSTITUENTS PER STREAM GENERATOR
PAARL Paarl/Plating Electroplating with nickel,
cobalt, chrome, brass and zinc
1 6,8 • Effluent containing heavy metals are pre-treated with lime and dewatered prior to discharge. A filter cake results
WELLINGTON No D4 industry - - - - GOUDA No D4 industry - - - - SARON/HERMON No D4 industry - - - -
Comments: The electroplater has an effluent treatment plant for the removal of heavy metal hydroxides from the effluent prior to discharge. Filter cake is apparently stock piled.
E. MANUFACTURE OF NON-METAL MINERAL PRODUCTS No representative industries found. F. CHEMICAL AND RELATED INDUSTRIES F7 : Rubber and Plastic Materials There were two plastic packaging manufacturers in Paarl. Their Hazardous Waste generation detail is in Table 2-11 below. Table 2-11: F7 Industries: Rubber and Plastic Materials
KEY INDUSTRY PROCESS GENERATING HAZARDOUS WASTE
HA
ZAR
D
RA
TIN
G
SAN
S 02
28
MAJOR CONSTITUENTS PER STREAM GENERATOR
PAARL Spilo Latex Extrusion and weaving of
polyethylene and polypropylene
- 4
- 9
• Effluent free extrusion production plant.
• Soap water from weaving washings directly discharged.
Versapak Manufacture polystyrene in a dry process
1 - 1
3 - 6
• Chemical residues and waste consisting of ethyl acetate, oils, rags, etc
• Dry process. No effluent • Industrial Clinic: Health
care waste WELLINGTON No F7 industry - - - - GOUDA No F7 industry - - - - SARON/HERMON No F7 industry - - - -
Comments: The two industries have well managed Hazardous Waste management.

-35-
\\Titan\public\Projdata\A021\IWMP\Drakenstein IWMP_Version2_10122009.docx\jm
G. METAL GOODS, ENGINEERING AND VEHICLE INDUSTRIES G1 : Mechanical Engineering There are 3 engineering factories which will best be classified as G1. They are discussed in Table 2-12 below. Table 2-12: G1 Industries: Mechanical Engineering
KEY INDUSTRY PROCESS GENERATING HAZARDOUS WASTE
HA
ZAR
D
RA
TIN
G
SAN
S 02
28
MAJOR CONSTITUENTS PER STREAM GENERATOR
PAARL Filmatic Mechanical assembly of a
yoghurt packaging and bottling plant
4 - • Rinse water from the testing of equipment. The rinse water contains yoghurt
Gearbox Centre Servicing of gearboxes 3 9 • Used gearbox oil S A Bandshaw Manufacturing of
Bandshaws ½ 3
8 3
• Caustic soda (30 %) rinse water
• Lubricating oil WELLINGTON No G1 industry - - - - GOUDA No G1 industry - - - - SARON/HERMON No G1 industry - - - -
Comments: The gearbox service centre could also fall under G3: Manufacture of Motor Vehicle and Parts. However, due to possible engineering required to rebuild gearboxes it was designated to G1.
H. TEXTILE LEATHER AND WOOD INDUSTRIES H1 : Textile, Clothing and Footwear There were three major textile producers in Drakenstein discussed in Table 2-13 below. Table 2-13: H1 Industries: Textile, Clothing and Footwear
KEY INDUSTRY PROCESS GENERATING HAZARDOUS WASTE
HA
ZAR
D
RA
TIN
G
SAN
S 02
28
MAJOR CONSTITUENTS PER STREAM GENERATOR
PAARL Berg River Textiles Textile dying, sizing and
weaving 2/3
3/4
3,9 9
• Effluent from wet process resulting from 80 % water usage. Contains polyvinyl alcohol (PVA), carboxy methyl cellulose (CMA), etherified potato starches, caustic, salts and unfixed dyes. The effluent is not pre-treated prior to discharge. The pH is pH9 and COD is 1 500 ppm.
• Effluent from the dry process resulting from 20 % water usage. The effluent contains, PVA, CMA and etherified potato starch. The COD is 3.0 –

-36-
\\Titan\public\Projdata\A021\IWMP\Drakenstein IWMP_Version2_10122009.docx\jm
KEY INDUSTRY PROCESS GENERATING HAZARDOUS WASTE
HA
ZAR
D
RA
TIN
G
SAN
S 02
28
MAJOR CONSTITUENTS PER STREAM GENERATOR
1 3 1
8 9 6
3.5 ppm of pH 7. No pre-treatment prior to discharge.
• Caustic recovery plant. No effluent produced.
• Machine oils • Fluorescent tubes.
Courthiel Velours Cotton and velour fabric weaving
4 4
9 9
• Dying effluent directly discharged
• Dye drums (empty) WELLINGTON Colibri – Table Bay Spinners = Boland Fine Spinners
Textile spinners 4 9 • Water soluble organic dye effluent directly discharged.
GOUDA No H1 industry - - - - SARON/HERMON No H1 industry - - - -
Comments: The dying, sizing and weaving uses produce caustic soda in the process. The caustic soda is recovered in a recovery plant on site.
Where only spinning and weaving occurs, the effluents seam to be discharged
directly. H2 : Hide and Leather Industry There were two leather industries with 3 factories in Wellington. The ostrich hide doesn’t contain fat and hair as the bovine hide. Therefore it’s effluent contain less organic particles. Refer to Table 2-14 below.
Table 2-14: H2 Industries: Hide and Leather Industries
KEY INDUSTRY PROCESS GENERATING HAZARDOUS WASTE
HA
ZAR
D
RA
TIN
G
SAN
S 02
28
MAJOR CONSTITUENTS PER STREAM GENERATOR
PAARL No H2 industry - - - - WELLINGTON Mossop Western Leathers
Bovine wet-blue leather processing
- - -
Hermon Road factory
Bovine wet-blue leather re-hydration, splitting and shaving
1/2
1/2
6 6
• Wet-blue shavings and trimmings containing trivalent chromium.
• Wet-blue rinses and soaking effluent containing trivalent chromium.
Hillcrest Factory Bovine leather is re-tanned, dyed and lubricated prior to drying and finishing.
2/3 6 • Leather off cuts, buffing dust, dye yard screenings, sludge’s, contaminated scrap wood and polyurethane foil trimmings
• Effluent containing tans and dyes with pH 7 – 7.5; COD = 3 105 mg/ℓ ;

-37-
\\Titan\public\Projdata\A021\IWMP\Drakenstein IWMP_Version2_10122009.docx\jm
KEY INDUSTRY PROCESS GENERATING HAZARDOUS WASTE
HA
ZAR
D
RA
TIN
G
SAN
S 02
28
MAJOR CONSTITUENTS PER STREAM GENERATOR
trivalent chrome = 0,39 mg/ℓ and sulphate = 2 000 mg/ℓ.
Swartland Tanning Desalting, deliming chrome tanning and re-tanning
1/2
1/2
6,9 6
• Effluent water containing lime
• Trivalent chromium waste GOUDA No H2 industry - - - - SARON/HERMON No H2 industry - - - -
Comments: The Wellington factories have significantly reduced their Hazardous Waste over the past 2 years due to the closure of the wet-blue bovine tanning plant processing salted hides. Wet-blue leather is now directly purchased and used. Effluents arising at the factories are evaporated. (See Disposal)
H3 : Timber Wood and Furniture Industry There are two wood handling plants of which one is a treatment plant and one a construction plant. The industries are discussed in Table 2-15 below.
Table 2-15: H3 Industry: Timer Wood and Furniture Industries
KEY INDUSTRY PROCESS GENERATING HAZARDOUS WASTE
HA
ZAR
D
RA
TIN
G
SAN
S 02
28
MAJOR CONSTITUENTS PER STREAM GENERATOR
PAARL Federated Timbers Cutting and sawing of
timber - - • Zero effluent with
construction of roof trusses. Off-cuts not hazardous
WELLINGTON Stapole Treatment of timber in
copper-chrome – arsenic (CCA) solution. Also known as tanolith
1 1
6 6
• Contaminated CCA sand spills.
• Empty CCA drums
GOUDA No H3 industry - - - - SARON/HERMON No H3 industry - - - -
Comments: The Federated Timber depot is not actually as Hazardous Waste generator. The depot is listed due to its previous treatment of wood products. The CCA waste in Wellington is stored in situ.
I. VEHICLE SPRAYING AND VEHICLE WASHINGS I1 : Washbay in Transport Industries There is no such a group in the Minimum Requirements 1998 by DWAF. The author added this group for further clarity. Refer to Table 2-16 below.

-38-
\\Titan\public\Projdata\A021\IWMP\Drakenstein IWMP_Version2_10122009.docx\jm
Table 2-16: I1 Industry: Washbay in Transport Industries KEY INDUSTRY PROCESS GENERATING
HAZARDOUS WASTE
HA
ZAR
D
RA
TIN
G
SAN
S 02
28
MAJOR CONSTITUENTS PER STREAM GENERATOR
PAARL Imperial Cargo Washbay for fleet 4 9 • Vehicle washings SP Motors Workshop wash water 4 9 • Workshop rinses WELLINGTON No I1 industry - - - - GOUDA No I1 industry - - - - SARON/HERMON No I1 industry - - - -
Comments: There could be various washbays in the Drakenstein area which were unobserved. Usually the effluent contains degreasers and biodegradable detergents. If variable chemical cargo is transported, the chances of variable contaminated chemical effluent arising are real.
J. MANUFACTURING OF PAPER PRODUCTS, PRINTING AND PUBLISHING J2 : Printing, Publishing and Photographic Laboratories Table 2-17: J2 Industry: Printing, Publishing and Photographic Laboratories
KEY INDUSTRY PROCESS GENERATING
HAZARDOUS WASTE
HA
ZAR
D
RA
TIN
G
SAN
S 02
28
MAJOR CONSTITUENTS PER STREAM GENERATOR
PAARL Cape Wrappers Printing of wrappers 2/3 3,9 • Spent solvent, inks, rags
and cleaning materials Inter Media Printers Printing 3/4
¾ 9 9
• Water based ink rinse • Water based ink drums
Paarl Labels Printing on self-adhesive labels
2 3 • Water soluble ink and solvent based ink effluent
Paarl Post Photographic and press printing
2 2 2
2/3
6 9 8 8
• Photographic fixer containing heavy metals
• Photographic developer waste
• Excess chemicals and ink waste
• Printing rinses Paarl Print Printing of magazine 2
2 4 4
3 9 3 9
• Solvent based ink residue and drums
• Photographic fixer and developer waste
• Machine oils • Wash water with soluble
glue resulting from the binding process
Paarl Web Printing of magazines, etc 2
2/4 1 1 2
9
3,9 3 6 3
• Photographic developer and fixer waste
• Empty containers • Mineral oil waste in
corporate in liquid effluent • Fluorescent tubes • Liquid effluent containing
white spirits, isopropyl

-39-
\\Titan\public\Projdata\A021\IWMP\Drakenstein IWMP_Version2_10122009.docx\jm
KEY INDUSTRY PROCESS GENERATING HAZARDOUS WASTE
HA
ZAR
D
RA
TIN
G
SAN
S 02
28
MAJOR CONSTITUENTS PER STREAM GENERATOR
alcohol (IPA), cleaning chemicals, water, ink, oils and varnish
The Label Company
Printing of self-adhesive labels
4 9 • Water based in rinses
WELLINGTON Boland Drukpers Printing works: Books,
magazines, etc 2/3 3/4
9 9
• Empty ink drums • Water soluble rinses
GOUDA No J2 industry - - - - SARON/HERMON No J2 industry - - - -
Comments: The eight printing presses in Paarl and Wellington form a large industry in the area. The inks vary from water soluble to solvent based inks. Photographic developers are used by most of the book and magazine presses.
K. MEDICAL SANITARY AND OTHER HEALTH SERVICES
Discussed in detail in paragraph 2.1.5.2 of the report. L. COMMERCIAL PERSONAL SERVICES
No representative industries found.
2.1.5.2 Health Care Risk Waste Management
Mr Attie Fourie, the Head of Environmental Health of the Drakenstein Municipality was interviewed in person and submitted a list of health care institutions in the Paarl and Wellington. The list was incomplete as the types and quantities of medical waste were not indicated. The types and quantities of medical waste were however indicated for the hospitals and used as a basis in this report. Further data capturing was telephonically required to add to the hospital survey. The Paarl telephone directory was used as a further reference and fifty seven (57) medical doctors were phoned for detail on their health care waste management. There was no telephone list identified for dentists and the list supplied by Drakenstein Environmental Health was used to provide the number of dentists. Assumed quantities were formulated for Health Care Waste Generation by dentists. All other concerns were telephonically interviewed as listed below: The Health Care Survey for Paarl consists of the following components: • 57 - Medical doctors (general practitioners, paediatricians, gynaecologists, obstetricians,
psychiatrists of which 50 were practising singly or in partnerships). • 5 - Dentists • 3 - Veterinary surgeons • 4 - Old age homes • 8 - Occupational health clinics in industry • 4 - Mortuaries • 10 - Hospitals (private and provincial) • 0 - Tattooists were identified • 0 - Chemists with clinics • 14 - Drakenstein Municipal Clinics
-40-
\\Titan\public\Projdata\A021\IWMP\Drakenstein IWMP_Version2_10122009.docx\jm
The modus operandi was repeated for the Wellington Survey and the following components were identified and telephonically contacted, namely: • 9 - Medical doctors were identified by Drakenstein Environmental Health Department.
None was listed as “medical” in the telephone directory. An assumption was made to use 25 % of the Paarl data based on the number of people per town.
• 2 - Dentists • 3 - Veterinary surgeons • 1 - Old age homes • 0 - Occupational health clinics in industry • 3 - Mortuaries/funeral parlours • 0 - Hospitals (private and provincial) • 0 - Tattooists were identified • 0 - Chemists with clinics • 5 - Drakenstein Municipal Clinics The Gouda and Saron portion of Drakenstein Municipality were done by telephonic survey only. There were no physical visits to the towns. The only main industry/business possible producing Hazardous Waste in Gouda was identified as a fruit processor and canner. Gouda has one medical practitioner as listed by Drakenstein Environmental Health and one Municipal Clinic. There was only one Hazardous Waste generator identified in Saron, namely the Municipal Clinic. The Saron municipal clinic was telephonically contacted through the buyer of medical disposal services for the Drakenstein Clinics. The Hermon municipal clinic’s details were obtained through the buyer for the Drakenstein Clinics.
2.1.5.2.1 Waste Categories
According to SANS Code of Practise, SANS 0248:1993, the health care waste categories are as follows: • Human/animal anatomical waste:
This category consists of human anatomical waste, human foetuses, infectious animal anatomical waste and non-infectious animal anatomical waste.
• Infectious non-anatomical waste:
This category consists of nappies, sanitary pads, hair, nail clippings, extracted teeth, all swaps, bandages and medical disposables which are generally contained in lined boxes and plastic bags.
• Sharps and similar waste:
This category consists monthly of sharps, blades, needles and steel staples used as stitches.
• Chemical and Pharmaceutical Waste:
This category contains cytotoxic pharmaceuticals and cytostatic drugs used for example in cancer therapy, genotoxic chemicals, film developers, etc.
• Radioactive Waste:
This category contains unused liquids from radiotherapy, or lab research, contaminated glassware etc.
• Pressurized Container Waste:
This category contains gas cylinders, gas cartridges, aerosol cans etc. • General Waste:
This category contains office waste, kitchen waste, non-clinical glass waste and non-infection non-anatomical waste.

-41-
\\Titan\public\Projdata\A021\IWMP\Drakenstein IWMP_Version2_10122009.docx\jm
There is however another possible category which is not listed above, namely: • Heavy Metal Waste:
This waste type contains batteries, broken thermometers, etc.
The pressurised container waste and general waste may be considered Health Care General Waste (HCGW) while Health Care Risk Waste (HCRW) includes the sharps and needles, broken glassware with blood or pus, health care waste from isolation, microbiological culture dishes, draining flasks with blood or pus, bandages, nappies and similar items when very wet or contaminated with blood, pus or secretions, pathogenic tissue parts from experimental animals, certain types of tissue waste (small bone parts which may puncture the skin) and placentas. Although a formal classification exists, the definition used in practice is far more simplified. All the Drakenstein Health Care Risk Waste is basically referred to the waste types listed below, namely: • shapes • “boxes” or disposables • anatomical • carcasses • nappies (soiled throw-away adult nappies)
2.1.5.2.2 Waste Streams per Generator
The Health Care Risk Waste generated varies according to the type of generator. A brief discussion of the types of health care waste per generator is given below: • Medical Practitioners in Private Practice:
General practitioners have mainly two types of Health Care Risk Waste namely sharps and medical disposables. Sharps consist mostly of blades and needles. The use of blades is selective and far less than the use of needles. The estimated weight of a needle is between 5.0 to 8.0 grams. Medical Disposables consist of cotton swabs, used bandages, gauze, plaster and syringes.
• Dentist in Practice:
Dentist use the approximate same weight blades. However, the needles are often lighter and weigh 3.0 to 5.0 gram per needle. Contaminated cotton plugs and other medical disposables arise from the consultancy.
• Veterinary Surgeons: The animal hospitals give rise to three main types of Health Care Risk Waste, namely sharps, medical disposables and carcasses. Sharps consist of mostly of blades and needles, with the weight of the needle slightly heavier than that of general practitioners, ca. 8.0 – 10.0 gram per needle. Medical disposables consist of used cotton swabs, bandages, etc. Carcasses vary from small dogs weighing less than 5 kg to big breeds such as 40 kg plus dogs. Horses easily weigh 500 – 600 kg per carcass.
• Old Age Homes:
Old age homes have sharps and medical disposables. The frail care units also produce nappies.
• Mortuaries/funeral homes:
Various Health Care Risk Waste arise from mortuaries and funeral homes such as body bags, sharps which include blades and sewing needles used in the cosmetic preparation of the body and sheets with or without body fluid contamination.

-42-
\\Titan\public\Projdata\A021\IWMP\Drakenstein IWMP_Version2_10122009.docx\jm
• Private and Provincial Hospitals: The generation of Health Care Risk Waste is similar to general medical practitioners except for the great increase in production. The operating theatre waste consisting of body parts and foetuses, forms a major additional source.
• Industrial Health Care Clinics:
There are eight major industries in Paarl with their own occupational health care clinics on the premises. The private clinics generate sharps and disposable medical waste.
• Sanitary Waste:
Sanitary waste is collected in all big businesses and buildings with services contracted to sanitary waste contractors. The used sanitary waste towels arise from the ablution facility area.
• Expired Pharmaceuticals:
Expired and redundant pharmaceuticals are very seldom thrown away, but returned to the suppliers.
• Private Individuals producing Health Care Risk Waste as part of the Domestic Waste
Stream: Private persons such as Type 1 Diabetics generate needles during insulation administration. The volume of health care waste from homes generated in domestic waste is minimal. An estimated 1 %, or less of the domestic waste stream contains Health Care Risk Waste (personal comment: Mr Eddie Hanekom, Deputy Director: Waste, DEAD&P) and is as such considered as part of the domestic waste stream. Other types of Health Care Risk Waste such as sanitary towels, the occasional used gauze and plasters form part of the domestic health care stream. Home infections such as measles and mumps do not provide a big infection risk from such pathogens and landfill is considered sufficient since the landfill material is host to a large range of microbiological organisms which break down in the bio reaction. (Waste Management, Paper No 25, Department of Environment, UK, Section 7.1.7, page 45).
2.1.5.3 Cellars
Telephonic data capturing took place and thirty eight (38) cellars were interviewed. In most cases the wine maker was the appropriate person to provide process effluent details.
2.1.5.4 Hazardous Waste: Industrial
2.1.5.4.1 Quantities of Hazardous Waste Generated
Quantities of Hazardous Waste generated are generally only known if it is removed and charged for by a private contractor. Therefore the combination in Table 2-18 below.
Table 2-18: Hazardous Waste Quantities, Disposal and Contractors KEY INDUSTRIES QUANTITY DISPOSAL DISPOSAL/
TRANSPORT CONTRACTOR MUNICIPAL SEWER LANDFILL
m³pa tpa No pre-treatment
Pre-treatment
A1: Agriculture Forest Management and Fisheries Paarl • Mixed
Chemicals - 41.71 - - H:H
Vissershok Enviroserv
• Fluorescent tubes
9.50 - - - H:H Vissershok
Enviroserv
• Health care - 1.61 - - Incinerator Sanumed
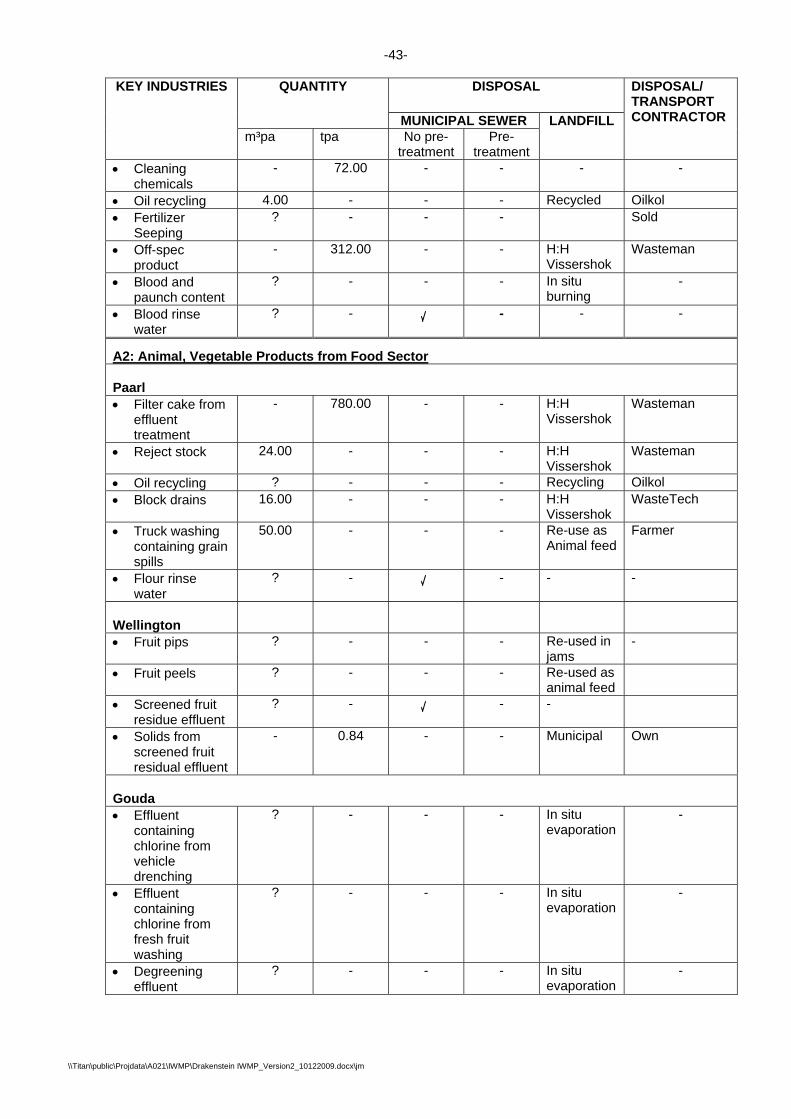
-43-
\\Titan\public\Projdata\A021\IWMP\Drakenstein IWMP_Version2_10122009.docx\jm
KEY INDUSTRIES QUANTITY DISPOSAL DISPOSAL/ TRANSPORT CONTRACTOR MUNICIPAL SEWER LANDFILL
m³pa tpa No pre-treatment
Pre-treatment
• Cleaning chemicals
- 72.00 - - - -
• Oil recycling 4.00 - - - Recycled Oilkol • Fertilizer
Seeping ? - - - Sold
• Off-spec product
- 312.00 - - H:H Vissershok
Wasteman
• Blood and paunch content
? - - - In situ burning
-
• Blood rinse water
? - - - -
A2: Animal, Vegetable Products from Food Sector Paarl • Filter cake from
effluent treatment
- 780.00 - - H:H Vissershok
Wasteman
• Reject stock 24.00 - - - H:H Vissershok
Wasteman
• Oil recycling ? - - - Recycling Oilkol • Block drains 16.00 - - - H:H
Vissershok WasteTech
• Truck washing containing grain spills
50.00 - - - Re-use as Animal feed
Farmer
• Flour rinse water
? - - - -
Wellington
• Fruit pips ? - - - Re-used in jams
-
• Fruit peels ? - - - Re-used as animal feed
• Screened fruit residue effluent
? - - -
• Solids from screened fruit residual effluent
- 0.84 - - Municipal Own
Gouda • Effluent
containing chlorine from vehicle drenching
? - - - In situ evaporation
-
• Effluent containing chlorine from fresh fruit washing
? - - - In situ evaporation
-
• Degreening effluent
? - - - In situ evaporation
-

-44-
\\Titan\public\Projdata\A021\IWMP\Drakenstein IWMP_Version2_10122009.docx\jm
KEY INDUSTRIES QUANTITY DISPOSAL DISPOSAL/ TRANSPORT CONTRACTOR MUNICIPAL SEWER LANDFILL
m³pa tpa No pre-treatment
Pre-treatment
• Fungicide spray onto conveyor
“little” - - - In situ evaporation
-
A3: Drinks Paarl • Wine cellar
effluent with lees
* - - - -
• Pre-cellar grape waste
* - - - Used in agriculture
Farmers
• Distillation cellar effluent
* - - - -
• Machine oils 0.50 - - - Recycle Oilkol • Cider lees 960.00 - - - Re-used as
fertilizer Farmer
• Still bottoms ? - - - Re-used as animal feed
Farmer
• Effluent from anaerobic digester
? - - - -
Wellington • Wine spill
effluent * - - - -
• Acidic washings - - - - -
• Used drums - - - In situ re-use
VinQuip Vel
• Fruit juice effluent
- - - - -
D3: Foundary and Metal Working Operations Paarl • Sheet metal
manufacturing - - - - - -
D4: Metal Finishing and Electroplating Paarl • Electroplating
effluent - - - - -
• Electroplating metal hydroxide
- 4 m silo = estimated 4.00 t in
total
- - In situ storage
-
F7: Chemical and Related Industries Paarl • Soap water
effluent - - - - -
• Mixed chemicals
180.00 - - - H:H Vissershok
Captain Waste
• Health care - 0.42 - - Incinerator Sanumed

-45-
\\Titan\public\Projdata\A021\IWMP\Drakenstein IWMP_Version2_10122009.docx\jm
KEY INDUSTRIES QUANTITY DISPOSAL DISPOSAL/ TRANSPORT CONTRACTOR MUNICIPAL SEWER LANDFILL
m³pa tpa No pre-treatment
Pre-treatment
waste
G1: Mechanical Engineering Paarl • Yoghurt rinse
water ? - - - -
• Gearbox oil 4.00 - - - Recycle Oilkol • Caustic effluent 3.00 - - - -
• Lubricating oil 2.00 -- - - Recycle Oilkol
H1: Textile Paarl • Wet process
rinse water ? - - - -
• Dry process rinse water
? - - - -
• Machine oils ? - - - Recycling Oilkol • Fluorescent
tubes 2.50 - - - H:H
Vissershok WasteTech
• Dying effluent ? - - - -
• Dye drums ? - - - Returned Supplier Wellington • Water soluble
dye effluent ? - - - - -
H2: Hide and Leather Wellington • Wet-blue bovine
trimming and shavings
- 572.00 - - H:H Vissershok
WasteTech
• Wet-blue bovine leather rinse effluent
6240.00 - - Evap Ponds (ex situ)
-
• Leather offcuts, buffing dust, etc
- 1518.00 - H:H Vissershok
WasteTech
• Tan and dye effluent with trivalent chrome and sulphate
58880.00 - - Evap Ponds (ex situ)
-
• Lime effluent with trivalent chromium
180.00 - - - H:H Vissershok
WasteTech
• Trivalent chrome waste
180.00 - - - H:H Vissershok
WasteTech
H3: Timber Wood and Furniture Industry Wellington • CCA Waste - 2.00 in
total - - In situ
storage -

-46-
\\Titan\public\Projdata\A021\IWMP\Drakenstein IWMP_Version2_10122009.docx\jm
KEY INDUSTRIES QUANTITY DISPOSAL DISPOSAL/ TRANSPORT CONTRACTOR MUNICIPAL SEWER LANDFILL
m³pa tpa No pre-treatment
Pre-treatment
I1: Washbay Effluent Paarl • Vehicle
washings - - - - -
• Workshop rinses
- - - - -
J2: Printing, Publishing and Photographic Laboratories Paarl • Spent solvent,
inks, rags, etc. - - - - Removed
by supplier Coats
• Water based ink rinse
0.72 - - - -
• Ink drums - - - - -
• Oil, inks and solvents
- 520.00 - - H:H Vissershok
WasteTech
• Fixer - - - - Recycled CPM • Developer - - - Recycled CPM
• Fixer/developer mixture
0.40 - - - Recycled CPM
• Excess inks and chemicals
2.50 - - - H:H Vissershok
Captain Waste
• Water based glue wash water
1.00 - - - -
• Solvent ink residue in drums
- - - - 1. Sold to 2. Return to
Drums and containers Supplier
• Machine oils See liquid waste below
- - - Recycled Paarl Motors: Rose Foundation
• Mineral oil 0.21 - - - H:H Vissershok
Wasteman
• Fluorescent tubes
120.00 - - - H:H Vissershok
Wasteman
• Liquid waste: IPA, water, ink, mineral oils, etc
- - - - H:H Vissershok
Wasteman
Wellington • Empty drums - - - - Municipal - • Water soluble
rinses - - - - -
Key: * Refer to chapter 2.1.5.6 : Cellar Survey. Comments: The information obtained from the tabulated quantities of hazardous waste generated can be interpreted as follows: • Discharge to sewer volumes are generally unknown • Discharge to sewer is controlled by an irregular municipal sample analyses. • Discharge to sewer is based on the calculation of COD • Industry seldom analyse effluent prior to sewer discharge

-47-
\\Titan\public\Projdata\A021\IWMP\Drakenstein IWMP_Version2_10122009.docx\jm
• Unacceptable chemicals such as photographic developers are washed to sewer • Quantities obtained in Table 2-19 generally refer to hazardous waste removed by
private contractors for H:H or H:h disposal at Vissershok Waste Management Facility (VWMF)
• Health care waste generated by industry is included in the summary below.
2.1.5.4.2 Summary of Quantities
Note: Hazardous waste removed by private contractors is mostly listed and indicate the quantities below.
Assume: 1 m³ = 1 kℓ = 1 ton Variable: Polystyrene was weighed in ton The sub-totals for the Key Industries per Area is as follows: Table 2-19: Known Hazardous Waste Quantities Generated by Industry
KEY INDUSTRY PAARL IN
t pa WELLINGTON IN
t pa GOUDA IN
t pa A1: Agriculture, Forest Management, Fisheries
440.82 - -
A2: Animal & Vegetable Products from Food Sector
870.00 0.84 -
A3: Drink Industry 960.50 - - D3: Foundary & Metal - - D4: Metal Finishing and Electroplating 4.00 - - F7: Chemical and Related Industries 180.00 - - G1: Mechanical Engineering 9.00 - - H1: Textile, Clothing and Foot Wear Industry 2.50 - - H2: Hide and Leather Industry - 67570.00 H3: Timber, Wood and Furniture Industry - - - I1: Washbays 2.00 J2: Printing, Publishing and Photographic Laboratories
644.83 - -
Sub-Totals 3112.07 67572.84 - Hazardous Waste (including Industrial Health Care Waste) in Drakenstein Area: Total = approximately 70684.91 t pa) Table 2-20: Known Hazardous Waste Quantities Generated by Industry – excluding
Industrial Health Care Waste KEY INDUSTRY PAARL IN
t pa WELLINGTON IN
t pa GOUDA IN
t pa A1: Agriculture, Forest Management, Fisheries
439.20 - -
A2: Animal & Vegetable Products from Food Sector
870.00 0.84 -
A3: Drink Industry 960.50 - - D3: Foundary & Metal - - - D4: Metal Finishing and Electroplating 4.00 - - F7: Chemical and Related Industries 180.00 - - G1: Mechanical Engineering 9.00 - - H1: Textile, Clothing and Foot Wear Industry 2.50 - - H2: Hide and Leather Industry - 67570.00 H3: Timber, Wood and Furniture Industry - 2.00 - I1: Washbays - - J2: Printing, Publishing and Photographic Laboratories
644.83 - -
SubTotals 3110.04 67572.84 -

-48-
\\Titan\public\Projdata\A021\IWMP\Drakenstein IWMP_Version2_10122009.docx\jm
Total Hazardous Waste in Drakenstein area (excluding Industrial Health Care Waste) is therefore approximately 70682.88 tons per annum
2.1.5.5 Health Care Risk Waste 2.1.5.5.1 Introduction
A survey was done by the Drakenstein Environmental Health Department during March to May 2003. The information regarding waste types and quantities were insufficient and with the exception of the information available on a few hospitals, the data capturing was repeated. The Health Care Risk Waste originating in the Drakenstein Municipal area is generated by the following concerns: • Medical practitioners • Dentists • Veterinary surgeons • Old age homes • Mortuaries/funeral homes • Private and provincial hospitals • Industrial health care clinics • Private individuals with a small portion of health care waste entering the domestic waste
stream • Sanitary waste • Expired pharmaceuticals No reference was made to anatomical and foetal wastes
All Health Care Risk Waste is regarded as hazardous Rating 7, unless delisted.
2.1.5.5.2 Health Care Risk Waste Quantities
2.1.5.5.2.1 Introduction
The Paarl and Wellington health care generators are confident that they do a good job when their waste is removed by the well known private contractors operating an incinerator as final disposal method.
2.1.5.5.2.2 Standards
The agreement on standardized weights was reached in consultation with various doctors, sisters and disposal contractors. The average standard weights and volume-weight conversions used are given in Table 2-21 below:
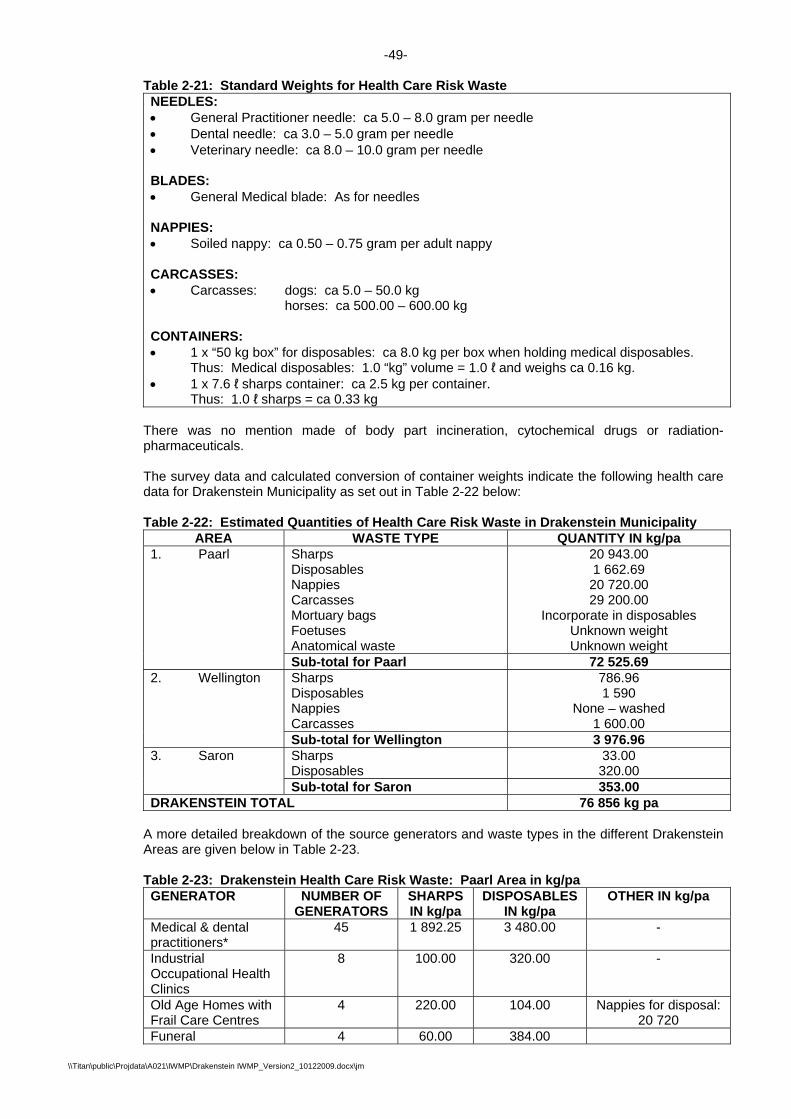
-49-
\\Titan\public\Projdata\A021\IWMP\Drakenstein IWMP_Version2_10122009.docx\jm
Table 2-21: Standard Weights for Health Care Risk Waste NEEDLES: • General Practitioner needle: ca 5.0 – 8.0 gram per needle • Dental needle: ca 3.0 – 5.0 gram per needle • Veterinary needle: ca 8.0 – 10.0 gram per needle BLADES: • General Medical blade: As for needles NAPPIES: • Soiled nappy: ca 0.50 – 0.75 gram per adult nappy CARCASSES: • Carcasses: dogs: ca 5.0 – 50.0 kg
horses: ca 500.00 – 600.00 kg CONTAINERS: • 1 x “50 kg box” for disposables: ca 8.0 kg per box when holding medical disposables. Thus: Medical disposables: 1.0 “kg” volume = 1.0 ℓ and weighs ca 0.16 kg. • 1 x 7.6 ℓ sharps container: ca 2.5 kg per container. Thus: 1.0 ℓ sharps = ca 0.33 kg
There was no mention made of body part incineration, cytochemical drugs or radiation-pharmaceuticals. The survey data and calculated conversion of container weights indicate the following health care data for Drakenstein Municipality as set out in Table 2-22 below: Table 2-22: Estimated Quantities of Health Care Risk Waste in Drakenstein Municipality
AREA WASTE TYPE QUANTITY IN kg/pa 1. Paarl Sharps
Disposables Nappies Carcasses Mortuary bags Foetuses Anatomical waste
20 943.00 1 662.69 20 720.00 29 200.00
Incorporate in disposables Unknown weight Unknown weight
Sub-total for Paarl 72 525.69 2. Wellington Sharps
Disposables Nappies Carcasses
786.96 1 590
None – washed 1 600.00
Sub-total for Wellington 3 976.96 3. Saron Sharps
Disposables 33.00 320.00
Sub-total for Saron 353.00 DRAKENSTEIN TOTAL 76 856 kg pa
A more detailed breakdown of the source generators and waste types in the different Drakenstein Areas are given below in Table 2-23. Table 2-23: Drakenstein Health Care Risk Waste: Paarl Area in kg/pa GENERATOR NUMBER OF
GENERATORS SHARPS IN kg/pa
DISPOSABLES IN kg/pa
OTHER IN kg/pa
Medical & dental practitioners*
45 1 892.25 3 480.00 -
Industrial Occupational Health Clinics
8 100.00 320.00 -
Old Age Homes with Frail Care Centres
4 220.00 104.00 Nappies for disposal: 20 720
Funeral 4 60.00 384.00

-50-
\\Titan\public\Projdata\A021\IWMP\Drakenstein IWMP_Version2_10122009.docx\jm
Parlours/Mortuaries (Mortuary Bags) Hospitals and Clinics (excl Hermon)
10 18 453.40 1 661 635.00
Veterinary Surgeons 3 217.5 1 152.00 Carcasses: 29 200
TOTALS 74 20 943 1 667 075 (including
mortuary bags)
Nappies: 20 720 Carcasses: 29 200
Note: No indication of anatomical and foetal waste quantities were provided to the Environmental Health Officers by the hospitals, provincial and/or private. Key: * Of the 57 listed doctors, some were incorporated into other practices or not practising
any longer. Only 40 doctors/doctor partnerships and 5 dentists were identified. The Wellington Health information is given in Table 2-24 below: Table 2-24: Drakenstein Health Care Risk Waste: Wellington Area in kg/pa
GENERATOR NUMBER OF GENERATOR
S
SHARPS IN kg/pa
DISPOSABLES IN kg/pa
OTHER IN kg/pa
Medical & dental practitioners*1
9 473.00 870.00 -
Industrial Occupational Health Clinics
0 - - -
Old Age Homes with Frail Care Centres
1 10.00 - Nappies are washed =
0 kg Funeral Parlours/Mortuaries
3 - - -
Hospitals and Clinics*2 5 300.00 720.00 - Veterinary Surgeons 3 3.96 - Carcasses:
1 600 kg TOTALS 21 786.96 1 590 Carcasses: 1
600.00 kg Key: *1 Although 9 practitioners were identified by the EHO in the 2003 report, a 25 % quantity
was calculated based on Wellington being ca 25 % of Paarl’s residents. *2 There is no hospital in Wellington, only 5 medical clinics. The Saron, Hermon and Gouda Health Care information are given in Table 2-25 below: Table 2-25: Drakenstein Health Care Risk Waste Saron, Hermon and Gouda in kg/pa
GENERATOR NUMBER OF GENERATORS
SHARPS IN kg/pa
DISPOSABLES IN kg/pa
OTHER IN kg/pa
Saron Clinic 1 33.00 320.00 - Hermon* 1 * * - Gouda - * * - TOTAL 33.00 320 -
Key: * No quantities available. “Very little” taken to PPC Riebeek Kasteel for disposal. SUMMARY OF HEALTH CARE WASTE IN DRAKENSTEIN Table 2-26: Summary of Health Care Risk Waste in Drakenstein
WASTE TYPE PAARL kg/pa WELLINGTON kg/pa SARON kg/pa GOUDA kg/pa Sharps in kg/pa 20 943.15 786.96 33.00
Inco
rpor
ate
d in
Paa
rl
Disposables in kg/pa
1 667 075.00 1 590.00 320.00

-51-
\\Titan\public\Projdata\A021\IWMP\Drakenstein IWMP_Version2_10122009.docx\jm
Other in kg/pa 49 920.00 1 600.00 -
Sub Totals 1 737 938.15 3 976.96 352.00 -
Equivalent value in tons/annum
1 737.94 tpa 3.98 tpa 0.35 tpa -
Total Health Care Risk Waste Generated in Drakenstein Municipality is approximately 1,742.27 tpa consisting of: Sharps = 21.76 tpa Disposables = 1,668.99 tpa Other (nappies, carcasses, sanitary) = 51.52 tpa
2.1.5.6 Hazardous Waste: Cellar Waste
2.1.5.6.1 Introduction
A total of 38 cellars were telephonically interviewed in the Paarl and Wellington areas. There is 31 listed in the Paarl tourist brochure (Passport to Paarl – Travel Companion: www.paarlonline.com) and 7 in Wellington Tourism & Wine Routes. The cellar sizes vary from the processing 400 t of grapes per season to > 4 000 t pa.
2.1.5.6.2 Hazardous Waste
There are mainly three types of waste arising namely: • Pips and peels from the pressing • Cellar lees from the fermentation, and • Effluent: wash water containing cellar spills
2.1.5.6.3 Quantities
• Pips and peels
The exact quantity is unknown. • Cellar lees
The exact quantity is unknown. • Effluent
An average of 1 ton grapes produces 700 ℓ wine. In the production of wine ca 6 ℓ effluent is generated per 1 ℓ wine. Fact sheet Thus: 1 ton processed grapes in wine making produces 4 200 ℓ effluent. The total effluent volume generated is not known. Refer to the summary in Annexure A of the individual cellars.
2.1.5.6.4 Disposal
• Pips and Peels
The smaller vineyards dispose of their pips and peels in situ. DWAF generally requires a impermeable base area with draining trenches and a bund wall around the in situ disposal area. Drainage effluent should be incorporated in the effluent treatment procedure. This requirement is stipulated in schedule 22(3) (General Authorisation) and 21(e) (Controlled Action) of the National Water Act (Act 36 of 1998). The statutory regulations into article 39 or the National Water Act (Act 36 of 1998) refers for General Authorisation

-52-
\\Titan\public\Projdata\A021\IWMP\Drakenstein IWMP_Version2_10122009.docx\jm
and must be read in conjunction with the Regulations into article 26. The regulations for both articles were issued as Regulation 1191 of 18 October 1999. (Government Gazette no 20526). The regulations were reviewed and will be re-published during the end of February 2004.
• Wash water The guidelines and regulations for effluent wash water from the cellars are given in the above regulations (see Pips and Peels). In brief: • Disposal of 50 m³ per day of COD < 5 000 ppm by irrigation on grassland is allowed.
(DWAF is not satisfied with this procedure). • Disposal of 500 m³ per day of COD < 400 ppm by irrigation. This is typical post
oxidation dam effluent and works well as irrigation water. • No accumulation of untreated effluent is allowed. If the effluent is kept untreated in a
dam, a permit will be required. Unlimited size storage is not allowed. • Better effluent management is encouraged at cellars.
The quantity of wash water is not known. Refer to Annexure A for a summary of the waste and effluent management at the different cellars. Only two (2) of the wine cellars in Drakenstein practise in-situ disposal of their pips, peels and lees. The remainder of the cellars either compost it or sell it to composting companies, grapeseed oil manufacturers or Brenochem in Wolseley. Effluent management is mainly through irrigation, formal and informal, with only five (5) cellars discharging to municipal sewer. There are only fourteen (14) of the thirty one (31) cellars in Paarl which have or are in the process of obtaining DWAF permits for the use of treated effluent for irrigation. There are no cellars in Wellington with DWAF irrigation permits.
The totals of Health Care Waste (Industry and other) as well as other Hazardous Waste for Drakenstein are in Table 2-27 below.
Table 2-27: Total Health Care and Hazardous Waste Quantities: Drakenstein Municipality
WASTE SOURCE PAARL t pa
WELLINGTON t pa
HERMON/GOUDA t pa
SARON t pa
Health Care Waste 1,737.94 3.98 - 0.35 Hazardous Industrial Waste 3,110.04 67,572.84 - - SubTotals 4,847.98 67,576.82 - 0.35
The combined Industrial Hazardous Waste and Health Care Waste for the Drakenstein area is therefore approximately 72,425.15 tons per annum.
2.1.5.6.5 Hazardous Waste
High hazard wastes with a Minimum Requirements hazard rating of 1 and 2 are generated in the Drakenstein District. Most of the high hazard waste is handled in a responsible manner. The summary in Table 2-28 below provides an overview of the area, hazardous waste type, key industry generator and disposal thereof. Health Care Waste is detailed in chapter 2.1.5.5. Table 2-28: Drakenstein High Hazardous Waste
KEY INDUSTRY
WASTE TYPE WASTE QUANTITY
HAZ RATING
DISPOSAL IN DRAKENSTEIN
PERMANENT STORAGE OUTSIDE
DRAKENSTEIN
COMMENTS
A2 Caustic effluent from fig jam production
Part of main effluent
3 In situ treatment prior to sewer discharge in Paarl
Filtercake to H:H Vissershok
The in-situ effluent treatment operated by G E Betz release neutral effluent
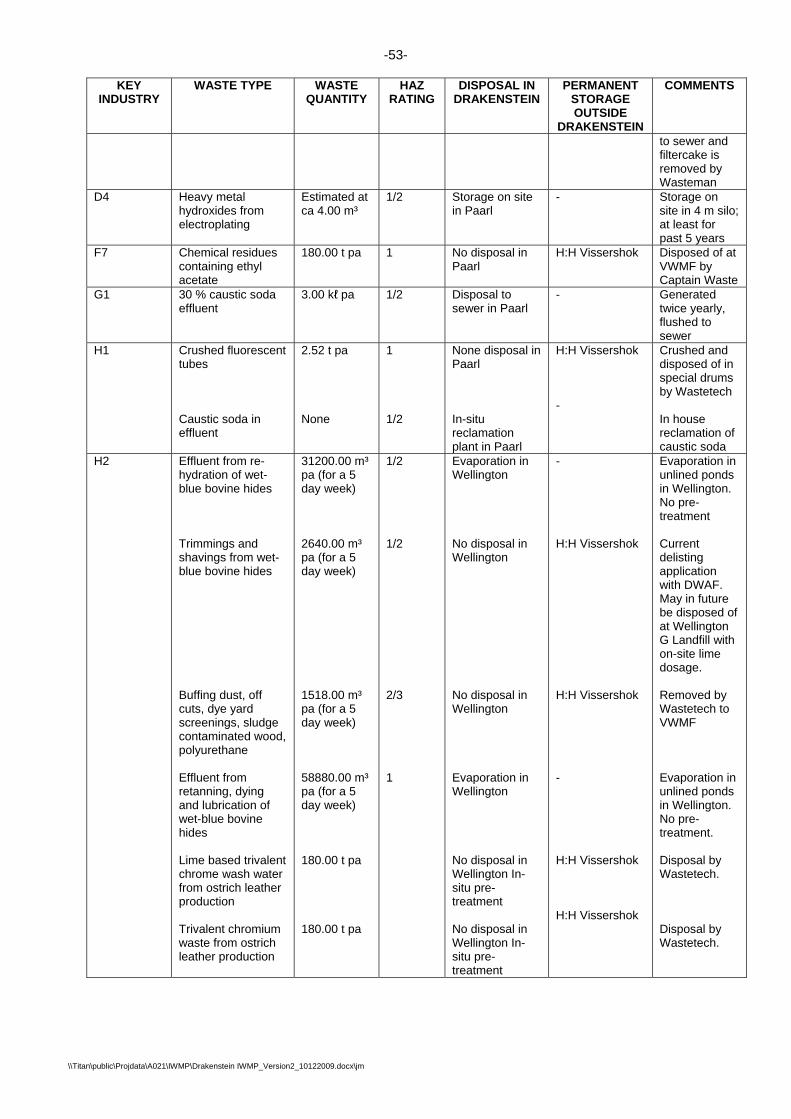
-53-
\\Titan\public\Projdata\A021\IWMP\Drakenstein IWMP_Version2_10122009.docx\jm
KEY INDUSTRY
WASTE TYPE WASTE QUANTITY
HAZ RATING
DISPOSAL IN DRAKENSTEIN
PERMANENT STORAGE OUTSIDE
DRAKENSTEIN
COMMENTS
to sewer and filtercake is removed by Wasteman
D4 Heavy metal hydroxides from electroplating
Estimated at ca 4.00 m³
1/2 Storage on site in Paarl
- Storage on site in 4 m silo; at least for past 5 years
F7 Chemical residues containing ethyl acetate
180.00 t pa 1 No disposal in Paarl
H:H Vissershok Disposed of at VWMF by Captain Waste
G1 30 % caustic soda effluent
3.00 kℓ pa 1/2 Disposal to sewer in Paarl
- Generated twice yearly, flushed to sewer
H1 Crushed fluorescent tubes
Caustic soda in effluent
2.52 t pa None
1 1/2
None disposal in Paarl In-situ reclamation plant in Paarl
H:H Vissershok -
Crushed and disposed of in special drums by Wastetech In house reclamation of caustic soda
H2 Effluent from re-hydration of wet-blue bovine hides Trimmings and shavings from wet-blue bovine hides Buffing dust, off cuts, dye yard screenings, sludge contaminated wood, polyurethane Effluent from retanning, dying and lubrication of wet-blue bovine hides Lime based trivalent chrome wash water from ostrich leather production Trivalent chromium waste from ostrich leather production
31200.00 m³ pa (for a 5 day week) 2640.00 m³ pa (for a 5 day week) 1518.00 m³ pa (for a 5 day week) 58880.00 m³ pa (for a 5 day week) 180.00 t pa 180.00 t pa
1/2 1/2 2/3 1
Evaporation in Wellington No disposal in Wellington No disposal in Wellington Evaporation in Wellington No disposal in Wellington In-situ pre-treatment No disposal in Wellington In-situ pre-treatment
- H:H Vissershok H:H Vissershok - H:H Vissershok H:H Vissershok
Evaporation in unlined ponds in Wellington. No pre-treatment Current delisting application with DWAF. May in future be disposed of at Wellington G Landfill with on-site lime dosage. Removed by Wastetech to VWMF Evaporation in unlined ponds in Wellington. No pre-treatment. Disposal by Wastetech. Disposal by Wastetech.

-54-
\\Titan\public\Projdata\A021\IWMP\Drakenstein IWMP_Version2_10122009.docx\jm
KEY INDUSTRY
WASTE TYPE WASTE QUANTITY
HAZ RATING
DISPOSAL IN DRAKENSTEIN
PERMANENT STORAGE OUTSIDE
DRAKENSTEIN
COMMENTS
H3 Sand and spills of copper -chrome-arsenic (CCA), also known as tanolith
2.00 ton 1 Permanent in-situ storage in Wellington
- In situ storage in 100 ℓ drums. To expensive to use private contractors for disposal at VWMF
J2 Spent solvents, inks, rags and cleaning material waste Water soluble ink and solvent based ink effluent Spent fixer as well as fixer developer mixture from development of photographs Excess chemicals and ink waste Printing rinses Solvent based ink residue in drums Empty ink containers/ drums Fluorescent tubes Mineral oil waste Liquid effluent containing mineral oil, white spirits, ISO propyl alcohol (IPA), etc Empty ink drums
Unknown 520.00 kℓ pa 0.40 m³ pa 2.50 m³ pa Unknown Unknown Unknown 0.21 Unknown see liquid Effluent below 120.00 m³ pa Unknown
2/3 2 2 2 2/3 2 2/4 1 1 2 2/3
No disposal in Paarl No disposal in Paarl No disposal in Paarl No disposal in Paarl Discharge to sewer in Paarl No disposal in Paarl No disposal in Paarl No disposal in Paarl No disposal in Paarl No disposal in Paarl Disposal on Wellington municipal landfill
Removed to Cape Town H:H Vissershok CPM in Cape Town H:H Vissershok - Returned to Supplier in Cape Town Sold to container supplier in Cape Town H:H Vissershok H:H Vissershok H:H Vissershok -
Removed by supplier: Coats Removed by Wastetech Reclamation of metals by Cape Precious Metals. All effluents originate in Paarl only. Captain Waste This effluent is not clearly defined and should be re-assessed prior to sewer discharge Returned to supplier Sold to drums in containers Removed by Wasteman Incorporated into liquid effluent stream containing spent solvents Liquid effluent transported by Wasteman to VWMF for treatment This waste is not clearly defined. It may be empty water soluble ink drums which is
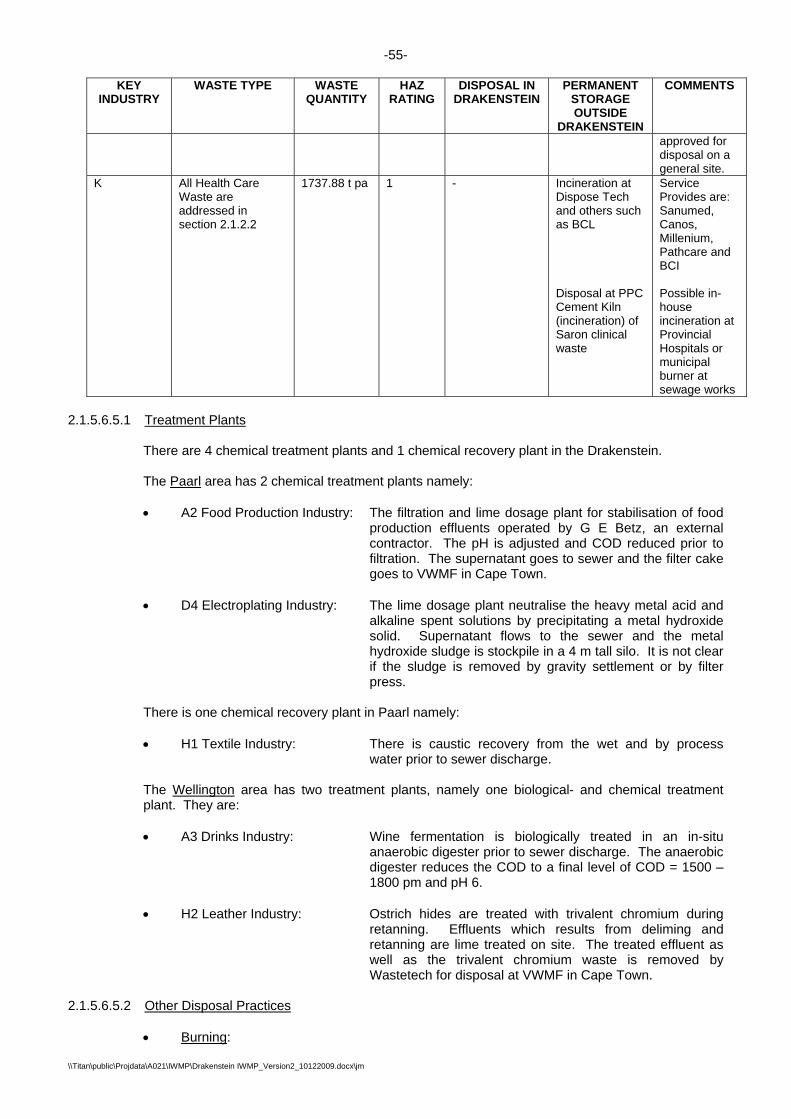
-55-
\\Titan\public\Projdata\A021\IWMP\Drakenstein IWMP_Version2_10122009.docx\jm
KEY INDUSTRY
WASTE TYPE WASTE QUANTITY
HAZ RATING
DISPOSAL IN DRAKENSTEIN
PERMANENT STORAGE OUTSIDE
DRAKENSTEIN
COMMENTS
approved for disposal on a general site.
K All Health Care Waste are addressed in section 2.1.2.2
1737.88 t pa 1 - Incineration at Dispose Tech and others such as BCL Disposal at PPC Cement Kiln (incineration) of Saron clinical waste
Service Provides are: Sanumed, Canos, Millenium, Pathcare and BCI Possible in-house incineration at Provincial Hospitals or municipal burner at sewage works
2.1.5.6.5.1 Treatment Plants
There are 4 chemical treatment plants and 1 chemical recovery plant in the Drakenstein. The Paarl area has 2 chemical treatment plants namely: • A2 Food Production Industry: The filtration and lime dosage plant for stabilisation of food
production effluents operated by G E Betz, an external contractor. The pH is adjusted and COD reduced prior to filtration. The supernatant goes to sewer and the filter cake goes to VWMF in Cape Town.
• D4 Electroplating Industry: The lime dosage plant neutralise the heavy metal acid and
alkaline spent solutions by precipitating a metal hydroxide solid. Supernatant flows to the sewer and the metal hydroxide sludge is stockpile in a 4 m tall silo. It is not clear if the sludge is removed by gravity settlement or by filter press.
There is one chemical recovery plant in Paarl namely: • H1 Textile Industry: There is caustic recovery from the wet and by process
water prior to sewer discharge. The Wellington area has two treatment plants, namely one biological- and chemical treatment plant. They are: • A3 Drinks Industry: Wine fermentation is biologically treated in an in-situ
anaerobic digester prior to sewer discharge. The anaerobic digester reduces the COD to a final level of COD = 1500 – 1800 pm and pH 6.
• H2 Leather Industry: Ostrich hides are treated with trivalent chromium during
retanning. Effluents which results from deliming and retanning are lime treated on site. The treated effluent as well as the trivalent chromium waste is removed by Wastetech for disposal at VWMF in Cape Town.
2.1.5.6.5.2 Other Disposal Practices
• Burning:

-56-
\\Titan\public\Projdata\A021\IWMP\Drakenstein IWMP_Version2_10122009.docx\jm
A1 Abattoir: Blood and paunch contents are burned on site (in situ) • Evaporation: H2 Leather Industry: Wellington has a series of unlined clay dams used for
evaporation of trivalent chrome based effluent arising from the bovine tanning industry.
A2 Food Product Industry: Gouda has a export fruit industry which evaporate all
effluents in an in situ pond. The chemicals are notifyable. However, the fruit is for human consumption and the effluent should biodegrade in the ponds. There is no known DWAF permitting of the evaporation pans.
• Unauthorised Discharge to Sewer: G1 Mechanical Engineering Industry: The 6 monthly release of 1.5 kℓ 30 % caustic soda in
the Paarl is suspect. A3 Drinks Industry: Dilute acidic wash water in the drinks industry (A3) in
Wellington’s New Industrial park may be an unauthorised procedure.
J2 Printing Industry: Release of developer to sewer in the Paarl area is a
suspect practice. There are discharged of various printing rinses into the Paarl sewer. The quality of the effluent generated by the Printing Industry prior to sewer discharge should be monitored.
D4 Electroplating Industry: The quality of the electroplating effluent to sewer
should be closely monitored for sewer transgressions.
• Municipal Landfill: J2 Printing Industry: In the Wellington area, a printing industry disposes of
empty water soluble ink drums on landfill. • Municipal Burner: Health Care Industry: The possible burning of health care waste at the
sewage treatment works should be investigated. • Other Burners: Health Care Industry: The use of provincial burners at hospitals was not
further investigated. The EHO report of March 2003 indicated this possibility.
The use of the PPC Cement kiln burner for
destruction of health care waste from Saron Clinic should be officially addressed.
• Crushing and pre-treatment of fluorescent tubes: A1 Agricultural Industry: Fluorescent tubes are crushed in a custom made
container which is removed to VWMF for pre-treatment and disposal.
J2 Printing Industry: Fluorescent tubes are crushed in a custom made
container which is removed to VWMF for pre-treatment and disposal.

-57-
\\Titan\public\Projdata\A021\IWMP\Drakenstein IWMP_Version2_10122009.docx\jm
H1 Textile Industry: Fluorescent tubes are crushed in a custom made
container which is removed to VWMF for pre-treatment and disposal.
2.1.5.6.6 Movement of Waste into or out of Drakenstein
Table 2-28 in chapter 2.1.5.6.5 lists in detail waste disposed of outside Drakenstein. There is no known industrial hazardous waste entering Drakenstein for permanent storage or disposal within Drakenstein. There are a total of 17 listed waste types disposed of outside Drakenstein. There is permanent storage of two highly hazardous waste types within Drakenstein, namely CCA waste generated in the Timber industry (H3) and heavy metal hydroxides generated in the Electroplating industry (D4).
2.1.5.6.7 Container Management
There are nine industries in Drakenstein which supplied information on container management. There are six industries in Paarl and three in Wellington. The summary of container management is given below:
• Paarl Area
Industries generating and managing empty containers: J2 – Four printing companies H1 – Two textile companies Number of containers: Unknown Concerns receiving the containers: Coats as supplier; Protea Chemicals as supplier; one unknown printing ink supplier and Drums and Containers.
• Wellington Area
Industries generating and managing empty containers: A3 – One drink manufacturer J2 – One printing press H3 – One timber treatment plant Number of containers: Unknown Concerns receiving the containers: Wellington municipal landfill; re-use by drink manufacturer and return to supplier of CCA chemicals, namely Koppers Arch in Natal or Woodline in Kuilsriver.
2.2 WASTE AVOIDANCE
2.2.1 Existing Waste Avoidance in Drakenstein Various waste minimization efforts are being practiced in Drakenstein as referred to elsewhere in this report, but the ideal is to avoid the creation of waste in the first place. The following diagram illustrates the proposed shift in approach of various waste handling options:

\\\Titan\public\Projdata
Waminingeautchotime In tpurnor On theand Wafull At tin Simpchaeducasthropenbecto a In Dindthe TheMuavothe
a\A021\IWMP\Draken
aste avoidancnimize the voenious and itomotive induosen and deves in the pro
the home, wrposes than rm.
a governme production d nasty waste
aste avoidancprocess dep
the moment South Africaportance of wance of succucation proceses (e.g. alteough their innalties to forcome a real aaddress this
Drakenstein, ustries on a Municipality
e industry winicipality wi
oidance for th municipality
nstein IWMP_Versio
ce refers to aolume of wasmaginative iustry where veloped to re
oduction of th
waste avoidanthe original
ental / legislaof alternative bag that us
ce is a “begipicted above
waste minima. Once thawaste reducess. It thereess. Presenernative raw nternational rce the impleand enforcedin any Munic
the best plavoluntary ba
y may be mut
ill receive poll be takinghe benefit of
y initiated in 2
n2_10122009.docx\j
a pro-active aste, by not crdeas. A gooleading maneduce the reqhe vehicle.
nce can be intent, possi
ative level, thve types of bsed to end u
inning of the.
mization (secat can be sution, can re-
efore follows ntly the avoid
products), aexperience ementation od issue in Socipal waste s
ace to start imasis (e.g. KWtually benefic
ositive advertg a leading f all in the co2006 can be
-58-
m
approach byreating the wod example
nufacturers hquired dispo
practiced bybly suggesti
he introductiobags, which p littering ou
e pipe” action
cond tier) thruccessfully im-use at sourthat waste a
dance of wasand only largin this field. of waste avoouth Africa instrategy.
mplementing WV, BAT). Acial.
tising of thesrole in Sou
ommunity anconsidered
y industrial aswaste in the fi
of industrial ave changedsal thereof.
y similar effong that one
on of a levy oare re-useabr surroundin
n that can on
ough recovemplemented rce (third tieravoidance wiste has a finge corporatio European
oidance. Wn the near fut
waste avoidA joint ventu
se “green” inuth Africa thnd the enviroa good point
s well as domirst place. Thwaste avoidd the materiaSome plasti
rts where itepurchases a
on plastic shble and thergs.
nly work whe
ery (fourth tieand the pe
r) be implemill be the ultim
nancial detrimons are ablegovernment
Without a douture, and it w
dance would re effort betw
nitiatives throhrough pro-
onment. Thet of departure
mestic wastehis approachance is to beals used to bcs can be re
ems are usedalternative pr
hopping bagsrefore avoidi
en people un
er) is consideople are ed
mented with mate and finmental implice to take thets often offeubt, waste awould be sho
be at the weween such i
ough the medactively spa
e annual Wae.
e producers th needs some found in thbe specificalle-used up to
d for differenroducts to th
s has spurreng the chea
nderstand th
ered a prioritucated in tha reasonabl
nal step in thication in mose leading roler incentives avoidance wort-sighted no
ell-establishendustries an
dia, whilst thawning wastste week tha
to me he ly 6
nt he
ed ap
he
ty he le is st le /
ill ot
ed nd
he te at

-59-
\\Titan\public\Projdata\A021\IWMP\Drakenstein IWMP_Version2_10122009.docx\jm
2.3 COLLECTION SYSTEMS
2.3.1 Operational Detail For Collection Vehicles
PERSON IN CHARGE: Mr. Frikkie Filies. FLEET: 15 compactors of which two are scrapped but still used when required AREA: The total geographic area. TOWNS: Paarl and Wellington VILLAGES: Saron, Hermon, Gouda, Voëlvlei dam, Swartland Water Works. RURAL: Rural areas from Allandale prison (near Malmesbury), Boland landbou area,
Windmeul, Agter Paarl, Simondium area, area around Victor Verster and Wemmershoek road in Paarl area. Also farms from Bainskloof to the south.
NOTES: • The rule of thumb is not to work on Public Holidays. When planning the calendar, it is designed to
“move one day on”, when public Holidays are encountered. When doing a collection route on a Public Holiday-> double pay.
• Saturdays: Only skip collection with compactors
• The compactor fleet of 15 vehicles is all 19.4 m3 except for the Isuzu F800 which is 15m3. Of the 15 compactors, there are 12 wheelie bin loaders and 3 skip loaders. Out of the 12 wheelie bin loaders [(11 x 19.4m3) + (1 x 15m3)], there are 3 old vehicles used as spare compactors (C80430; C80476 and C80230).
• The two new compactors at the HO that are not commissioned yet and are not sufficient in terms
of new or replacement vehicles. The new 19m3 wheelie-bin lifter will replace a similar size wheelie-bin lifter. There is no 19m3 skip-loader to replace the old 19m3skip-loader (C81930). A new 15m3 wheelie bin lifter will replace the current 15m3 wheelie bin lifter for CBD collections.
• The 19.4m3 compactors C80756; C80930and C81930 do not have fitted wheelie bin- lifters. They
have fitted skip hooks only and are used exclusively for the lifting of skip bins. C80756 and C80930 are scrapped vehicles. However, they are still used when there are breakdowns.
• Of the 15 compactors, 10 are always in the field.
• On average, Mr. Filies allows 4 hours for a compactor to be filled during normal residential rounds;
otherwise he is dissatisfied and calls it “voete-sleep!”
• A colour coded calendar for residential collection routes is planned internally (Jolene) for each year ahead. National Voting Day was not planned for. All the required vehicles worked on that day as normal -> double pay.
• The colour coded calendar does not apply to skip collections or to CBD business and industry
collections.
• Colour coded calendar : o Wellington = Yellow (Y). There is a small red area in Wellington even if Wellington is a
designated yellow. The area is Newton and van Wyksvlei o Paarl East is blue (B) and green (G) o Paarl North is red (R.) o Paarl Central is purple (P) o The report shows half (1/2) and quarter (1/4) loads in fractions while hours and fractions of
hours are given in decimals e.g.: half hour= 0.5 hr • All residential areas, business, industry, schools, etc are serviced except when a private contractor
is used as in the case of Victor Verster Prison, Boland Landbou School, etc. However, there are a few houses not serviced in Hermon. The 13-14 houses belonged to Transnet and were sold to a private developer. No service is provided.
• All collection compactors are weighed in Paarl at the weighbridge prior to disposal at Wellington landfill as the landfill weighbridge is still not commissioned.

-60-
\\Titan\public\Projdata\A021\IWMP\Drakenstein IWMP_Version2_10122009.docx\jm
• Compactors servicing Wellington and Mbekweni are not weighed prior to disposal due to the lack
of an operational weighbridge at Wellington Landfill.
• When it rains, the public is slow to place bins on the pavement on collection day. This causes a major problem during the next round as the vehicle fills quickly. This is very prominent in Wellington.
• Drakenstein does not really have an In-season or Out-of-season disparity as in coastal holiday
towns. However, the waste increase over December and January is usually 10-20% by volume.
• All Odo-readings in the report are given as for end April 2009. Table 2-29: Collection Fleet
Registration number
Roads Number
Make & Model Volume in m3
Capacity in ton
Year Odo Reading in
km CJ 28204 C80426 Nissan UD 290 19.4 10 1999 125 734CJ 20778 C80430 Nissan UD 290 19.4 10 1998 83 503CJ 25169 C80476 Nissan UD 290 19.4 10 2000 94 547CJ 81976 C80230 Merc B 2426 19.4 10 1996 153 240CJ 23378 C80756 Merc B 2219 19.4 10 1990 170 269CJ 41855 C80930 Merc B 2219 19.4 10 2001 275 900CJ 46139 C80970 Nissan UD 290 19.4 10 2003 115 479CJ 64483 C81930 Nissan UD 290 19.4 10 2006 107 804CJ 64482 C81931 Nissan UD 290 19.4 10 2006 72 774CJ 11277 C81932 Nissan UD 290 19.4 10 2006 58 051CJ 65484 C81933 Nissan UD 290 19.4 10 2006 63 371CJ 12610 C81935 Nissan UD 290 19.4 10 2006 52 192CJ 26133 C81936 Nissan UD 290 19.4 10 2006 51 109CJ 50040 C81960 Nissan UD 290 19.4 10 2007 40 230CJ 63836 C81976 Isuzu F800 15 8 2008 9 932
Table 2-30: Description of Service Areas in Paarl
Paarl Town: Description of Service areas as suburbs and/or “lane” areas Suburbs/ areas with :
Paarl South (S) Paarl North (R) Paarl Central (P)
Paarl East (G&B) Suburb D I Suburb D I Suburb D I
Formal houses
Courtrai Vrykyk De Zoete Inval (Simondium)
- Lemoen-kloof
- Dennebug Lanes in CBD
Klein Parys Amstelhoff Mountain View Riverside Rubbishdale Chicago Magnolia Groenheuwel Charlston Hill New Orleans Lantana
H H H H H
DF DF DH H
H&F F&M
RDP houses - - Mbekweni H - Milky Town Smarty Town Project 59
H H H
Informal houses without formal addresses
Brickfields Simondium
DH DH
Mbekweni Drommedaris
DH DH
- Lovers Lane Chester Williams Fairy Glen Colby street Kingston Town
DH DH DH DH DH
Key: H= Private houses DH= Densely constructed Houses DI= Density Indicator M=Municipal houses F= Flats DF= Densely constructed Flats

-61-
\\Titan\public\Projdata\A021\IWMP\Drakenstein IWMP_Version2_10122009.docx\jm
Table 2-31: Description of Service Areas in Wellington Wellington Town: Description of Service areas as suburbs and or “lane” areas
Suburbs/ areas with :
Suburbs in Yellow DI Suburbs in red DI
Formal houses Berg-en-Dal Rezandale Ghost Town Champagne Weltevrede Uitsig=”lanes” (Lane numbering stop after a while and the “following” lane is called Uitsig Paton Place
-
DH
Van Wyksvlei Newtown East Newtown West
-
RDP houses New Rest H - - Informal houses without formal addresses
O R Tambo DH - -
Key: Refer Paarl above
2.3.2 Collection Calender The colour coded areas are described as follows: • Wellington = Yellow (Y). There is a small red area in Wellington even if Wellington is a designated
yellow. The area is Newton and van Wyksvlei • Paarl East is blue (B) and green (G) • Paarl North is red (R.) • Paarl Central is purple (P) Public Holidays are shown in black. No work is done on Public holidays except when no other choice exists, such as voting day and when more than 7 days expire between collections in Saron, Hermon and Gouda. Table 2-32: Collection day Calendar for Drakenstein
MAR 2009 APR 2009 MEI 2009 M T W T F S S M T W T F S S M T W T F S S
1 1 2 3 4 5 1 2 3 2 3 4 5 6 7 8 6 7 8 9 10 11 12 4 5 6 7 8 9 10 9 10 11 12 13 14 15 13 14 15 16 17 18 19 11 12 13 14 15 16 17
16 17 18 19 20 21 22 20 21 22 23 24 25 26 18 19 20 21 22 23 24 23 24 25 26 27 28 29 27 28 29 30 25 26 27 28 29 30 30 31
JUN 2009 JUL 2009 AUG 2009 M T W T F S S M T W T F S S M T W T F S S
1 2 3 4 5 6 7 1 2 3 4 5 1 2 8 9 10 11 12 13 14 6 7 8 9 10 11 12 3 4 5 6 7 8 9
15 16 17 18 19 20 21 13 14 15 16 17 18 19 10 11 12 13 14 15 16 22 23 24 25 26 27 28 20 21 22 23 24 25 26 17 18 19 20 21 22 23 29 30 27 28 29 30 31 24 25 26 27 28 29 30
31
SEP 2009 OKT 2009 NOV 2009 M T W T F S S M T W T F S S M T W T F S S
1 2 3 4 5 6 1 2 3 4 1 7 8 9 10 11 12 13 5 6 7 8 9 10 11 2 3 4 5 6 7 8
14 15 16 17 18 19 20 12 13 14 15 16 17 18 9 10 11 12 13 14 15 21 22 23 24 25 26 27 19 20 21 22 23 24 25 16 17 18 19 20 21 22 28 29 30 26 27 28 29 30 31 23 24 25 26 27 28 29

-62-
\\Titan\public\Projdata\A021\IWMP\Drakenstein IWMP_Version2_10122009.docx\jm
2.3.3 Street Cleaning and Clean Green PERSON IN CHARGE: Mr. Johan de Greeff FLEET: The fleet consists of tractor trailers for waste related collection AREA: Greater Paarl area. CLEAN GREEN: This is a different project than the one controlled by Martin van
Zitters. Mr. van Zitters controls the informal waste removal called:”Municipal Cleansing Project” where the Cleansing Department pays private contractors to collect waste in areas where there are no formal addresses.
Clean Green is a project co-ordinated by the municipality with- and on behalf of the ward councilors. Funding is through the Council and not the departmental budget. The Council thus pays the salaries and equipment such as spades, brooms and rakes. However, Cleansing directly pays for the black bags supplied and indirectly for the use of the weighbridge and disposal via the Paarl transfer station.
The role of the councilor: Once appointed, every ward councilor can choose 3 projects for
community upliftment and job creation in his/her wards. One of the projects normally chosen is Clean Green. Not all the wards can have Clean Green projects running at the same time. There are usually 2-3 wards running a Clean Green Project concurrently for a period of 3 months at a time, prior to changing to different wards. The working schedule is Mondays to Fridays. For a set daily fee, the ward councilor appoints a person from his/her ward owning a LDV. This person acts as the driver and coordinator.
The role of the coordinator: The coordinator appoints a team consisting of 10-15 people from the
same ward, employed as workers. The function of the team is to clean a designated area by weeding pavements and roads as well as collecting vegetative waste and litter in designated areas. The workers physically clean the area, place the waste in black bags which the driver takes to the weighbridge for recording, before disposing of the bags “free” of charge at the Paarl transfer station.
The Cleansing Role: The coordinator is supplied by Cleansing with brooms, spades, rakes
and black bags bought through “Karen’s budget”. Cleansing keeps an
30
DES 2009 JAN 2010 FEB 2010 M T W T F S S M T W T F S S M T W T F S S
1 2 3 4 5 6 1 2 3 1 2 3 4 5 6 7 7 8 9 10 11 12 13 4 5 6 7 8 9 10 8 9 10 11 12 13 14
14 15 16 17 18 19 20 11 12 13 14 15 16 17 15 16 17 18 19 20 21 21 22 23 24 25 26 27 18 19 20 21 22 23 24 22 23 24 25 26 27 28 28 29 30 31 25 26 27 28 29 30 31
MAR 2010 M T W T F S S
1 2 3 4 5 6 7 8 9 10 11 12 13 14
15 16 17 18 19 20 21 22 23 24 25 26 27 28 29 30 31

-63-
\\Titan\public\Projdata\A021\IWMP\Drakenstein IWMP_Version2_10122009.docx\jm
accurate weighbridge record of the black bags collected by the coordinator, for disposal at the Paarl transfer station. If there is no record at the weighbridge, it is assumed that the team did not function on that day. The team does not work on rainy days. “No work, no pay.“
Frequency: On average, 100 black bags are filled per team per day, taken to the
Paarl Transfer Station for free disposal. Mr. Martin van Zitters arranges through the councilor where the team
is required to work. A team from a specific ward is not necessarily committed to the cleansing of the ward only. During “leaf drop”, there is a critical need for collecting of leaves in the town. All the teams can then be used to assist Cleansing, if required. The cleaning of Mbekweni can usually not be done by Cleansing only and the Clean Green teams often assist Cleansing.
Currently wards 4, 16 and 27 have Clean Green teams. Disposal: Free of “charge” at Paarl transfer station.
2.3.4 Street Sweeping
2.3.4.1 Paarl – Sweeping Teams with Tractor-Trailers Cost Centre: Cleansing Branch. Teams: There are three teams working with a dedicated tractor and trailer. The
“spade operator” loosens the sediment, leaves and even weeds from the gulley on both sides of a hard surface road. The “broom operators” sweep the loosened waste in piles, one on each side of the road. The two “pick-up operators” physically collect the waste on both sides of the road and place the waste in the wheelies. Once the wheelies are full the “pick-up operators” empty the wheelies in the trailers. No black bags are provided to, or used by these teams.
The average collection for a team is 2 loads per day. However, “leave time”
from May to middle July can double the loads. Equipment: Each team of five workers receive one spade, two brooms and two wheelie
bins. No black bags are issued. Waste types collected: Litter, alien vegetation, weeds, cigarette buds, leaves, etc. Routes: There are three teams cleaning three individual routes, namely: • PM 1940: The triangle between Jan van Riebeeck Street to Klein Drakenstein Street
again to Langenhoven Lane. (Both Klein Drakenstein Street and Langenhoven Lane end at the Spes Bona Garage.)
• PM 409: The area between Lady Grey Street and Jan van Riebeeck Street. Works from Lady Grey in a northern direction then changes parallel to Lady Grey, working south to north.
• PM 969: Works in a triangle from Lady Grey in a southern direction toward the south of Courtrai, with Jan van Riebeeck forming the one border.
Frequency: • PM 409: One route takes 6-8 weeks. During “leaf” time: 10-11 weeks. • PM 969: One route takes 4 months. During “leaf” time: 6 months. • PM 1940: One route takes 3 months. During “leaf” time: 4 months.
Volume:

-64-
\\Titan\public\Projdata\A021\IWMP\Drakenstein IWMP_Version2_10122009.docx\jm
• PM 409: Two loads per day. • PM 969: Two loads per day. • PM 1940: Two loads per day.
Disposal: Paarl transfer station Operational Hours: The teams all start at 07.45 in the mornings, Monday to Saturdays. The
three teams work from 07.45 to 17.00 on Monday and Wednesdays. The teams rotate on Tuesdays, Thursdays and Fridays to have one team working from 05.30 to 17.45 and the other two teams from 07.45 to 17.00. The teams rotate for Saturday duties and two teams always work on Saturdays from 13.00 to 17.00.
Frequency: As described above, there are three teams working every Monday to Friday
and two on Saturday afternoons. Weight: The average weight collected per team varies from 3 600 to 5 500 kg per
day. Remuneration: After 15.45 and before 07.45, the teams receive 1 ½ “pay”. Saturdays are
also 1 ½ “pay.” Breakdown: When a breakdown occurs, a unit is restructured by combining a spare
tractor with the existing driver, trailer and team or combining a spare trailer with an existing tractor, driver and team.
There are no standby tractors. Spare tractors are created when a tractor is
recalled from working in Parks or spraying of herbicides. Disposal: At the Paarl transfer station Table 2-33: Street Cleaning in Paarl using Tractors with Trailers
STREET CLEANING PAARL: TRACTOR TRAILERS Road number PM 1940 PM 409 PM 969
TRACTOR
Registration number CJ 22980 CJ 23151 CJ 45028
Make John Deere Landini John Deere
Model 2006 1998 2003
Odo in hours 1 725 hrs 13 700 hrs 7 331 hrs
Driver Amos Telite Willem de Kock Willem Tiras
Workers 5 5 5
TRAILER
Road number PM 241 PM 470 PM 292
Registration number CJ 10139 CJ 50759 CJ 27646
Volume 6.7 m3 6.7 m3 6.7 m3
Model 3.5 ton 3.5 ton 3.5 ton
Make and age
Custom made. More than 20
years old. Custom made. More
than 20 years old.
Custom made. More than 20
years old. Average weight per day. 3 660 kg 5 488 kg 4 804 kg Average loads per day 2 2 2
2.3.4.2 Paarl – Individual Sweepers with Street Cars Cost Centre: Cleansing Branch

-65-
\\Titan\public\Projdata\A021\IWMP\Drakenstein IWMP_Version2_10122009.docx\jm
Number of Sweepers: There are twenty four individuals, sweeping dedicated routes on a full time basis. Each sweeper has a street car.
Street Car and equipment: A street car consists of a 240l wheelie container with spade, broom
and scoop. No black bags are supplied. Scope of work: Clean the side walk and road/ road gulley. Thus emptying pole bins,
park bins and litter bins; weeding; hoeing; cleaning and collecting all alien vegetation and waste/litter on the side walks and in the road.
Waste types collected: Litter, leaves, cigarette buds, alien vegetation and weeds, etc. Collection vehicle: Waste collected by individual sweepers, is placed in their wheelie
bins. When the bins are full, the waste is collected by a dedicated flatbed tipper vehicle with railings around the side. The vehicle is a Nissan UD85 with a 8m3 capacity, payload of 6 ton and road number PM 1966 (CJ 54777). Refer to the spread sheet on the flatbed tipper trucks for further detail of the vehicle.
Disposal: The waste is disposed of at the Paarl transfer station. Routes: Klein Drakenstein Road • Three persons sweep dedicated stretches of Klein Drakenstein road every day, between
Maasdorp Street up to Lloyd Street and Solomon Street. • Two persons sweep between Jan van Riebeeck Road to Maasdorp Street every day. Main Road • Seven persons sweep ca. 11 of the 14 km of the Main Road between Oude Renbaan to the south
and Retief Street to the north. The seven persons sweep as follows: o One Person: Retief Street to Basson Street, side streets and park. o One Person: Basson Street to Dorp Street and side streets. o One Person: Dorp Street to Faure Street and Church street areas o One Person: Faure Street to Strooidak Church and side streets o Two Persons: Strooidak Church to KWV road only. (intersection at Vineyard Square Spar
where the Dross used to be) o One Person: KWV Road to Oude Renbaan and side streets.
• Periodically the Clean Green team/s sweep the total length of Main Road. Paarl Town- Business areas • Twelve persons sweep the area as follows:
o Two peole sweep Nuwe Street, 13de Street, van der Lingen Street and the park area. o One person sweeps only Lady grey Street. o One person sweeps New Street in the taxi rank area as well as the taxi rank. o Two persons sweep the parking area in town, behind the Pick and Pay as well as Fabriek
Street, Verster Street and the five side streets out of Verster Street. o One person sweeps the Boulevard from Lady Grey going north to Colini Street. o One person sweeps the Boulevard from Lady Grey -, going south to Harlem Street. o Two persons sweep the southern Paarl railway station and side streets going out of Station
Street. o Jan van Riebeeck Street from Lady Grey Street to “Ambagsvallei”. ( Jan van Riebeeck ;
Hugenote Bypass to Abattoir road as well as all the side roads)
2.3.4.3 Paarl – Mechanical Street Sweeping Units: There are two mechanical street sweepers parked at the depot. Both
machines are not functioning for the past 4 months. Both machines

-66-
\\Titan\public\Projdata\A021\IWMP\Drakenstein IWMP_Version2_10122009.docx\jm
require new brushes. The imported brushes are very expensive. Locally manufactured brushes have such a high incidence of hair loss that they are no longer purchased.
Area: he street sweepers usually service the Paarl CBD area. The
machines are not effective with the collection of leaves and cannot operate when it is raining.
Waste to be Collected: Light paper from packaging, street litter and cigarette butts. Collection Rate: Both machines have dedicated drivers. When working, each machine
can effectively collect 10-12 black bags full of litter per day. The black bags are placed on the pavement and collected by the 6 ton flatbed tipper vehicle, PM 966.
Table 2-34: Street Cleaning in Paarl using Mechanical Equipment
NAME Odo in hrs Road Number Year/Model Collection per day
Mad Vac 317 hrs PM 945 2002 10-12 black bags Green Machine 339 hrs PM 475 1999 10-12 black bags
2.3.4.4 Mechanical Leaf Suckers: Billy Goat The “Billy Goat” performs a vital service in collection. The equipment used comprises one tractor, two trailers and three petrol vacuum pumps. Scope of Work: Leaves are very difficult to collect, especially when wet. Area: Leafy areas in “leaf seasons”. Equipment: The vacuum pump is named “Rough and Tough”. There are also
three closed trailers of 8m3 per trailer. The two pumps can be interchanged in the three trailers as required.
Disposal: The back doors of the trailer open and can be secured to remain
open. The trailers can tip when activated by the tractor. The leaves are disposed off at the Paarl Transfer Station for compost making.
Road number: The Billy Goat trailers and vacuum pumps are not listed in the
workshop stock records. Only one trailer has a PM number. The reason for this lack of registration is not known.
Hours: The units are operational between 07.45 and 17.00. Team: A team consists of a driver and 4-5 sweepers. The sweepers rake
and hoe the leaves together while the operator holds the vacuum pipe and maneuvers the pipe to suck the maximum volume of leaves into the unit.
Table 2-35: Street Cleaning in Paarl using Mechanical Equipment for Leafs
Unit Make Year Odo hours Road Number Registration number
Tractor Landini 1998 13 952 PM 126 CJ 73103 Billy Goat unit 1 (8m3)
Custom >20 yrs ? PM 366 ? ( Not listed in workshop record)
Billy Goat units 2 and 3 (8m3
each)
Custom >20 yrs ? ? ? ( Not listed in workshop record)
2.3.4.5 Paarl – Flatbed Collection Vehicles

-67-
\\Titan\public\Projdata\A021\IWMP\Drakenstein IWMP_Version2_10122009.docx\jm
Fleet: There are six vehicles in the fleet, two without railings. Duties: The duties vary according to the payload. Namely:
• The two flatbed tippers without railings have a payload of 8 ton. They are used for the collection of builder’s rubble and waste loaded onto vehicles with a FEL during major clean-ups, etc.
• The four vehicles with railings have different payloads, namely 4 ton and 6 ton.
• The 3 x 4 ton vehicles only collect black-bags form the Informal Waste Removal Project (= Municipal Cleaning Project) as well as other black bags placed on the pavements.
• The 1 x 6 ton vehicle mainly collects the waste from the individual streetcars, when full.
Disposal: Disposal takes place at the Paarl transfer station. Waste types: Street sweepings, sidewalk cleaning, litter and waste bins, leaves and
cigarette buds, builder’s rubble; bulk waste in streets (when a FEL is used to assist), sandy litter and sweepings near building sites, etc.
Area: The vehicles operate as follows:
• The two flatbed tippers without railings operate in Paarl and Wellington. Never in Saron, Hermon and Gouda.
• The three 4 ton vehicles with railings operate in Paarl and Wellington. Never in Saron, Hermon and Gouda.
• The one 6 ton vehicle with railings operates exclusively in Paarl collecting waste from the 34 individual street sweepers. Never in Saron, Hermon and Gouda.
Table 2-36: Street Cleaning in Paarl using Flatbed Tipper Trucks
Parameter FLATBED TIPPERS WITH RAILING FLATBED TIPPERS WITHOUT RAILING
Road Number PM 1942 PM 1943 PM 1944 PM 1966 PM 76 PM 373 Registration Numer CJ 26306 CJ 26081 CJ 27165 CJ 54777 CJ 16430 CJ 18195
Payload in t 4 t 4 t 4 t 6 t 8 t 8 t
Capacity in m3 6 m3 6 m3 6 m3 8 m3 5 m3 6 m3
Make Nissan Cabstar
Nissan Cabstar
Nissan Cabstar
Nissan UD85
Toyota Tipper Nissan UD
Model 2006 2006 2006 2008 1989 1997 Odo reading in Km 40 459 45 135 46 990 23 708 32 491 196 384
Driver JJ Africa Various T Nkuni G
Koopman M Dintsi M Dintsi
Workers 2 2 2 4 4 4
2.3.4.6 Special Collection of Garden Waste from Residents Fleet: A tractor is available on request Cost: R267.44 per load. Load size: Two and a half tractor loads, thus ca. 10 tons. (One tractor-trailer is
6.7m3 and has a payload of 3.5 ton) Disposal: At the Paarl transfer station.

-68-
\\Titan\public\Projdata\A021\IWMP\Drakenstein IWMP_Version2_10122009.docx\jm
2.3.4.7 Wellington Person in Charge: Piet Fryster: 0832901314 Fleet: 3 tractors Area: Service Kerk Street and businesses in main road. There is a driver
and 4 people on each team. The team is supplied with two of each of the following; spades, spade-forks, brooms and hoes.
Disposal: Wellington Landfill Table 2-37: Street Cleaning in Wellington using Tractors with Trailers
Road number CJ 230 960 CJ 61029 CJ 25241
TRACTOR
Registration number D 31939 D 31919 D 31968
Make John Deer John Deer John Deer
Model ? ? 2008
Odo in hours ? ? 532 hrs
Driver Shawn Sakata Niclaas Jonas Bernard Briesies
Workers 4 4 4
TRAILER
Road number ? ? ?
Registration number CJ 12988 CN 13795 CN 2109
Volume 2.3x1.7x 0.8= 3.13
m3 3.5x2.5x1.5 = 13.13
m3 2.3x1.7x 0.8= 3.13
m3
Model ? ? ?
Make and age ? ? ?
Hours
Mo-Thursd: 07.45-17.00 and Friday
07.45-15.00
Mo-Thursd: 07.45-17.00 and Friday
07.45-15.00
Mo-Thursd: 07.45-17.00 and Friday
07.45-15.00
General data of tractor-trailer
Av. weight per trip 1 000 kg 1 122 kg 1 000 kg Av. loads per day 05-Apr 05-Apr 04-Mar
Route
Day Streets No
loads Streets No
loads Streets No
loads
Monday
Empty bins in Hoof street (R) and Kerk street.
1 Empty bins in Hoof Street (L), General Hertzog- and Blouvlei road.
1 Empty bins in Blignaut-, Dr Abdulharam- and Beet Streets
3
Sweeping of Malan-,Bruin-,Brug-, and Fontein Streets
4 Sweeping de Villiers, 4th-, 5th lanes, Dwars Street and Kruger Street
3 Sweep Newton-, Skool- and Buitekant Streets
5
Tuesday
Sweeping Berg en Dal Street
4 Sweep in Doris Road and Eike Laan
3 Sweep Burn-, Russel- and Vallei Street
3

-69-
\\Titan\public\Projdata\A021\IWMP\Drakenstein IWMP_Version2_10122009.docx\jm
Road number CJ 230 960 CJ 61029 CJ 25241
Wednes-day
Empty bins in Hoof street (R) and Kerk street
1 Empty bins in Hoof Street (L), General Hertzog- and Blouvlei road.
1 Empty bins in Blignaut-, Dr Abdulharam- and Beet Streets
3
Sweeping Malherbe-,Burger-,Pen Streets
4 Sweep in Morelig-, Plein- and Berg- streets
4 Sweep Bailey-, April- and St Josephs Roads
3
Thursday
Jan van Riebeeck-, Mulder- and Joubert Streets
4 Sweep Steyn, Queen- and Bactrim Streets.
4 Sweep September-, Nelson-, Roedolf Streets
5
Friday
Empty bins in Hoof str (R) and Kerk str .
1 Empty bins in Hoof Street (L), General Hertzog- and Blouvlei road.
1 Empty bins in Blignaut-, Dr Abdulharam- and Beet Streets
3
Sweeping Smit- and Marais streets
4 Sweep Kammie Street
3 Sweep Aurora and Uitkyk streets
3
Sat/ Su - -
2.3.4.8 Simondium and Rural
Person in Charge: Mr. Fillies is in charge of the skip bin collections. There is no street sweeping in Simondium. The businesses in the
main street keep the pavement and road sections clean in front of their individual areas.
Skip bins are collected from the school and residential houses using
the dedicated skip compactor. (C81930, the 19m3 compactor doing the route on a Friday as per calendar when 1st April 2009 was taken as the first collection day of the week.
2.3.4.9 Saron, Hermon and Gouda Person in Charge: Mr. Frikkie Fillies Fleet: Gouda has one tractor and trailer unit. Area: Saron, Hermon and Gouda. Builder’s rubble and bulk waste requiring a flatbed tipper truck.
Vehicles are hired by Mr. du Preez as the area is to far away for the Paarl fleet to assist in duties.
Sweeping of the CBD section of the main street takes place by the
worker acting at the transfer station at Saron and Hermon.
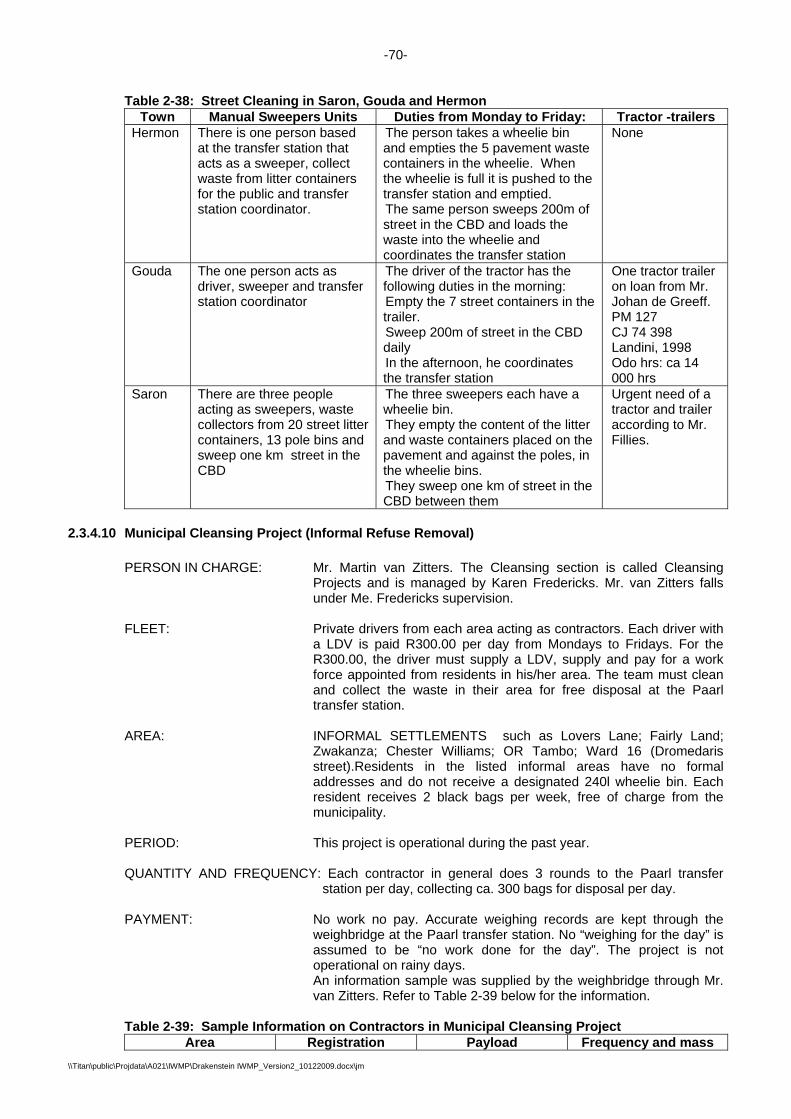
-70-
\\Titan\public\Projdata\A021\IWMP\Drakenstein IWMP_Version2_10122009.docx\jm
Table 2-38: Street Cleaning in Saron, Gouda and Hermon
Town Manual Sweepers Units Duties from Monday to Friday: Tractor -trailers Hermon There is one person based
at the transfer station that acts as a sweeper, collect waste from litter containers for the public and transfer station coordinator.
The person takes a wheelie bin and empties the 5 pavement waste containers in the wheelie. When the wheelie is full it is pushed to the transfer station and emptied. The same person sweeps 200m of street in the CBD and loads the waste into the wheelie and coordinates the transfer station
None
Gouda The one person acts as driver, sweeper and transfer station coordinator
The driver of the tractor has the following duties in the morning: Empty the 7 street containers in the trailer. Sweep 200m of street in the CBD daily In the afternoon, he coordinates the transfer station
One tractor trailer on loan from Mr. Johan de Greeff. PM 127 CJ 74 398 Landini, 1998 Odo hrs: ca 14 000 hrs
Saron There are three people acting as sweepers, waste collectors from 20 street litter containers, 13 pole bins and sweep one km street in the CBD
The three sweepers each have a wheelie bin. They empty the content of the litter and waste containers placed on the pavement and against the poles, in the wheelie bins. They sweep one km of street in the CBD between them
Urgent need of a tractor and trailer according to Mr. Fillies.
2.3.4.10 Municipal Cleansing Project (Informal Refuse Removal) PERSON IN CHARGE: Mr. Martin van Zitters. The Cleansing section is called Cleansing
Projects and is managed by Karen Fredericks. Mr. van Zitters falls under Me. Fredericks supervision.
FLEET: Private drivers from each area acting as contractors. Each driver with
a LDV is paid R300.00 per day from Mondays to Fridays. For the R300.00, the driver must supply a LDV, supply and pay for a work force appointed from residents in his/her area. The team must clean and collect the waste in their area for free disposal at the Paarl transfer station.
AREA: INFORMAL SETTLEMENTS such as Lovers Lane; Fairly Land;
Zwakanza; Chester Williams; OR Tambo; Ward 16 (Dromedaris street).Residents in the listed informal areas have no formal addresses and do not receive a designated 240l wheelie bin. Each resident receives 2 black bags per week, free of charge from the municipality.
PERIOD: This project is operational during the past year. QUANTITY AND FREQUENCY: Each contractor in general does 3 rounds to the Paarl transfer
station per day, collecting ca. 300 bags for disposal per day. PAYMENT: No work no pay. Accurate weighing records are kept through the
weighbridge at the Paarl transfer station. No “weighing for the day” is assumed to be “no work done for the day”. The project is not operational on rainy days.
An information sample was supplied by the weighbridge through Mr. van Zitters. Refer to Table 2-39 below for the information.
Table 2-39: Sample Information on Contractors in Municipal Cleansing Project
Area Registration Payload Frequency and mass
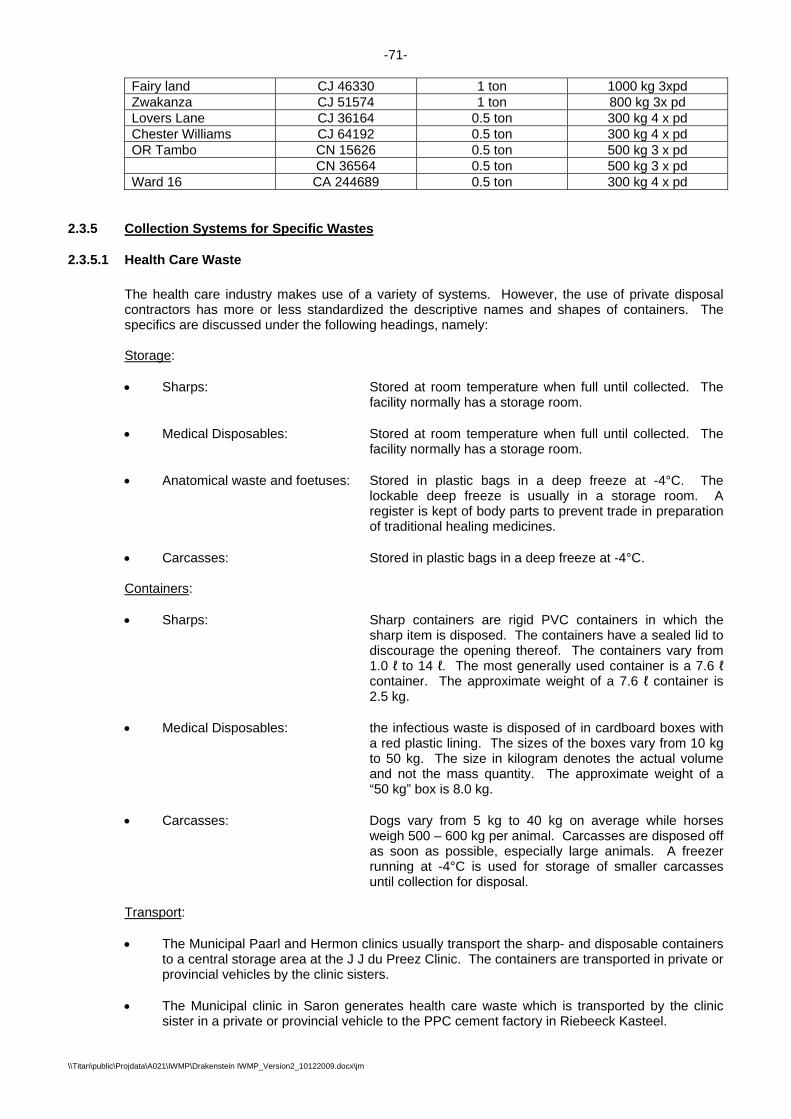
-71-
\\Titan\public\Projdata\A021\IWMP\Drakenstein IWMP_Version2_10122009.docx\jm
Fairy land CJ 46330 1 ton 1000 kg 3xpd Zwakanza CJ 51574 1 ton 800 kg 3x pd Lovers Lane CJ 36164 0.5 ton 300 kg 4 x pd Chester Williams CJ 64192 0.5 ton 300 kg 4 x pd OR Tambo CN 15626 0.5 ton 500 kg 3 x pd CN 36564 0.5 ton 500 kg 3 x pd Ward 16 CA 244689 0.5 ton 300 kg 4 x pd
2.3.5 Collection Systems for Specific Wastes
2.3.5.1 Health Care Waste The health care industry makes use of a variety of systems. However, the use of private disposal contractors has more or less standardized the descriptive names and shapes of containers. The specifics are discussed under the following headings, namely: Storage: • Sharps: Stored at room temperature when full until collected. The
facility normally has a storage room.
• Medical Disposables: Stored at room temperature when full until collected. The facility normally has a storage room.
• Anatomical waste and foetuses: Stored in plastic bags in a deep freeze at -4°C. The
lockable deep freeze is usually in a storage room. A register is kept of body parts to prevent trade in preparation of traditional healing medicines.
• Carcasses: Stored in plastic bags in a deep freeze at -4°C. Containers: • Sharps: Sharp containers are rigid PVC containers in which the
sharp item is disposed. The containers have a sealed lid to discourage the opening thereof. The containers vary from 1.0 ℓ to 14 ℓ. The most generally used container is a 7.6 ℓ container. The approximate weight of a 7.6 ℓ container is 2.5 kg.
• Medical Disposables: the infectious waste is disposed of in cardboard boxes with a red plastic lining. The sizes of the boxes vary from 10 kg to 50 kg. The size in kilogram denotes the actual volume and not the mass quantity. The approximate weight of a “50 kg” box is 8.0 kg.
• Carcasses: Dogs vary from 5 kg to 40 kg on average while horses
weigh 500 – 600 kg per animal. Carcasses are disposed off as soon as possible, especially large animals. A freezer running at -4°C is used for storage of smaller carcasses until collection for disposal.
Transport: • The Municipal Paarl and Hermon clinics usually transport the sharp- and disposable containers
to a central storage area at the J J du Preez Clinic. The containers are transported in private or provincial vehicles by the clinic sisters.
• The Municipal clinic in Saron generates health care waste which is transported by the clinic
sister in a private or provincial vehicle to the PPC cement factory in Riebeeck Kasteel.

-72-
\\Titan\public\Projdata\A021\IWMP\Drakenstein IWMP_Version2_10122009.docx\jm
• The Wellington Clinical waste is transported by the clinic sister to the J J du Preez clinic in Paarl. The waste is collected by Sanumed in custom made vehicles which display health care warnings.
• The industrial occupational health care clinics at British American Tobacco, Berg River Textile,
Versapak, Foodcan, KWV, Spilo, Langeberg Foods (Tiger Food Brands) and Monis. The clinics are serviced by Sanumed and Rentokil. Health Care waste is collected by the two contractors in custom made vehicles which display health care warnings.
• Provincial hospitals: The Paarl hospital, T C Newman day hospital affiliated to the Paarl
hospital and Wellington day hospital uses Sanumed as a transport contractor. The health care waste is transported by Sanumed in custom made vehicles which display health care warnings.
• Private Hospitals: The Drakenstein private day hospital (part of Medi-City), the Paarl Med 24
hour emergency centre, the Paarl Medi-Clinic and Care Cross clinic use Sanumed as transporters. The health care waste is transported by Sanumed in custom made vehicles which display health care warnings.
• General Practitioners, Dentists and Veterinary Services: The largest number of practitioners
used private contractor such as Sanumed, Millenium Waste (= Sanumed), BCL and Canon. Pathcare provides a collection service to 60 - 70 Paarl doctors. The sharps and disposable containers are collected by Pathcare and stored at Dietrich, Street and Partners, the pathologists in Paarl. Sanumed collects the waste from Dietrich, Street and Partners in a custom made vehicle which display health care warnings. The collection vehicle used by pathcare is not known.
Service Efficiency: The only service complaint about a private health care contractor was received from a general practitioner in Paarl. The complaint was about bad service. Note of Transport Contractor Names: The user names found in industry were used. In this industry, Sanumed is known as Wastetech, Millenium or Enviroserv. The user names were denoted to the contractors.
2.3.5.2 Hazardous Waste Industrial Hazardous Waste collection in the Drakenstein area is mentioned in the comments column of Table 2-28: Drakenstein High Hazardous Waste in chapter 2.1.5.6.5. Storage: The storage of pre-treated liquid hazardous waste is in cement underground pits, static tanks and hooklift tankers of varying sizes, namely 1.0 – 10.0 kℓ containers. The storage of semi-solid untreated and pre-treated hazardous sludges is generally in sludge bins of 6 – 8 m³ or 210 ℓ drums. The solid hazardous waste is stored in a variety of containers such as 100 ℓ drums (CCA waste), a 4 m high static silo (electroplating waste), 210 ℓ drums and skip bins of 6 – 8 m³ in volume. Storage of hazardous waste for more than 90 days on the premises of a generator is not allowed. Section 10 of the Minimum Requirements for the Handling, Classification and Disposal of Hazardous Waste, Second edition 1998 by DWAF states as follows: “A Generator who treats, stores for a period of 90 days, or disposes of Hazardous Waste on site is subject to section 20(1) of the Environmental Conservation Act (Act 73 of 1989) and must apply for a permit for a waste disposal facility. The quantities of hazardous waste accumulation on site for 90 days or less without a permit for a waste disposal site is given as:

-73-
\\Titan\public\Projdata\A021\IWMP\Drakenstein IWMP_Version2_10122009.docx\jm
Hazard Rating 1 = 10 kg Hazard Rating 2 = 100 kg Hazard Rating 3 = 1 000 kg Hazard Rating 4 = 10 000 kg Provided that: • The waste is stored in such a manner that no pollution of the environment occurs at any time; • The date upon which accumulation begins is clearly marked and visible for inspection on
each container; • While being stored on site, each container and tank is labelled or marked clearly with the
words “Hazardous Waste”; • The Generator fences off the storage area to prevent unauthorised access and erects a
notice board at every entrance of the storage area.” Containers: Described in storage above. Transportation: Transportation of hazardous waste should be in accordance with legislative controls. Vehicles transporting hazardous waste must adhere to SANS Code 0228 requirements and display HAZCHEM placards. Drivers of such vehicles must carry a Transport Emergency Card (Tremcard), specific to each load. It is advisable that the municipal emergency services be trained in hazchem interpretation as well as transport accident and remedial action procedures for hazardous waste. Contractors should notify the municipal emergency services of the possible routes and SANS 0228 load classification of hazardous waste, when transported. The names of private contractors, especially Enviroserv is referred to as Wastetech and Millenium. The “user names” of the contractors are used throughout the report as they are known by industry. There are two major private transport contractors namely Wastetech and Wasteman. The other contractors namely Captain Waste, Cape Precious Metals and Oilkol are not as active in the area as the two major contractors. All contractors must adhere to the legislative controls.
2.4 WASTE REDUCTION
2.4.1 Recycling From the composition of the typical Drakenstein waste as described in Paragraph 2.1.3, and the volumes of paper, glass, plastics and metals that can be recovered, the potential income from recycling, either through post collection recovery or source separation recovery, can be calculated. Table 2-40: Potential Income from Recycling
2009 Price R/t Post Collection Volume t/a
Source Separation Volume t/a
Paper and Cardboard 565 3,803 1,597 Glass 350 225 992 Plastic 1635 359 359 Metal 600 166 83
Total Potential Income R 2,914,766/a R 1,886,860/a
Although Table 2-40 indicates that post collection separation or material recovery would result in higher income, the capital and operational cost of establishing and operating a Post-collection Material Recovery Facility (also called a “Dirty MRF”) can easily surpass the income. Similarly,

-74-
\\Titan\public\Projdata\A021\IWMP\Drakenstein IWMP_Version2_10122009.docx\jm
source separated wastes must be collected, preferably separate from the mixed waste stream, and must be separated in its various material streams. Both the above methods of material recovery have been proven in the past to be financially unsustainable if it is expected of the income (generated through sales) alone to finance both the capital and operational costs.
2.4.1.1 Waste Recovery Facilities in Drakenstein Drakenstein Municipality has recently revamped the Material Recovery Facility adjacent to the Paarl Transfer Station by replacing the old mechanical equipment. The public tender for the operation of the Material Recovery Facility will be advertised in January 2010. A number of waste recovery efforts are being implemented by industry as listed below: • All used oil and oil by-products are being collected by Oilkol for recycling. South Africa has
exceptional expertise in oil re-use through refining the various grades of oil for re-use. The technologies implemented are of world-class standard (though sometimes crude), and very effective. One such a refinery process is practiced by Fuel Firing Systems (FFS) at Vissershok, where Oilkol delivers the collected used oil.
• In most cases where printing chemicals are used and disposed of, this is done through
recognized disposal contractors, or the original suppliers for safe disposal as per the allowable means and practices. Inks are often recycled and re-used.
• Medical waste disposal is done by recognized contractors specializing in the collection and
disposal (incineration) of medical waste. These contractors also supply the permitted containers for the medical waste.
• Peels and pips from the wine industry are made into compost for distribution back to the
farmers. In Wellington the pips are reclaimed for drying and re-processing. • Fertilizer producers sell all sweepings at a reduced price to farmers and the public, thereby
eliminating the need for disposal thereof. • Larger industries e.g. KWV also reclaim broken bottles and cardboard for recycling through
selling these to recycling firms in adequate amounts. It would be very easy for all industries in Drakenstein to add onto this system, as the critical mass has already been exceeded to have these recyclers collect the reclaimed materials.
• Food industries are producing a range of organic waste products currently being removed for
disposal (e.g. filter cake). A joint composting effort may well prove to be very feasible if a few of these producers combine their by-products. If a composting site is to be established for garden refuse, and this was to be privatized, the contractor may well be interested in composting these food production by-products. This will also benefit these industries commercially, as their disposal expenses will become far lower.
2.4.2 Composting
2.4.2.1 Composting Facilities in Drakenstein Paarl had a composting facility which had been in use since the mid 1970s. A transfer station has been added to the facility, and the mechanical composting equipment has become aged and too expensive to maintain cost effectively. During 2008/2009 the Municipality modified the facility in order to increase the recovery of material of value and most of the mechanical equipment were replaced. An application for Environmental Authorisation was also submitted and a Record of Decision (ROD) was received for the Composting Facility and Material Recovery Facility. One of the conditions of the ROD was that the natural ground level be raised by 2m in order to be above the flood level of the Berg River. The floor level of the MRF was raised and the Municipality is currently using selected “clean” Builder’s Rubble to fill the outside area to the required level. Once this has been completed, a composting yard will be constructed on the raised area. It would be advisable to obtain as much organic (compostable) waste high in Nitrogen as possible. Fruit waste from the various producers should be obtained, and joint ventures may be formed

-75-
\\Titan\public\Projdata\A021\IWMP\Drakenstein IWMP_Version2_10122009.docx\jm
between Municipalities and private enterprises. There is always a good market for high quality compost and a facility like this can provide continuous revenue for the Drakenstein Municipality.
2.4.2.2 Home Composting Home composting in South Africa has traditionally been practiced for the purpose of having an inexpensive and reliable source of compost for the garden. More recently, the realization that composting is a means of conserving resources, saving landfill airspace and the recycling of organic matter, has become the driving force for composting under individuals as well as clubs / associations. It has been shown that home composting can reduce the waste stream by 20% to 30% if carried out properly. This is a prime example of “recycling at source”. This represents probably the only feasible means of composting kitchen waste, as large-scale post-collection composting has proven ineffective on many occasions in South Africa. Due to a lack of general information conveyed to the private composter in the past, many perceptions of home composting has become that of a stinking pile somewhere in the corner of the garden. This (and a change in lifestyles) has led to compost becoming a shopping list item to be bought at the supermarket. Leaflets or other methods of information should be made available to inform the general public of the advantages and “recipe” for making good quality home compost. This should include: • Bins / container design • Raw products • C:N ratio • Minimum volume • Preparation • Moisture content • Aeration • Monitoring • Trouble-shooting Home composting bins can be bought at selected nurseries throughout the Western Cape. These are normally one of two types. The first type is a moulded plastic bin which comes in two sizes as follows: • Small – volume approximately 500 litres, price R500 • Medium – volume approximately 1000 litres, price R700 The second type is one made from chicken wire around a plastic framework. This one is also of approximately 1000 litre capacity, and sells for around R300. The disadvantage to the chicken wire model is the possibility of leaching, flies and foul odours. However, it does allow for good aeration, whereas the plastic model may tend to result in anaerobic conditions (rotting) if not manually aerated by turning. Vermicomposting Vermicomposting refers to the deliberate introduction of earthworms (typically) during early stages of the composting process. These would appear naturally at an advanced stage of natural composting, which would be after stabilization, where macrofauna use some of the microflora as a substrate. The earthworms have the following beneficial effects on the composting process: • Reduction of particle size • Removal of old bacteria, stimulating the growth of new bacteria • Enriching the compost by excretions high in Nitrogen • Promotes penetration of oxygen into the compost • Increases pathogen control • Produces worm castings, a good soil amendment

-76-
\\Titan\public\Projdata\A021\IWMP\Drakenstein IWMP_Version2_10122009.docx\jm
Vermicomposting lends itself well to household-sized ventures, as it requires very careful control, but produces very high quality compost in a relative short period of time. It is a very clean process which does not attract flies. This type of composting is typically done inside special bins designed for the purpose. Most kitchen-type wastes can be composted in this manner, although onions, citrus & other acidic foods should be avoided as they can be toxic to the worms. The worms are also quite sensitive to extreme temperatures, humidity and rain. Therefore this process does not lend itself to large-scale industrial composting. Also the ratio of worms: substrate is approximately 1:4; therefore very large amounts of worms are required for the process. The worm mass doubles in approximately 12 weeks.
2.5 WASTE DISPOSAL
2.5.1 Operating Landfills Drakenstein Municipality currently utilises only one landfill, the Wellington Landfill (S33 39 14.8 E18 59 02.9) west of Wellington. This landfill was previously developed and used by the former Wellington Municipality. Cell 6, the current cell, was commenced with in August 2000 under the former Wellington Municipality. Since the demarcation of the current municipal boundaries, Cell 6 has been completely developed in phases up to the point where capacity will be reached in mid 2012. An application for an amendment of the existing permit to increase the maximum allowable height is currently being prepared by an Environmental Consultant, but even if successful, will only provide an additional 3 years of capacity. Operation of this landfill, which is operated by the municipality, is generally good. A compliance external audit was conducted by Annette Naude, on behalf of Jan Palm Consulting Engineers, during March 2009 and the Audit Report is attached as Annexure B. The Wellington Landfill has an operating permit (no. 16/2/7/G100/D4/Z1/P263) from the Department of Water Affairs and Forestry in accordance with the Environmental Conservation Act and has been classified as a G:S:B+ waste disposal facility. As such the site may receive between 25 and 150 tons of waste per day. The current volumes received indicate that the daily volume is in excess of 200 tons per day which constitutes a permit violation.

-77-
\\Titan\public\Projdata\A021\IWMP\Drakenstein IWMP_Version2_10122009.docx\jm
Photo 1: Wellington Waste Disposal Site – Cell 6 in operation
2.5.2 Closed Landfills
Drakenstein has five closed landfills. The oldest is in Dal Josafat, Paarl (S33 42 24.7 E18 58 38.9) and used to be the disposal site for general waste from Paarl. The site was closed some 20 years ago when the Wateruintjiesvlei site was commissioned. This site has never been rehabilitated and unauthorised dumping occasionally takes place. Rehabilitation cost is currently estimated at R 2,000,000. The second is the Wateruintjiesvlei site (S33 46 24.6 E18 58 53.6) that has been rehabilitated and is at present part of the Boschenmeer Golfing Estate development. This site has an Operation to Closure Permit issued by the then Department of Water Affairs and Forestry, but a copy of this permit was to date unobtainable. Annual external audits have been done on this site. The third is the closed landfill near Saron (S33 12 23.4 E19 00 34.3) which does not currently receive any waste, but still has to be rehabilitated. Rehabilitation cost is currently estimated at R 1,900,000. The remaining two closed sites were both used to dispose builder’s rubble. One is situated in Orleans (S33 43 13.6 E18 59 33.5) adjacent to the Palmiet River off Van der Stel Street and the other (S33 43 03.8 E18 58 19.2) immediately north of and adjacent to the sports fields of the Paarl Rugby club (also referred to as the Boy Louw Sports Field. Both these sites have been closed and covered with soil, but not yet properly rehabilitated. Rehabilitation costs for these two sites are currently estimated at between R 3,500,000 and R 4,500,000 each depending on the quality of the existing capping layers.
2.5.3 Builder’s Rubble Sites No dedicated Builder’s Rubble disposal sites exist in Drakenstein. All Builder’s Rubble is disposed at the Wellington Landfill.
2.5.4 Waste Transfer Stations A waste transfer station (S33 43 11.3 E18 58 33.4) is located on the premises of the former composting plant in Daljosafat. This transfer station has originally been designed as an interim measure, but has since “gained” permanent status. Upgrading of the infrastructure will commence in

-78-
\\Titan\public\Projdata\A021\IWMP\Drakenstein IWMP_Version2_10122009.docx\jm
the first quarter of 2010 and the methodology of using open top containers will be replaced with compaction into compaction containers. The facility has a current storage capacity of 4 x 30m3.
Photo 2: Waste Transfer Station in Dal Josafat, Paarl
2.5.5 Public Drop-off Facilities
Public Drop-off facilities have to date only been provided in Saron (S33 11 20.9 E19 00 25.9), Hermon (S33 26 03.7 E18 57 38.3) and Gouda (S33 17 56.9 E19 01 34.2), as a replacement for the closed landfills. These facilities provide the residents the opportunity to dispose waste that they have not put out for collection, into containers for later removal by the municipality.
2.5.6 Disposal Facilities used outside the Drakenstein Boundaries There are a few private disposal and/or treatment facilities used by Drakenstein Industries and Health Care Waste Generators. The facilities are discussed in greater detail below: • Hazardous Waste Disposal Site
The Vissershok Waste Management Facility (VWMF) operated by an Enviroserv/Wasteman partnership, has a H:H operations permit form DWAF. The site is situated adjacent to the N7 at Vissershok and is operated and audited in terms of its permit conditions.
• Oil Disposal/Recycling
Used Oil is collected mainly by Oilkol and brought to the Fuel Firing Systems (FFS) oil recovery plant on the N7 at Vissershok. The facility is supported by the Rose Foundation and operates as a scheduled process under the Air Pollution Control Act (Act 45 of 1965) and has SO 14001 accreditation. All waste lubrication oils collected by Oilkol is initially transported to the specialised Rose Foundation depot in Brackenfell. The oil is sold to Fuel Firing System Refiners for reprocessing.
• Solvent Recycling
Very little solvent recycling was encountered.
• Silver and photographic heavy metal solution
-79-
\\Titan\public\Projdata\A021\IWMP\Drakenstein IWMP_Version2_10122009.docx\jm
Cape Precious Metals (CPM) is based in Cape Town and recovers silver as well as other precious heavy metals from photo labs in the printing industry, private photo labs in the area and spent radiology fluids from the Health Care Industry. The recovery of silver is by electrolytic methods for photographic fixers and developers while passive recovery is used for radiology effluents.
• Health Care Waste
The two most well known private incinerators used are the Dispose-Tech facility of Sanumed on the N7 at Vissershok and the BCL facility at the Medical Research Council in Delft. These two incinerators do not operate as H:H permitted facilities under the Environmental Conservation Act but rather as scheduled processes under the Air Pollution Act (Act 45 of 1965). There is also a Solid Waste Technologies electro thermal deactivation facility in Milnerton which has a H:H operational permit from DWAF. This plant does not handle carcasses or pharmaceutical wastes. The number provincial incinerators as well as their operational status are not known.
2.6 CURRENT WASTE MANAGEMENT CHALLENGES Waste management in the Drakenstein appears to be well managed with respect to General Waste, but the survey of the hazardous and health-care waste streams has indicated some serious shortcomings in its management. The lack of available data on all waste types contribute towards the shortcomings of the management systems. Achieving a sustainable waste management system has eluded Drakenstein in the past for various reasons. These include: • the absence of an adequate waste recovery infrastructure. For various reasons, recovery of
waste has not traditionally been regarded as a commercially attractive business. The lack of private enterprise in the area is due partly to the lack of market regulation (e.g. paper, where the low price of virgin pulp leaves little requirement for recycled material) and partly to the lack of public–private partnerships in the area of waste collection. Sustaining an effective waste management system will therefore require:
(a) support of markets on a national or provincial level in order to nurture markets for
recovered materials and (b) co-operation between the public and private sectors in order to provide a constant
feedstock of recoverable material. • the lack of public awareness of the gravity of the problem of sustainable waste management.
Our poor history of waste management in South Africa means that we pay little attention to our lifestyle insofar as how it affects the environment. However, when an environmental problem is noted and the public are made aware of the need for action, there is no stronger lobby. This was evident in the outcry over CFC containing aerosols in the late eighties. Once the problem was discovered and the people informed, a combination of international action and public pressure resulted in almost an immediate ban of these ozone-depleting substances. The recent inability of Escom to meet electricity demands in South Africa has also contributed towards creating awareness of the issue of sustainable environmental practices of which waste management is one.
• Understaffing of municipal organogram. There is a current understaffing in the municipal
organogram in terms of waste managers specifically on the technical supervisory and managerial levels.
• By-laws not addressing hazardous or healthcare wastes. Existing By-laws do not address all
waste types and thereby create a legislative “loophole” for poor waste management practices
• Apathy from industrial waste generators. Since all industries aim to operate at a profit, no or little proper waste management is done if it is not required by legislation.

-80-
\\Titan\public\Projdata\A021\IWMP\Drakenstein IWMP_Version2_10122009.docx\jm
• Apathy from health care waste generators. The average health care practitioner show no or
little concern for the negative affect caused by their waste management practices.
• Ignorance of the public. The general public appears to be content to put out their waste and then it is somebody else’s problem. Concepts such as waste avoidance, waste reduction, etc, are not within the general vocabulary. The annual Waste Week that was organised by the municipality during the last three years has contributed towards a greater awareness amongst primary school learners.
• Lack of information regarding waste generation types and volumes. Accurate data on waste
generation is lacking since only the waste arriving at and leaving the Transfer Station is measured. The weighbridge at the Wellington Landfill has been installed two years ago and is still not used.
• Collection Fleet – Age, Condition, Aesthetics, Type. Collection vehicles in Drakenstein
Municipality, as is the case in almost all South African municipalities, are kept in service long after the end of their economic lives. Collection vehicles help creating the public’s perception of waste management and need to be aesthetically pleasing.
• Limited available future (long term) airspace. The whole of Drakenstein currently disposes of
their waste stream at the municipal landfill near Wellington. The current landfill equipment is insufficient to properly compact the waste with a result that valuable airspace is being lost. Current calculations show that the remaining airspace will be depleted by mid 2012.
• Unrehabilitated closed landfills. Four closed waste disposal sites that still require rehabilitation
exist within Drakenstein Municipality. • Monitoring of facilities. All waste management facilities have been externally audited in the
beginning of 2009.
2.7 WASTE MANAGEMENT STRATEGIC OBJECTIVES
With the Status Quo of waste management as listed in the previous chapters and the current challenges that are experienced by waste management, the way forward is to state the strategic objectives of the Municipality and then to develop action plans or implementation instruments how to achieve the strategic objectives. Drakenstein Municipality is committed to a system of waste management that will see the least possible amount of waste going to modern engineered landfills. This will be achieved through the use of education, law enforcement and material recovery and treatment plants. New and emerging technologies, where applicable, will also play a part in overall waste management. The Waste Management Strategic Objectives for Drakenstein Municipality on which this Plan is based, commits the municipality to: • Create an atmosphere in which the environment and natural resources of the region are
conserved and protected. • Develop a communication/information/education strategy to help ensure acceptance of
‘ownership’ of the strategic objectives among members of the public and industry throughout the region and to promote co-operative community action.
• Provide a framework to address the municipality’s growing problem of waste management in
accordance with best prevailing norms, financial capacity and best environmental practice.
• Provide solutions for the three main objectives:
o The avoidance of waste generation o The reduction of waste volumes o The safe disposal of waste
-81-
\\Titan\public\Projdata\A021\IWMP\Drakenstein IWMP_Version2_10122009.docx\jm
2.7.1 Strategic Objectives
2.7.1.1 General
To ensure that Waste Management in the Drakenstein Municipal Area complies with South African and International environmental standards so that it is beneficial to industrial and agricultural growth and the public’s right to a clean and healthy environment.
2.7.1.2 Waste Avoidance To minimise the entrance of material of value into the waste stream.
2.7.1.3 Waste Reduction To reduce all waste so that nothing of value nor anything that can decompose, gets disposed.
2.7.1.4 Waste Disposal To store, dispose or treat all waste that can not be avoided nor reduced at licensed facilities with regular operational and environmental monitoring and in accordance with regulatory requirements.
2.8 ROLE OF DRAKENSTEIN MUNICIPALITY The role of the local authority in waste management is of vital importance. Drakenstein Municipality needs to provide a safe, robust, and secure system for the management of wastes generated in its administrative area. It is essential that this system can respond to changes in socio-economic situation, to changing waste composition and quantities, and to alterations in the public’s perception of waste management issues. Drakenstein Municipality must adopt, therefore, a combination of options for handling waste, tailored to meet the needs and prevailing circumstances of its particular administrative area. The combinations utilised will undoubtedly vary over time - reflecting the changing needs of local residents and the environment. The plans formulated by Drakenstein Municipality are specific to the area and its resources. They reflect the availability of suitable waste management facilities in the region, as well as local market demand for recovered materials. Special care must be taken to cater for the volatility of markets for recovered materials by ensuring that there are other suitable options to fall back on, if required. It is, therefore, highly desirable to be able to switch between waste management methods - further emphasising the hazards of relying too heavily on a single policy option instead of a combination of policies. Drakenstein Municipality has therefore initiated an Integrated Waste Management Plan to transform its waste management practices up the waste hierarchy towards sustainability. This plan is founded on South Africa’s National Waste Management Strategy and take into account the Municipality’s legal obligations regarding waste avoidance, recovery, disposal and general management. The implementation instruments or action plans defined in the following section are laid out in a manner which reflects the waste management hierarchy, putting the emphasis on waste avoidance and minimisation, with specific waste streams looked at in detail.

-82-
\\Titan\public\Projdata\A021\IWMP\Drakenstein IWMP_Version2_10122009.docx\jm
3. DRAKENSTEIN MUNICIPALITY’S IMLEMENTATION INSTRUMENTS
3.1 IMPLEMENTATION INSTRUMENTS FOR WASTE AVOIDANCE Waste avoidance and the minimisation of the generation of waste is one of the objects of the Waste Act and as such must be the priority of any Integrated Waste Management Plan. Waste Avoidance is defined as the action that avoids the entry of material into the waste stream, i.e. when the generator of the potentially waste material exercises the decision to do something else with that material rather than to put it out for waste collection. The following are examples of waste avoidance:
Composting of the organic/green waste at home, Self delivery of glass/cardboard/newspaper/PET to recycling bins or school recycling projects Re-use of empty jars as storage containers at home, Separate collection of source separated materials Separate collection of spent oils, solvents, print cartridges, x-ray and photographic
developers by recovery contractors, Reprocessing of pips, peels and lees to produce tartaric acid and grape seed oil, Reclamation of drum containers Recovery of wet or spilled grain for animal feed, Recovery of fruit and food solid waste component as animal feed, Recovery of chemicals (such as caustic soda) from industries Recovery of electronic equipment Changing raw materials of industrial processes to produce recoverable industrial waste
From the above it is clear that waste avoidance will result not only in less material to be disposed but also in less material to be collected by the waste collection system. The following are Drakenstein Municipality’s plans for the promotion of waste avoidance in its area:

-83-
\\Titan\public\Projdata\A021\IWMP\Drakenstein IWMP_Version2_10122009.docx\jm
Action General Why? When? Public Awareness and Education
Drakenstein Municipality will continue to develop its Waste Week as a public awareness and education campaign, putting special emphasis on waste avoidance and reduction at source. The campaign will endeavour to highlight ways in which the public can avoid or prevent waste generation, and to suggest alternatives to high waste producing products/activities. In addition, more proactive measures to reach the public, particularly on a local level, will be explored.
There are three principles listed in NEMA section 2 that are of particular importance when we discuss Integrated Waste Management in conjunction with public awareness and education. These principles are the following: Public participation in environmental decision-making must be promoted. The participation of vulnerable and
disadvantaged groups must be ensured. Decisions must be taken in an open and transparent manner and access to information provided in
accordance with the law. The polluter must pay for the cost of remedying pollution, environmental degradation and adverse health
impacts. The Constitution provides everyone in South Africa the right to information that is held by the government and that is needed by someone to protect their rights. The NEMA tells us in section 31 that amongst other information that you have the right to information about emissions to water, air and soil and also information about how Hazardous Wastes are made, stored and disposed of. The government in turn can get information about the environment, emissions to air, soil and water and the handling of Hazardous Waste from any private person and then one can obtain this information from the government. A person cannot refuse information about emission levels and waste products. Local authorities regulate many different issues and it is often not easy for an official to decide on the best course of action to take when faced with difficult environmental problem. Effective environmental management training will help officials to identify, predict and evaluate environmental, social or economic impacts and then to develop solutions to such environmental threats and integrate and co-ordinate the solutions into a total management plan for their area of jurisdiction. Training will contribute to the reduction of environmental degradation and its resultant negative impacts and greatly improve the quality of life for communities within their boundaries. It will also help to optimize the resources that are at a local authority’s disposal. Chapter 5 of NEMA has provisions for Integrated Environmental Management and if these provisions are not followed correctly, a member of the public could take them to court if they violated the NEMA. The above sections highlights the importance of complying with the various pieces of legislation concerning waste management, since one of our fundamental rights in the Constitution is the right to a clean and healthy environment that is not harmful to health and well-being. However, many of the Municipal employees are either not aware of all the requirements of the relevant legislation or they are simply not aware of the legislation itself. Since the Constitution provides the public with a fundamental right to the environment and NEMA provides them with the right to access to information surrounding waste management and in particular Hazardous Waste it is imperative that Municipalities ensure that they are doing everything right. If a member of public suspect that something is done in the wrong way, it is possible for them to obtain the necessary information to prove that the wrong decisions were taken or the wrong procedures followed. The public is increasingly well informed and takes much interest in environmental issues. In certain cases even better informed than the officials of the Municipalities themselves. This shows the importance of education in Integrated Waste Management at the various Municipalities at all different levels i.e. from the Head of the Waste Management Department to the person involved in collection. The Municipal officials should also be made aware of instruments that can be used to enforce waste avoidance, waste reduction and responsible disposal. We need a well-informed public that is willing and able to take collective responsibility for managing our valuable natural resource base. People should not only be provided with information but also be helped to use this
Although public participation was started during the drafting of the IWMP, the actual public awareness campaign for both the generators of waste as well as the service providers should start once the IWMP has been approved by Council. The action however does not have an end date due to the continuous nature thereof.

-84-
\\Titan\public\Projdata\A021\IWMP\Drakenstein IWMP_Version2_10122009.docx\jm
Action General Why? When? information. This includes the ability to identify environmental problems, analyze their causes and contribute to solutions, whether this is local recycling or car-pooling or contributing meaningfully to public participation processes. Since the root of the problem is not waste itself, but the attitude towards the disposal of waste, the emphasis has been on changing the mindset of the population towards one of environmental care and consideration.
Quantifying Prevention
Drakenstein Municipality will assess the possibility of using statistics and other data collected to quantify the success of prevention measures employed within the municipality. This will be done by populating the existing GIS system with relevant data. The Council will co-operate with the Waste Minimisation groups in efforts to quantify waste avoidance through the use of performance indicators and by other means.
Compiling information on waste management trends may assist in quantifying waste avoidance. It is important to ascertain whether or not waste avoidance targets are being reached and such information will also help in the setting of realistic targets for the future. In order to measure the success of waste avoidance it is important to measure all waste disposed. As part of this action the Municipality has installed a weighbridge at the Wellington Landfill. Once the waste disposed volume has been accurately measured, based on kg of waste disposed daily per person, a new target disposal unit rate will be set for the Municipality.
The implementation of this action will depend on and follow the implementation of a waste information system.

-85-
\\Titan\public\Projdata\A021\IWMP\Drakenstein IWMP_Version2_10122009.docx\jm
3.2 IMPLEMENTATION INSTRUMENTS FOR WASTE REDUCTION Waste Reduction is the secondary focus of the National Waste Management Strategy in that all waste that can not be avoided, must be reduced. In terms of definition it represents the actions required to, once the generator of waste has made the decision that a material(s) is waste and entered it into the waste stream, remove that material from the waste stream for re-use, recycling, treatment/conversion, composting, etc. and by such action prevent the material from being disposed. Examples of waste reduction are as follows:
Kerbside collection of recyclable material by informal salvagers Composting of green wastes at composting facility Recovery of recyclable material at Material Recovery Facility (MRF) Recovery of recyclable material at waste disposal site
The following are Drakenstein Municipality’s plans for the reduction of waste within its functional area.
Action General Why? When? Post Collection Recovery
Drakenstein Municipality has recently modernised its Material Recovery Facility (MRF) in Paarl where recyclable materials can be recovered from both the collected wastes and the source separated waste so that only material of no value be forwarded for landfilling. A contract for the Operation of the MRF will be advertised on tender in January 2010.
Recyclable material such as plastic, paper, cardboard, glass and metals have value when transformed or re-used as raw material. In maximising the recovery of these materials the usage of virgin raw material is reduced, thus saving natural resources. The sale of these materials also provides employment opportunities (approximately 1 sustainable job at minimum wage per 8 tons of domestic waste per day) for SMME’s. Recovery of the recyclable fraction of the waste stream also reduces the “lighter” fraction of the waste stream resulting in less risk of wind-blown litter at the disposal site. Although the mass of recovered materials is not always significant, the volume of airspace saved is, e.g. one ton of PET (2 liter cooldrink bottles) requires 48m3 of bottles. These bottles do not compact in a landfill and huge savings in airspace are achieved through its recovery. The refurbishment of the MRF will also minimise and eventually eliminate the recovery of waste at the working face of the waste disposal site, which is considered to be an indignified and unsafe activity.
This action only needs to be maintained.
Post Collection Composting
Drakenstein Municipality will establish a composting facility where the organic fraction of the collected waste stream is composted. The MRF at Paarl as received an Environmental Authorisation for Material Recovery and Composting. Once the area has been raised above the flood line level, composting of garden waste may commence at this facility.
Organic materials decompose in time and when disposed in a landfill, the decomposition occurs anaerobically (without the presence of oxygen). During anaerobic decomposition greenhouse gasses such as methane and carbondioxide are formed. These gasses have a detrimental effect on the earth’s ozone layer and internationally the generation of these gasses is being minimised. Methane is twenty one times as effective as a greenhouse gas than carbondioxide. Composting involves the aerobic (in the presence of oxygen) decomposition of organic matter and although carbondioxide is also produce during this decomposition process, no methane is produced. Composting of organic material is therefore environmentally more beneficial than landfill it, even if the compost is afterwards landfilled. Compost produced from green waste (garden clippings, etc.) is more “acceptable” to the public for usage in residential gardens since it is perceived to be cleaner than compost that has been produced from the total organic waste fraction.
This action require the establishment of infrastructure of capital investment and for that reason require financial budgetting. A timeframe of one to two years would be realistic.

-86-
\\Titan\public\Projdata\A021\IWMP\Drakenstein IWMP_Version2_10122009.docx\jm
3.3 IMPLEMENTATION INSTRUMENTS FOR WASTE DISPOSAL
The disposal of waste by landfill is considered to be the least desirable option in the Waste Management Hierarchy. The volume of waste to be disposed is a measurement of the success achieved with waste avoidance and waste reduction. Although municipal waste disposal only takes place at the municipality’s licensed and engineered landfill near Wellington, there is concern regarding illegal and informal dumping and also the storage/disposal of hazardous and health-care waste on premises inside the municipal boundaries. Limited information is also available on the disposal of hazardous and health-care waste outside of the municipal boundaries. The following are the Municipality’s plans for the disposal of residual wastes within its functional area:
Action General Why? When? Engineered Waste Disposal Facilities
The disposal of non-recoverable waste will only be allowed at properly engineered waste disposal sites that are licensed by the relevant statutory authority and that are operated and audited in terms of the relevant permit conditions. The long term capacity of the current Wellington Landfill is critical and an amendment to the current permit to increase the maximum height is currently being prepared.
Since the whole of Drakenstein is located in an sensitive environment, properly engineered waste disposal facilities that minimise the risk of environmental pollution and the degradation of the surrounding area are a prerequisite for local sustainability. Ground water resources are thus protected. Many industries within the municipal boundaries are currently using unlined evaporation ponds and with the lack of monitoring data, the pollution risk is unknown at this time. Properly engineered and operated waste disposal facilities are also beneficial to the exporters of industrial and agricultural produce in obtaining their international accreditation. The number of closed, but not yet rehabilitated waste disposal sites within the municipal area needs to be addressed.
This action is already partially being adhered to but implementation requires the continuous establishing of sufficient airspace (capacity) at these waste disposal facilities. The rehabilitation of the closed waste sites needs to be budgeted for.
Monitoring of Waste Disposal
All waste destined for disposal and disposal facilities shall be monitored for compliance with permit conditions, volumes received and for environmental impact.
All waste facilities within the Municipality have been externally audited in March 2009. Monitoring will also ensure that the Municipality is aware of the final destination of all waste, general, hazardous and health-care, that are generated within its boundaries.
Although this action is not currently required in terms of the current permits, this action is the correct environmental option to follow. Implementation can be immediately.
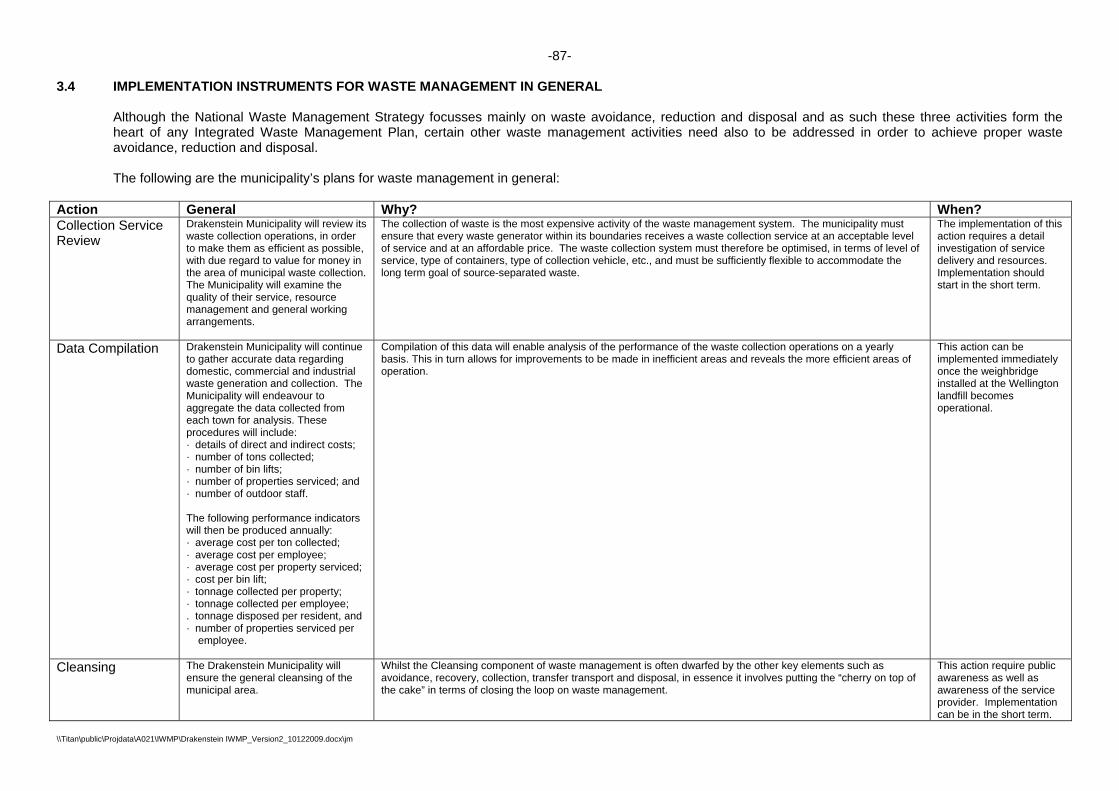
-87-
\\Titan\public\Projdata\A021\IWMP\Drakenstein IWMP_Version2_10122009.docx\jm
3.4 IMPLEMENTATION INSTRUMENTS FOR WASTE MANAGEMENT IN GENERAL Although the National Waste Management Strategy focusses mainly on waste avoidance, reduction and disposal and as such these three activities form the heart of any Integrated Waste Management Plan, certain other waste management activities need also to be addressed in order to achieve proper waste avoidance, reduction and disposal. The following are the municipality’s plans for waste management in general:
Action General Why? When? Collection Service Review
Drakenstein Municipality will review its waste collection operations, in order to make them as efficient as possible, with due regard to value for money in the area of municipal waste collection. The Municipality will examine the quality of their service, resource management and general working arrangements.
The collection of waste is the most expensive activity of the waste management system. The municipality must ensure that every waste generator within its boundaries receives a waste collection service at an acceptable level of service and at an affordable price. The waste collection system must therefore be optimised, in terms of level of service, type of containers, type of collection vehicle, etc., and must be sufficiently flexible to accommodate the long term goal of source-separated waste.
The implementation of this action requires a detail investigation of service delivery and resources. Implementation should start in the short term.
Data Compilation Drakenstein Municipality will continue to gather accurate data regarding domestic, commercial and industrial waste generation and collection. The Municipality will endeavour to aggregate the data collected from each town for analysis. These procedures will include: · details of direct and indirect costs; · number of tons collected; · number of bin lifts; · number of properties serviced; and · number of outdoor staff. The following performance indicators will then be produced annually: · average cost per ton collected; · average cost per employee; · average cost per property serviced; · cost per bin lift; · tonnage collected per property; · tonnage collected per employee; . tonnage disposed per resident, and · number of properties serviced per
employee.
Compilation of this data will enable analysis of the performance of the waste collection operations on a yearly basis. This in turn allows for improvements to be made in inefficient areas and reveals the more efficient areas of operation.
This action can be implemented immediately once the weighbridge installed at the Wellington landfill becomes operational.
Cleansing The Drakenstein Municipality will ensure the general cleansing of the municipal area.
Whilst the Cleansing component of waste management is often dwarfed by the other key elements such as avoidance, recovery, collection, transfer transport and disposal, in essence it involves putting the “cherry on top of the cake” in terms of closing the loop on waste management.
This action require public awareness as well as awareness of the service provider. Implementation can be in the short term.

-88-
\\Titan\public\Projdata\A021\IWMP\Drakenstein IWMP_Version2_10122009.docx\jm
Action General Why? When? Without proper cleansing the success of the other key elements would not be apparent as the environment would be dirty, litter strewn and unkempt. The cleansing functions in a municipality may involve all or most of the following: Litter picking – picking up of litter in streets, parks, sidewalks and public open areas. Street sweeping and cleaning of stormwater catchpits. This may involve the sweeping of all streets either
mechanically or manually and removal of debris. Also the cleaning of stormwater catchpits and channels. Street washing / sanitising – washing down and sanitising streets and parking areas which are subjected to
pollution, i.e., areas frequented by hawkers or secluded streets where the public urinate or defecate. Cleaning and sanitising of public ablution facilities Weed control in roadways
It is evident that failure to carry out the above functions will result in a very negative impact on the public and the environment, due to the high visibility thereof as well as the pollution that will result.
Alternative Technologies
The Drakenstein Municipality will continuously research alternative technologies for the treatment of waste in order to reduce waste to landfill. As part of this inisiative the Municipality has called for Proposals at the end of 2008 for the establishment of a Waste-to-Energy facility for Drakenstein. Short-listed Bidders are currently preparing Feasibility Studies in this regard for final decision in the first quarter of 2010. If proven feasible the Municipality will enter into a long term contract with the preferred Bidder.
Although the Municipality has expressed a preference for Anaerobic Digestion technology, most of the Bidders have offered a combination of technologies. The Feasibility Study will clarify the matter. Waste-to-Energy is becoming more attractive due to the rising costs of locally produced electricity and the recent rates determined by NERSA for energy derived from landfill gas or waste may prove sufficient for the economic feasibility of waste-to-energy. If AD is chosen as technology a reduction of up to 40% by mass of waste that requires landfilling may be achieved.
A decision in this regard will be made in mid 2010.

-89-
\\Titan\public\Projdata\A021\IWMP\Drakenstein IWMP_Version2_10122009.docx\jm
4. DRAKENSTEIN MUNICIPALITY’S IMLEMENTATION SCHEDULE The implementation of the above actions towards Integrated Waste Management must be scheduled in such a way that it is realistic, achievable, financially feasible and publically acceptable.
No Activity Short Term Medium Term Long Term Priority
09/10 10/11 11/12 12/13 13/14 14/19 19/25 High (H) Medium (M)
Low (L) 1. Waste Avoidance
1.1 Public Awareness and Education H
1.2 Quantifying Prevention M
2. Waste Recovery
2.1 Post Collection Recovery H
2.2 Post Collection Composting H
3. Waste Disposal
3.1 Engineered Waste Disposal Facilities H
3.2 Monitoring of Waste Disposal Facilities M
4. General
4.1 Collection Service Review H
4.2 Data Compilation H
4.3 Cleansing M
4.4 Alternative Technologies H

-90-
\\Titan\public\Projdata\A021\IWMP\Drakenstein IWMP_Version2_10122009.docx\jm
5. CONCLUSIONS AND RECOMMENDATIONS
5.1 CONCLUSIONS
The Project Team, with the assistance of municipal officials, has undertaken an analyses of the current municipal solid waste management activities within Drakenstein Municipality. The analyses has shown that the Drakenstein Municipality has through the years committed themselves to not only the delivery of a collection and disposal service for all its residents, but also to the Best Environmental Practise. Where very few municipalities are currently practising material recovery and composting, Drakenstein Municipality is at the stage where their first waste minimisation (recovery and composting) facility has been closed down after some 30 years of operation due to old equipment and the facility is currently being modernised with planned commissioning early in 2010. The chapters of this Integrated Waste Management Plan report describe the way in which the municipality is currently conducting solid waste management, which is mainly focussed on collection and disposal, and how to strategically move towards a sustainable waste management system whereby the focus will shift to the avoidance and reduction of waste rather than to the disposal thereof. It also lists the strategies of the municipality in terms of waste avoidance, waste reduction and waste disposal. During the process of the implementation of the municipality’s Integrated Waste Management Plan, and arising from the parallel public consultation process that is taking place, further input and/or corrections to the report may come to light that will then be added as a revision to the report. The analyses of the current waste management system has shown the following:
o all formal residential erven are receiving a weekly door-to-door waste collection service o approximately 4000 informal housing structures are receiving a communal bin-type service. o all collected municipal waste are disposed at the municipality’s engineered and licensed
waste disposal site near Wellington o all hazardous wastes generated within the municipal area are disposed or treated at facilities
outside the municipal boundaries o most healthcare risk wastes are managed by private contractors o no significant waste recovery is done, but the old Material Recovery Facility is being
modernised o no significant waste avoidance is done o all waste facilities are externally audited for permit compliance o some closed but not yet rehabilitated waste disposal sites exist near the smaller towns o by-laws regulating waste management only existed for the towns of Paarl and Wellington
and both documents are inappropriate for future waste management. New by-laws will have to be drafted
With the current waste management system focussing on getting the waste into the waste stream and disposing of it in an acceptable manner, and with the future integrated waste management system focussing on waste avoidance and waste reduction, the municipality requires at set of strategic objectives on how to transform from the current management system to the future management system. The strategic objectives for integrated waste management in Drakenstein Municipality can be summarised as follows:
o To ensure that Waste Management in the Drakenstein Municipal Area complies with South African and International environmental standards so that it is beneficial to industrial and agricultural growth and the public’s right to a clean and healthy environment.
o To minimise the entrance of material of value into the waste stream. o To reduce all waste so that nothing of value nor anything that can decompose, gets
disposed. o To store, dispose or treat all waste that can not be avoided nor reduced at licensed facilities
with regular operational and environmental monitoring and in accordance with regulatory requirements.

-91-
\\Titan\public\Projdata\A021\IWMP\Drakenstein IWMP_Version2_10122009.docx\jm
For these strategic objectives to be met, a series of implementation instruments (action plans) will need to be implemented. These implementation instruments as well as time framework within which it should be addressed are described in this report but need to be fully detailed at a later stage. The instruments are the following:
o Public Awareness and Education o Quantifying Prevention o Post Collection Recovery o Post Collection Composting o Engineered Waste Disposal Facilities o Monitoring of Waste Disposal o Collection Service Review o Data Compilation o Cleansing o Alternative Technologies
The above instruments, through implementation via their action plans, will ensure that waste management in Drakenstein focusses on avoidance and reduction rather than collection and disposal, but simultaneously maintaining the practical balance between the various waste management functions.
Since the highest priority for transforming the current management system is undoubtedly depending on public acceptance and ownership, the Public Awareness and Education instrument will receive preference in the implementing framework.
5.2 RECOMMENDATIONS
A comprehensive analysis and assessment of solid waste management in the Drakenstein Municipal area has been done and key strategies have been determined to aim the municipality towards sustainable and integrated waste management. It is therefore recommended that the Project Team proceeds to the next stage of the process of implementing the Integrated Waste Management Plan, which entails the consultation process with the public and the development of detail action plans and key performance indicators for future monitoring of the municipality’s successes in waste management service delivery.
REFERENCES
1 Minimum Requirements for the Handling Classification and Disposal of Hazardous Waste, DWAF,
Second Edition, 1998.
1

Annexure A
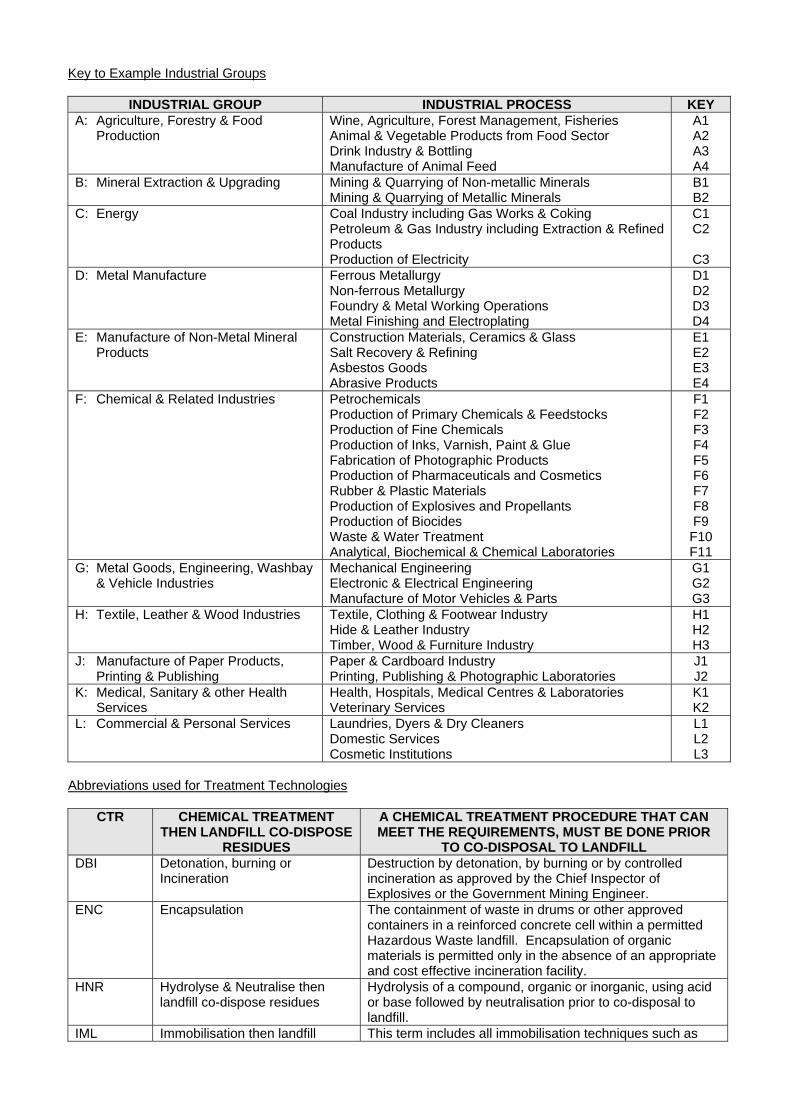
Key to Example Industrial Groups
INDUSTRIAL GROUP INDUSTRIAL PROCESS KEY A: Agriculture, Forestry & Food
Production Wine, Agriculture, Forest Management, Fisheries Animal & Vegetable Products from Food Sector Drink Industry & Bottling Manufacture of Animal Feed
A1 A2 A3 A4
B: Mineral Extraction & Upgrading Mining & Quarrying of Non-metallic Minerals Mining & Quarrying of Metallic Minerals
B1 B2
C: Energy Coal Industry including Gas Works & Coking Petroleum & Gas Industry including Extraction & Refined Products Production of Electricity
C1 C2
C3
D: Metal Manufacture Ferrous Metallurgy Non-ferrous Metallurgy Foundry & Metal Working Operations Metal Finishing and Electroplating
D1 D2 D3 D4
E: Manufacture of Non-Metal Mineral Products
Construction Materials, Ceramics & Glass Salt Recovery & Refining Asbestos Goods Abrasive Products
E1 E2 E3 E4
F: Chemical & Related Industries Petrochemicals Production of Primary Chemicals & Feedstocks Production of Fine Chemicals Production of Inks, Varnish, Paint & Glue Fabrication of Photographic Products Production of Pharmaceuticals and Cosmetics Rubber & Plastic Materials Production of Explosives and Propellants Production of Biocides Waste & Water Treatment Analytical, Biochemical & Chemical Laboratories
F1 F2 F3 F4 F5 F6 F7 F8 F9 F10 F11
G: Metal Goods, Engineering, Washbay & Vehicle Industries
Mechanical Engineering Electronic & Electrical Engineering Manufacture of Motor Vehicles & Parts
G1 G2 G3
H: Textile, Leather & Wood Industries Textile, Clothing & Footwear Industry Hide & Leather Industry Timber, Wood & Furniture Industry
H1 H2 H3
J: Manufacture of Paper Products, Printing & Publishing
Paper & Cardboard Industry Printing, Publishing & Photographic Laboratories
J1 J2
K: Medical, Sanitary & other Health Services
Health, Hospitals, Medical Centres & Laboratories Veterinary Services
K1 K2
L: Commercial & Personal Services Laundries, Dyers & Dry Cleaners Domestic Services Cosmetic Institutions
L1 L2 L3
Abbreviations used for Treatment Technologies
CTR CHEMICAL TREATMENT THEN LANDFILL CO-DISPOSE
RESIDUES
A CHEMICAL TREATMENT PROCEDURE THAT CAN MEET THE REQUIREMENTS, MUST BE DONE PRIOR
TO CO-DISPOSAL TO LANDFILL DBI Detonation, burning or
Incineration Destruction by detonation, by burning or by controlled incineration as approved by the Chief Inspector of Explosives or the Government Mining Engineer.
ENC Encapsulation The containment of waste in drums or other approved containers in a reinforced concrete cell within a permitted Hazardous Waste landfill. Encapsulation of organic materials is permitted only in the absence of an appropriate and cost effective incineration facility.
HNR Hydrolyse & Neutralise then landfill co-dispose residues
Hydrolysis of a compound, organic or inorganic, using acid or base followed by neutralisation prior to co-disposal to landfill.
IML Immobilisation then landfill This term includes all immobilisation techniques such as

CTR CHEMICAL TREATMENT THEN LANDFILL CO-DISPOSE
RESIDUES
A CHEMICAL TREATMENT PROCEDURE THAT CAN MEET THE REQUIREMENTS, MUST BE DONE PRIOR
TO CO-DISPOSAL TO LANDFILL micro-encapsulation, vitrification and solidification but not macro-encapsulation.
INC Incineration The controlled thermal destruction of the waste in a facility permitted for that type of waste. For chemical waste, appropriate pollution control equipment, e.g. for the scrubbing of acid gases, may be required.
LFL Landfilling not allowed Disposal of this waste to a landfill is not allowed. LFC Landfill co-dispose Mixing or blending of a Hazardous Waste with General
Waste within a permitted landfill with a recommended minimum ratio of 1 to 9 v/v.
LWT Landfilling without treatment Landfilling of the waste is not allowed without appropriate pre-treatment.
LFB Landfill-ash blend Mixing or blending of a flammable waste with sufficient fly ash, bottom ash or other material approved by the Department, so that the flash point is >61°C. Ash blending is considered a treatment process and therefore the resulting product must be landfill-co-disposed with municipal or commercial waste.
NCR Neutralise then landfill co-dispose residues
Addition acid or alkali to bring the pH in the region of 7. Lime is normally used to neutralise acid wastes prior to co-disposal to landfill.
OCR Oxidation then landfill co-dispose residues
Oxidise, e.g. by using chlorine or another oxidising agent, prior to co-disposal to landfill.
PRN Precipitation then landfill co-dispose residues
Addition of lime, sodium sulphide or other reagent that results in the formation of insoluble compounds that come out of solution. Usually the solids are separated from the liquids prior to co-disposal to landfill.
RCY Recovery This term includes all recycling, reuse and utilisation techniques.
RCR Reduction then landfill co-dispose residues
Reduce by using, e.g. ferrous sulphate, sodium sulphite or another reducing agent prior to co-disposal to landfill.
RTA Release to Atmosphere Small amounts of gas may be released to the atmosphere with appropriate health and safety precautions. The Department of Health should, however, be consulted about the requirements of the Atmospheric Pollution Act.
WTL Weather then landfill co-dispose residues
Exposure of the waste to the elements, e.g. the sun, in order to decompose the hazardous substance prior to co-disposal to landfill.

CELLAR PIPS AND PEELS LEES EFFLUENT / WASH WATER
SOLD IN SITU DISPOSAL
SOLD IN SITU DISPOSAL
IN SITU TREATMENT
NO TREATMENT
DISPOSAL QUANTITY kℓ PER SEASON IRRIGATION OTHER
Paarl Boland Cellar Drommedaris Str
B - B - - - - Municipal sewer Unknown
Boland Cellar Windmeul
B B - 1140.00
African Terroir (= Sonop)
? ? ? ? ? ? ? ? ?
Anuro Vineyards - - - - 90.00 Ashanti B - B - 360.00 Avondale B - B - - - 300.00 Backsberg - Composting B - - - 4000.00* Coleraine Wines - Compost B - In process of
obtaining a permit - 600.00
David Frost Wines - B - - - Unknown Oude Paarl Wijnboutique
Wine sales only. No cellar effluent
De Zoete Inval - Compost B - - - Flows away on farm
120.00
Brahms Domaine - Compost B - - - Runs through marshland
4.20
Fairview - Compost B - - - 3120.00* KWV Wine Emporium
Wine sales only. No cellar effluent
KWV Wine Fermentation Kohler Str
B - B - - - - Municipal sewer 92400.00*
KWV Distillery Kohler Str
- - B - - - - Municipal sewer Very little, incorporated in KWV Wine
Laborie - Compost B - - - Overflow to storm water
2100.00
Landskroon - Compost B - - - 42000.00 Lindhorst Wines - Compost B - - - Unknown Nederburg Wines - Sold to
manufacture B Compost
made of - - Unknown

CELLAR PIPS AND PEELS LEES EFFLUENT / WASH WATER SOLD IN SITU
DISPOSAL SOLD IN SITU
DISPOSAL IN SITU
TREATMENT NO
TREATMENT DISPOSAL QUANTITY kℓ PER
SEASON IRRIGATION OTHER grape seed
oil excess
Nelson’s Creek - Horse feed B - - Evaporation 250.00 Paarl Vinters Wine sales only. No cellar effluent. Perdeberg Winery – Perdeberg
B - B - - - 2400.00
Rheebokskloof ? ? ? ? ? ? ? ? ? Seidelberg - Compost B - - - Pump to Fairview 240.00 Simonsvlei B - B - - - Unknown Smook Wines ? ? ? ? ? ? ? ? ? Vendôme ? ? ? ? ? ? ? ? ? Vredelust - Compost B - - - 1680.00 Windmeul B - B - - - 60900.00 Zandwijk - Directly to
vineyard B - In process of
obtaining a permit - - Unknown
Wellington Bovlei ? ? ? ? ? ? ? ? ? Wamakersvallei - Compost B - Sieve only - Municipal sewer ? Wellington wines - Sold to J
Malan for compost
B - - - - Municipal sewer ?
Jacaranda - Compost KWV - - - Runs away on lawn Unknown Welvan Pas - Directly to
vineyard None - - - Runs into garden 126.00
Cape Wine Cellars ? ? ? ? ? ? ? ? ? Hildenbrand Wine & Olive Estate
- Compost B/KWV - - - - Unknown
Key: * kℓ effluent per annum for Backsberg, KWV and Fairview, not per season of 12 weeks only. Fairview has 720.00 m³ effluent per season (12 weeks) form the
cellars only. However, Fairview has cellar effluent out of season as well (12 kℓ per day) providing a combined total of 3120.00 m³ cellar effluent per year. The main Fairview effluent is made up of 3 components namely cellar effluent, sewage and cheese factory effluent. The cheese effluent generated is 40 kℓ per day and is not added to the volume of cellar effluent for this report. All three streams at Fairview are treated together prior to use as irrigation water. Fairview has a DWAF permit.
Abbreviations: B = Brenochem in Wolseley

Annexure B
EXTERNAL COMPLIANCE AND/OR STATUS QUO AUDITS OF THE DRAKENSTEIN WASTE FACILITIES
REPORT BY:
Annette Naude of Naude Associates for JPCE
DATE:
5 March 2009

-i-
Y:\Projdata\A021\Audits\AuditMarch2009.doc\jm
EXTERNAL COMPLIANCE AND/OR STATUS QUO AUDITS OF THE DRAKENSTEIN WASTE FACILITIES
INDEX
EXECUTIVE SUMMARY .................................................................................................................................... 1 1. INTRODUCTION TO THE PROJECT ......................................................................................................... 3 2. APPOINTMENT AS SUB CONSULTANT .................................................................................................. 3 3. OBJECTIVES AND SCOPE OF WORK ..................................................................................................... 3 3.1 OBJECTIVES .............................................................................................................................................. 3 3.2 SCOPE ....................................................................................................................................................... 3 4. INTRODUCTION TO THE DRAKENSTEIN WASTE FACILITIES .............................................................. 3 4.1 CLOSED GENERAL WASTE LANDFILLS .................................................................................................. 4 4.2 CLOSED BUILDER’S RUBBLE/CONSTRUCTION WASTE SITES ............................................................ 4 4.3 OPERATIONAL WASTE MANAGEMENT FACILITIES ............................................................................... 4 4.4 FACILITY ABOUT TO BE COMMISSIONED .............................................................................................. 4 5. METHODOLOGY ........................................................................................................................................ 5 6. STATUS QUO AUDIT REPORTS ............................................................................................................... 5 6.1 PAARL TRANSFER STATION .................................................................................................................... 5 6.2 WELLINGTON GENERAL WASTE LANDFILL ......................................................................................... 11 6.3 DAL JOSAFAT .......................................................................................................................................... 18 6.4 WATERUINTJIESVLEI .............................................................................................................................. 21 6.5 BOY LOUW ............................................................................................................................................... 23 6.6 ORLEANS ................................................................................................................................................. 25 6.7 GOUDA ..................................................................................................................................................... 27 6.8 HERMON .................................................................................................................................................. 32 6.9 SARON ..................................................................................................................................................... 35 7. WELLINGTON LANDFILL: PERMIT COMPLIANCE AUDIT .................................................................... 38

-1-
Y:\Projdata\A021\Audits\AuditMarch2009.doc\jm
EXTERNAL COMPLIANCE AND/OR STATUS QUO AUDITS OF THE DRAKENSTEIN WASTE FACILITIES
EXECUTIVE SUMMARY The external auditing and status quo evaluation of permitted and non- permitted waste management facilities in the Drakenstein municipality was done by Annette Naude of Naude Associates on behalf of Jan Palm of JPCE during the period 25 February to 5 March 2009. Three days of physical evaluations on 25, 26 and 27 February took place when Annette Naude was accompanied by Mr. Johan Greeff on day one as well as Mr Hannes du Preez of Drakenstein municipality, on the second and third day. The waste management facilities consist of a mixture of closed, current and soon to be commissioned facilities. With the exception of the soon to be commissioned Materials Recovery Facility at the Paarl Transfer station, all the known waste facilities since approximately the 1950’s have been audited. The waste facilities fall under the jurisdiction of the Paarl- and Wellington municipalities as well as the Regional Services Board in control of Saron, Gouda and Hermon. The waste facilities are: • Current Waste Facilities:
o Landfills Wellington Saron Hermon Gouda
o Builder’s rubble sites Hermon Gouda Saron
o Transfer Stations Paarl Transfer Station Gouda Hermon Saron
• Closed general waste facilities:
o Landfills Dal Josafat Wateruintjiesvlei
o Builder’s rubble sites Orleans Boy Louw
o Transfer stations No closed transfer stations
There are a few surprises in the audit, namely: • The Dal Josafat site was originally understood to be a builder’s rubble site. The site was used as a general
and builder’s rubble site. • The Dal Josafat site has a serious subsurface fire. • The Hermon and Gouda facilities are abused and used as general waste dumps as well as transfer stations. • The staff at Hermon and Gouda is not competent as gatemen and/or site controllers. They allow un-
acceptance waste types for dumping. The waste is then burned or dumped in water logged areas. • The current waste deposition, covering and litter control at the Wellington landfill are of a much higher
standard when compared to the previous external audit of October 2005. • With the exception of Wateruintjiesvlei, the security at all the waste facilities was not acceptable.

-2-
Y:\Projdata\A021\Audits\AuditMarch2009.doc\jm
There are areas were management support is urgently required, namely: • employing additional, trained staff • purchasing/hire of additional landfill equipment • managing the monitoring operations and results • extra allocated funds for improving security • appropriate training of the existing staff in basic such as “Identification of waste types and appropriate
disposal” The few of the final recommendations at the end of each individual facility audit report were condensed below: • A concrete crusher is required at the Wellington landfill. There are apparently companies who expressed their
interest in PP partnerships. • A wood crusher for the reduction in the volume of dry wood branches, green palm leaves and wood off-cuts is
required at Wellington landfill. • Discontinue the dumping of contaminated builder’s rubble and general waste in Hermon and Gouda.
Alternatives for the dumping of builder’s rubble should be investigated. [A similar system to the functional system used by L.O. Rall should be considered. Scrap metal is loaded by L.O. Rall from the 30m3 static bin at the Saron transfer station onto a flatbed vehicle and taken to the company depot. Can such a system work with disused bricks and light builder’s rubble? The builder’s rubble generated at Saron, Gouda and Hermon arises mainly from small building projects and should not contain bulk concrete columns, etc. A crusher at Wellington landfill can minimise the waste for re-use]
• Immediate rehabilitation of the waste dumps at Hermon and Gouda must take place. • Staff training in the basics of waste management. • Rehabilitation of the closed Dal Josafat landfill. The rehabilitation must include the re-enforcement of the river
bank; leveling of the surface areas; removal of alien vegetation; the possible preparation of a post-closure monitoring plan based on the current analytical results of the ground water and possible biogas levels; immediate extinguishing of the sub-surface fire/s. There should be security to prevent unauthorised dumping. Management must monitor the future rehabilitated surface for possible erosion and subsidence.
• Wellington landfill requires urgent hands-on management and the co-ordination of duties as required by the operating permit such as ground water, surface water and leachate monitoring.
• Wateruintjiesvlei: Re-institute biogas and leachate monitoring. The whirly bird acting as a gas extractor is not moving and is rusted. No ground water monitoring was done recently. If the ground water monitoring was indeed done, the results were not submitted to the waste department. The co-ordination of functions is not managed.
• Applications of relevant Permits/ licenses for the waste facilities under the relevant Acts.

-3-
Y:\Projdata\A021\Audits\AuditMarch2009.doc\jm
EXTERNAL COMPLIANCE AND/OR STATUS QUO AUDITS OF THE DRAKENSTEIN WASTE FACILITIES
1. INTRODUCTION TO THE PROJECT
Jan Palm of JPCE prepared an Integrated Waste Management Plan for the Drakenstein municipality during 2004. Annette Naude of Naude Associates surveyed the general and hazardous waste types and quantities for JPCE and audited the Paarl Transfer station as well as the Wellington Landfill in preparation of the IWMP. Jan Palm of JPCE was appointed as Waste Management Consultant to the Drakenstein municipality for a three year term commencing 1 July 2008. This appointment also includes the updating of the IWMP after a period of 5 years. The status quo and/or compliance audits of the waste facilities will assist Jan Palm in the evaluation of the achievements of Drakenstein municipality in terms of the IWMP goals of 2004, for facility management.
2. APPOINTMENT AS SUB CONSULTANT
Annette Naude of Naude Associates was appointed by JPCE for the auditing of waste management facilities in Drakenstein Municipality.
3. OBJECTIVES AND SCOPE OF WORK 3.1 OBJECTIVES
The objective is to evaluate each waste facility in terms of the compliance permit (Section 20(1) of the ECA, Act 73 of 1995), if issued. When a operating and/or closure permit is not available, the facility was audited in terms of General Best Practice as described in the Minimum Requirements of 2005 (Draft Third Edition).
3.2 SCOPE
The scope of the work increased on the fist day of the physical audit evaluation. The external audits were initially approved by JPCE for the following waste management facilities in the area of Drakenstein Municipality, namely: • Paarl Transfer Station • Wellington landfill • Saron Transfer Station • Saron general landfill • Dal Josafat Builder’s rubble site (?) In the pre-audit meeting with Messrs. H du Preez and J Greeff of Drakenstein municipality, the assumption was made that all existing as well as previous landfills be audited by Annette Naude. In telephonic conversation with Jan Palm of JPCE on 25 February 2009, Mr. Palm confirmed that the external audits should include the following current and closed waste management facilities, namely: • Paarl Transfer Station • Wellington landfill • Dal Josafat: Closed general waste landfill for Paarl area. • Wateruintjiesvlei: Closed general waste landfill used for the Paarl area. • Boy Louw: Closed builder’s rubble site. • Orleans: Closed builder’s rubble site. • Gouda: Closed general waste landfill and Transfer station. • Hermon: Closed general waste landfill and Transfer station. • Saron: Builder’s Rubble site and Transfer station.
4. INTRODUCTION TO THE DRAKENSTEIN WASTE FACILITIES

-4-
Y:\Projdata\A021\Audits\AuditMarch2009.doc\jm
4.1 CLOSED GENERAL WASTE LANDFILLS
There are two major closed general waste landfills, namely Dal Josafat and Wateruintjiesvlei. The Dal Josafat landfill was the general waste landfill for the greater Paarl and received general waste from domestic properties, industry-, business-, and farming communities. The site is situated on the banks of the Berg River. The site has been closed for the past 20-22 years. This site was closed when Wateruintjiesvlei was commissioned. Members of the community recall that the waste was swept down the river during floods of the Berg River. Builder’s rubble was dumped on the banks of the river in an attempt to stabilize the embankments and prevent erosion during flooding. The site was operated and closed prior to environmentally based operating permits. The surface of the site is very irregular and highly corrugated. The closed landfill urgently requires rehabilitation and monitoring due to the following situations; • There is subsurface burning in at least one area on the site. • The surface is highly corrugated and a few deep holes exist. • The landfill is probably producing uncontrolled leachate and biogas. • Unauthorised dumping takes place at the landfill • No monitoring exists
The Wateruintjiesvlei landfill was the general waste landfill for the greater Paarl and received general waste from domestic properties, industry-, business-, and farming communities. The landfill was closed according to a Closure Permit during 2000. The rehabilitated landfill is included in the south eastern border of the Boschenmeer Estate. The following are points of concern: • No ground water quality monitoring took place during the last financial year. • The biogas vent pipe is rusted and the whirly bird does not turn.
4.2 CLOSED BUILDER’S RUBBLE/CONSTRUCTION WASTE SITES
There are various sites described as builder’s rubble sites in the documentation, such as Dal Josafat, Gouda and Hermon. The following data must be corrected and/or added to the documentation, namely: • Dal Josafat is not a builder’s rubble site but a previously, closed general waste landfill. • The closed and rehabilitated building rubble sites, namely Boy Louw and Orleans must be listed as well
covered and well maintained sites. • The Saron builder’s rubble site is reasonably covered. Loose piles of rubble are present on the surface. • The builder’s rubble sites at Gouda and Hermon are mismanaged dumps. The facilities contain
contaminated builder’s rubble as well as general waste in water bodies.
Clean builder’s rubble in central Paarl and Wellington is taken to the Paarl Transfer Station for infilling as well as to Wellington landfill for disposal. The quantity of builder’s rubble generated is very high and bulk stockpiling takes place at Wellington Landfill. The provision of a crusher plant at Wellington landfill is urgently required.
4.3 OPERATIONAL WASTE MANAGEMENT FACILITIES
There are a few successfully operated waste management facilities, namely; • The Paarl Transfer Station • Wellington general waste landfill • Saron Transfer Station
4.4 FACILITY ABOUT TO BE COMMISSIONED
The MRF at the Paarl Transfer Station is nearly operational. This is an excellent initiative.
-5-
Y:\Projdata\A021\Audits\AuditMarch2009.doc\jm
5. METHODOLOGY
A formal request for a proposal to do an external audit on the following five sites was requested from Annette Naude of Naude Associates on 19 January 2009 and accepted by JPCE on 5 February 2009. The sites listed were: • Dal Josafat Builder’s rubble site; • Saron Transfer Station • Saron old landfill • Wellington landfill • Paarl Transfer Station
On arrival at the Drakenstein Waste management offices of Mr. Hannes du Preez on the morning of 25 February 2009, the municipal waste manager and his assistant requested the external evaluation and audit of all nine the Drakenstein facilities, closed and current. Mr. Jan Palm telephonically approved on the 25th February 2009 for the audits to be done during the planned period.
6. STATUS QUO AUDIT REPORTS
6.1 PAARL TRANSFER STATION
General Information: The Transfer station was commissioned in 2000 when the closure of Wateruintjiesvlei
landfill took place. All the proposed future landfills identified in a Scoping exercise by Entech (Pty. Ltd) was rejected by the I&AP during the Public Participation Process. The transfer station was built to act as a transfer point between the bulk waste generated in Paarl and the Regional Vissershok Landfill operated by the City of Cape Town. During the creation of District municipalities (DM) in the Western Cape, Drakenstein DM incorporated Paarl, Wellington and various smaller towns to the north. The Wellington landfill was then used as a disposal venue for the waste generated in Paarl.
Permit: The operating permit was never applied for. The municipality is in the process of
obtaining a RoD. Hours of operation: The hours of operation are 08.00 to 17.00 from Mondays to Saturdays. From 16.00
onwards every day, deposition of waste by incoming vehicles is stopped to allow staff to clean the plant and equipment.
Waste Types: Domestic waste, light general industrial and garden waste. Quantity: A summary of the period 2004 to 2006 is given in Table 1 below while monthly
details are given for the period 2007 and 2008 in Table 2. Table 1: Summary of annual waste entering Paarl Transfer station
YEAR Source Handling UNIT 2004 2005 2006
Garden Refuse
- Through Chipper kg 78564 41700 5060
- Directly Disposed kg 789082 3411767 3265455
Household Refuse
Ref Rem Trucks - kg 3576552 2869444 1711630All other - kg 96961 411526 537500
Industrial refuse kg 556536 2420868 1785475

-6-
Y:\Projdata\A021\Audits\AuditMarch2009.doc\jm
Table 2: Composition of various small tables of waste data relevant to the Paarl Transfer station GENERAL
WASTE PERIOD: 2007
WASTE TYPE Handling UNIT Jan-07 Feb-07 Mar-07 Apr-07 May-07 Jun-07 Jul-07 Aug-07 Sep-07 Oct-07 Nov-07 Dec-07
Garden Refuse Through Chipper kg 0 1300 2600 4820 800 400 1520 820 - - 17,290 17,480
Directly Disposed kg 260,700 4744,027 8883,312
17430,204 275,090 229,310 209,370 213,310 338,230 281,150 370,840 237,170
Household Refuse
Ref Rem Trucks kg 236820 2539660 4952580 9683970 163900 114840 74620 91,100 109,000 71,360 90,660 64,780
All other kg 63860 268910 460510 875250 86900 56940 52300 68,980 88,370 71,660 84,800 137,470 Industrial refuse kg 118960 674601 1068011 1971772 401170 107480 118820 119,140 128,610 107,090 148,220 117,810 No of Private vehicles No 3445 23221 33642 63578 3387 2397 2325 2,242 3,407 3,106 4,014 3,781 No of Paid loads No 283 1703 2705 5018 358 225 237 226 302 249 330 260 No of Cleansing vehicles No 133 720 1108 2070 141 211 213 128 - 81,621 182 - No of Other Municipal vehicles No 127 692 1073 1985 170 99 93 104 171 127 153 103
GENERAL WASTE PERIOD 2008
WASTE TYPE Handling UNIT Jan-08 Feb-08 Mar-08 Apr-08 May-08 Jun-08 Jul-08 Aug-08 Sep-08 Oct-08 Nov-08 Dec-08 45,940 69240 42,080 31,000 8,060 36,960 53680 47,600 33,860 75,580 37,800 21,380 Garden Refuse Through Chipper kg 294,780 236520 165,710 213,940 280,540 197,870 267390 180,860 197,610 359,870 245,580 265,810 Household Refuse Ref Rem Trucks kg 162,100 82,360 67,520 90,840 104,980 51,200 72600 53,490 55,380 81,000 65,540 134,280 138,660 145,100 151,510 114,120 122,000 97,020 129750 90,520 94,540 148,370 102,740 213,160 Industrial refuse kg
4,743 3,509 3,384 3,646 3,559 2,541 3054 2,521 2,596 4,110 3,392 4,564 No of Private vehicles No 274 334 307 314 375 293 322 290 240 353 259 326 No of Paid loads No 236 197 163 140 136 153 158 134 137 178 157 137 No of Cleansing vehicles No 173 163 88 161 124 119 153 140 80 149 106 103

-7-
Y:\Projdata\A021\Audits\AuditMarch2009.doc\jm
PERIOD 2009
GENERAL WASTE Jan-09 Feb-09 UNIT 2676
Garden Refuse Through Chipper kg 27700
Directly Disposed kg 0
Household Refuse Ref Rem Trucks kg 86560
All other kg 127160
Industrial refuse kg
No of Private vehicles No 4115
No of Paid loads No 334
No of Cleansing vehicles No 146
No of Other Municipal vehicles No 122

-8-
Y:\Projdata\A021\Audits\AuditMarch2009.doc\jm
Transportation of waste to the landfill: Waste Mart (Previously Martinus Waste) removes 8-10 bins of waste on a daily basis from the transfer station to be landfilled. On inspection of the bins content, there was a high volume of dry vegetation as well as bulk green palm leaf cuttings.
Number of vehicles entering the facility: The maximum number of vehicles entering the facility was on a
Saturday during summer, namely 240 vehicles. Generally summer numbers vary from 100-150 per day with lesser numbers during winter.
Area: The property is a few hectares with the new MRF and existing transfer station to the north of the
property. The surface area of the transfer station is ca. 1-1.5 metre above the ground level of the adjacent MRF. The ground level is currently raised by filling the area with clean builder’s rubble to enable vehicles to enter the MRF when commissioned.
Buildings: The office buildings are kept clean. The transfer station building urgently needs repair due to the
damage done to the building by sub contractors removing the waste from the containers. The weigh bridge building is neat and clean. The wooden structure acting as an office at the exit
needs to be replaced with an aesthetic brick building. Number of bays: There are four bays in the transfer station for the positioning of 30 m3 containers into
which the waste on the apron is loaded. There are rubber strips fitted to the apron edge of the containers that can be flipped into the containers and thus prevent spillage along the sides of the container.
Equipment: a Front-end-loader to push waste from the apron floor into the containers. Aesthetics: The total area of the property is kept neat and litter free. The collapsed and broken walls as
well as the broken and bent metal cladding on the transfer station exterior are not aesthetically acceptable. There is room for improvement in aesthetics, especially at the exit gate area as well as possible colourful signposting along the main road. (Refer to signs)
Period of disposal: The transfer station was commissioned in 2000. The waste quantity received in 2004
was about 110 tons per day.i The transfer station will be upgraded in the near future. Entrances: The vehicle entrance area is through a main gate via the weighbridge during hours of operation.
Between 06.00 and 08.00 in the mornings, the entrance for vehicles is through the exit of the facility. On the mornings of 26 and 27 February 2009, the auditor entered the facility through the exit without any security present. This situation is not acceptable.
Fencing, gate and security: There is a 2m fence around the property with a barbed wire overhang. The
fence is newly erected (January 2009), and is aesthetically pleasing as well as an improvement on security.
The entrance gate is locked after hours with a secure sliding gate. The
connection/ opening between the main entrance gate and offices are also locked after hours with a secure sliding gate. The exit gate is also lockable. Uncontrolled entry at 07.00 in the mornings is described under entrances. The security situation must be attended to urgently.
There are two security guards on foot patrol at night plus various security
cameras at the complex, namely two at the transfer station and four at the offices. The cameras are however not working.
Signs and Notices: There is a notice with operational information at the main weighbridge entrance, along
the main road. Notices must be updated. The erection of colourful billboards is proposed along the main road, towards the
entrance. The boards should graphically display the approximate size of a load of builder’s rubble on a LDV as well as the bulk of black bags filled with general waste on an open LDV that can be disposed of for free at the transfer station. Mr. du Preez
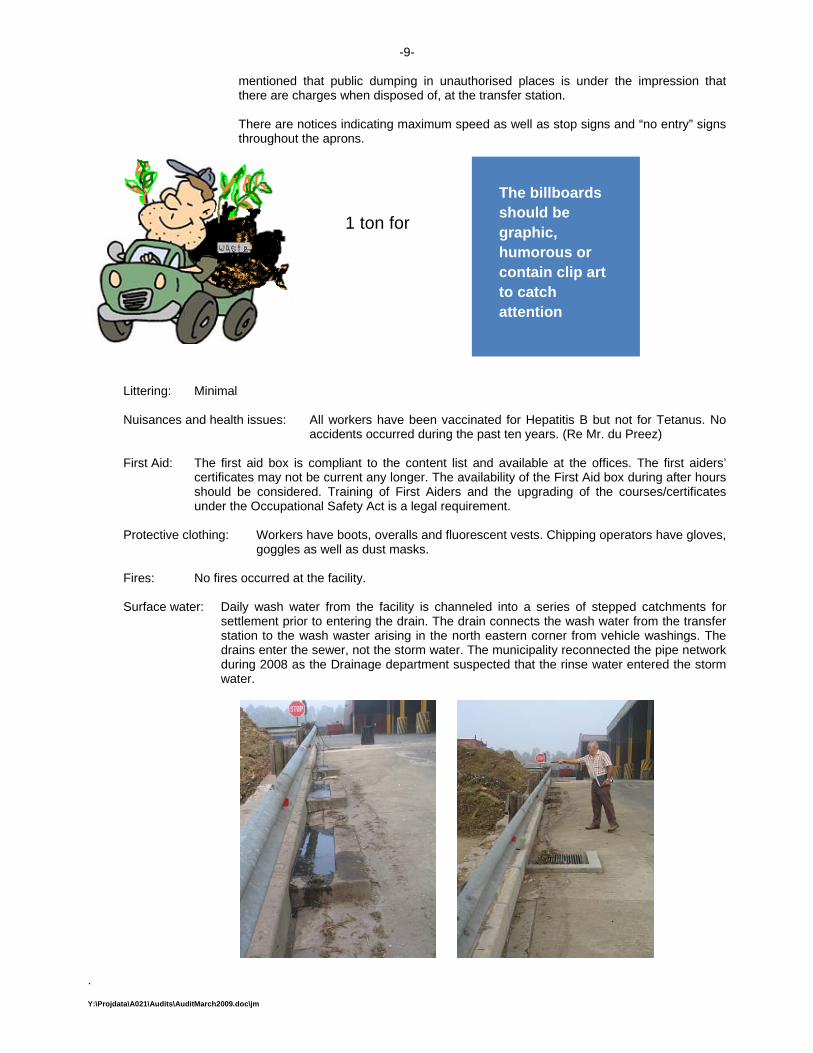
-9-
Y:\Projdata\A021\Audits\AuditMarch2009.doc\jm
mentioned that public dumping in unauthorised places is under the impression that there are charges when disposed of, at the transfer station.
There are notices indicating maximum speed as well as stop signs and “no entry” signs throughout the aprons.
Littering: Minimal Nuisances and health issues: All workers have been vaccinated for Hepatitis B but not for Tetanus. No
accidents occurred during the past ten years. (Re Mr. du Preez) First Aid: The first aid box is compliant to the content list and available at the offices. The first aiders’
certificates may not be current any longer. The availability of the First Aid box during after hours should be considered. Training of First Aiders and the upgrading of the courses/certificates under the Occupational Safety Act is a legal requirement.
Protective clothing: Workers have boots, overalls and fluorescent vests. Chipping operators have gloves,
goggles as well as dust masks. Fires: No fires occurred at the facility. Surface water: Daily wash water from the facility is channeled into a series of stepped catchments for
settlement prior to entering the drain. The drain connects the wash water from the transfer station to the wash waster arising in the north eastern corner from vehicle washings. The drains enter the sewer, not the storm water. The municipality reconnected the pipe network during 2008 as the Drainage department suspected that the rinse water entered the storm water.
.
1 ton for
The billboards should be graphic, humorous or contain clip art to catch attention

-10-
Y:\Projdata\A021\Audits\AuditMarch2009.doc\jm
Monitoring: No ground or surface water monitoring is done. The future RoD may require monitoring. Waste Recovery: There are two glass igloos placed on the apron to receive glass for recycling. MRF: The Materials Recycling Facility (MRF) is partially equipped and will be commissioned within the next
2-3 months. The facility is adjacent to the transfer station and will receive waste form the apron. A pilot project is currently run by Me. Sonja Frans. Two loads are diverted for the pilot project on Tuesdays and Thursday. The loads originate in the CBD and should have more recyclables.
Chipping: The two chippers at the facility generate approximate 5m3 of chipped product daily. The
Vermeer 935-I and Bandit Bush Chipper 190 only chips green/”wet” vegetation to a maximum thickness of 100 mm. No dry stringy or thick greens are chipped as the blades become blunt.
RECOMMENDATION: • Upgrade the facility buildings
• Provide specialised chipping equipment for fibrous green waste such as palm leaves as well as dry green
material. Such a machine may even be placed at the Wellington landfill as bulk wood blocks and other off-cuts from pallet - and furniture manufacturing enters the landfill. A dedicated bin in the transfer station may be used as raw material for the mulcher.
• The security situation must urgently be attended to. • Provide big billboards along the entrance to indicate the following:
o Size and waste type deposited in the facility FOR FREE. o All private loads are free. o Fines for unauthorised dumping in public places are the option to disposal at the transfer station. o Unauthorised dumping destroys the environment for our children.

-11-
Y:\Projdata\A021\Audits\AuditMarch2009.doc\jm
6.2 WELLINGTON GENERAL WASTE LANDFILL
General Information: The facility is a 25 hectare area containing an old landfill as well as a currently operated landfill. The old landfill was started ca. 50 years ago and closed when the new site was commissioned during 2000.
Permit: The Rod was issued on 20 September 1998 and expired in September 2000. The
operating permit was issued on 30 November 1999 for a G:M:B+ landfill operated by Wellington municipality.
Hours of operation: 08.00 to 16.00 including Saturdays. Staff complement: There is no manager currently employed. There are two gatemen employed by the
municipality that do the record keeping at the gate. The permanent gateman is Mr. John Jacobs One person is occasionally used on site at the cover excavation area or for litter collection when required. There is one worker permanently on site, acting as a controller. Ladies collecting litter are employed by the municipality. The D6 operator as well as the security people are not municipal staff but external staff on contract.
Waste Types: General waste such as domestic waste as well as large quantities of builder’s rubble
and wood. Problem waste types are handled as follows:
• Tyres are occasionally disposed off on the site. A tyre stockpile was visible near the entrance.
• Dead animals from the SPCA and farmers should immediately be trenched and covered. There were dead dogs visible on the site. The site worker explained that no trenches could be made as the D6 digger was not available as it was dedicated to the excavation of cover. Dead animals are accepted for burial between 09.00 and 15.00.
• No HCW was found on the site.
• Old chemicals are occasionally disposed off on site. Schools enquire annually
about the disposal of laboratory chemicals such as 2l alcohol, small chemical quantities, etc. This chemical waste/ residue is poured into the compacted general waste prior to covering the area with fresh waste.
Quantity: The weighbridge will probably be commissioned by end May 2009. There is
probably 200-300 ton domestic waste entering the site per day. Refer to tables 3 and 4 below for quantities.
Vehicles per day: There are ca.100-150 vehicles entering the landfill per day. Sources of waste: The bulk of the general waste is derived from the Paarl transfer station as well as the
municipal compactors servicing Wellington, Hermon, Saron and Gouda. Bulk general industrial waste and vegetation is brought to the landfill by private contractors such as gardening services, as well as dry/excess/ selective vegetative waste not shredded at the Paarl transfer station. Farmers also bring dry general waste such as broken crates, pallets and packaging to the landfill for disposal.
Area: The area is generally well managed and the perimeter kept litter free. The area is not
fenced. Port Jackson growth is controlled except in the area of the leachate pond as well as the inside of the western berm
Buildings: There is a wooden hut at the entrance. Ablution is possibly in the old buildings at the
gate. Equipment: There is a D6 dozer on hire; four tipper trucks for transportation of cover (2x 6m3 +
2x 10m3), and two water trucks (1x 1.5kl + 1x 6kl).

-12-
Y:\Projdata\A021\Audits\AuditMarch2009.doc\jm
Aesthetics: The berms are neat and vegetated, Port Jackson growth is controlled but nor eradicated. The litter is controlled on the perimeter of the site. However, on- site, the litter is abundant in the water logged areas and decreases the visual impact of the site. A constructed entrance with a garden or entrance feature will enhance the aesthetics.
Entrance: The entrance is still on the side and not via the road leading to the weighbridge. The
entrance will probably be moved to where it was originally planned when the weighbridge is commissioned. The current entrance will be used as an exit for vehicles departing from the site.

-13-
Y:\Projdata\A021\Audits\AuditMarch2009.doc\jm
TABLE 3: WELLINGTON SOLID WASTE DISPOSAL SITE (AT PRESENT ESTIMATED QUANTITIES). PERIOD 2004-2006
YEARS 2004-2006 WASTE SUMMARY FOR PERIOD 2004-2006
WASTE TYPE SOURCE/HANDLING UNIT 2004 2005 2006
Garden Refuse Through Chipper kg 0 3500 0 Directly Disposed kg 975500 3944530 4683293
Household Refuse Ref Rem Trucks kg 2678000 21294105 25157000All other kg 284500 2148495 2575280
Industrial refuse kg 429500 574000 3616300 TABLE 4: VARIOUS GRAPHS WITH DATA ON WELLIGTON LANDFILL QUANTITIES FOR THE PERIOD 2007-2009 YEAR 2007
GENERAL WASTE SOURCE/
HANDLING UNIT YEAR 2007
Jan-07 Feb-07 Mar-07 Apr-07 May-07 Jun-07 Jul-07 Aug-07 Sep-07 Oct-07 Nov-07 Dec-07
Garden Refuse Through Chipper kg 0 0 0 0 0 - - - - - - -
Directly Disposed kg 551000 751360 743500 690500 1021500 782,500 905,500 821,000 1,062,500 889,500 938,500 559,000
Household Refuse Ref Rem Trucks kg 2397000 3085000 1700800 2230000 2887000 2657000 2,700,000 2,330,000 3,150,000 3,155,000 3,510,000 2,720,000
All other kg 1727000 225860 265840 266580 432120 308720 333,200 317,660 457,520 410,480 464,980 250,440
Street Refuse kg 166000 220000 214000 172440 232000 184000 194,000 172,000 224,000 222,000 184,000 156,000 Builders Rubble kg 334000 1121500 1494500 671000 958000 890000 1,003,000 1,184,000 1,598,500 1,758,000 1,620,500 679,000 Industrial refuse kg 294000 431500 443200 422200 1257612 617760 450,000 477,080 787,940 661,720 645,740 274,480

-14-
Y:\Projdata\A021\Audits\AuditMarch2009.doc\jm
No of Private vehicles No 1509 1834 3027 2893 4356 3135 3,493 3,583 5,185 4,395 4,491 2,767 No of Paid loads No 120 175 166 189 339 255 163 172 384 311 321 106 No of Cleansing vehicles No 312 412 308 294 410 348 354 305 407 413 422 332 No of Other Municipal vehicles No 355 533 508 414 487 285 324 252 329 293 285 170 YEAR 2008 GENERAL
WASTE SOURCE/
HANDLING UNIT YEAR:2008
Jan-08 Feb-08 Mar-08 Apr-08 May-08 Jun-08 Jul-08 Aug-08 Sep-08 Oct-08 Nov-08 Dec-08 Garden Refuse
Through Chipper kg - - - - 1,000 - 0 0 0 0 0 0
Directly Disposed kg 768,500 611,000 400,000 443,500 433,000 430,000 615000 362000 357000 504000 474000 931000
Household Refuse
Ref Rem Trucks kg 3,840,000 2,280,000 2,589,000 2,731,000 2,013,600 2,508,664 2941561 2573541 2457540 3268950 2773786 3502358
All other kg 273,820 252,780 272,880 372,920 286,000 164,500 220500 157000 149000 173000 255000 647000Street Refuse kg 204,000 137,000 149,000 193,000 126,000 100,000 114000 138000 124000 156000 118000 206000
Builders Rubble kg 506,500 472,500 902,000 1,469,500 1,080,400 439,000 768500 1165500 578000 1363000 2009000 2992000Industrial refuse kg 370,060 258,880 194,460 278,560 281,980 326,500 340000 214500 179000 169000 293000 342000
No of Private vehicles No 3,366 2,695 2,701 2,738 1,807 1,598 2064 1581 1373 2133 2467 3722No of Paid loads No 167 125 130 132 61 138 139 40 24 28 31 62
No of Cleansing vehicles No 481 248 311 341 318 311 380 353 323 470 380 538No of Other Municipal
vehicles No 292 208 65 95 69 131 238 68 60 69 124 254
YEAR 2009 GENERAL WASTE
SOURCE/ HANDLING UNIT YEAR 2009 Jan-09 Feb-09
Garden Refuse Through Chipper kg 7500 Directly Disposed kg 52 7000 Household Refuse Ref Rem Trucks kg 1961538 All other kg 403000 Street Refuse kg 162000 Builders Rubble kg 1657000 Industrial refuse kg No of Private vehicles No 2808 No of Paid loads No 64 No of Cleansing vehicles No 441 No of Other Municipal vehicles No 269

-15-
Y:\Projdata\A021\Audits\AuditMarch2009.doc\jm
Roads: The road from the R44 is a solid surface gravel road with various “no dumping” signs along the route. The entrance road onto the site is a well maintained latte rite. The on-site roads are stable and maintained. The roads are however very dusty due to the seasonal conditions. Vehicles approaching the daily working face drive slowly. When the vehicles have off-loaded, they speed towards the exit and cause massive dust clouds.
Road from entrance gate leading onto site Stable roads on outer berm and on-site Litter: The wind blown litter on the inside of the perimeter berm is partially covered with sand/clay. Fencing, gate and security: The site is not fenced. There is a formal lockable entrance gate with two gatemen.
The security consists of 4 external guards plus a guard dog patrolling the site in shifts, on a 24 hour basis.
The fire that was started by the burning of cables during December indicates that
the site is freely roamed by unauthorised persons. Dust clouds generated by speeding vehicles Signs and Notices: Various signs and notices exist at the new entrance. The content of the notices should be
updated, if required
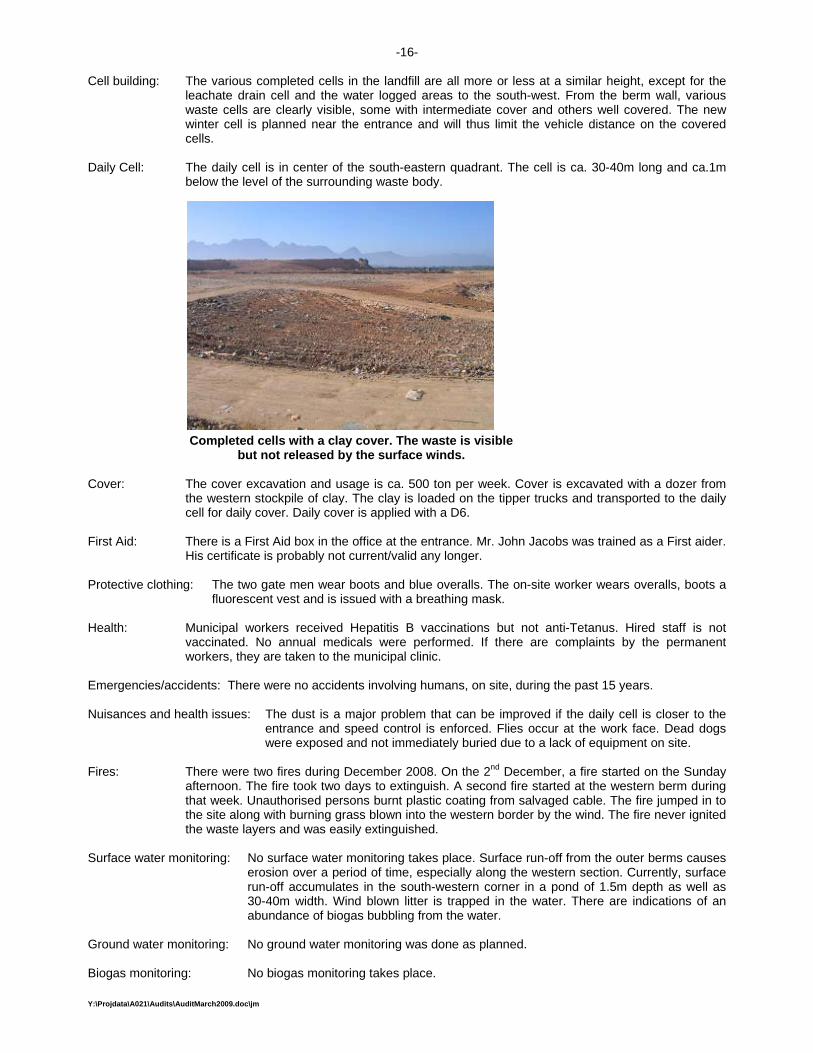
-16-
Y:\Projdata\A021\Audits\AuditMarch2009.doc\jm
Cell building: The various completed cells in the landfill are all more or less at a similar height, except for the leachate drain cell and the water logged areas to the south-west. From the berm wall, various waste cells are clearly visible, some with intermediate cover and others well covered. The new winter cell is planned near the entrance and will thus limit the vehicle distance on the covered cells.
Daily Cell: The daily cell is in center of the south-eastern quadrant. The cell is ca. 30-40m long and ca.1m
below the level of the surrounding waste body.
Completed cells with a clay cover. The waste is visible but not released by the surface winds.
Cover: The cover excavation and usage is ca. 500 ton per week. Cover is excavated with a dozer from
the western stockpile of clay. The clay is loaded on the tipper trucks and transported to the daily cell for daily cover. Daily cover is applied with a D6.
First Aid: There is a First Aid box in the office at the entrance. Mr. John Jacobs was trained as a First aider.
His certificate is probably not current/valid any longer. Protective clothing: The two gate men wear boots and blue overalls. The on-site worker wears overalls, boots a
fluorescent vest and is issued with a breathing mask. Health: Municipal workers received Hepatitis B vaccinations but not anti-Tetanus. Hired staff is not
vaccinated. No annual medicals were performed. If there are complaints by the permanent workers, they are taken to the municipal clinic.
Emergencies/accidents: There were no accidents involving humans, on site, during the past 15 years. Nuisances and health issues: The dust is a major problem that can be improved if the daily cell is closer to the
entrance and speed control is enforced. Flies occur at the work face. Dead dogs were exposed and not immediately buried due to a lack of equipment on site.
Fires: There were two fires during December 2008. On the 2nd December, a fire started on the Sunday
afternoon. The fire took two days to extinguish. A second fire started at the western berm during that week. Unauthorised persons burnt plastic coating from salvaged cable. The fire jumped in to the site along with burning grass blown into the western border by the wind. The fire never ignited the waste layers and was easily extinguished.
Surface water monitoring: No surface water monitoring takes place. Surface run-off from the outer berms causes
erosion over a period of time, especially along the western section. Currently, surface run-off accumulates in the south-western corner in a pond of 1.5m depth as well as 30-40m width. Wind blown litter is trapped in the water. There are indications of an abundance of biogas bubbling from the water.
Ground water monitoring: No ground water monitoring was done as planned. Biogas monitoring: No biogas monitoring takes place.
-17-
Y:\Projdata\A021\Audits\AuditMarch2009.doc\jm
Leachate: There is no leachate extraction from the leachate collection cell for the past few months. The
leachate cell is ca. 30-40m wide, 1.5m deep and 0.5m below the level of the surrounding waste body. The cell forms the lowest point of the landfill. The power cable of the submersible leachate pump was stolen as well as the pump. A mobile pump has now been obtained and pumping should start soon. The leachate is pumped into the sewer line.
Mossgass oxidation dams: The Mossop owners expect the Drakenstein municipality to rehabilitate the dam area if
the municipality is interested in obtaining the property for the possible expansion of the landfill.
Waste Recovery: No waste recovery takes place on the site. There is a bulk quantity of builder’s rubble which can
be crushed and re-used. The bulk of dry vegetation arriving from the transfer station, the thick branches (>200mm), and green palm leaves are disposed off with the wooden blocks and off-cuts from joineries and crate manufacturers. The treated wooden blocks should not be a problem when incorporated with shredded or chipped garden waste. The chipped product should not be used for composting but as mulch directly on the surface of flower beds.
MRF: Waste pre-sorted at the Paarl transfer station CHIPPING: Chipping is required due to the high volume of wood and vegetation thrown away. Refer to
requirements. Requirements: • The landfill urgently requires a concrete crusher. • The landfill urgently requires a shredder to mulch the dry wood and vegetation as well as the wooden blocks
from broken pallets and furniture manufacturing. • The lack of dedicated compaction equipment is alarming and should be rectified. • The lack of excavation equipment is alarming and should be rectified. • Fencing must be replaced. • The further use of the oxidation dams must be finalised as the dams may continually produce ground water
contamination. • Ground water monitoring must urgently be re-instituted. • Surface water monitoring must be evaluated. • Biogas monitoring must be evaluated. • Leachate drainage from the site is dysfunctional. This operation must be re-instituted with immediate effect.
Continuous analysis of the leachate quality is advised. The geo-hydrology report must contain Piper diagrams of the Mossop dam content, raw leachate and ground water analysis in order to match the profile of the contaminated ground water with the source of contamination. This is important as it may in future prove where the ground water contamination was from and what influence the Mossop dams had on the ground water quality.
• Airspace surveys to determine future volumes of space available as well as airspace used, should be instituted.
• The plans with the final levels must be consulted as well as the permit requirements to determine if the current perimeter berm can be raised prior to the waste body filling the current berm.
• Proper drainage for surface water run-off must be constructed according to plan, prior to the rainy season. The accumulation of run-off along the outer perimeter road caused deep mud tracks and inaccessible areas adjacent to the southern outer berm.
• Speed control of empty vehicles will reduce the dust. This can only be implemented if the on-site roads are demarcated, display speed signs and more staff is employed to assist with the site management.
• Staff should urgently be trained. • A first aider must be trained.

-18-
Y:\Projdata\A021\Audits\AuditMarch2009.doc\jm
6.3 DAL JOSAFAT
General Information: Closed general waste landfill for Paarl area. The site was used as a town dump during the estimated period of 1950’s-1970, until Wateruintjiesvlei was operated as the “new” dump. Waste disposal activity could even be pre 1950’s. People growing up in the area recall that the banks of the Berg river was periodically washed away and waste and rubble littered the river banks towards the north of the site. The embankments were stabilised with rubble. However, the river swept all the filling and waste away when in flood. Permit: The site was operated prior to permitting regulations. Waste Types: General domestic-, industrial-, business- and farming waste as well as builder’s rubble. Quantity: Unknown. No data was available from the municipality. Area: 500-600m in length and 300-400 m in width. The area is probably 2-3 meter deep. No
equipment was used on the site and cover was probably not used. The waste body is thus ca. 300 000m3-480 000m3.
Period of disposal: Possible pre-1950’s to 1970’s. Entrance: The entrance is via Jupiter road, a solid surface service road to the northern industries. At
Sherwood Design, a well maintained gravel road leads to the entrance. There was a chain across the road to prevent unauthorised access, now vandalized. Evidence of tracks entering the site is all around the entrance areas and across the slight soil berms along the access road.
Soil berm to discourage unauthorised entry. Vandalised chain used in road closure
Signs and notices: There are two signs visible near the entrance:
• A small sign in 3 languages prohibiting unauthorised entry. • A Transnet sign in 3 languages, stating: Danger; Sink holes; No access.
Fencing, gate and security: None
Monitoring: No ground- or surface water monitoring takes place. No physical monitoring of the condition of the covered surface for sinkholes, smouldering, corrugation, erosion or ponding takes place.
Littering: Minimal as even partially eroded and/or collapsed surfaces are still covered.

-19-
Y:\Projdata\A021\Audits\AuditMarch2009.doc\jm
Nuisances and Health Issues: Smoke from smouldering subsurface fire/s. Fires: Smouldering of subsurface fires occur at one or two areas in the landfill. Mr. du Preez mentioned that
the recent veld fire initiated the subsurface fire. The smaller fire towards the deep unfilled hole may be a remnant of the surface fire. The area smouldering towards the north-west is clearly a sub surface fire with an area of 5m x 4 m, Mr. du Preez also informed the auditor that there were previously fires in the same area.
In consultation with Jan Palm, the following action must immediately be taken to prevent the
spreading of the subsurface fire.
1. Excavate a trench of 1.5 to 2 metre around the smouldering area. 2. The trench should be at least 1-2 metre from the visible edges of the smouldering area. 3. Be well aware of slight cracks in the surface that may indicate the extent of the subsurface
smouldering. Surface vents are not always present but may act as an indication of oxidative activity.
4. Insert clay into the trench and compress with the bucket of the excavator to prevent air movement in and out of the area.
5. Place clay over the inner smouldering area, if possible. Do not endanger any equipment or human operators during the process.
6. If the covering of the smouldering area is not possible, it is advised to closely monitor the burning and fill the area up with clay once the fire is extinguished.
7. The demarcation of the area is important as well as the notification of physical danger. 8. Notification to DWAF and/or DEADP is advised.

-20-
Y:\Projdata\A021\Audits\AuditMarch2009.doc\jm
Recommendation: • Urgent application of Closure Permit/ Licence as advised by DEADP. • Current analysis of as well as possible future monitoring of the ground water must be done if the
ground water is contaminated compared to the quality of the inflow. • Re-enforcement of the riverbanks to prevent rubble and waste being washed from the site, when the
Berg River is in flood. • Leveling of the surface area. Filling of sink holes and other hollow areas. • Closure of the site in terms of legal requirement. (Possible notifications to authorities, etc). • Internal and external audits to monitor the physical situation. • Continual ground water monitoring until the water quality returns to the original quality. • Continual biogas monitoring even if the site is possibly more than 30 years old. The presence of biogas
is a reality as the smouldering of the site indicates possibly biogas supply from the subsurface waste bodies.

-21-
Y:\Projdata\A021\Audits\AuditMarch2009.doc\jm
6.4 WATERUINTJIESVLEI
General Information: Closed general waste landfill used for the Greater Paarl area. The Wateruintjiesvlei
landfill became operational with the closure of the Dal Josafat landfill site, ca 30 years ago. The site was operated as a general waste landfill until 2000.
Permit: A DWAF Operations to Closure permit was issued. No permit was available from the
municipality. The audit is in a status Quo report back format due to the lack of information. Area: The current area where the landfill was is currently used as a putting area. Entrances: The access to the landfill area is via the northern gate of the Boschenmeer Estate. Once
through the main gates, take the left turn into Lavender road, just before reaching the Club house. A special electronic key is required from security to continue across a bridge in Lavender road prior to entering the southern side of the Estate.
Fencing, gate and security: Part of the Estate. Signs and Notices: None indicating that the area was an old landfill. Nuisances and health issues: Not visible, except for the possible retainment of the biogas in the site due to
the rusted pipe fitting connected to the whirly bird. Littering: None Disposal: The disposal of vegetative waste along the northern edge of the old landfill is not acceptable.
A chipper should be used and/or the waste processed if the Estate has a Waste Management Plan. The dry vegetation is a fire hazard to the greens.
Eastern border with inner perimeter road and bulk, dry vegetation.
Surface water: No monitoring takes place. No erosion is visible on the eastern slopes due to run-off.

-22-
Y:\Projdata\A021\Audits\AuditMarch2009.doc\jm
Monitoring: Ground water monitoring and biogas monitoring are permit requirements. There is no monitoring done. The biogas monitoring equipment fixed against the extended outlet was locked. However, if there is no movement of the whirly bird. Thus, monitoring cannot be done.
Waste Recovery: None Recommendation: • Urgently correct the situation regarding the lack of biogas monitoring. • Urgently correct the situation regarding the lack of ground water monitoring. • Evaluate the need for the management of the dry vegetation.

-23-
Y:\Projdata\A021\Audits\AuditMarch2009.doc\jm
6.5 BOY LOUW
Terraced eastern border towards the Berg River
General Information: Closed builder’s rubble site on the western border of the Berg River. The site
“closed” during 1990 and was last used in 1992 when the municipality disposed of dry branches on the area. The area was leveled and covered by the Paarl municipality during 1993.
Level surface and natural vegetation
Permit: None. Fencing, entrance and security: The site is visibly fenced on three sides, namely the northern road, the
western side adjacent to the Bergrivier Boulevard road, the southern side as it forms part of the Boy Louw sports complex fence.
Waste Types: Only builder’s rubble. Quantity: Unknown. Estimated to be 140m x 140m x 2.5m = 50 000m3
Area: The surface is well covered, level, maintained and sponsors vegetative grasses. The surface is on average ca. 2.5-3 metre above ground level as the ground level drops from the south to the north. However, in the south-western quadrant, there is a deep hollow area in which a tree grows. The tree top is level with the surface and seems to be surface vegetation growing on the area. A few Port Jackson trees grow on the surface and along the perimeter. The trees are apparently regularly removed by the municipality. When the grass exceeds a certain height, the fire department requests that the grass be cut. This is done by the waste department approximately twice a year.
The northern edge is shaped into a berm with by a 2:1 slope. The slope is covered with vegetation and not eroded.

-24-
Y:\Projdata\A021\Audits\AuditMarch2009.doc\jm
The western border is just below the road level and is not eroded. The southern border forms a 1.5m step onto the shoulder of the rugby field. The step is not eroded. The eastern border towards the river forms a series of two terraces towards the green shoulder of the Berg River bank. The area is not eroded and covered in vegetation.
Cover: Laterite is visible between the dry grass and formed a solid impermeable cover that does not
easily erode. Notices: None indicating the position or existence of a closed builder’s rubble site. Aesthetics: The area projects as a natural field adjacent to the sport fields.
Hollow in southern quarter Evidence of cooking fires
Entrances: The entrance is from the main gates of the Boy Louw sport field in Berg River Boulevard.
There is no road leading up to the area. Nuisances and health issues: None caused by the waste content (builder’s rubble). However, there are
signs of vagrants living in the hollow area on the site. Surface water drainage: No surface water monitoring takes place and it is probably not required. The water
drains towards the low lying area to the north as well as the Berg River to the east. There are no demarcated drainage trenches. However, the flow did not visibly cause erosion channels.
Monitoring: There is no monitoring taking place, not even physical inspections for erosion or possible
ponding on the surface. Recommendation: • Fill the big holes that were left open/ unattended as to maintain an even surface area. • Monitor surface and slope conditions annually for erosion and possible ponding. • Control alien vegetation such as Port Jackson growth. • Evaluate the installation of surface drains.

-25-
Y:\Projdata\A021\Audits\AuditMarch2009.doc\jm
6.6 ORLEANS
Entrance with dumping
General Information: Closed builder’s rubble site. The site is on the banks of the Palmiet River in Paarl-
East, along van der Stel road. The site was operated for 16 years and closed during 2000.
Waste Types: Only Builder’s rubble. Area: The area of the waste body is estimated to be 500m x 250m by 2.5 to 3 m high = 375 000m3. Buildings: There is a “bus stop” type structure at the entrance that was a security hut.
Level vegetated surface of the site
Aesthetics: The surface area is level and well covered. There are no major surface indentations or hollow
areas. Towards the south, the Palmiet embankment is stepped down in terraces and supported with Gabion baskets. Towards the west, the sites slope gradually to ground level. The north western corner is as high and matches the roof level of the houses due to the adjacent hockey and/or soccer fields. The sports fields are at the same surface level as the builder’s rubble field. The areas are split by a palisade fence. The sports area was filled by the Parks Department. The material used for filling is not known.
Erosion: Not visible. Health and Safety: Minimal problems should arise from a builder’s rubble site. Cover: Laterite is visible between the dry grass and formed a solid impermeable cover that does not easily
erode. A few Port Jackson trees grow on the surface and along the southern perimeter. The trees are apparently regularly removed by the municipality. When the grass exceeds a certain height, the fire department requests that the grass be cut. This is done by the waste department ca. twice a year.

-26-
Y:\Projdata\A021\Audits\AuditMarch2009.doc\jm
South western corner with Palmiet. North western corner also showing Palmiet
embankments with green vegetation. Period of disposal: Possibly 16 years. Entrances: There is one entrance from van der Stel road. Fencing, gate and security: A palisade fence separates the northern sport fields from the area. No other
fencing or access control exist. Signs and Notices: None. Littering: There is a lot of littering at the entrance where the “shack” holders drop the refuse. This
happens on a daily basis. Stray dogs rip the refuse open and windblown litter collects on the pavement of van der Stel road.
Illegal dumping: There are a few loads of builder’s rubble and other non organic waste dumped on the
surface. Surface water drainage: The surface water flow is not causing visible erosion on the slopes or surface of the
area. The water drains towards the Palmiet River.
Palmiet River embankment
Monitoring: No monitoring takes place. Recommendations: • Control the alien vegetation such as the Port Jackson, especially along the Palmiet river banks. • Monitor surface and slope conditions annually for erosion and possible ponding. • Launch an intensive drive to educate the surrounding shack dwellers not to cause windblown littering or
waste deposition in the entrance of the site. Alternatively, place a container at the entrance of the site and encourage waste to be placed in the container.
• Evaluate the installation of surface water drains.

-27-
Y:\Projdata\A021\Audits\AuditMarch2009.doc\jm
6.7 GOUDA
Domestic waste removal system: One 19m 3 compactor is dispatched from the Paarl depot for the weekly door-to-door collection of domestic waste in Gouda. Gouda residents are issued with wheelie containers. The compactors also clear the 5m3
bins at the transfer station. General Information: Gouda once had a rail station that is no longer in use. Currently there are a few
shops in the town as well as a farmer’s co-operative. There is a bottle bank for glass recycling at the depot in town. The streets are
continually swept by three ladies. The sweepings are deposited at the transfer station via black bags left on the side walk and collected by the tractor-trailer. The facility supervisor/gateman also cuts the grass of the town in open spaces and sprays pesticides, if required.
General waste dump and transfer station: The facility is 2-3 km towards the western border of the town.
The northern area was cleaned in 2000 by the Drakenstein municipality and ca. 200t of mixed general waste and rubble was removed to the Wellington landfill. The site is currently listed as a transfer facility, although it seems as if the facility is fully operational as a general waste dump. The general waste dump consists of various small dumping spots as well as a large area in a hole filled with rain water. The waste areas are probably burnt daily.
The transfer station waste is removed once a week to the Wellington landfill for disposal. However, due to demand, the waste is often removed 2x per week. One of the compactors for Saron or Harmon collections is then diverted to remove an extra load from the transfer station,
Old dumping area adjacent to oxidation ponds
Permit: None Hours of operation: 8.00 to 16.00, including Saturdays. Staff complement: Mr. Freek Human is the permanent worker at transfer station and Mr. Flip Jagers,
tractor driver. Both were wearing protective shoes, blue pants and a highly visible vest.
Vehicles: A tractor and trailer for collection of waste from the town. The houses are issued with black
wheelie bins. No equipment is available on site. Waste Types: General and business waste from fruit juice factory (Gouda Fruit Packers), dead animals
from farms, wooden blocks and builder’s rubble.
Asbestos roof sheets are dumped near the general waste area. The sheets should be kept wet and moved into the waste dump. Care must be taken that workers stay upwind

-28-
Y:\Projdata\A021\Audits\AuditMarch2009.doc\jm
during the procedure, that the waste is kept very wet and that no further plates are broken. Workers must be issued with applicable dust masks. Tomi’s abattoir, between Hermon and Gouda used to dump ca. 6 m3 per month of salts from the tanning of hides, on the surface area of the site. This practice continued for the past 20 years and was only stopped during December 2008. The central area of the site is covered in a white salt crust due to the leaching of the salt heaps that were recently leveled and/or moved to the waste body. Gouda Fruit Packers is said to burn the office papers at least once a week on the site, after hours. (The auditor is concerned about this statement made by the site worker. The probability is better that the paper waste is burnt during the day). There is a strong odour of decaying meat at the main waste dump. The worker contributes the malodour to the deposition of dead animals in the waste. Dried vegetation forms a large visible part of the dumping area.
Access road: The road from town is graded and the hard surface is maintained. Facility Entrance: The entrance has a well ventilated container used as a store. The container is on a raised
area next to the entrance and garnished with rock and surface stones. The gate is in a good condition but cannot lock. There is no water or ablution.
Fencing, gate and security: No fence exists around the site. There is a farm fence forming a short
demarcation near the oxidation ponds. There are cows grazing in the area. There is no security.
Signs and Notices: A sign at the entrance requests that waste be placed in the containers at the transfer
station. Nuisances and health issues: The malodour of the site, especially around the waterlogged dumping area is
alarming. Fires may cause serious environmental harm if burning is continued as a waste disposal practice. Flies were observed on the site. Cows graze freely on site.
Littering: Littering encrusts the sides of the oxidation ponds due to wind blown litter.
Neat entrance area Municipal notice at gate
Aesthetics: The site is visually not acceptable. First Aid: No trained first aiders or first aid box available Transfer Station: The support wall structure of the transfer station was build with tyres. The movement of the
earth caused a collapse, or near collapse of the support structure in some areas. There are currently 3 containers placed in the transfer area, with existing space for a fourth. The worker on site requests the placement of 5-6 containers due to growing

-29-
Y:\Projdata\A021\Audits\AuditMarch2009.doc\jm
demand. The containers are 5m3 bins that can be tilted into the compactor vehicles servicing the bins. The bins are much higher than the adjacent ground level at the parking bay. The bins are also not fitting tightly against the side of the transfer station wall due to the partial collapse of the wall. Waste collects between the tyres and the containers. The frequency of removal is scheduled as once a week. However, in reality removal of the waste takes place 2 xs per week. The second removal is often on Fridays or Saturdays.
Support wall of transfer station The support walls of the transfer station
is visible at the end and on the RHS of the entrance road.
Number of bays: There are four bays with three in use. The containers are 5m3 and lifted by the two 19
m3 compactor vehicles from the Paarl municipal depot. Waste dumps: The raised, levelled area within the facility that is behind and is adjacent to the transfer
area is filled with waste. The depth of the in filled area is ca. 2m below ground level and 1.5 m above ground level, thus a total of 3.5m in depth. The filled area forms 60-70% of the area of the facility, estimated to be 70m x 70m.The waste dumps are scattered and vary in size.
There are two areas where paper waste is burned. There is an area for vegetative
dumping as well as an area for dumping of general waste within a water logged hollow. Occasional dumping of builder’s rubble, asbestos roof sheeting, etc is also speckled across the surface of the facility. There is no cover material and builder’s rubble was used to progressively cover the waste.
The water logged dump is ca. 20m x 30 m with a depth below surface of 1.5-2m.
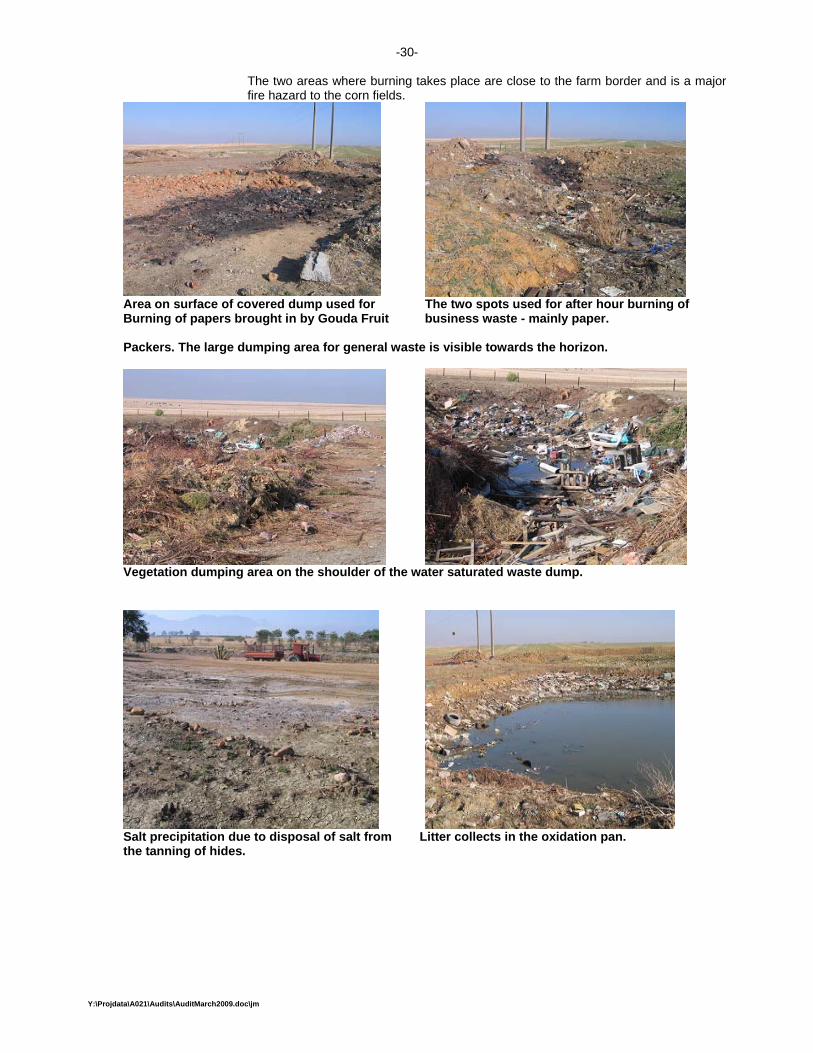
-30-
Y:\Projdata\A021\Audits\AuditMarch2009.doc\jm
The two areas where burning takes place are close to the farm border and is a major fire hazard to the corn fields.
Area on surface of covered dump used for The two spots used for after hour burning of Burning of papers brought in by Gouda Fruit business waste - mainly paper. Packers. The large dumping area for general waste is visible towards the horizon.
Vegetation dumping area on the shoulder of the water saturated waste dump.
Salt precipitation due to disposal of salt from Litter collects in the oxidation pan. the tanning of hides.
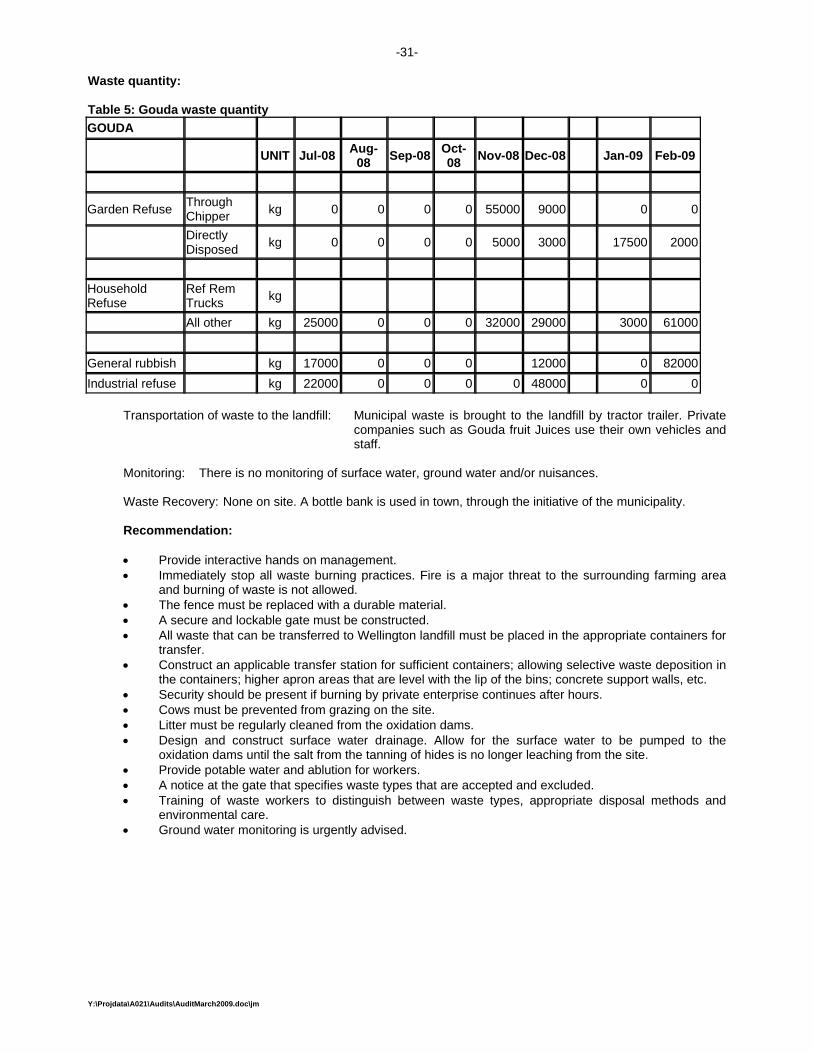
-31-
Y:\Projdata\A021\Audits\AuditMarch2009.doc\jm
Waste quantity: Table 5: Gouda waste quantity GOUDA
UNIT Jul-08 Aug-08 Sep-08 Oct-
08 Nov-08 Dec-08 Jan-09 Feb-09
Garden Refuse Through Chipper kg 0 0 0 0 55000 9000 0 0
Directly Disposed kg 0 0 0 0 5000 3000 17500 2000
Household Refuse
Ref Rem Trucks kg All other kg 25000 0 0 0 32000 29000 3000 61000
General rubbish kg 17000 0 0 0 12000 0 82000Industrial refuse kg 22000 0 0 0 0 48000 0 0
Transportation of waste to the landfill: Municipal waste is brought to the landfill by tractor trailer. Private companies such as Gouda fruit Juices use their own vehicles and staff.
Monitoring: There is no monitoring of surface water, ground water and/or nuisances. Waste Recovery: None on site. A bottle bank is used in town, through the initiative of the municipality. Recommendation:
• Provide interactive hands on management. • Immediately stop all waste burning practices. Fire is a major threat to the surrounding farming area
and burning of waste is not allowed. • The fence must be replaced with a durable material. • A secure and lockable gate must be constructed. • All waste that can be transferred to Wellington landfill must be placed in the appropriate containers for
transfer. • Construct an applicable transfer station for sufficient containers; allowing selective waste deposition in
the containers; higher apron areas that are level with the lip of the bins; concrete support walls, etc. • Security should be present if burning by private enterprise continues after hours. • Cows must be prevented from grazing on the site. • Litter must be regularly cleaned from the oxidation dams. • Design and construct surface water drainage. Allow for the surface water to be pumped to the
oxidation dams until the salt from the tanning of hides is no longer leaching from the site. • Provide potable water and ablution for workers. • A notice at the gate that specifies waste types that are accepted and excluded. • Training of waste workers to distinguish between waste types, appropriate disposal methods and
environmental care. • Ground water monitoring is urgently advised.

-32-
Y:\Projdata\A021\Audits\AuditMarch2009.doc\jm
6.8 HERMON
Domestic waste removal system: One 19m 3 compactor is dispatched from the Paarl depot for the weekly door-to-door collection of domestic waste in the town of Hermon. The Spoornet houses do not have any waste containers and are not serviced by the municipal compactor from the Paarl depot. Town residents in Hermon are issued with wheelie containers. The compactor also clears the 5m3 bins at the transfer station, while doing the Hermon round
General Information: Closed general waste landfill and Transfer station. The area was cleaned during
April 2008 when an excavator removed the litter from the dam. Used tyres and rubble were dumped on the edge of the dam and excavated to reconstruct the side of the dam. During the week, ca. 500 t of waste was removed to make the area more aesthetic and manageable.
The entrance to the facility is via an access road to the cemetery that also turns into the transfer station. There is a windbreak to the west consisting of 5m high pine trees planted by the neighbouring farmer.
Permit: None Hours of operation: 08.00 to 16.00, including Saturdays. Workers: Mr. Denzel Thomas is the “gateman”. He was not on site when the auditor arrived. The site was
left open and unattended. He wore safety shoes, a blue pair of pants and a highly visible vest. Mr. du Preez experienced problems with the worker understanding that he falls under the supervision of the Paarl depot and not the local municipal worker that prepares his pay packet.
Waste Types: The dam contains litter indicating that the “builder’s rubble” placed on the sides of the dam
is not clean and that probable loads of domestic waste is still disposed off in or adjacent to the dam instead of in the transfer station containers.
Quantity: Table 6: Hermon waste quantity
HERMON
UNIT Jul-08 Aug-08 Sep-08 Oct-08 Nov-08 Dec-08 Jan-09 Feb-09
Garden Refuse Through Chipper kg 0 0 2000 0 0 0 0 0
Directly Disposed kg 13000 11000 4000 10000 0 17000 11000 13000
Household Refuse
Ref Rem Trucks kg All other kg 14000 16000 23000 19000 36000 29000 27000 23000
General rubbish kg 11000 20000 27000 24000 13000 14000 12000 15000
Transportation of waste to the landfill: The Spoornet owned houses, recently sold to a private developer,
are not issued with black wheelie containers for domestic waste storage. There is thus no formal waste collection system for that specific sector. Residents must take their waste to the transfer station. The formal houses in town are all issued with the wheelie containers that are serviced once a week by the 19m3 compactor from the Paarl depot.

-33-
Y:\Projdata\A021\Audits\AuditMarch2009.doc\jm
Number of vehicles entering the facility: Unknown. Area: The area of the facility is ca.100m x 100m. The ground is sloped towards the north-west. The
central area was a disused quarry of 3-4m depth that is filled with water. The water is possibly ground water. There are Port Jackson and “oliebos” growing in the area.
Buildings: There is a well ventilated container at the entrance that is used as a store room. There is no site
office, ablution or potable water. A “shack” type shelter is constructed at the gate and is probably used as an office.
Number of bays: There are three bays in the transfer area. The walls of the bays are not stable and the
bins are too high to accommodate easy transfer for moving the waste from an open LDV or car boot into the 5m 3 bins.
Unstable transfer station walls Container area.
Equipment: There is no equipment on site. Aesthetics: Poor due to windblown litter in the water as well as dirty builder’s rubble in the dam. Roads: The access road from the cemetery to the gate is ca. 100m. The road is well graded and has a
solid surface. The on site road is in a good condition. Entrances: The entrance is well maintained with a secure and lockable gate. Fencing, gate and security: There is a secure, well maintained chicken wire fence around the site. There
are three strands of barbed wire on top of the fence but it does not form an overhang.
Signs and Notices: There is a notice at the gate indicating that only domestic waste is allowed in the
containers and that builder’s rubble is not allowed. This notice is contradicting the actual practice on the site.
Nuisances and health issues: Litter and organic waste in the water will severely affect the quality of the
water in the dam. Flies were present. Littering: There is a vast quantity of litter visible in the dam.
Contaminated builder's rubble

-34-
Y:\Projdata\A021\Audits\AuditMarch2009.doc\jm
First Aid: There is no trained first aider and/or first aid box on the site. Fires: None Surface water drainage: The surface water drains topographically towards the lower north western
gradient. There is a trench along the north-western fence line that allows drainage towards the gate. Underneath the storage container, a drain pipe is installed.
Monitoring: None. There is an urgent need for determining the possible continuity of the dam water with
the ground water. Waste Recovery: None
Notice the well constructed Drainage along the north-western drainage system. border towards the gate.
Chipping: None Recommendation: • Provide interactive hands-on management. • Co-ordinate the notice content with the actual practice. • Uncontrolled dumping is observed, indicating the probable absence of the worker when loads arrive. • Record keeping will not be accurate if the gateman is frequently absent. • Construct an applicable transfer station for sufficient containers; allowing selective waste deposition in
the containers; higher apron areas that are level with the lip of the bins; concrete support walls, etc. • Train the gate worker in acceptable waste types and appropriate disposal/ containment methods. • Provide a service to the “Spoornet” houses. • Educate residents in waste types acceptable at the transfer station. Provide possible options/ selective
containers for vegetative waste.
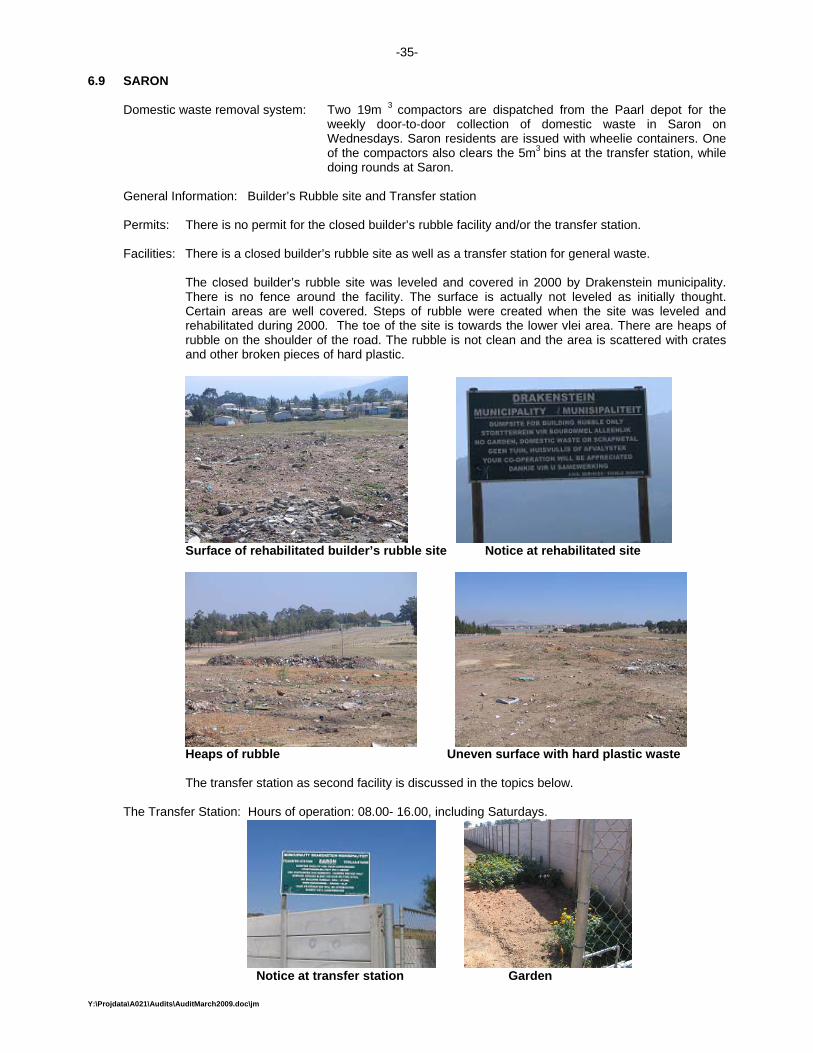
-35-
Y:\Projdata\A021\Audits\AuditMarch2009.doc\jm
6.9 SARON
Domestic waste removal system: Two 19m 3 compactors are dispatched from the Paarl depot for the weekly door-to-door collection of domestic waste in Saron on Wednesdays. Saron residents are issued with wheelie containers. One of the compactors also clears the 5m3 bins at the transfer station, while doing rounds at Saron.
General Information: Builder’s Rubble site and Transfer station Permits: There is no permit for the closed builder’s rubble facility and/or the transfer station. Facilities: There is a closed builder’s rubble site as well as a transfer station for general waste.
The closed builder’s rubble site was leveled and covered in 2000 by Drakenstein municipality. There is no fence around the facility. The surface is actually not leveled as initially thought. Certain areas are well covered. Steps of rubble were created when the site was leveled and rehabilitated during 2000. The toe of the site is towards the lower vlei area. There are heaps of rubble on the shoulder of the road. The rubble is not clean and the area is scattered with crates and other broken pieces of hard plastic.
Surface of rehabilitated builder’s rubble site Notice at rehabilitated site
Heaps of rubble Uneven surface with hard plastic waste
The transfer station as second facility is discussed in the topics below.
The Transfer Station: Hours of operation: 08.00- 16.00, including Saturdays.
Notice at transfer station Garden

-36-
Y:\Projdata\A021\Audits\AuditMarch2009.doc\jm
Staff: Mr. Rusty Losper plus three temporary workers. Mr. Losper is at the transfer station and the three
workers sweep the main streets. The transfer station operated by Mr. Losper is an absolute delight. He has the same support system and work conditions as his piers at Hermon and Saron. However, he is committed, inspired and is a gain to the community.
Litter: There is litter visible in the drains on the street corner of the facility as well as opposite the gate.
The litter is generated by wind dispersion from the unauthorised dumping taking place in the informal settlement across the gate. Unfortunately the litter around the transfer facility creates the impression that it originates at the facility. Litter collection in the area should be addressed as well as education and possible involvement/upliftment of the residents causing the waste problem.
Waste Types: The facility has dedicated bins for metal, wood and other mixed domestic waste. In the apron
area is a bottle bank for glass recycling.
Scrap metal bin First small container used for wood
Vehicles entering the facility: The facility is used by farmers as well as the public.
Quantity: Table 7: Saron waste quantity
SARON UNIT Jul-08 Aug-08 Sep-08 Oct-08 Nov-08 Dec-08 Jan-09 Feb-09
Garden Refuse Through Chipper kg 0 0 0 0 1000 0 0 0Directly Disposed kg 0 500 0 20000 13500 22000 11000 11000
Household Refuse Ref Rem Trucks kg All other kg 25000 16000 20000 20000 25000 30000 28000 21000
General rubbish kg 3000 0 3000 2000 500 1000 500 2500 Transportation of waste to the landfill: Wood and mixed waste is removed by the compactors from the
Paarl depot to the Wellington landfill. The wood is disposed off and not recovered for fuel or processed through chipping or shredding.
Metal waste is removed quarterly by L. O. Rall, or when the container is full. The company removes the metal from the static container using a grab mounted on the vehicle loading the scrap.
Entrances: There are two entrances of which one is used. Access through the entrance is strictly controlled.
The second entrance is fenced in.

-37-
Y:\Projdata\A021\Audits\AuditMarch2009.doc\jm
Fencing, gate and security: The facility is fenced with a 1.8m vibacrete. There is one opening in the vibacrete where the storm water drains towards the lower levels. The used entrance has a lockable gate.
Notices: There is a general notice at the entrance.
Small containers for general waste
Area: The area of 40m by 80m is very clean within the perimeter walls. There is a flower-vegetable
garden as well as a small grassed area between the two containers. The regular watering as well as the attention given by Mr. Losper to the aesthetical issues is well worth the effort. The transfer station is a joy, surrounded by contrasting areas of very dry vegetation as well as accumulated litter.
Buildings: There are no constructed buildings. However, there are two ventilated containers equipped as a
store, office and ablution. Number of bays: There are twelve bays filled with containers. The bay closest to the entrance has a 30m3
container used for metal recycling. The second bay contains a 5m3 container dedicated to wood waste. The nine other bays have 5m3 bays used for mixed waste.
Equipment: There is no equipment on the facility. Aesthetics: Very pleasing. Nuisances and health issues: Minimal. First Aid: Not enquired. Surface water drainage: The surface water drains through the vibacrete hole out of the premises. The
surface areas are very clean and the surface water will probably be of a good quality.
Monitoring: No monitoring. Waste Recovery: Recovery of metal, wood and glass takes place in the transfer station. CHIPPING: None. Recommendation: • Rehabilitate the builder’s rubble landfill • Collect litter around the transfer station on a regular basis to prevent distraction from the well a managed
facility.
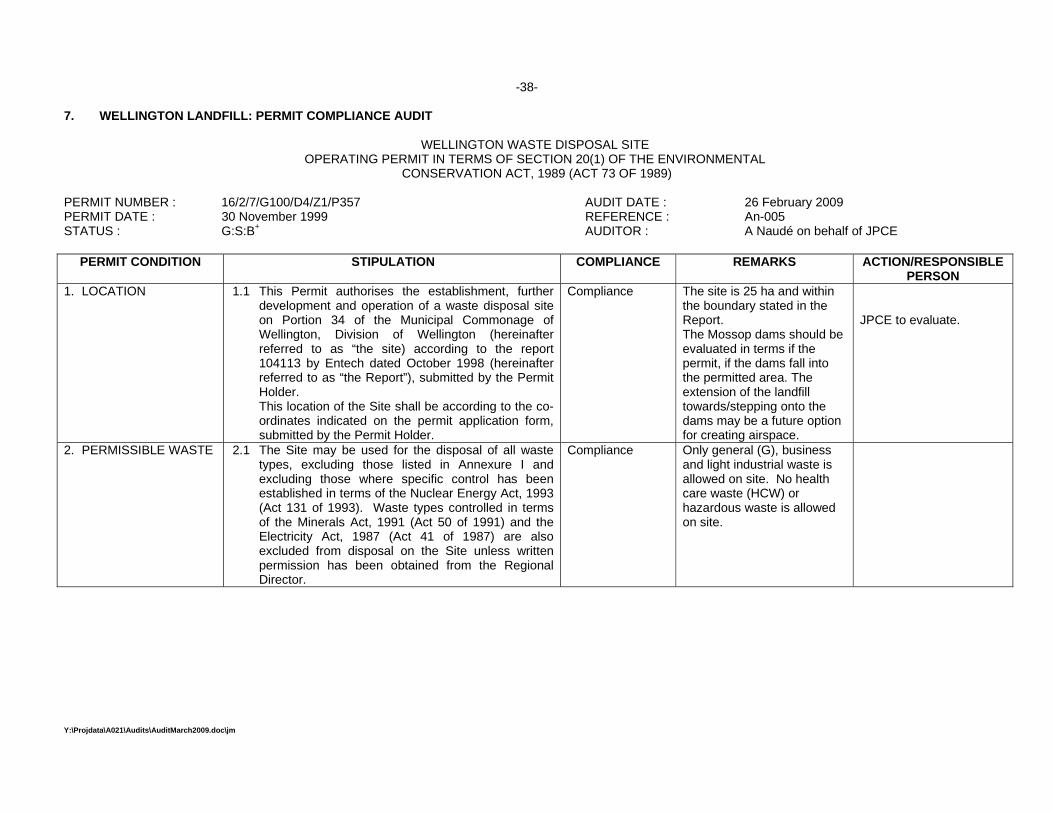
-38-
Y:\Projdata\A021\Audits\AuditMarch2009.doc\jm
7. WELLINGTON LANDFILL: PERMIT COMPLIANCE AUDIT
WELLINGTON WASTE DISPOSAL SITE OPERATING PERMIT IN TERMS OF SECTION 20(1) OF THE ENVIRONMENTAL
CONSERVATION ACT, 1989 (ACT 73 OF 1989)
PERMIT NUMBER : 16/2/7/G100/D4/Z1/P357 AUDIT DATE : 26 February 2009 PERMIT DATE : 30 November 1999 REFERENCE : An-005 STATUS : G:S:B+ AUDITOR : A Naudé on behalf of JPCE
PERMIT CONDITION STIPULATION COMPLIANCE REMARKS ACTION/RESPONSIBLE PERSON
1. LOCATION 1.1 This Permit authorises the establishment, further development and operation of a waste disposal site on Portion 34 of the Municipal Commonage of Wellington, Division of Wellington (hereinafter referred to as “the site) according to the report 104113 by Entech dated October 1998 (hereinafter referred to as “the Report”), submitted by the Permit Holder.
This location of the Site shall be according to the co-ordinates indicated on the permit application form, submitted by the Permit Holder.
Compliance The site is 25 ha and within the boundary stated in the Report. The Mossop dams should be evaluated in terms if the permit, if the dams fall into the permitted area. The extension of the landfill towards/stepping onto the dams may be a future option for creating airspace.
JPCE to evaluate.
2. PERMISSIBLE WASTE 2.1 The Site may be used for the disposal of all waste types, excluding those listed in Annexure I and excluding those where specific control has been established in terms of the Nuclear Energy Act, 1993 (Act 131 of 1993). Waste types controlled in terms of the Minerals Act, 1991 (Act 50 of 1991) and the Electricity Act, 1987 (Act 41 of 1987) are also excluded from disposal on the Site unless written permission has been obtained from the Regional Director.
Compliance Only general (G), business and light industrial waste is allowed on site. No health care waste (HCW) or hazardous waste is allowed on site.

-39-
Y:\Projdata\A021\Audits\AuditMarch2009.doc\jm
PERMIT CONDITION STIPULATION COMPLIANCE REMARKS ACTION/RESPONSIBLE PERSON
2. PERMISSIBLE WASTE (Continued)
2.2 The Permit Holder shall take all reasonable steps to ensure that –
2.2.1 no organic or inorganic element or compound which may have a definite acute or chronic negative effect on human or animal health and/or the environment, due to its toxic, physical, chemical or persistent characteristics and which corresponds with the UNEP definition of hazardous waste be disposed of on the Site;
Compliance Minimal hazardous waste is disposed on site, mostly used/old laboratory chemicals from schools. The disposal of such waste is not acceptable.
School laboratory chemicals may only be disposed of on site if the chemicals are rendered inactive and neutral, thus de-listed.
2.2.2 no medical waste be disposed of on the Site; and Compliance No health care waste disposed off.
-
2.2.3 no scheduled pharmaceutical products registered in terms of the Medicines and Related Substances Control Act, 1965 (Act 101 of 1965) or associated containers be disposed of on the Site.
Compliance No health care waste disposed off.
-
3. CONSTRUCTION 3.1 The Site or any portion thereof may only be used for the disposal of permissible waste if the Site or any such portion has been constructed or developed according to condition 3 of this Permit.
Compliance • Developed cells are used for waste disposal.
-
3.2 The construction and further development within the Site shall be in accordance with approved plan numbers 104113/900 and 104113/901 dated February 1999.
Compliance The plans are for the 25 ha area.
-
3.3 The construction of further developments within the Site which are not shown on the approved plan numbers 104113/900 and 104113/901, can only be undertaken by the Permit Holder after specified engineering plans have been provided to and approved by the Regional Director.
Compliance No further development taking place.
-
3.4 Construction and further development within the Site shall be carried out under the supervision of a suitably qualified person proposed by the Permit Holder and approved by the Regional Director.
Compliance JPCE is appointed by the Permit Holder.
-
3. CONSTRUCTION (Continued)
3.5 After construction of the Site or further development within the Site, the Permit Holder shall notify the Regional Director thereof and the person referred to in condition 3.4 shall submit a certificate or alternatively a letter to the Regional Director that the construction of the Site or further development within the Site, as proposed by the Permit Holder and
Compliance Refer to addendum 2 of the audit report of October 2005 by A Naude and Jan Palm of JPCE for the letter of completion and permission to dispose waste on the developed area.
-

-40-
Y:\Projdata\A021\Audits\AuditMarch2009.doc\jm
PERMIT CONDITION STIPULATION COMPLIANCE REMARKS ACTION/RESPONSIBLE PERSON
approved by the Regional Director, is in accordance with recognised civil engineering practice before disposal may commence on the Site. The completed construction works of the Site shall be inspected by an official of the Department and the person referred to in condition 3.4. If the Regional Director is satisfied with the construction of the Site or any further development within the Site and has given written permission, the Permit Holder may use the Site or any further development within the Site for the disposal of waste.
3.6 The Permit Holder shall take all reasonable steps, such as suitable zoning and/or written agreements with adjacent landowners, to establish and maintain an unbuilt area or “buffer zone” of 500 metres between the Site and the nearest residential and/or light industrial areas during the operative life of the Site. Heavy industries or industries which may create nuisance conditions may be permitted within the buffer zone in terms of appropriate legislation.
Non Compliance The buffer zone for the permit application is 200 m as indicated in the plans referred to in condition 3.2.
• Possible amendment required if permit shows 500 m buffer and application stated 200 m buffer.
(EXTERNAL STORMWATER
3.7 Works shall be constructed and maintained on a continuous basis by the Permit Holder to divert and drain from the Site in a legal manner, all runoff water arising on land adjacent to the Site, which could be expected as a result of the estimated maximum precipitation during a period of 24 hours with an average frequency of once in fifty years (hereinafter referred to as the “estimated maximum precipitation”). Such works shall, under the said rainfall event, maintain a freeboard of half a metre.
Compliance The sides of the old landfill are capped with clay and the berms around the new landfill were constructed with clean clay. Thus, all run all from areas outside the waste footprint is considered uncontaminated storm water.

-41-
Y:\Projdata\A021\Audits\AuditMarch2009.doc\jm
PERMIT CONDITION STIPULATION COMPLIANCE REMARKS ACTION/RESPONSIBLE PERSON
3. CONSTRUCTION (Continued) (INTERNAL STORMWATER)
3.8 Works shall be constructed and maintained on a continuous basis by the Permit Holder to divert and drain from the working face of the Site, all runoff water arising on the Site, which could be expected as a result of the estimated maximum precipitation and to prevent such runoff water from coming into contact with leachate from the Site. Such works shall, under the said rainfall event, maintain a freeboard of half a metre.
Non Compliance • All internal storm water is contained within the new landfill (cell 6).
• The pump system was not operating for the past few months, even possibly years. The October 2005 audit also indicated partial compliance due to pumping deficiencies.
• DM to commission a full-time leachate withdrawal system.
(INTERNAL STORMWATER)
3.9 Runoff water referred to in condition 3.8 shall comply with the quality requirements of the General Standard, prescribed in terms of section 21(1) (a) of the Water Act, 1956 as published in Government Notice 991 of 18 May 1984, or with such quality requirements as may from time to time be determined by the Minister and shall be drained from the Site in a legal manner.
Compliance • Old landfill (cell 1 – 5): There is impermeable base layer (clay) underneath the site. All leachate is captured in a toe drain along the western toe.
• New landfill (cell 6): All leachate is supposed to be captured in a sump and pump to the sewer.
-
(INTERNAL STORMWATER)
3.10 Runoff water referred to in condition 3.8 which does not comply with the quality requirements applicable in terms of condition 3.9 and all leachate shall, by means of works which shall be constructed and maintained on a continuous basis by the Permit Holder –
3.10.1 be discharged into any convenient sewer if accepted by the authority in control of that sewer; and/or,
Non Compliance • No pumping done due to the stolen electric cable and pump.
• Refer condition 3.8.
3.10.2 be treated to comply with the aforementioned standard and discharged in a legal manner.
Non Compliance • Leachate not pumped to sewer for treatment.
3.11 Works constructed in compliance with condition 3.12 shall be of such a capacity as to accommodate all runoff and leachate which could be expected as a result of the estimated maximum precipitation. Such works shall, under the said rainfall event, maintain a freeboard of half a metre.
Compliance • A dry freeboard of 0.5 m is maintained at all times. The leachate cell is ca 0.5 m below the surrounding waste body. The depth of the leachate cell in the waste is ca 1.5 m.
• JP to evaluate alternatives to combined leachate and saturated waste within leachate cell. A possible dedicated clay cell can be created within cell 6

-42-
Y:\Projdata\A021\Audits\AuditMarch2009.doc\jm
PERMIT CONDITION STIPULATION COMPLIANCE REMARKS ACTION/RESPONSIBLE PERSON
3. CONSTRUCTION (Continued)
3.12 The Site shall be constructed in accordance with recognised civil engineering practice to ensure that it remains stable.
Compliance • JPCE is the consulting engineers. Refer condition 3.4.
-
3.13 The maximum height of the Site above ground level shall not exceed 4 metres.
Compliance • Cells 1 – 5 (old landfill are a maximum of 8 m above ground level)
• The extension (cell 6), is compliant.
• JP to provide survey for verification.
3.14 The slope of the sides of the Site shall be constructed in such a manner that little or no erosion occurs.
Compliance • Signs of erosion are visible to the southern outer berm.
• DM: Continual rehabilitation is required.
3.15 The Permit Holder shall make provision for adequate sanitation facilities on the Site.
Possible Compliance
• No ablution at weighbridge. • DM to investigate new offices.
4. ACCESS CONTROL 4.1 Weatherproof, durable and legible notices in at least three official languages applicable in the area, shall be displayed at each entrance to the Site. These notices shall prohibit unauthorised entry and state the hours of operation, the name, address and telephone number of the Permit Holder and the person responsible for the operation of the Site.
Partial Compliance
• No Permit Notice is displayed.
• Three individual language notice boards for direction to landfill displayed from R44.
• DM/JP to arrange Permit Notice Board.
4.2 The Site shall be fenced and/or secured to reasonably prevent unauthorised entry.
Compliance • The site is secured for vehicle entry. However, unauthorised persons may enter on foot.
-
4.3 The Permit Holder shall take all reasonable steps to maintain service roads in a condition which ensures unimpeded access to the Site for vehicles transporting waste and to keep the roads free of waste.
Compliance • The service roads are continually maintained.
-
4.4 The Permit Holder shall ensure that all entrance gates are manned during the hours of operation and locked outside the hours of operation.
Compliance • There are currently one gate That is locked after hours.
-
4.5 The Permit Holder shall ensure effective access control.
Compliance • A visitor’s register should be kept.
• A complaints register should be kept.
• DM to consider resolving access across river and rail onto site.
4.6 The Permit Holder shall take all reasonable steps to prevent the disposal of waste on the Site for which the Site has not been approved.
Compliance • All G waste is disposed of on landfill.
• No hazardous waste is
-

-43-
Y:\Projdata\A021\Audits\AuditMarch2009.doc\jm
PERMIT CONDITION STIPULATION COMPLIANCE REMARKS ACTION/RESPONSIBLE PERSON
allowed for disposal. 5. OPERATION 5.1 Waste disposal and operation shall be done
according to the relevant Minimum Requirements, sections 9 to 14 of the Site Operational Report dated October 1998, the conditions of this Permit and any other written instruction by the Department.
Compliance • The Operational report describes the waste disposal methodology and operation.
-
5.2 Waste disposed of on the Site shall be compacted and covered on a daily basis with a minimum of 150 millimetres of soil or other material approved by the Regional Director.
Compliance • The site has sufficient daily and interim cover. However, improved compaction will elongate the lifetime of the site.
• DM to address shortage of equipment and manpower.
5.3 The Permit Holder shall take all reasonable steps to ensure that the Site is operated in a manner which shall prevent the creation of nuisance conditions or health hazards.
Compliance • Litter is continually collected.
• Odour is minimal at the workface except for disposal of dead dogs (uncovered) at the workface.
• Flies: Minimal. • Dust: Seasonal. • Stray animals: No dogs
observed • Fire: There was a
possibility of a subsurface fire during 2005.The area of the fire must be re-assessed during winter when possible smouldering and heat emission is more visible.
• DM to increase cover use which will decrease malodours.
• DM to control exit speed of vehicle after disposal at the work face. The vehicles speed across the landfill causing dust clouds.
• H du P and JPCE: The surface area of the possible fire must be re-assessed during winter.
5.4 The Permit Holder shall make use of moveable fences to control wind-blown waste.
Non Compliance • No moveable fences are used.
• DM/JP to evaluate the need for moveable fences.
5.5 The Permit Holder shall apply sufficient dust control measures to prevent wind-blown dust from causing nuisance conditions or health hazards.
Compliance • Dust is a seasonal problem. Two dedicated water tankers are used.
• Refer to 5.3
• DM/JP to restrict vehicle speed. Refer to 5.3.
5.6 Waste disposed of on the Site may not be reclaimed. Compliance • No formal salvaging takes place.
-

-44-
Y:\Projdata\A021\Audits\AuditMarch2009.doc\jm
PERMIT CONDITION STIPULATION COMPLIANCE REMARKS ACTION/RESPONSIBLE PERSON
6. MONITORING 6.1 WATER MONITORING 6.1.1 A monitoring borehole network for the Site shall
be established and maintained by the Permit Holder and to the satisfaction of the Regional Director so that unobstructed sampling, as required in terms of this Permit, can be undertaken.
Non Compliance • During 2005, there was no water monitoring system in place.
• Mr. du Plessis recalls ground water monitoring done by Rob McFarlane. A ground water monitoring system was possibly introduced. However, there was no ground water extraction and/or analysis done recently. If it was done, the ownership of the results are unknown.
• DM to urgently resolve water monitoring requirements.
6.1.2 Monitoring boreholes shall be equipped with lockable caps. The Department reserves the right to take water samples at any time and to analyse these samples or have them analysed.
Non Compliance • There is no water monitoring system in place.
• DM to urgently resolve water monitoring requirements.
6.1.3 Surface water monitoring shall be performed in all storm water drains on and adjacent to the Site at locations selected in conjunction with the Regional Director and at a frequency as determined by the Regional Director.
Non Compliance • Concrete sampling points are required.
• DM/JP to provide concrete sampling points.
6.1.4 Treated leachate discharged into a water course shall be monitored and the standards, parameters and sample frequency of monitoring shall be determined and from time to time be adjusted by the Chief Director: Water Use and Conservation.
Non Compliance • Statement. No leachate and contaminated storm water is pumped from the site. No monitoring takes place.
DM/JP: Immediately institute monitoring systems.
6.2 BACKGROUND MONITORING 6.2.1 Samples from the boreholes, where the
groundwater in the borehole is at an expected higher hydraulic pressure level than the hydraulic pressure level of the groundwater under the Site, shall be considered as background monitoring. Background groundwater monitoring shall be conducted during each monitoring occasion in terms of conditions 6.3, 6.4 or 6.5 for the water quality variables listed in Annexure II.
Non Compliance • No groundwater boreholes, analysis and/or monitoring system is in place.
• DM to urgently resolve.

-45-
Y:\Projdata\A021\Audits\AuditMarch2009.doc\jm
PERMIT CONDITION STIPULATION COMPLIANCE REMARKS ACTION/RESPONSIBLE PERSON
6. MONITORING (Continued)
6.3 DETECTION MONITORING 6.3.1 Monitoring shall be conducted within 3 days of 15
January and 15 July of each year for the water quality variables listed in paragraph (a) of Annexure III and annually within 3 days of 15 July for the variables listed in paragraph (b) of Annexure III.
Non Compliance • No groundwater boreholes, analysis and/or monitoring system is in place.
• DM to urgently resolve.
6.4 INVESTIGATIVE MONITORING 6.4.1 If, in the opinion of the Regional Director, a water
quality variable listed under the detection monitoring programme, as referred to in condition 6.3, shows an increasing trend, the Permit Holder shall initiate a monthly monitoring programme for the water quality variables listed in Annexure II.
Non Compliance • No groundwater boreholes, analysis and/or monitoring system is in place.
• DM to urgently resolve.
6.5 POST-CLOSURE MONITORING 6.5.1 Groundwater monitoring by the Permit Holder, in
accordance with condition 6.3 or 6.4, shall commence immediately upon closure of the Site and be maintained for a period of 30 years, or such lesser period as may be determined by the Regional Director.
Compliance • No yet applicable. -
6.6 FURTHER INVESTIGATIONS If, in the opinion of the Regional Director, groundwater surface water and/or air pollution have occurred or may possibly occur, the Permit Holder shall conduct the necessary investigations and implement additional monitoring and rehabilitation measures which shall be to the satisfaction of the Regional Director.
Compliance
• Not yet applicable.
-
7. AUDITING 7.1 INTERNAL AUDITS 7.1.1 Internal audits must be conducted quarterly by
the Permit Holder and on each audit occasion an official report must be compiled by the relevant auditor to report the findings of the audits, which must be made available to the external auditor specified in condition 7.2.1 and the Department, according to conditions 7.3.2 and 10.2.2.
Non Compliance • No internal audits are done.
• DM to urgently commence quarterly internal audits.

-46-
Y:\Projdata\A021\Audits\AuditMarch2009.doc\jm
PERMIT CONDITION STIPULATION COMPLIANCE REMARKS ACTION/RESPONSIBLE PERSON
7. AUDITING (Continued)
7.2 EXTERNAL AUDITS 7.2.1 The Permit Holder must appoint an independent
external auditor to audit the Site annually and this auditor must compile an audit report documenting the findings of his audit, which must be submitted by the Permit Holder according to condition 10.2.2.
Partial Compliance
• The first external audit was performed 1 – 6 June 2005. And the second on 26 February 2009.
• DM to commission annual external audits.
7.2.2 The audit report must specifically state whether conditions of this Permit are adhered to and must include an interpretation of all available data and test results regarding the operation of the Site and all its impacts on the environment.
Compliance - -
7.2.3 The audit report must contain recommendations regarding non-compliance or potential non-compliance and must specify target dates for the implementation of the recommendations by the Permit Holder.
Compliance - -
7.3 DEPARTMENTAL AUDITS AND INSPECTIONS 7.3.1 The Department reserves the right to audit and/or
inspect the Site at any time and at such a frequency as the Regional Director may decide, or to have the Site audited or inspected.
Compliance • Statement. The Department has not exercised the right tot date.
-
7.3.2 The Permit Holder must make any records or documentation available to the Regional Director upon request, as well as any other information the Regional Director may require.
Compliance • No records requested to date.
-
7.3.3 The findings of these audits or inspections shall be made available to the Permit Holder within 60 days of the end of the audit or inspection and shall not be treated as confidential.
Compliance • Refer to condition 10.2.2: Controversial conditions as audit must be submitted within 30 days of finalisation to DEADP and within 60 days to the Permit Holder.
• Refer to condition 10.2.2.
• JP to send copies to DEADP on behalf of the Permit Holder.
• JP/DM to apply for suggested amendments, if required.

-47-
Y:\Projdata\A021\Audits\AuditMarch2009.doc\jm
PERMIT CONDITION STIPULATION COMPLIANCE REMARKS ACTION/RESPONSIBLE PERSON
8. METHODS OF ANALYSIS
8.1 The Permit Holder shall carry out all tests in accordance with methods prescribed by and obtainable from the South African Bureau of Standards (SABS), referred to in the Standards Act, 1982 (Act 30 of 1982), to analyse the samples taken under the monitoring programmes specified in condition 6.
Possible non Compliance
• Statement. When analysis is done, all tests will be SABS approved in an accredited laboratory.
• No analysis done and analytical laboratory not known, if any.
• Compliance if testing was done.
8.2 The Permit Holder shall only use another method of analysis if written proof that the method is at least equivalent to the SABS method, is submitted to the Regional Director.
Compliance • Statement. -
9. RECORDING 9.1 The Permit Holder shall keep a record of and update all the information referred to in Annexure IV on an annual basis.
Non Compliance • Annexure summaries must be submitted before 30 November of each year.
• Refer to condition 10.3.1.
• DM to submit results prior to end November of each year.
9.2 The Permit Holder shall record all borehole data and chemical analyses in the format depicted in Annexure V.
Non Compliance • Annexure summaries must be submitted before 30 November of each year.
• Refer to condition 10.3.2.
• DM to submit results prior to end November of each year.
10. REPORTING 10.1 REPORTING OF INCIDENTS 10.1.1 The Permit Holder must, within 24 hours, notify
the Regional Director of the occurrence or detection of any incident on the Site, or incidental to the operation of the Site, which has the potential to cause, or has caused water pollution, pollution of the environment, health risks or nuisance conditions.
Compliance • No incident since the Permit is issued.
-
10.1.2 The Permit Holder must, within 14 days, or a shorter period of time, if specified by the Regional Director, from the occurrence or detection of any incident referred to in condition 10.1.1, submit an action plan, which must include a detailed time schedule, to the satisfaction of the Regional Director of measures taken to –
Compliance • No incident since the Permit is issued.
-
10. REPORTING (Continued)
(a) correct the impact resulting from the incident; (b) prevent the incident from causing any further
impact; and (c) prevent a recurrence of a similar incident.
10.1.3 In the event that measures have not been implemented within 21 days of the incident to
Compliance • No incident since the Permit is issued.
-

-48-
Y:\Projdata\A021\Audits\AuditMarch2009.doc\jm
PERMIT CONDITION STIPULATION COMPLIANCE REMARKS ACTION/RESPONSIBLE PERSON
address impacts caused by the incident referred to in condition 10.1.1, or measures which have been implemented are inadequate, the Regional Director may implement the necessary measures at the cost and risk of the Permit Holder.
10.1.4 The Permit Holder must keep in incident report
and complaints register, which must be made available to both external and Departmental auditors for the purpose of their audits.
Non Compliance • An incident register and complaints register must be kept on site.
• DM to initiate such registers. Each incident/complaint should be actioned, followed up and reported in the register/s.
10.2 AUDIT REPORTS 10.2.1 All internal audit reports referred to in condition
7.1.1 must be made available to the external auditor referred to in condition 7.2.1.
Non Compliance • No internal audits are done.
• DM to initiate as soon as possible.
10.2.2 Each external audit report referred to in condition 7.2 must be submitted to the Regional Director within 30 days from the date on which the external auditor finalised the audit.
Compliance • Audits will be submitted to DEADP by JPCE on behalf of the Permit Holder. Refer to condition 7.3.3 controversy in time specified.
• DM/JP to request amendment, if required.
10.3 OTHER REPORTS 10.3.1 The information required in terms of condition 9.1
shall be submitted to the Regional Director within a period of one year from the date of issuing of this Permit and annually thereafter.
Non Compliance • Summaries of Annexure IV must be submitted to DEADP prior to 30 November each year.
• DM to submit results as requested.
10. REPORTING (Continued)
10.3.2 The information required in terms of condition 6 must be reported to the Regional Director, in the format specified in condition 9.2 where applicable, within a period of 30 days following the analysis of the samples. The information must also be included into a trend report, which must contain a graphical presentation of all results obtained previously at any specific point, as well as an interpretation and discussion of the results of each monitoring occasion.
Non Compliance • Summaries of Annexure V must be submitted to DEADP prior to 30 November each year.
• DM to submit results as requested.
11. REHABILITATION AND CLOSURE OF THE
11.1 The Permit Holder shall, at least 60 days prior to the intended closure of the Site, notify the Regional
Compliance • Not yet applicable. -
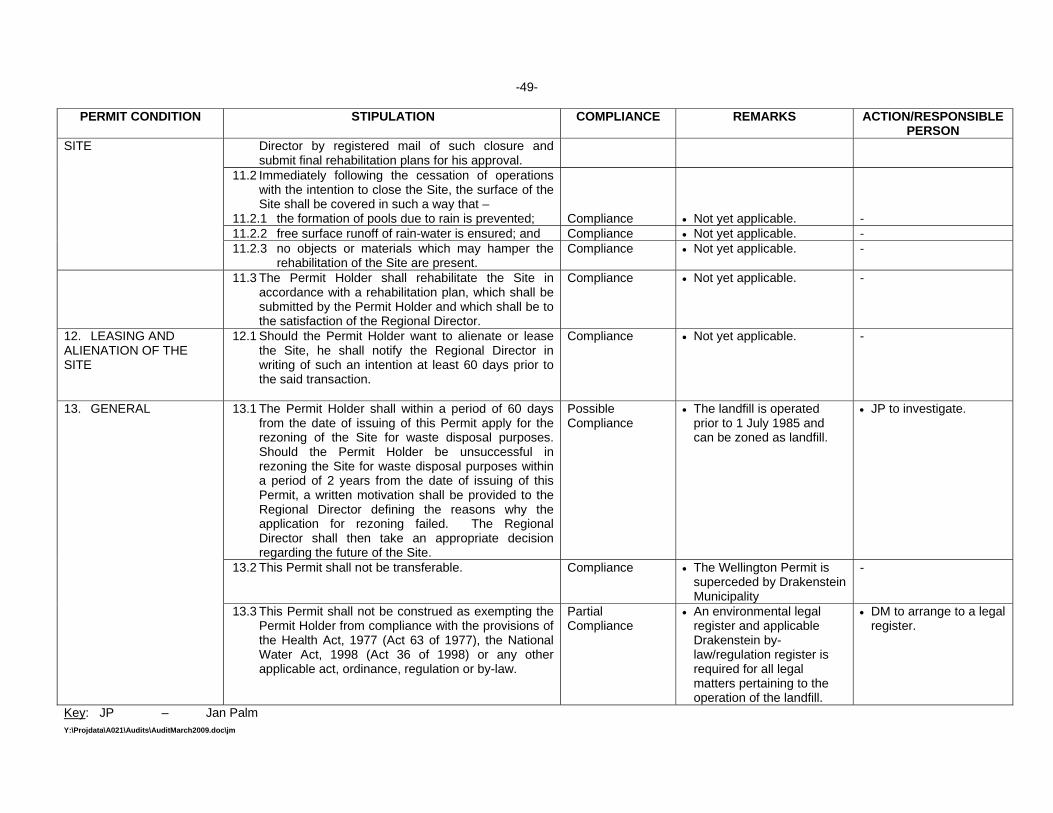
-49-
Y:\Projdata\A021\Audits\AuditMarch2009.doc\jm
PERMIT CONDITION STIPULATION COMPLIANCE REMARKS ACTION/RESPONSIBLE PERSON
SITE Director by registered mail of such closure and submit final rehabilitation plans for his approval.
11.2 Immediately following the cessation of operations with the intention to close the Site, the surface of the Site shall be covered in such a way that –
11.2.1 the formation of pools due to rain is prevented; Compliance • Not yet applicable. - 11.2.2 free surface runoff of rain-water is ensured; and Compliance • Not yet applicable. - 11.2.3 no objects or materials which may hamper the
rehabilitation of the Site are present. Compliance • Not yet applicable. -
11.3 The Permit Holder shall rehabilitate the Site in accordance with a rehabilitation plan, which shall be submitted by the Permit Holder and which shall be to the satisfaction of the Regional Director.
Compliance • Not yet applicable. -
12. LEASING AND ALIENATION OF THE SITE
12.1 Should the Permit Holder want to alienate or lease the Site, he shall notify the Regional Director in writing of such an intention at least 60 days prior to the said transaction.
Compliance • Not yet applicable. -
13. GENERAL 13.1 The Permit Holder shall within a period of 60 days from the date of issuing of this Permit apply for the rezoning of the Site for waste disposal purposes. Should the Permit Holder be unsuccessful in rezoning the Site for waste disposal purposes within a period of 2 years from the date of issuing of this Permit, a written motivation shall be provided to the Regional Director defining the reasons why the application for rezoning failed. The Regional Director shall then take an appropriate decision regarding the future of the Site.
Possible Compliance
• The landfill is operated prior to 1 July 1985 and can be zoned as landfill.
• JP to investigate.
13.2 This Permit shall not be transferable. Compliance • The Wellington Permit is superceded by Drakenstein Municipality
-
13.3 This Permit shall not be construed as exempting the Permit Holder from compliance with the provisions of the Health Act, 1977 (Act 63 of 1977), the National Water Act, 1998 (Act 36 of 1998) or any other applicable act, ordinance, regulation or by-law.
Partial Compliance
• An environmental legal register and applicable Drakenstein by-law/regulation register is required for all legal matters pertaining to the operation of the landfill.
• DM to arrange to a legal register.
Key: JP – Jan Palm
-50-
Y:\Projdata\A021\Audits\AuditMarch2009.doc\jm
DM – Drakenstein Municipality AN – Annette Naudé DWAF – Department Water Affairs and Forestry DEADP – Department of Environmental Affairs and Development Planning H du P _ Hannes du Preez, Drakenstein municipality. NWA - National Waste Act (Act 63 of 1977) ECA - Environmental Conservation Act (Act 86 of 1983) HA - Health Act (Act 73 of 1989) SHEQ - Safety, Health, Environment and Quality
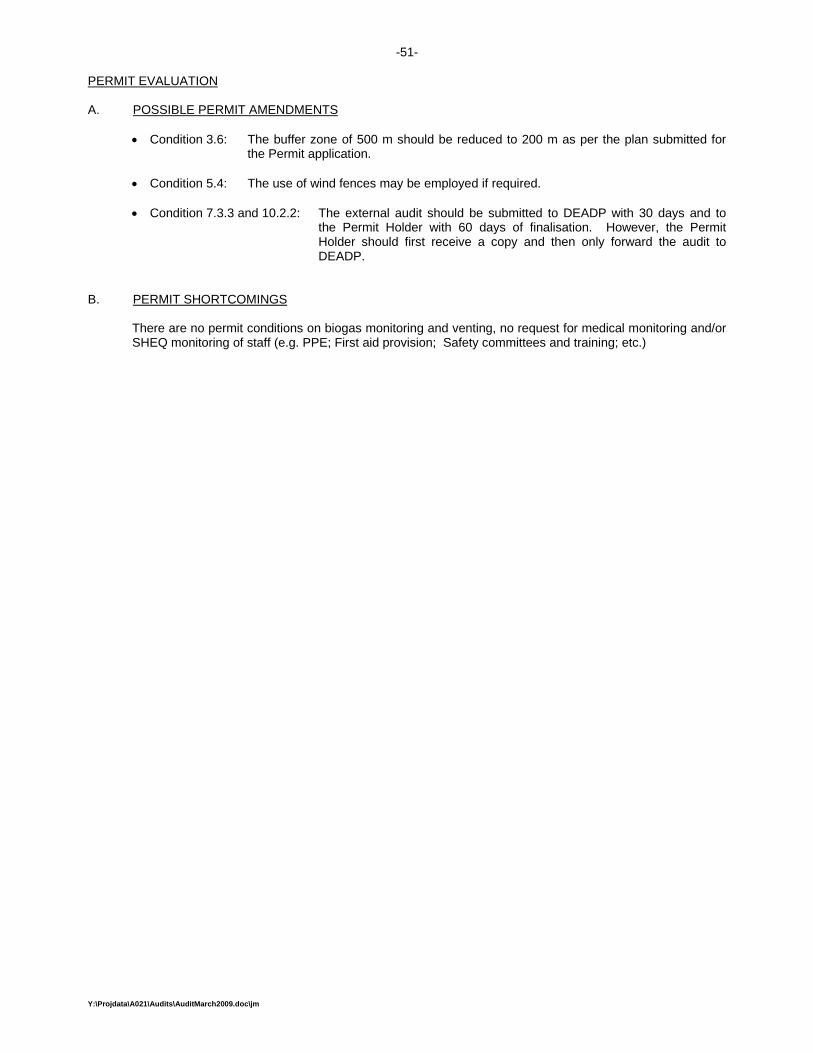
-51-
Y:\Projdata\A021\Audits\AuditMarch2009.doc\jm
PERMIT EVALUATION
A. POSSIBLE PERMIT AMENDMENTS
• Condition 3.6: The buffer zone of 500 m should be reduced to 200 m as per the plan submitted for the Permit application.
• Condition 5.4: The use of wind fences may be employed if required. • Condition 7.3.3 and 10.2.2: The external audit should be submitted to DEADP with 30 days and to
the Permit Holder with 60 days of finalisation. However, the Permit Holder should first receive a copy and then only forward the audit to DEADP.
B. PERMIT SHORTCOMINGS
There are no permit conditions on biogas monitoring and venting, no request for medical monitoring and/or SHEQ monitoring of staff (e.g. PPE; First aid provision; Safety committees and training; etc.)

-52-
Y:\Projdata\A021\Audits\AuditMarch2009.doc\jm
WELLINGTON LANDFILL: NON COMPLIANCE and PARTIAL COMPLIANCE SUMMARY: PERMIT
CONDITION STIPULATION Non COMPLIANCE REMARKS ACTION/RESPONSIBLE
PERSON
3 C
ON
STR
UC
TIO
N
3.6 The Permit Holder shall take all reasonable steps, such as suitable zoning and/or written agreements with adjacent landowners, to establish and maintain an unbuilt area or “buffer zone” of 500 metres between the Site and the nearest residential and/or light industrial areas during the operative life of the Site.
Non Compliance The buffer zone for the permit application is 200 m as indicated in the plans referred to in condition 3.2.
• Possible amendment required if permit shows 500 m buffer and application stated 200 m buffer.
3.8 Works shall be constructed and maintained on a continuous basis by the Permit Holder to divert and drain from the working face of the Site, all runoff water arising on the Site.
Non Compliance • All internal storm water is contained within the new landfill (cell 6).
• The pump system was not operating for the past few months, even possibly years. The October 2005 audit also indicated partial compliance due to pumping deficiencies.
• DM to commission a full-time leachate withdrawal system.
3.10 Runoff water referred to in condition 3.8 which does not comply with the quality requirements applicable in terms of condition 3.9 and all leachate shall, by means of works which shall be constructed and maintained on a continuous basis by the Permit Holder –
3.10.1 be discharged into any convenient sewer if accepted by the authority in control of that sewer; and/or,
Non Compliance • No pumping done due to the stolen electric cable and pump.
• Refer condition 3.8.
3.10.2 be treated to comply with the aforementioned standard and discharged in a legal manner.
Non Compliance • Leachate not pumped to sewer for treatment.
3.15 The Permit Holder shall make provision for adequate sanitation facilities on the Site.
Possible Compliance
• No ablution at weighbridge. • DM to investigate new offices.
4. A
CC
ES
S
CO
NTR
OL
4.1 Weatherproof, durable and legible notices in at least three official languages applicable in the area, shall be displayed at each entrance to the Site. These notices shall prohibit unauthorised entry and state the hours of operation, the name, address and telephone number of the Permit Holder and the person responsible for the operation of the Site.
Partial Compliance • No Permit Notice is displayed. • Three individual language
notice boards for direction to landfill displayed from R44.
• DM/JP to arrange Permit Notice Board.
5.
OP
ER
ATI
ON
S
5.4 The Permit Holder shall make use of moveable fences to control wind-blown waste.
Non Compliance • No moveable fences are used. • DM/JP to evaluate the need for moveable fences.

-53-
Y:\Projdata\A021\Audits\AuditMarch2009.doc\jm
6.
MO
NIT
OR
ING
6.1 WATER MONITORING 6.1.1 A monitoring borehole network for the Site shall be
established and maintained by the Permit Holder and to the satisfaction of the Regional Director so that unobstructed sampling, as required in terms of this Permit, can be undertaken.
Non Compliance • Mr. du Plessis recalls ground water monitoring done by Rob McFarlane. A ground water monitoring system was possibly introduced. However, there was no ground water extraction and/or analysis done recently. If it was done, the ownership of the results is unknown.
• DM to urgently resolve water monitoring requirements.
6.1.2 Monitoring boreholes shall be equipped with lockable caps. The Department reserves the right to take water samples at any time and to analyse these samples or have them analysed.
Non Compliance • There is no water monitoring system in place.
• DM to urgently resolve water monitoring requirements.
6.1.3 Surface water monitoring shall be performed in all storm water drains on and adjacent to the Site at locations.
Non Compliance • Concrete sampling points are required.
• DM/JP to provide concrete sampling points.
6.1.4 Treated leachate discharged into a water course shall be monitored and the standards, parameters and sample frequency of monitoring
Non Compliance • Statement. No leachate and contaminated storm water is pumped from the site. No monitoring takes place.
DM/JP: Immediately institute monitoring systems.
6.7 BACKGROUND MONITORING 6.2.1 Samples from the boreholes SHALL BE MONITORED.
Background groundwater monitoring shall be conducted during each monitoring occasion in terms of conditions 6.3, 6.4 or 6.5 for the water quality variables listed in Annexure II.
Non Compliance • No groundwater boreholes, analysis and/or monitoring system is in place.
• DM to urgently resolve.
6.8 DETECTION MONITORING 6.8.1 Monitoring shall be conducted within 3 days of 15 January
and 15 July of each year for the water quality variables listed in paragraph (a) of Annexure III and annually within 3 days of 15 July for the variables listed in paragraph (b) of Annexure III.
Non Compliance • No groundwater boreholes, analysis and/or monitoring system is in place FOR THE OLD LANDFILL.
• DM to urgently resolve.
6.9 INVESTIGATIVE MONITORING 6.9.1 If, in the opinion of the Regional Director, a water quality
variable listed under the detection monitoring programme, as referred to in condition 6.3, shows an increasing trend, the Permit Holder shall initiate a monthly monitoring programme for the water quality variables listed in Annexure II.
Non Compliance • No groundwater boreholes, analysis and/or monitoring system is in place FOR THE OLD LANDFILL.
• DM to urgently resolve.
7.A
UD
ITI
NG
7.1 INTERNAL AUDITS 7.1.1 Internal audits must be conducted quarterly by the Permit
Holder and on each audit occasion an official report must be compiled by the relevant auditor to report the findings
Non Compliance • No internal audits are done. • DM to urgently commence quarterly internal audits.
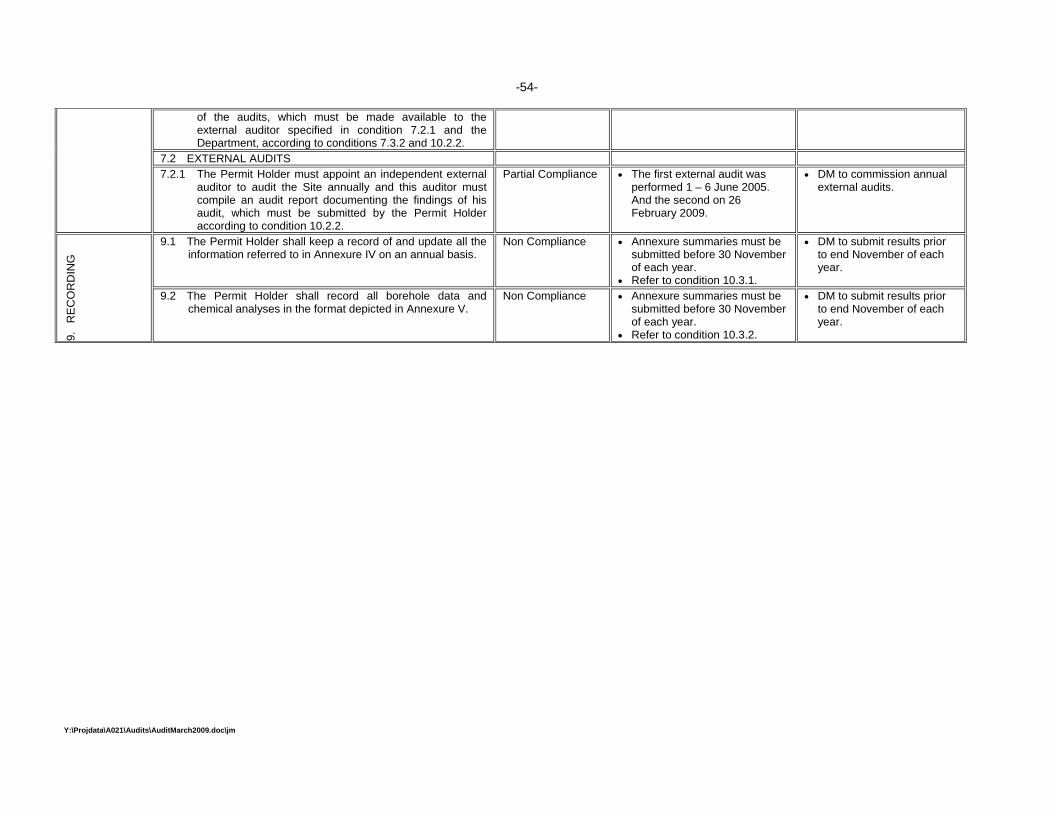
-54-
Y:\Projdata\A021\Audits\AuditMarch2009.doc\jm
of the audits, which must be made available to the external auditor specified in condition 7.2.1 and the Department, according to conditions 7.3.2 and 10.2.2.
7.2 EXTERNAL AUDITS 7.2.1 The Permit Holder must appoint an independent external
auditor to audit the Site annually and this auditor must compile an audit report documenting the findings of his audit, which must be submitted by the Permit Holder according to condition 10.2.2.
Partial Compliance • The first external audit was performed 1 – 6 June 2005. And the second on 26 February 2009.
• DM to commission annual external audits.
9.
RE
CO
RD
ING
9.1 The Permit Holder shall keep a record of and update all the information referred to in Annexure IV on an annual basis.
Non Compliance • Annexure summaries must be submitted before 30 November of each year.
• Refer to condition 10.3.1.
• DM to submit results prior to end November of each year.
9.2 The Permit Holder shall record all borehole data and chemical analyses in the format depicted in Annexure V.
Non Compliance • Annexure summaries must be submitted before 30 November of each year.
• Refer to condition 10.3.2.
• DM to submit results prior to end November of each year.

-55-
Y:\Projdata\A021\Audits\AuditMarch2009.doc\jm
10 R
EP
OR
TIN
G
10.1.4 The Permit Holder must keep in incident report and complaints register, which must be made available to both external and Departmental auditors for the purpose of their audits.
Non Compliance • An incident register and complaints register must be kept on site.
• DM to initiate such registers. Each incident/complaint should be actioned, followed up and reported in the register/s.
10.2 AUDIT REPORTS 10.2.1 All internal audit reports referred to in condition 7.1.1 must
be made available to the external auditor referred to in condition 7.2.1.
Non Compliance • No internal audits are done. • DM to initiate as soon as possible.
10.2.2 Each external audit report referred to in condition 7.2 must be submitted to the Regional Director within 30 days from the date on which the external auditor finalised the audit.
Compliance • Audits will be submitted to DEADP by JPCE on behalf of the Permit Holder. Refer to condition 7.3.3 controversy in time specified.
• DM/JP to request amendment, if required.
10.3 OTHER REPORTS 10.3.1 The information required in terms of condition 9.1 shall be
submitted to the Regional Director within a period of one year from the date of issuing of this Permit and annually thereafter.
Non Compliance • Summaries of Annexure IV must be submitted to DEADP prior to 30 November each year.
• DM to submit results as requested.
10.3.2 The information required in terms of condition 6 must be reported to the Regional Director, in the format specified in condition 9.2 where applicable, within a period of 30 days following the analysis of the samples. The information must also be included into a trend report, which must contain a graphical presentation of all results obtained previously at any specific point, as well as an interpretation and discussion of the results of each monitoring occasion.
Non Compliance • Summaries of Annexure V must be submitted to DEADP prior to 30 November each year.
• DM to submit results as requested.
13 G
EN
ER
AL 13.3 This Permit shall not be construed as exempting the Permit
Holder from compliance with the provisions of the Health Act, 1977 (Act 63 of 1977), the National Water Act, 1998 (Act 36 of 1998) or any other applicable act, ordinance, regulation or by-law.
Partial Compliance • An environmental legal register and applicable Drakenstein by-law/regulation register is required for all legal matters pertaining to the operation of the landfill.
• DM to arrange to a legal register.
i Drakenstein Municipality. Integrated Waste Management Plan by JPCE, December 2004. Transfer station quantities:Section 2.6.4 on page 59.