draft wasteload allocation report town of haworth report .pdf · draft wasteload allocation report...
TRANSCRIPT

Draft Wasteload Allocation Report
Town of Haworth
Contents
1. Problem Definition ..................................................................................................................... 1
2. Endpoint Identification ............................................................................................................... 1
3. Source Analysis ........................................................................................................................ 2
3.1. Point Sources ....................................................................................................................... 2 3.2. Non-Point Sources ............................................................................................................... 2 3.3. Background .......................................................................................................................... 2
4. Linkage between Sources and Receiving Water ........................................................................... 3
4.1. Model Inputs ....................................................................................................................... 3 4.2. Maximum Assimilative Capacity .......................................................................................... 3
5. Margin of Safety ........................................................................................................................ 4
6. Allocations ............................................................................................................................... 4
7. Final Recommendations ............................................................................................................ 5
8. Public Participation .................................................................................................................... 5
9. References ............................................................................................................................... 5
Appendix A - Desktop Model ........................................................................................................... 8
Tables
Table 1. Maximum Assimilative Capacity .................................................................................................................... 4
Table 2. Allocations ....................................................................................................................................................... 4 Figures
Figure 1. Haworth WWTF Receiving Streams (Overview) ......................................................................................... 6
Figure 2. Haworth WWTF Receiving Stream (Detailed View) .................................................................................... 7

Draft Wasteload Allocation for the Town of Haworth
May 2016 Page 1 of 15
1. Problem Definition
The Town of Haworth is currently operating a total retention lagoon system and requesting permission to discharge to an unnamed tributary of Norwood Creek (OK410100010050_00), approximately 1 mile above its confluence with the Norwood Creek. Based on the projected population growth and to ensure compliance with DEQ standards, the Town has requested a discharge flow of 0.155 MGD.
Since the unnamed tributary is not listed in Appendix A of the Oklahoma Water Quality Standards (OAC 785:45), it is assumed to have the designated use of Warm Water Aquatic Community (WWAC). Norwood Creek is listed in the Oklahoma Water Quality Standards as having the following beneficial uses:
� Primary Body Contact Recreation
� Public and Private Water Supplies
� Warm Water Aquatic Community
� Agriculture
� Aesthetics
Among the above designated beneficial uses, only the WWAC beneficial use is addressed in this report. According to the Oklahoma 2014 303(d) list, Norwood Creek is impaired for the following pollutants:
� Enterococcus
� Escherichia coli
� Oxygen, Dissolved
This report addresses dissolved-oxygen demanding substances only and does not address any other pollutant on the State's 303(d) list of impaired waters. This report addresses instream organic enrichment and Dissolved Oxygen (DO) through the use of wasteload allocations of DO-demanding substances (CBOD and Ammonia). It also accounts for non-point source impacts through the use of conservative kinetic inputs and assumptions.
This Wasteload Allocation (WLA) has been developed in order to ensure that the limits assigned to the discharge are stringent enough to maintain DO standards under critical conditions. Controls for any necessary pollutants will be established in the permitting process.
2. Endpoint Identification The Oklahoma Water Quality Standards define DO criteria for two flow regimes: critical low-flow and nuisance conditions. The critical low-flow will be either 7Q2 or 1.0 cfs, whichever is greater. Nuisance condition applies only when there is no upstream flow.

Draft Wasteload Allocation for the Town of Haworth
May 2016 Page 2 of 15
The following numerical dissolved oxygen criteria for WWAC apply to the receiving stream:
Critical Low-Flow Condition (7Q2) Summer (Jun–Oct): 5.0 mg/L Spring (Apr–May): 6.0 mg/L Winter (Nov–Mar): 6.0 mg/L
Since no flow or water quality data were available for Norwood Creek, this waterbody was not included in the WLA modeling. In according with OAC 785:45-5-12, a flow of 1 cfs was used for unnamed tributary to Norwood creek since no data are available flow data.
Oklahoma antidegradation policy (OAC 785:45-3) requires protecting all waters of the state from degradation of water quality. The allocated loadings/concentrations in this report were set with regard for all elements of the Oklahoma Water Quality standards, which includes the antidegradation policy.
3. Source Analysis
3.1. Point Sources
Haworth Wastewater Treatment Facility (WWTF)
Facility Legal Description: SE¼ - S23-T8S-R25E, McCurtain County, OK Proposed Point of Discharge: SE¼ - S23-T8S-R25E
Latitude: 33°50'51.18"N Longitude: 94°39'33.79"W
3.2. Non-Point Sources
The allocations in this waterbody assessment are driven by critical instream dissolved oxygen conditions (low-flow, high temperature) as defined in the Oklahoma Water Quality Standards. Low-flow conditions, by definition, assume little or no runoff.
3.3. Background
The following background conditions for the unnamed tributary were used:
Unnamed Tributary to Norwood Creek Flow (7Q2): 1.0 cfs CBOD5: 2.0 mg/L Ammonia: 0.15 mg/L DO: 85% * temperature * = saturation at the regulatory seasonal temperature
Draft Wasteload Allocation for the Town of Haworth
May 2016 Page 3 of 15
4. Linkage between Sources and Receiving Water
The links between sources and the receiving streams can be established through typical water quality models such as spreadsheet mass balance, desktop Streeter-Phelps model, modified Streeter-Phelps model, QUAL2E, QUALTX, SWAT, and HSPF etc. The more complicated a model becomes, the better it represents the system being studied. However, a complex model also requires more data. According the complexity of the problem, available data and policy, Oklahoma’s desktop model was chosen for this project.
Oklahoma’s desktop model is based on the modified Streeter-Phelps equation. The modified Streeter-Phelps model can be found in Oklahoma Continuing Planning Process (CPP).
4.1. Model Inputs
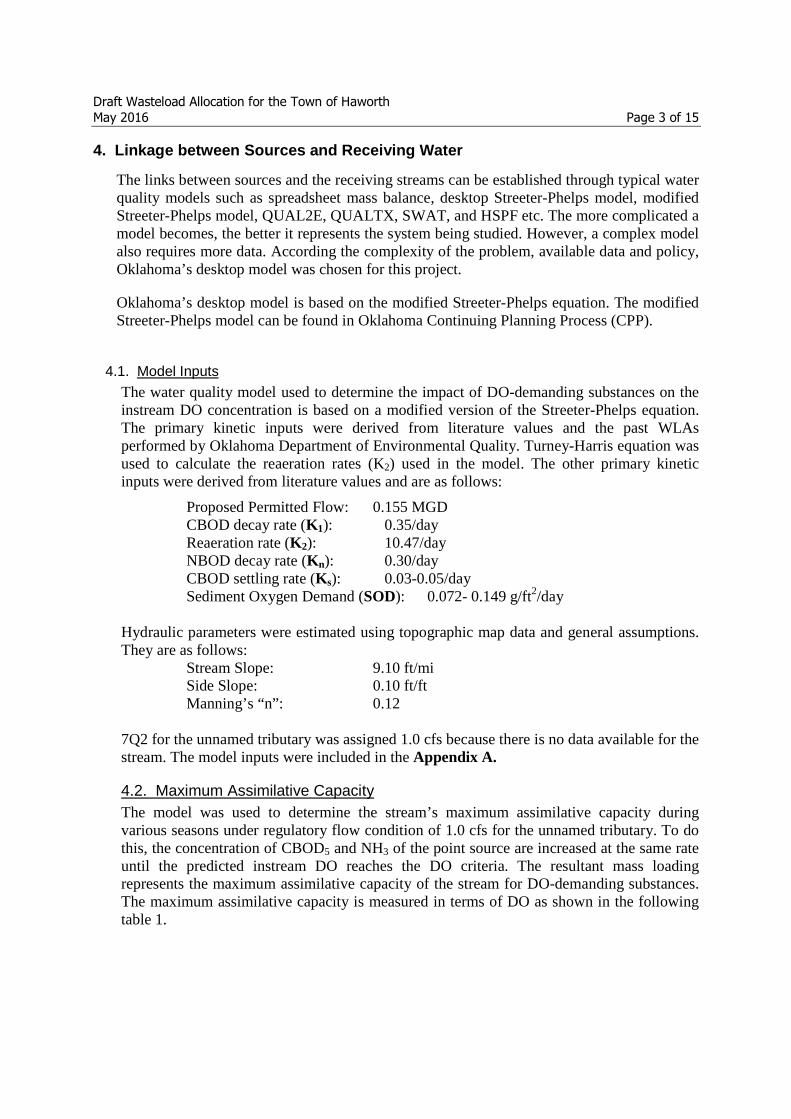
The water quality model used to determine the impact of DO-demanding substances on the instream DO concentration is based on a modified version of the Streeter-Phelps equation. The primary kinetic inputs were derived from literature values and the past WLAs performed by Oklahoma Department of Environmental Quality. Turney-Harris equation was used to calculate the reaeration rates (K2) used in the model. The other primary kinetic inputs were derived from literature values and are as follows:
Proposed Permitted Flow: 0.155 MGD CBOD decay rate (K1): 0.35/day Reaeration rate (K2): 10.47/day NBOD decay rate (Kn): 0.30/day CBOD settling rate (Ks): 0.03-0.05/day Sediment Oxygen Demand (SOD): 0.072- 0.149 g/ft2/day
Hydraulic parameters were estimated using topographic map data and general assumptions. They are as follows:
Stream Slope: 9.10 ft/mi Side Slope: 0.10 ft/ft Manning’s “n”: 0.12
7Q2 for the unnamed tributary was assigned 1.0 cfs because there is no data available for the stream. The model inputs were included in the Appendix A.
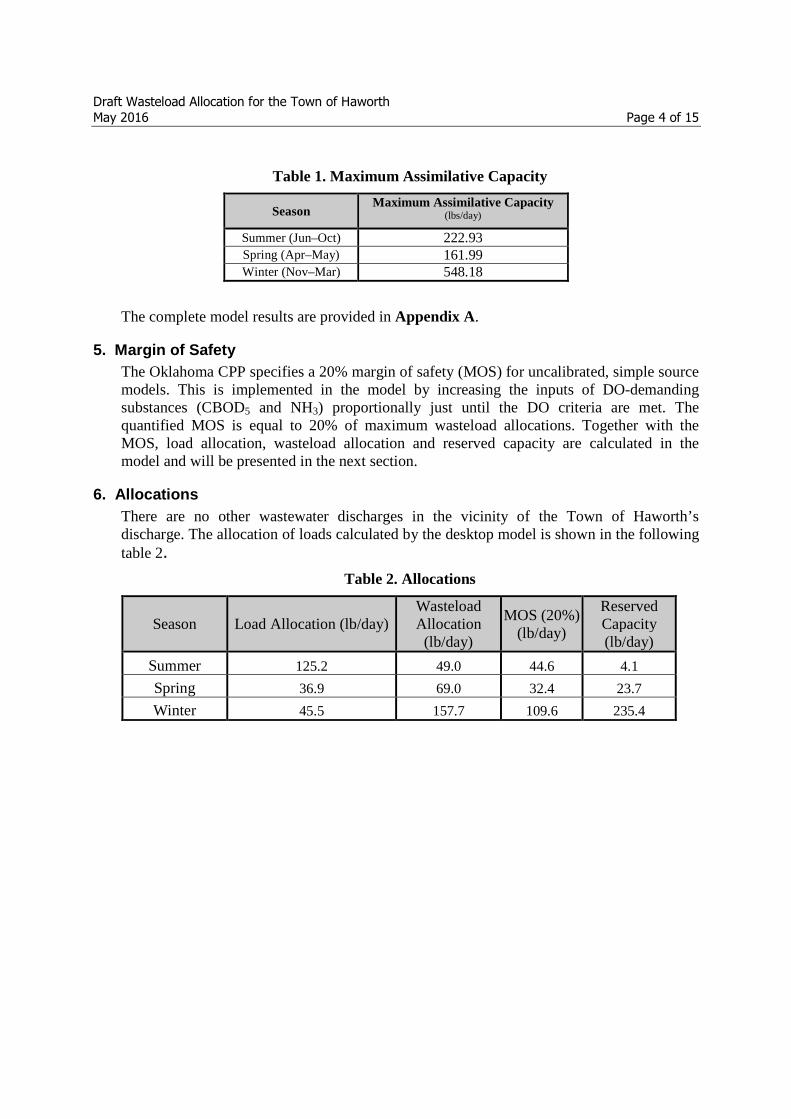
4.2. Maximum Assimilative Capacity The model was used to determine the stream’s maximum assimilative capacity during various seasons under regulatory flow condition of 1.0 cfs for the unnamed tributary. To do this, the concentration of CBOD5 and NH3 of the point source are increased at the same rate until the predicted instream DO reaches the DO criteria. The resultant mass loading represents the maximum assimilative capacity of the stream for DO-demanding substances. The maximum assimilative capacity is measured in terms of DO as shown in the following table 1.
Draft Wasteload Allocation for the Town of Haworth
May 2016 Page 4 of 15
Table 1. Maximum Assimilative Capacity
Season Maximum Assimilative Capacity
(lbs/day)
Summer (Jun–Oct) 222.93 Spring (Apr–May) 161.99 Winter (Nov–Mar) 548.18
The complete model results are provided in Appendix A.
5. Margin of Safety The Oklahoma CPP specifies a 20% margin of safety (MOS) for uncalibrated, simple source models. This is implemented in the model by increasing the inputs of DO-demanding substances (CBOD5 and NH3) proportionally just until the DO criteria are met. The quantified MOS is equal to 20% of maximum wasteload allocations. Together with the MOS, load allocation, wasteload allocation and reserved capacity are calculated in the model and will be presented in the next section.
6. Allocations There are no other wastewater discharges in the vicinity of the Town of Haworth’s discharge. The allocation of loads calculated by the desktop model is shown in the following table 2.
Table 2. Allocations
Season Load Allocation (lb/day) Wasteload Allocation (lb/day)
MOS (20%) (lb/day)
Reserved Capacity (lb/day)
Summer 125.2 49.0 44.6 4.1
Spring 36.9 69.0 32.4 23.7
Winter 45.5 157.7 109.6 235.4

Draft Wasteload Allocation for the Town of Haworth
May 2016 Page 5 of 15
7. Final Recommendations The following changes are recommended for inclusion in the Oklahoma Water Quality Management Plan (208 Plan).
Town of Haworth WWTP Limits
Proposed Design Flow: 0.155 MGD Summer (Jun–Oct): No Discharge Spring (April–May): No Discharge Winter (Nov–Mar): (Lagoon Secondary) 30 mg/l BOD5, 90 mg/l TSS
8. Public Participation This Draft WLA report will be submitted to EPA for technical approval. After technical approval is received, the proposed permit limits will be sent for public comments. Public comments received during this period will be responded to and become part of the WLA report.
The proposed limits will be implemented through the Oklahoma Pollutant Discharge Elimination System (OPDES) permit for the Town of Haworth, which represents an adequate implementation of the wasteload allocation. The water quality model in this report shows clearly that the recommended allocation of DO-demanding substances effectively addresses the DO problem that can be potentially caused by the proposed discharge of the facility.
The Town of Haworth will be required to submit monthly Discharge Monitoring Reports (DMR) to the Oklahoma Department of Environmental Quality. The DMR will ensure that the beneficial uses will be maintained in unnamed tributary to Norwood Creek as well as in Norwood Creek.
9. References
1. Title 785, Oklahoma Administrative Code, Chapter 45 Oklahoma’s Water Quality
Standards, State Of Oklahoma, 2011.
2. Oklahoma Desktop Model – One Reach, version 3.0, Watershed Planning Section, Oklahoma Department of Environmental Quality, Oklahoma City Oklahoma, 2008.
3. Oklahoma Continuing Planning Process, 2012 edition, Oklahoma Department of Environmental Quality, State of Oklahoma, 2013.

Draft Wasteload Evaluation for the Town of Haworth
March 2016 Page 6 of 15
Figure 1. Haworth WWTF Receiving Streams (Overview)

Draft Wasteload Evaluation for the Town of Haworth
March 2016 Page 7 of 15
Figure 2. Haworth WWTF Receiving Stream (Detailed View)

Draft Wasteload Allocation for the Town of Haworth
May 2016 Page 8 of 15
Appendix A - Desktop Model

Draft Wasteload Allocation for the Town of Haworth
May 2016 Page 9 of 15
CITY: HaworthPERFORMED BY: Ying
DATE: 3/24/2016
I DISCHARGE INFORMATIONLOCATION: SE 1/4-23-T8S-R25E BASIN: 410100COUNTY: MCCURTAIN
PROPOSED PERMIT FLOW: Summer Spring Winter0.155 0.155 0.155 MGD
II RECEIVING STREAMSTREAM NAME Unamed Tributary/Norwood Creek
MODELED LENGTH 1.10 MILES NUMBER OF SEGMENTS 40
Summer Spring WinterUPSTREAM FLOW (7Q2) 1.00 1.00 1.00 CFS
STREAM SLOPE (S) FT/MILE
SIDE SLOPE (P) FT/FT
MANNING'S N VELOCITY COEFFICIENT (Cv)DEPTH COEFFICIENT (Ch)
Velocity (fps) 0.25 0.25 0.25Depth (ft) 0.35 0.35 0.35Velocity (fps) - - -Depth (ft) - - -
III WATER QUALITY CRITERIA OF RECEIVING STREAMAQUATIC COMMUNITY FLAG 2 WARM WATER AQUATIC COMMUNITYAVERAGE D.O. REQUIREMENT SUMMER 5.00 MG/L
SPRING 6.00 MG/L
WINTER 6.00 MG/L
IV UPSTREAM CONDITIONS
D.O. SATURATION 85.00 %
UPSTREAM CBOD5 2.00 MG/L
UPSTREAM NH3-N 0.15 MG/L
V RATE CONSTANTS at 20° C
CBOD DECAY RATE (K1) 0.35 0.35 0.35
(/DAY)
REAERATION RATES (K2) 1.0 (cfs) - 1.0 (cfs) - 1.0 (cfs) -1). TURNEY-HARRIS
K2=1.33*S 0̂.32/n 0̂.64 10.47 - 10.47 - 10.47 -
2). TEXAS
K2=4.022*V 0̂.273/H 0̂.894 7.03 - 7.03 - 7.03 -
SELECTTED K2 FORMULA Flag Formula Flag Formula Flag Formula1 TURNEY-HARRIS 1 TURNEY-HARRIS 1 TURNEY-HARRIS
10.47 - 10.47 - 10.47 -
SUMMER SPRING WINTER
0 0 0CBOD SETTLING RATE (Ks) KS 0.03 0.03 0.05 /DAY
0 0 0NBOD DECAY (Kn) KN 0.30 0.30 0.30 /DAY
0 0 0SOD 0.072 0.080 0.149 G/FT2/D
Winter
UPSTREAM FLOW UPSTREAM FLOW UPSTREAM FLOW
0.35 0.35 0.35
9.10
Summer Spring
0.100.12
1.899
-
INPUT PARAMETERS FOR MODIFIED STREETER-PHELPS MODEL
Summer
0.176
SUMMER SPRING
WinterSpring
1.01.0
-
Upstream Flow 7Q2 (cfs)
Upstream Flow 0.0 (cfs)
1.0
WINTER
SEDIMENT OXYGEN DEMAND
-
Draft Wasteload Allocation for the Town of Haworth
May 2016 Page 10 of 15
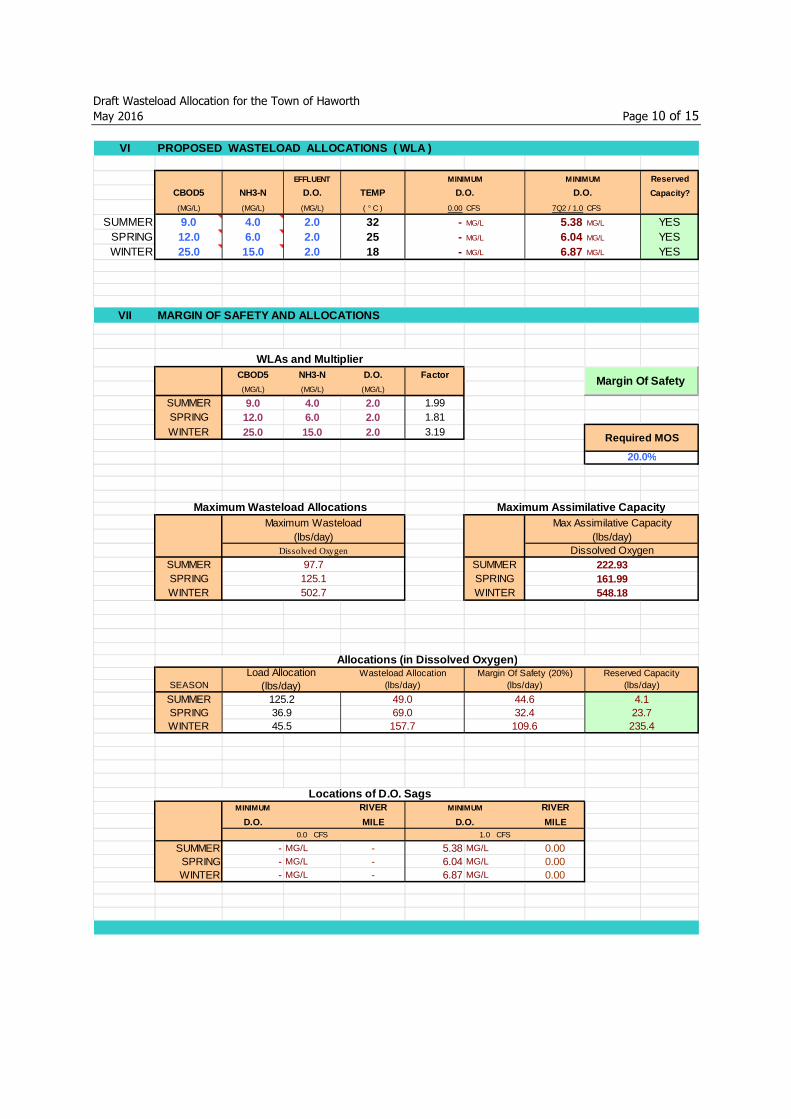
VI PROPOSED WASTELOAD ALLOCATIONS ( WLA )
EFFLUENT MINIMUM MINIMUM Reserved
CBOD5 NH3-N D.O. TEMP D.O. D.O. Capacity?
(MG/L) (MG/L) (MG/L) ( ° C ) 0.00 CFS 7Q2 / 1.0 CFS
SUMMER 9.0 4.0 2.0 32 - MG/L 5.38 MG/L YESSPRING 12.0 6.0 2.0 25 - MG/L 6.04 MG/L YESWINTER 25.0 15.0 2.0 18 - MG/L 6.87 MG/L YES
VII MARGIN OF SAFETY AND ALLOCATIONS
CBOD5 NH3-N D.O. Factor
(MG/L) (MG/L) (MG/L) 1
SUMMER 9.0 4.0 2.0 1.99SPRING 12.0 6.0 2.0 1.81WINTER 25.0 15.0 2.0 3.19
SUMMER SUMMERSPRING SPRINGWINTER WINTER
Wasteload Allocation Margin Of Safety (20%) Reserved CapacitySEASON (lbs/day) (lbs/day) (lbs/day)
SUMMERSPRINGWINTER
MINIMUM RIVER MINIMUM RIVER
D.O. MILE D.O. MILE0.0 CFS 1.0 CFS
SUMMER - MG/L - 5.38 MG/L 0.00SPRING - MG/L - 6.04 MG/L 0.00WINTER - MG/L - 6.87 MG/L 0.00
WLAs and Multiplier
69.049.0
157.7
44.632.4109.6
Maximum Assimilative Capacity
235.4
20.0%
4.123.7
Allocations (in Dissolved Oxygen)Load Allocation
(lbs/day)
Maximum Wasteload(lbs/day)
222.93
Required MOS
Maximum Wasteload AllocationsMax Assimilative Capacity
(lbs/day)
125.1502.7
97.7Dissolved Oxygen
Locations of D.O. Sags
548.18
Dissolved Oxygen
161.99
45.5
125.236.9
Margin Of Safety

Draft Wasteload Allocation for the Town of Haworth
May 2016 Page 11 of 15
Plots for 7Q2 Headwater Flow:
4.0
4.5
5.0
5.5
6.0
0.0 0.2 0.4 0.6 0.8 1.0 1.2
DO
(m
g/L)
Distance (mi)
SUMMER
DO Standards
5.0
5.5
6.0
6.5
7.0
0.0 0.2 0.4 0.6 0.8 1.0 1.2
DO
(m
g/L)
Distance (mi)
SPRING
DO Standdards
5.5
5.7
5.9
6.1
6.3
6.5
6.7
6.9
7.1
7.3
7.5
0.0 0.2 0.4 0.6 0.8 1.0 1.2
DO
(m
g/L)
Distance (mi)
WINTER
DO Standards

Draft Wasteload Allocation for the Town of Haworth
May 2016 Page 12 of 15
OKLAHOMA DEPARTMENT OF ENVIRONMENTAL QUALITY
DESKTOP WASTELOAD ANALYSIS - SUMMER
HaworthS SUMMER ALLOCATION
PROPOSED PERMIT FLOW = 0.155 MGD 1.0 CFS UPSTREAM FLOW PROPOSED PERMIT FLOW = 0.155 MGD - CFS UPSTREAM FLOW32 ° C TEMPERATURE 32 ° C TEMPERATURE
INITIAL CONDITIONS ARE AS FOLLOWS....... INITIAL CONDITIONS ARE AS FOLLOWS.......
REACH LENGTH (MILES): 1.10 REACH LENGTH (MILES): 1.10NUMBER OF SEGMENTS: 40 STREAM VELOCITY: 4.11 MILES/DAY NUMBER OF SEGMENTS: 40 STREAM VELOCITY: 4.11 MILES/DAY
NUMBER OF REACHES: 1 STREAM DEPTH: 0.35 FEET NUMBER OF REACHES: 1 STREAM DEPTH: 0.35 FEET
REACH NUMBER: 1 REACH CL CONC: 150.0 MG/L REACH NUMBER: 1 REACH CL CONC: 150.0 MG/L
BODU/CBOD5 RATIO: 2.30 D.O. SATURATION: 7.29 MG/L BODU/CBOD5 RATIO: 2.30 D.O. SATURATION: 7.29 MG/L
NODU/CBOD5 RATIO: 4.30 D.O. TARGET: 5.00 MG/L NODU/CBOD5 RATIO: 4.30 D.O. TARGET: 2.00 MG/L
EFFLUENT FLOW: 0.16 MGD UPSTREAM FLOW: 0.65 MGD EFFLUENT FLOW: 0.16 MGD UPSTREAM FLOW: 0.65 MGD
EFFLUENT CBOD5: 9.0 MG/L UPSTREAM CBOD5: 2.00 MG/L EFFLUENT CBOD5: 9.0 MG/L UPSTREAM CBOD5: 2.00 MG/L
EFFLUENT NH3N: 4.0 MG/L UPSTREAM NH3N: 0.15 MG/L EFFLUENT NH3N: 4.0 MG/L UPSTREAM NH3N: 0.15 MG/L
EFFLUENT D.O.: 2.0 MG/L UPSTREAM D.O.: 6.20 MG/L EFFLUENT D.O.: 2.0 MG/L UPSTREAM D.O.: 6.20 MG/L
RATE CONSTANTS(1/DAY, BASE E) 20 DEGREES 32 DEGREES THETA RATE CONSTANTS(1/DAY, BASE E) 20 DEGREES 32 DEGREES THETA
K1: 0.35 0.61 1.047 K1: 0.35 0.61 1.047
K2: TURNEY-HARRIS 10.47 13.92 1.024 K2: TURNEY-HARRIS - - 1.024
KN: 0.30 0.70 1.073 KN: 0.30 0.70 1.073
KS: 0.03 0.04 1.024 KS: 0.03 0.04 1.024
SOD (G/FT2/DAY): 0.07 0.14 1.060 SOD (G/FT2/DAY): 0.07 0.14 1.0600.6472117 0.6472117
RESULTS ARE AS FOLLOWS.... RESULTS ARE AS FOLLOWS....
DISTANCE CBOD5 ULT BOD NH3-N ULT NOD D.O. FLOW DISTANCE CBOD5 ULT BOD NH3-N ULT NOD D.O. FLOW(MILES) (MG/L) (MG/L) (MG/L) (MG/L) (MG/L) (MGD) (MILES) (M G/L) (MG/L) (MG/L) (MG/L) (MG/L) (MGD)
5.38 0.00 3.35 7.72 0.90 3.85 5.38 0.80 - 0.00 - - - - - -5.41 0.03 3.34 7.68 0.89 3.83 5.41 0.80 - 0.03 - - - - - -5.44 0.06 3.33 7.65 0.89 3.81 5.44 0.80 - 0.06 - - - - - -5.47 0.08 3.31 7.62 0.88 3.79 5.47 0.80 - 0.08 - - - - - -5.49 0.11 3.30 7.58 0.88 3.78 5.49 0.80 - 0.11 - - - - - -5.51 0.14 3.28 7.55 0.87 3.76 5.51 0.80 - 0.14 - - - - - -5.53 0.17 3.27 7.52 0.87 3.74 5.53 0.80 - 0.17 - - - - - -5.55 0.19 3.25 7.49 0.87 3.72 5.55 0.80 - 0.19 - - - - - -5.56 0.22 3.24 7.45 0.86 3.71 5.56 0.80 - 0.22 - - - - - -5.58 0.25 3.23 7.42 0.86 3.69 5.58 0.80 - 0.25 - - - - - -5.59 0.28 3.21 7.39 0.85 3.67 5.59 0.80 - 0.28 - - - - - -5.61 0.30 3.20 7.36 0.85 3.66 5.61 0.80 - 0.30 - - - - - -5.62 0.33 3.18 7.33 0.85 3.64 5.62 0.80 - 0.33 - - - - - -5.63 0.36 3.17 7.29 0.84 3.62 5.63 0.80 - 0.36 - - - - - -5.64 0.39 3.16 7.26 0.84 3.60 5.64 0.80 - 0.39 - - - - - -5.65 0.41 3.14 7.23 0.83 3.59 5.65 0.80 - 0.41 - - - - - -5.66 0.44 3.13 7.20 0.83 3.57 5.66 0.80 - 0.44 - - - - - -5.67 0.47 3.12 7.17 0.83 3.55 5.67 0.80 - 0.47 - - - - - -5.68 0.50 3.10 7.14 0.82 3.54 5.68 0.80 - 0.50 - - - - - -5.68 0.52 3.09 7.11 0.82 3.52 5.68 0.80 - 0.52 - - - - - -5.69 0.55 3.08 7.08 0.82 3.51 5.69 0.80 - 0.55 - - - - - -5.70 0.58 3.06 7.05 0.81 3.49 5.70 0.80 - 0.58 - - - - - -5.70 0.61 3.05 7.01 0.81 3.47 5.70 0.80 - 0.61 - - - - - -5.71 0.63 3.04 6.98 0.80 3.46 5.71 0.80 - 0.63 - - - - - -5.71 0.66 3.02 6.95 0.80 3.44 5.71 0.80 - 0.66 - - - - - -5.72 0.69 3.01 6.92 0.80 3.42 5.72 0.80 - 0.69 - - - - - -5.72 0.72 3.00 6.89 0.79 3.41 5.72 0.80 - 0.72 - - - - - -5.73 0.74 2.98 6.86 0.79 3.39 5.73 0.80 - 0.74 - - - - - -5.73 0.77 2.97 6.84 0.79 3.38 5.73 0.80 - 0.77 - - - - - -5.74 0.80 2.96 6.81 0.78 3.36 5.74 0.80 - 0.80 - - - - - -5.74 0.83 2.95 6.78 0.78 3.35 5.74 0.80 - 0.83 - - - - - -5.75 0.85 2.93 6.75 0.77 3.33 5.75 0.80 - 0.85 - - - - - -5.75 0.88 2.92 6.72 0.77 3.31 5.75 0.80 - 0.88 - - - - - -5.75 0.91 2.91 6.69 0.77 3.30 5.75 0.80 - 0.91 - - - - - -5.76 0.94 2.90 6.66 0.76 3.28 5.76 0.80 - 0.94 - - - - - -5.76 0.96 2.88 6.63 0.76 3.27 5.76 0.80 - 0.96 - - - - - -5.76 0.99 2.87 6.60 0.76 3.25 5.76 0.80 - 0.99 - - - - - -5.77 1.02 2.86 6.57 0.75 3.24 5.77 0.80 - 1.02 - - - - - -5.77 1.05 2.85 6.55 0.75 3.22 5.77 0.80 - 1.05 - - - - - -5.77 1.07 2.83 6.52 0.75 3.21 5.77 0.80 - 1.07 - - - - - -5.77 1.10 2.82 6.49 0.74 3.19 5.77 0.80 - 1.10 - - - - - -

Draft Wasteload Allocation for the Town of Haworth
May 2016 Page 13 of 15
DESKTOP WASTELOAD ANALYSIS - SPRING
HaworthALLOCATION
PROPOSED PERMIT FLOW = 0.155 MGD 1.0 CFS UPSTREAM FLOW PROPOSED PERMIT FLOW = 0.155 MGD - CFS UPSTREAM FLOW25 ° C TEMPERATURE 25 ° C TEMPERATURE
INITIAL CONDITIONS ARE AS FOLLOWS....... INITIAL CONDITIONS ARE AS FOLLOWS.......
REACH LENGTH (MILES): 1.10 REACH LENGTH (MILES): 1.10NUMBER OF SEGMENTS: 40 STREAM VELOCITY: 4.11 MILES/DAY NUMBER OF SEGMENTS: 40 STREAM VELOCITY: 4.11 MILES/DAY
NUMBER OF REACHES: 1 STREAM DEPTH: 0.35 FEET NUMBER OF REACHES: 1 STREAM DEPTH: 0.35 FEET
REACH NUMBER: 1 REACH CL CONC: 150.0 MG/L REACH NUMBER: 1 REACH CL CONC: 150.0 MG/L
BODU/CBOD5 RATIO: 2.30 D.O. SATURATION: 8.25 MG/L BODU/CBOD5 RATIO: 2.30 D.O. SATURATION: 8.25 MG/L
NODU/CBOD5 RATIO: 4.30 D.O. TARGET: 6.00 MG/L NODU/CBOD5 RATIO: 4.30 D.O. TARGET: 2.00 MG/L
EFFLUENT FLOW: 0.16 MGD UPSTREAM FLOW: 0.65 MGD EFFLUENT FLOW: 0.16 MGD UPSTREAM FLOW: 0.65 MGD
EFFLUENT CBOD5: 12.0 MG/L UPSTREAM CBOD5: 2.00 MG/L EFFLUENT CBOD5: 12.0 MG/L UPSTREAM CBOD5: 2.00 MG/L
EFFLUENT NH3N: 6.0 MG/L UPSTREAM NH3N: 0.15 MG/L EFFLUENT NH3N: 6.0 MG/L UPSTREAM NH3N: 0.15 MG/L
EFFLUENT D.O.: 2.0 MG/L UPSTREAM D.O.: 7.01 MG/L EFFLUENT D.O.: 2.0 MG/L UPSTREAM D.O.: 7.01 MG/L
RATE CONSTANTS(1/DAY, BASE E) 20 DEGREES 25 DEGREES THETA RATE CONSTANTS(1/DAY, BASE E) 20 DEGREES 25 DEGREES THETA
K1: 0.35 0.44 1.047 K1: 0.35 0.44 1.047
K2: TURNEY-HARRIS 10.47 11.79 1.024 K2: TURNEY-HARRIS - - 1.024
KN: 0.30 0.43 1.073 KN: 0.30 0.43 1.073
KS: 0.03 0.03 1.024 KS: 0.03 0.03 1.024
SOD (G/FT2/DAY): 0.08 0.11 1.060 SOD (G/FT2/DAY): 0.08 0.11 1.0600.47 0.4741305
RESULTS ARE AS FOLLOWS.... RESULTS ARE AS FOLLOWS....
DISTANCE CBOD5 ULT BOD NH3-N ULT NOD D.O. FLOW DISTANCE CBOD5 ULT BOD NH3-N ULT NOD D.O. FLOW(MILES) (MG/L) (MG/L) (MG/L) (MG/L) (MG/L) (MGD) (MILES) (M G/L) (MG/L) (MG/L) (MG/L) (MG/L) (MGD)
0.00 3.94 9.05 1.28 5.51 6.04 0.80 - 0.00 - - - - - -0.03 3.92 9.02 1.28 5.50 6.10 0.80 - 0.03 - - - - - -0.06 3.91 8.99 1.27 5.48 6.15 0.80 - 0.06 - - - - - -0.08 3.90 8.97 1.27 5.47 6.20 0.80 - 0.08 - - - - - -0.11 3.89 8.94 1.27 5.45 6.25 0.80 - 0.11 - - - - - -0.14 3.87 8.91 1.26 5.43 6.29 0.80 - 0.14 - - - - - -0.17 3.86 8.88 1.26 5.42 6.33 0.80 - 0.17 - - - - - -0.19 3.85 8.85 1.26 5.40 6.37 0.80 - 0.19 - - - - - -0.22 3.84 8.82 1.25 5.39 6.40 0.80 - 0.22 - - - - - -0.25 3.82 8.80 1.25 5.37 6.43 0.80 - 0.25 - - - - - -0.28 3.81 8.77 1.25 5.36 6.46 0.80 - 0.28 - - - - - -0.30 3.80 8.74 1.24 5.34 6.49 0.80 - 0.30 - - - - - -0.33 3.79 8.71 1.24 5.33 6.51 0.80 - 0.33 - - - - - -0.36 3.78 8.69 1.24 5.31 6.54 0.80 - 0.36 - - - - - -0.39 3.76 8.66 1.23 5.30 6.56 0.80 - 0.39 - - - - - -0.41 3.75 8.63 1.23 5.28 6.58 0.80 - 0.41 - - - - - -0.44 3.74 8.60 1.22 5.27 6.60 0.80 - 0.44 - - - - - -0.47 3.73 8.58 1.22 5.25 6.61 0.80 - 0.47 - - - - - -0.50 3.72 8.55 1.22 5.24 6.63 0.80 - 0.50 - - - - - -0.52 3.71 8.52 1.21 5.22 6.65 0.80 - 0.52 - - - - - -0.55 3.69 8.49 1.21 5.21 6.66 0.80 - 0.55 - - - - - -0.58 3.68 8.47 1.21 5.19 6.67 0.80 - 0.58 - - - - - -0.61 3.67 8.44 1.20 5.18 6.68 0.80 - 0.61 - - - - - -0.63 3.66 8.41 1.20 5.16 6.70 0.80 - 0.63 - - - - - -0.66 3.65 8.39 1.20 5.15 6.71 0.80 - 0.66 - - - - - -0.69 3.64 8.36 1.19 5.13 6.72 0.80 - 0.69 - - - - - -0.72 3.62 8.33 1.19 5.12 6.73 0.80 - 0.72 - - - - - -0.74 3.61 8.31 1.19 5.10 6.74 0.80 - 0.74 - - - - - -0.77 3.60 8.28 1.18 5.09 6.74 0.80 - 0.77 - - - - - -0.80 3.59 8.26 1.18 5.07 6.75 0.80 - 0.80 - - - - - -0.83 3.58 8.23 1.18 5.06 6.76 0.80 - 0.83 - - - - - -0.85 3.57 8.20 1.17 5.05 6.76 0.80 - 0.85 - - - - - -0.88 3.56 8.18 1.17 5.03 6.77 0.80 - 0.88 - - - - - -0.91 3.54 8.15 1.17 5.02 6.78 0.80 - 0.91 - - - - - -0.94 3.53 8.13 1.16 5.00 6.78 0.80 - 0.94 - - - - - -0.96 3.52 8.10 1.16 4.99 6.79 0.80 - 0.96 - - - - - -0.99 3.51 8.07 1.16 4.97 6.79 0.80 - 0.99 - - - - - -1.02 3.50 8.05 1.15 4.96 6.80 0.80 - 1.02 - - - - - -1.05 3.49 8.02 1.15 4.95 6.80 0.80 - 1.05 - - - - - -1.07 3.48 8.00 1.15 4.93 6.81 0.80 - 1.07 - - - - - -1.10 3.47 7.97 1.14 4.92 6.81 0.80 - 1.10 - - - - - -

Draft Wasteload Allocation for the Town of Haworth
May 2016 Page 14 of 15
OKLAHOMA DEPARTMENT OF ENVIRONMENTAL QUALITY
DESKTOP WASTELOAD ANALYSIS - WINTER
Haworth
PROPOSED PERMIT FLOW = 0.155 MGD 1.0 CFS UPSTREAM FLOW PROPOSED PERMIT FLOW = 0.155 MGD - CFS UPSTREAM FLOW18 ° C TEMPERATURE 18 ° C TEMPERATURE
INITIAL CONDITIONS ARE AS FOLLOWS....... INITIAL CONDITIONS ARE AS FOLLOWS.......
REACH LENGTH (MILES): 1.10 REACH LENGTH (MILES): 1.10NUMBER OF SEGMENTS: 40 STREAM VELOCITY: 4.11 MILES/DAY NUMBER OF SEGMENTS: 40 STREAM VELOCITY: 4.11 MILES/DAY
NUMBER OF REACHES: 1 STREAM DEPTH: 0.35 FEET NUMBER OF REACHES: 1 STREAM DEPTH: 0.35 FEET
REACH NUMBER: 1 REACH CL CONC: 150.0 MG/L REACH NUMBER: 1 REACH CL CONC: 150.0 MG/L
BODU/CBOD5 RATIO: 2.30 D.O. SATURATION: 9.45 MG/L BODU/CBOD5 RATIO: 2.30 D.O. SATURATION: 9.45 MG/L
NODU/CBOD5 RATIO: 4.30 D.O. TARGET: 6.00 MG/L NODU/CBOD5 RATIO: 4.30 D.O. TARGET: 2.00 MG/L
EFFLUENT FLOW: 0.16 MGD UPSTREAM FLOW: 0.65 MGD EFFLUENT FLOW: 0.16 MGD UPSTREAM FLOW: 0.65 MGD
EFFLUENT CBOD5: 25.0 MG/L UPSTREAM CBOD5: 2.00 MG/L EFFLUENT CBOD5: 25.0 MG/L UPSTREAM CBOD5: 2.00 MG/L
EFFLUENT NH3N: 15.0 MG/L UPSTREAM NH3N: 0.15 MG/L EFFLUENT NH3N: 15.0 MG/L UPSTREAM NH3N: 0.15 MG/L
EFFLUENT D.O.: 2.0 MG/L UPSTREAM D.O.: 8.03 MG/L EFFLUENT D.O.: 2.0 MG/L UPSTREAM D.O.: 8.03 MG/L
RATE CONSTANTS(1/DAY, BASE E) 20 DEGREES 18 DEGREES THETA RATE CONSTANTS(1/DAY, BASE E) 20 DEGREES 18 DEGREES THETA
K1: 0.35 0.32 1.047 K1: 0.35 0.32 1.047
K2: TURNEY-HARRIS 10.47 9.99 1.024 K2: TURNEY-HARRIS - - 1.024
KN: 0.30 0.26 1.073 KN: 0.30 0.26 1.073
KS: 0.05 0.05 1.024 KS: 0.05 0.05 1.024
SOD (G/FT2/DAY): 0.15 0.13 1.060 SOD (G/FT2/DAY): 0.15 0.13 1.0600.3669659 0.3669659
RESULTS ARE AS FOLLOWS.... RESULTS ARE AS FOLLOWS....
DISTANCE CBOD5 ULT BOD NH3-N ULT NOD D.O. FLOW DISTANCE CBOD5 ULT BOD NH3-N ULT NOD D.O. FLOW(MILES) (MG/L) (MG/L) (MG/L) (MG/L) (MG/L) (MGD) (MILES) (M G/L) (MG/L) (MG/L) (MG/L) (MG/L) (MGD)
0.00 6.45 14.84 3.02 13.00 6.87 0.80 - 0.00 - - - - - -0.03 6.43 14.80 3.02 12.98 6.89 0.80 - 0.03 - - - - - -0.06 6.42 14.76 3.01 12.96 6.92 0.80 - 0.06 - - - - - -0.08 6.40 14.73 3.01 12.93 6.95 0.80 - 0.08 - - - - - -0.11 6.39 14.69 3.00 12.91 6.97 0.80 - 0.11 - - - - - -0.14 6.37 14.66 3.00 12.89 6.99 0.80 - 0.14 - - - - - -0.17 6.36 14.62 2.99 12.87 7.01 0.80 - 0.17 - - - - - -0.19 6.34 14.58 2.99 12.84 7.03 0.80 - 0.19 - - - - - -0.22 6.33 14.55 2.98 12.82 7.05 0.80 - 0.22 - - - - - -0.25 6.31 14.51 2.98 12.80 7.07 0.80 - 0.25 - - - - - -0.28 6.29 14.48 2.97 12.78 7.08 0.80 - 0.28 - - - - - -0.30 6.28 14.44 2.97 12.75 7.10 0.80 - 0.30 - - - - - -0.33 6.26 14.41 2.96 12.73 7.11 0.80 - 0.33 - - - - - -0.36 6.25 14.37 2.96 12.71 7.13 0.80 - 0.36 - - - - - -0.39 6.23 14.34 2.95 12.69 7.14 0.80 - 0.39 - - - - - -0.41 6.22 14.30 2.95 12.67 7.15 0.80 - 0.41 - - - - - -0.44 6.20 14.27 2.94 12.64 7.16 0.80 - 0.44 - - - - - -0.47 6.19 14.23 2.94 12.62 7.17 0.80 - 0.47 - - - - - -0.50 6.17 14.20 2.93 12.60 7.18 0.80 - 0.50 - - - - - -0.52 6.16 14.16 2.93 12.58 7.19 0.80 - 0.52 - - - - - -0.55 6.14 14.13 2.92 12.56 7.20 0.80 - 0.55 - - - - - -0.58 6.13 14.09 2.91 12.53 7.21 0.80 - 0.58 - - - - - -0.61 6.11 14.06 2.91 12.51 7.22 0.80 - 0.61 - - - - - -0.63 6.10 14.02 2.90 12.49 7.23 0.80 - 0.63 - - - - - -0.66 6.08 13.99 2.90 12.47 7.24 0.80 - 0.66 - - - - - -0.69 6.07 13.95 2.89 12.45 7.24 0.80 - 0.69 - - - - - -0.72 6.05 13.92 2.89 12.43 7.25 0.80 - 0.72 - - - - - -0.74 6.04 13.89 2.88 12.40 7.26 0.80 - 0.74 - - - - - -0.77 6.02 13.85 2.88 12.38 7.26 0.80 - 0.77 - - - - - -0.80 6.01 13.82 2.87 12.36 7.27 0.80 - 0.80 - - - - - -0.83 5.99 13.78 2.87 12.34 7.27 0.80 - 0.83 - - - - - -0.85 5.98 13.75 2.86 12.32 7.28 0.80 - 0.85 - - - - - -0.88 5.96 13.72 2.86 12.30 7.28 0.80 - 0.88 - - - - - -0.91 5.95 13.68 2.85 12.28 7.29 0.80 - 0.91 - - - - - -0.94 5.93 13.65 2.85 12.25 7.29 0.80 - 0.94 - - - - - -0.96 5.92 13.62 2.84 12.23 7.30 0.80 - 0.96 - - - - - -0.99 5.91 13.58 2.84 12.21 7.30 0.80 - 0.99 - - - - - -1.02 5.89 13.55 2.83 12.19 7.31 0.80 - 1.02 - - - - - -1.05 5.88 13.52 2.83 12.17 7.31 0.80 - 1.05 - - - - - -1.07 5.86 13.48 2.82 12.15 7.31 0.80 - 1.07 - - - - - -1.10 5.85 13.45 2.82 12.13 7.32 0.80 - 1.10 - - - - - -