draft - university of toronto t-space · pdf filefhwa deep foundation load test database ......
TRANSCRIPT

Draft
Design method reliability assessment from an extended
database of axial load tests on piles driven in sand
Journal: Canadian Geotechnical Journal
Manuscript ID cgj-2015-0518.R1
Manuscript Type: Article
Date Submitted by the Author: 23-Aug-2016
Complete List of Authors: Yang, Zhongxuan; Zhejiang University, Department of Civil Engineering Guo, Wangbo; Zhejiang Univerisity, Civil Engineering Jardine, Richard; Imperial College London, Chow, Fiona; Woodside Energy Ltd
Keyword: database assessment, driven piles, sand, capacity of pile, time effect
https://mc06.manuscriptcentral.com/cgj-pubs
Canadian Geotechnical Journal

Draft
Design method reliability assessment from an extended database of axial load tests on piles
driven in sand
Z.X. Yang1, W.B. Guo
2, R.J. Jardine
3, F. Chow
4
Abstract
Accurate axial capacity remains a challenging task for piles driven in sands. Rigorous database
studies have become key tools for assessing the efficacy of design methods. This paper employs
the 117 high quality entries in the recently developed ZJU-ICL database to check for potential
biases between nine prediction procedures, considering a range of factors. The analysis highlights
the critical importance of addressing age after driving, open and closed ends, tension versus
compression and concrete compared to steel. It also shows the hierarchy of reliability parameters
associated with the alternative approaches. The ‘full’ ICP approach and UWA approaches are
found to have significant advantages in eliminating potential biases. It is also argued that design
Load and Resistance or Safety Factors should be varied to match the design and site investigation
methods applied, as well as the loading uncertainty and degree of load cycling, which often
varies between applications. Noting that predictions for base capacities Qb are inherently less
reliable than for shaft QS, especially in rapidly varying ground profiles, credible lower bound
parameters qc are recommended for Qb assessment. It is also recommended that the potential
effects of cycling should be addressed carefully in cases that involve substantial environmental
loading.
Keywords: Database assessment; driven piles; sand; capacity of pile; time effect
1 Professor, Department of Civil Engineering, Zhejiang University, Hangzhou, China, email: [email protected]
2 Postgraduate student, Department of Civil Engineering, Zhejiang University, Hangzhou, China, email:
[email protected] 3 Professor, Department of Civil and Environmental Engineering, Imperial College, London, UK, email:
[email protected] 4 Chief Geotechnical Engineer, Woodside Energy, Perth, Australia, email: [email protected]
Page 1 of 46
https://mc06.manuscriptcentral.com/cgj-pubs
Canadian Geotechnical Journal

Draft
Introduction of database development
The growing use of CPT testing, in combination with recent research and design method
development, is improving the accuracy of axial capacity predictions for piles driven in sands;
(Jardine and Chow 2007; Schneider et al. 2008). Rigorous checking against statistically significant
numbers of field tests has been critical to assessing which ‘CPT’ methods offer advantages over
conventional procedures. However, even large national test archives, such as the United States
FHWA Deep Foundation Load Test Database (DFLTD) of 1307 tests involving a wide range of pile
and soil types (Abu-Hejleh et al. 2015) contain relatively few entries that offer the information
required to test the ‘CPT’ calculation procedures reliably for piles driven in sand. Similar
difficulties apply, for example, to the Laboratoire Central des Ponts et Chaussées (LCPC, now
known as IFSTTAR) database of 174 tests on which the French national design methods rely;
(Bustamante and Gianeselli 1982; Burlon et al. 2014).
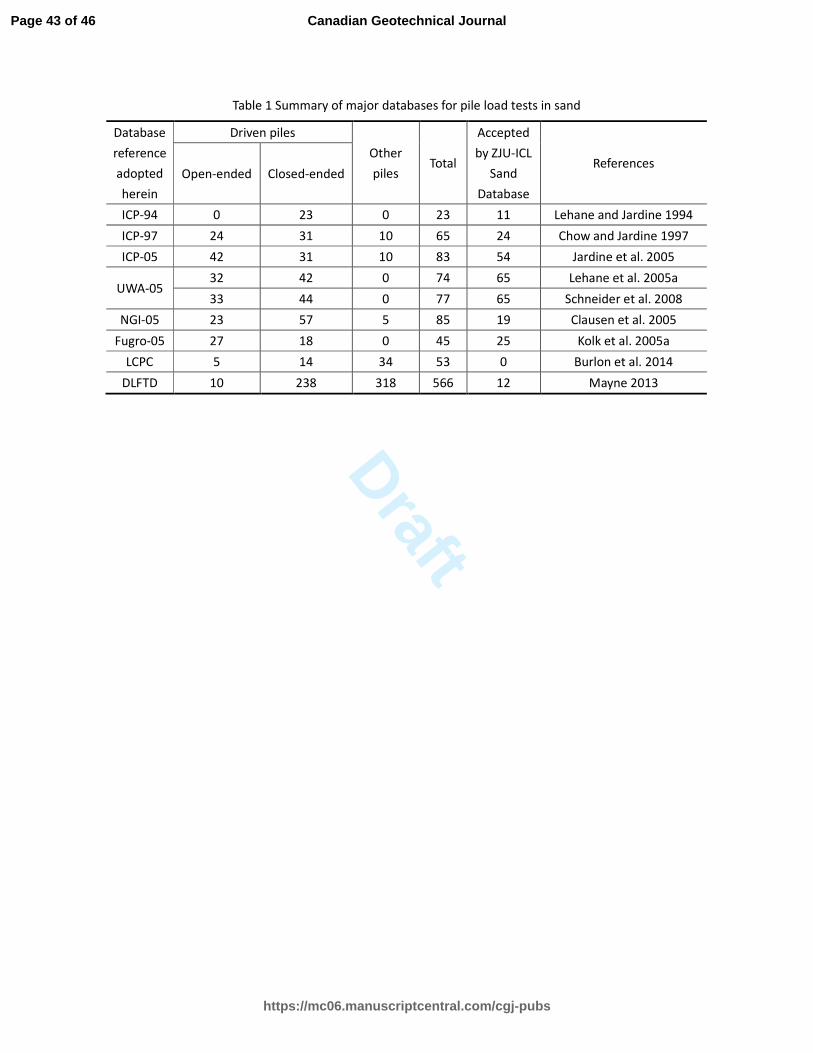
Specialist databases have therefore been built to test the new ‘CPT-based’ design approaches, as
summarised in Table 1. The database employed in this paper has grown from the 23
closed-ended tests on piles driven in sand assembled by Lehane (1992) and employed by Lehane
and Jardine (1994) to assess their early version of the Imperial College Pile (ICP) design method,
along with then the current American Petroleum Institute (API), LCPC and Toolan et al. (1990)
offshore design procedures. Chow (1997) identified and analysed 42 new sand cases, which she
added to the above 23 records to help assess the reliability of the Jardine and Chow (1996)
method for open and closed ended piles in comparison with the API and LCPC approaches.
Page 2 of 46
https://mc06.manuscriptcentral.com/cgj-pubs
Canadian Geotechnical Journal
Draft
Jardine et al. (2005) added 18 further cases, including high quality tests on large steel open-piles,
to build the database against which they tested the updated Imperial College Pile (ICP-05)
procedures.
Parallel work at the University of Western Australia (UWA) augmented Chow’s (1997) dataset
with 26 previously unrecognized entries. Lehane et al. (2005a, b) and Schneider et al. (2008)
applied quality filters that excluded, for example, tests without full CPT profiles. They employed
their 77 remaining tests to assess the reliability of the UWA-05 capacity prediction method, along
with ICP-05, the Main Text API and the Fugro-05 (Kolk et al. 2005a) and Norwegian Geotechnical
Institute (NGI-05, Clausen et al. 2005) methods that had been derived from databases of 45 and
85 tests respectively. As summarised later, the Fugro-05 shaft calculation procedure simplified
and re-calibrated the MTD expressions, while the UWA-05 shaft method extended from the same
expressions to address open ended piles by a new ‘effective area’ approach. The methods employ
a range of base resistance procedures.
A team from Zhejiang University (ZJU) and Imperial College London (ICL) has recently assembled
an openly accessible ‘CPT’ database for piles driven in sand
(http://mypage.zju.edu.cn/en/zxyang/682156.html) whose general characteristics are listed in
Table 2. Of the 117 tests currently included, 54 originated in the ICP-05 set, a further 14 in the
UWA-05 collection and 12 in the DFLTD database; the 37 other newly adopted cases derive from
literature searches and the Authors’ industrial and academic networks. Yang et al. (2015a,b)
describe the quality filters applied in assembling the ZJU-ICL database and give details of each
Page 3 of 46
https://mc06.manuscriptcentral.com/cgj-pubs
Canadian Geotechnical Journal

Draft
test entry. Noting that the database and statistical analyses can be updated as new tests or
design methods become available, the same Authors give preliminary indications of how
predictions from a limited range of design methods compare with the capacities of the database
piles.
The ZJU-ICL database’s 117 tests represent a 70% increase in the total population that meet our
stated quality criteria. This paper employs this resource to (i) offer a far more comprehensive
assessment of the performance of eight total capacity design methods and one additional base
capacity method and (ii) address significant shortfalls in previous studies and design guidance.
For example, API RP2GEO now notes the advantages of ‘CPT based’ methods and sets out
‘simplified’ ICP-05 and UWA-05 versions. However, we show below that the ‘simplified’ methods
may give significantly poorer predictions than the original ‘full' methods. We also examine below
potential factors that may influence the capacity of piles and result in potential biases with
respect to:
• Loading sense (tension or compression)
• Pile material (concrete or steel)
• Pile dimensions and slenderness (L, D, L/D)
• Wall thickness ratios (D/t) for open ended piles
The selection of soil parameters, the potential impact of cyclic loading and the choice of safety or
load and resistance factors are also discussed. The new database analysis follows a brief
introductory recapitulation of the nine design methods and discussion on critical new evidence
regarding the effects of ageing between driving and testing. However, our main focus is on the
database analysis; references are cited that provide full details of the pile load tests, the
Page 4 of 46
https://mc06.manuscriptcentral.com/cgj-pubs
Canadian Geotechnical Journal

Draft
calculation procedures and associated pile ageing studies.
Pile capacity calculation procedures
The shaft resistance of piles driven in sand can often be mobilized fully at axial head
displacements smaller than 0.1D. Far larger displacements may be required to achieve full end
bearing, especially with large open-ended piles. Such displacements cannot be tolerated in most
practical applications, so compressive capacities are often defined as the maximum sum Qtotal of
the shaft Qs and base Qb capacities developed at displacements of up to 0.1D
Qtotal=Qs + Qb= πD∫τfdz + qb,0.1Ab Eq. (1)
where τf is the local ultimate shaft friction; z is pile depth; qb,0.1 is the end bearing available after
a head displacement of 0.1D and Ab is conventionally defined as the full base area. End bearing is
considered negligible under tension loading.
API Main Text method
The API ‘Main-Text’ method (API RP2GEO 2014) assumes that local shaft and base resistances
grow initially in proportion to the free field vertical effective stress by factors that increase with
grain size and relative density. The method does not recognize any relative pile tip depth
dependency of shaft resistance, but specifies upper unit shaft and base resistance limits that also
grow with grain size and relative density. API RP2GEO (2014) recognizes that the earlier guidance
(eg API 2000) is non-conservative and inappropriate for loose sands. API RP2GEO notes that
alternative ‘CPT based’ methods offer advantages and sets out versions of four such methods in
its Commentary.
Page 5 of 46
https://mc06.manuscriptcentral.com/cgj-pubs
Canadian Geotechnical Journal
Draft
The ZJU-ICL database considered in this paper includes loose sand cases. Rather than exclude
these in our method assessment, or only apply the API method to a subset of piles, we apply the
API 2000 guidance to the loose sand sites. For simplicity we refer to predictions made by this
hybrid of the 2014 and 2000 recommendations as corresponding to the ‘API Main Text’ method.
ICP-05 method
The MTD (Jardine and Chow 1996) and ICP-05 (Jardine et al. 2005) sand procedures were
developed from field research with highly instrumented ICP piles (Lehane et al. 1993 and Chow
1997) that showed how the radial effective stress acting on the displacement piles’ shaft at any
depth, z, below ground surface were controlled by the local sand state, as indicated by the local
CPT qc, the relative height of the point above the tip h (normalised by effective radius R*) and
free field vertical effective stress σ’v0 . The local radial effective stress was written in the ICP-05 as:
σ’rc = f(qc, h/R*, σ
’v0) Eq. (2)
where the equivalent radius R* = R = D/2 for closed-ended piles. Parallel tests on strain gauged
open-ended piles indicated that the same function could be applied provided the equivalent
radius was expressed as R*= (R2
outer – R2
inner)0.5
.
The procedure also incorporates the ICP field test finding that the Coulomb failure criterion
applies at the pile-soil interface and that the local ultimate shaft friction τf is given by:
τf = σ’rf tan δf Eq. (3)
where δf is the constant volume interface shearing angle obtained from large displacement ring
Page 6 of 46
https://mc06.manuscriptcentral.com/cgj-pubs
Canadian Geotechnical Journal

Draft
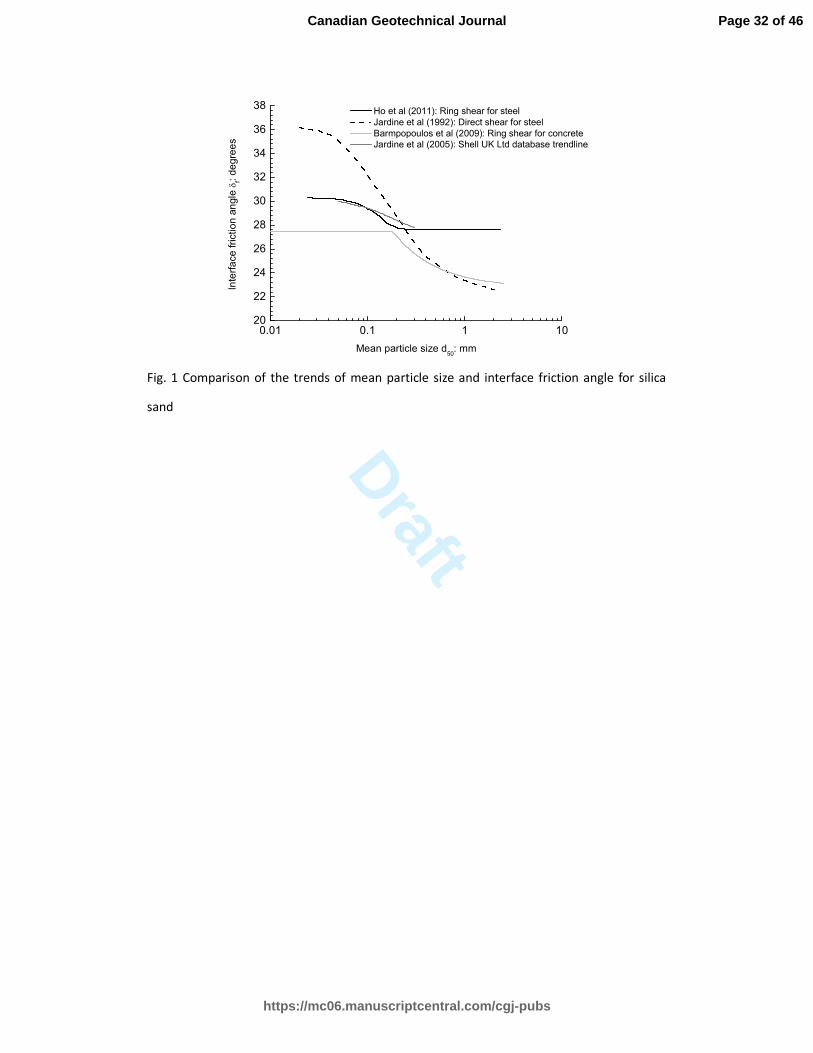
shear tests conducted; see Jardine et al. (2005). Ring shear tests involve a considerable degree of
particle breakage, which makes the outcomes both more representative and less sensitive to
grain size than small displacement direct shear tests; Ho et al. (2011). The δf data are
independent of initial relative density and their overall trends with initial mean grain size d50 run
counter to those originally specified by API (2000). Site specific ring shear laboratory tests were
recommended in the MTD and ICP-05 guidance documents, but both included indicative plots
relating δf to sand grain d50 for steel piles. The latter were updated by Ho et al. (2011) and
Barmpopolous et al. (2009) for steel and concrete shafts respectively, leading to the trends given
in Fig. 1, which we apply in the analysis reported herein.
The local radial stress at failure σ’rf is expected to differ from that resulting from installation σ
’rc
and the ICP-05 method specifies expressions that allow for both the difference between
compression and tension loading and the effect of restrained interface dilation Δσ'rd which adds
to the shaft friction by an amount that increases with sand shear stiffness (calculated from qc and
σ’v0) and pile roughness, but diminishes with increasing pile radius R. Pile end bearing is related
directly to local CPT qc through simple empirical expressions with qc derived by Chow (1997) from
field tests; these include an important dependency of unit base resistance qb on absolute pile
diameter. In variable sand profiles the calculations can depend critically on the design qc
evaluation method; see Yang et al. (2015c).
In setting out the ICP-05 approach Jardine et al. (2005) point out the markedly positive effects on
shaft capacity of time and potentially negative impacts of cyclic loading, emphasising that ICP-05
Page 7 of 46
https://mc06.manuscriptcentral.com/cgj-pubs
Canadian Geotechnical Journal
Draft
aims to predict the medium-term static capacities available around one month after driving. They
also discuss the design rules required to deal with unfavourable carbonate or mica sand cases
and set out a rational reliability based approach for selecting design safety or load and resistance
factors.
Simplified ICP-05 method
The simplified ICP method proposed in the API RP2GEO Commentary neglects the (diameter
dependent) dilatancy Δσ'rd component and rounds other parameter values conservatively, while
leaving the base capacity expressions unmodified. No quantitative analysis is offered by API
RP2GEO regarding the potential impact on capacity predictions of adopting these simplifications.
UWA-05 method
The UWA-05 approach offers an elaboration of the ICP that retains Eq. (3) and the MTD guidance
for determining δf while adding a new ‘effective area’ term to Eq. (2) for open ended piles that
depends on the incremental core filling ratio developed during driving, which has to be predicted
in design from an empirical relationship in which coring is expected to become progressively
more effective during driving with larger piles. It also removes the mild dependency on σ’v0 and
relates shaft friction to h/D rather than h/R*. The base capacity expressions employ an effective
area approach in place of the ICP’s expressions. The assumed filling ratio-to-diameter relationship
leads to the static base resistance qb of open-ended piles reducing with inner diameter Dinner.
We have applied the updated ‘ICP’ guidance for δf given in Fig. 1 in the re-evaluation of the
UWA-05 given in this paper.
Page 8 of 46
https://mc06.manuscriptcentral.com/cgj-pubs
Canadian Geotechnical Journal

Draft
Offshore UWA-05 method
The ‘offshore version’ of UWA-05 (Lehane et al. (2005a) listed in API RP2GEO’s (2014)
Commentary neglects the shaft dilatancy term and assumes a fully coring installation mode when
calculating the effective area term implicit in the shaft radial effective stress and base capacity
expressions.
Fugro-05 method
Kolk et al. (2005b) also started from the ‘MTD’ expressions in setting out the Fugro-05 method.
Their formulation, also listed in the API RP2GEO (2014) Commentary, neglects shaft dilatancy,
employs h/R to model relative pile tip depth h or ‘friction fatigue’ (with a lower bound of 4) and
employs fitting parameters calibrated against the Fugro-05 test database (see Table 1) but taking
δf to be fixed at 29o for all cases. Kolk et al. considered the MTD end bearing expressions
over-conservative and adopted an alternative qb expression that is independent of pile diameter.
The method was intended for steel offshore piles and makes no allowance for pile material.
NGI-05 method
The NGI-05 approach was derived from database trends through an empirical ‘experience based’
procedure. It offers a direct expression for the τf available at any given depth z that relies on
assessing local relative density, rather than any direct use of qc (Clausen et al. 2005). Unlike the
other three methods, it allows for the effect of relative pile tip depth h through a ‘sliding triangle’
(Toolan et al. 1990) approach in which the reduction of local shaft resistance depends only on the
Page 9 of 46
https://mc06.manuscriptcentral.com/cgj-pubs
Canadian Geotechnical Journal
Draft
relative depth z/L, where L is the final embedded shaft length. The latter ‘friction fatigue’
formulation does not depend on pile slenderness (h/D or L/D) and is independent of any absolute
dimension (h, L or D). The NGI method incorporates factors to account for pile material, end
conditions and loading sense (tension or compression).
LCPC-82 method
The ‘experience based’ Laboratoire Central des Ponts et Chausées (LCPC) CPT approach
(Bustamante and Gianeselli 1982) assumes shaft τf/qc ratios reduce with grain size and relative
density from qc/60 to qc/120 with concrete and qc/120 to qc/200 with steel driven piles. Upper τf
limits are specified that increase from 35 to 120 kPa and reduce with grain size and relative
density. Base resistance qb is assessed as 0.4 qc (dense sand) to 0.5 qc (looser sands and silt) and it
is recognised that the base rules may not apply to large or long open ended piles. The procedures
incorporate no ‘h/R’ (or friction fatigue) factor or any diameter dependence for base capacity.
HKU base method for open piles
Yu and Yang (2011) proposed a Hong Kong University (HKU) base capacity calculation method for
open piles in which the influence zone depends on the embedded conditions, sand
compressibility and qc profile variations; qb is more influenced by the soil beneath than above the
pile tip, accounting for any weak substratum. Yu and Yang employ Plug Length Ratio (PLR, the
plug-to-total length ratio at the end of driving) in their qb procedure. In common with UWA-05,
the PLR ratio and qb are assumed to reduce with Dinner.
Page 10 of 46
https://mc06.manuscriptcentral.com/cgj-pubs
Canadian Geotechnical Journal
Draft
The various assumptions made concerning the effects of scale, geometry, ‘friction fatigue’ and
pile material inevitably lead to spreads in the above eight calculation procedures’ predictions.
Statistical summary of database assessments
An important factor to consider next is the strong effect on shaft capacity of the time elapsed
between pile driving and testing. While this trend is high-lighted by Jardine et al. (2005) and its
implications in reliability based design was explored by Yang and Liang (2009), pile age is not
addressed explicitly in any of the other seven design procedures.
Effects of pile age and database filtering
Marked growth of capacity with time has been noted by multiple Authors, from Tavenas and
Audy (1972) to Gavin et al. (2015) and Rimoy et al. (2015). Most field reports concern multiple
re-tests on single piles. Base capacity is not thought to vary greatly with time and shaft capacity
growth is best isolated by considering sets of identical “fresh” piles tested in tension after
different ageing periods; Jardine et al. (2006), Gavin et al. (2013) and Karlsrud et al. (2014).
Pre-failed and re-tested piles follow completely different, staggered and discontinuous, ageing
trends. In particular, the rates of capacity growth are generally slower. Also the tendency of ‘fresh’
piles to show practically stable shaft capacities approximately one year after driving cannot be
seen clearly in programmes of re-tests. Rimoy et al. (2015) brought together data from staged
tension tests on sets of fresh, identical open steel pipe-piles (with 325mm<D<508mm) driven to
L/D ratios of 21 to 69 at the well characterised Dunkirk, Larvik and Blessington sites. They report
that Qm/Qc, the ratio of measured (Qm) capacities to those calculated (Qc) by ICP-05, is less than
Page 11 of 46
https://mc06.manuscriptcentral.com/cgj-pubs
Canadian Geotechnical Journal

Draft
unity at the End of Driving (EoD) but grows following an Intact Ageing Characteristic (IAC) before
stabilising at ≈ 2.4 within a year5. Such large changes in capacity cannot be neglected in any
representative database analysis.
Figure 2 presents on semi-logarithmic axes the ZJU-ICL total capacity dataset of tests conducted 3
to 300 days after driving, excluding here the 35 tests for which exact test ages were unknown.
Checks with the ZJU-ICL base capacity dataset confirm Rimoy et al.’s conclusion that ageing
affects shaft capacity primarily, so the tension tests are more affected by time than the total
compression Qtotal capacity; mixing tension and compression tests contributes to the scatter.
Linear regression suggests that the ICP-05 predictions match the ZJU-ICL field data at around
10-15 days, with total capacity growing by approximately 50% per log cycle of time over the 100
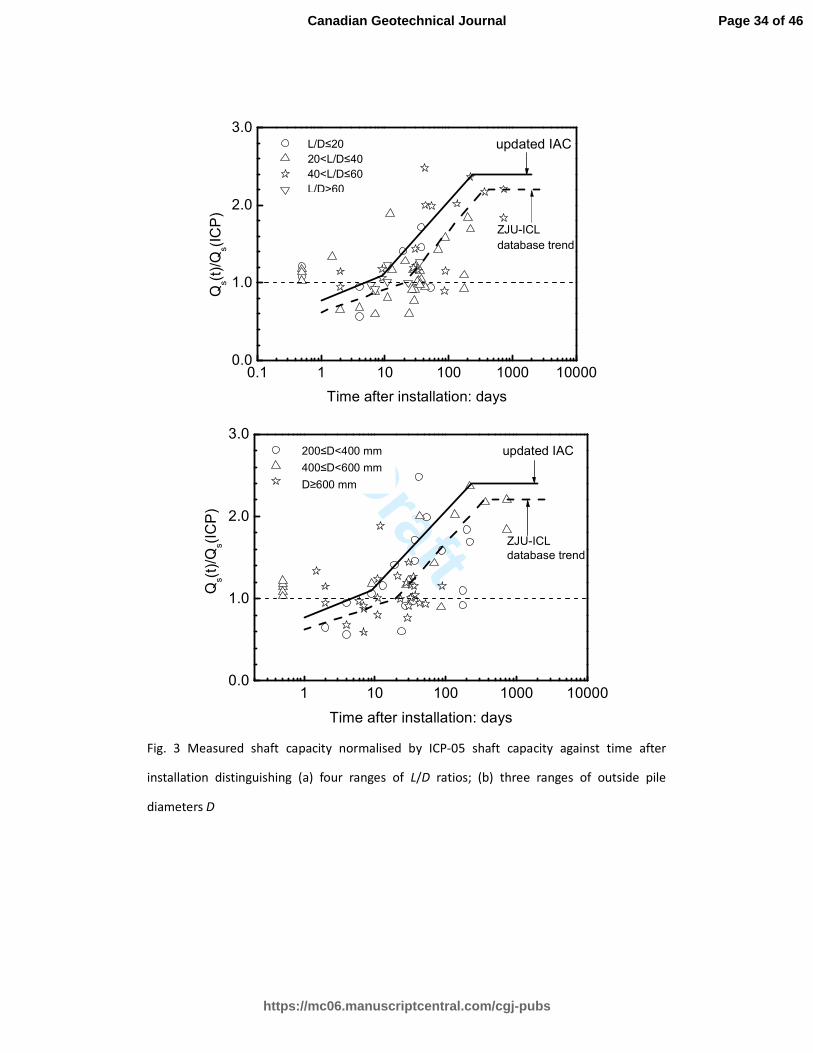
to 200 days range. We consider in Fig. 3 only the shaft capacities listed in the ZJU-ICL database,
retaining the same axes and showing the mean IAC trend from the tension tests collated by
Rimoy et al. (2015). The ZJU-ICL data are broadly compatible with Rimoy et al.’s IAC, although
they suggest slightly slower and less marked shaft capacity growth. In Fig. 3a the ZJU-ICL tests are
grouped according to their L/D ratios, while in Fig. 3b the grouping is by absolute pile diameter D.
Overall, ageing appears insensitive to slenderness (L/D). Rimoy et al. (2015) argue that ageing
may be less significant with small diameter piles; new tests are underway to test this conjecture
in the field.
Short term static testing can be undertaken to assess early age pile capacities, but dynamic
5 While Qm/Qc is the natural ratio to employ in characterising capacity growth over time, the inverse is widely
recognised as the more rational measure to employ in reliability analyses of predictive procedures.
Page 12 of 46
https://mc06.manuscriptcentral.com/cgj-pubs
Canadian Geotechnical Journal
Draft
analysis of the final driving blows is more common. Rimoy et al. (2015) treat EoD and 1-day static
capacities as being equivalent and recommend averaging of the often scattered dynamic EoD
capacities as well as applying a compression-to-tension shaft capacity correction of 0.75 to
estimate short term tension capacities for comparison with tension tests on aged piles. Applying
similar procedures to the ZJU-ICL pile tests for which such information is available and allowing
for base capacities in any cases where shaft and base EoD components were not disaggregated,
leads an average 1 day or EoD-to-ICP shaft capacity ratio of ≈ 0.8.
Systematic growth, by a factor of ≈3, of shaft capacity over the first year after driving introduces
significant bias between tests of different ages and questions which age should be implicit in any
design method. Difficult choices have to be made in approaching this issue. Pile age bias could be
reduced by normalising to a function, such as the IAC in Fig. 2, although this could be interpreted
as biasing the outcomes. Alternatively, appropriate age tolerance limits could be employed, but
at the expense of a diminished database population and reduced statistical precision. If, for
example, a 13 ±10 day age range was adopted, the effects of time could be kept within ±20%.
However, this step would reduce the number of pile tests by 75%.
The analysis that follows applied a 10 to 100 day age range to balance the desire of maintaining a
statistically significant number of tests with a wish to limit potential age effects. While other
choices could be made, this filter left 80 tests centred (logarithmically) on a nominal one month
age. However, the older piles in the database are likely to have higher shaft capacities than their
younger counterparts.
Page 13 of 46
https://mc06.manuscriptcentral.com/cgj-pubs
Canadian Geotechnical Journal

Draft
Ideally, only instrumented tests would be included in the database, so that shaft and base
capacities could be distinguished reliably in compression tests. However, only 20 such tests could
be identified. Adding 24 tension tests led to a total of 44 cases in which it shaft capacity could be
identified.
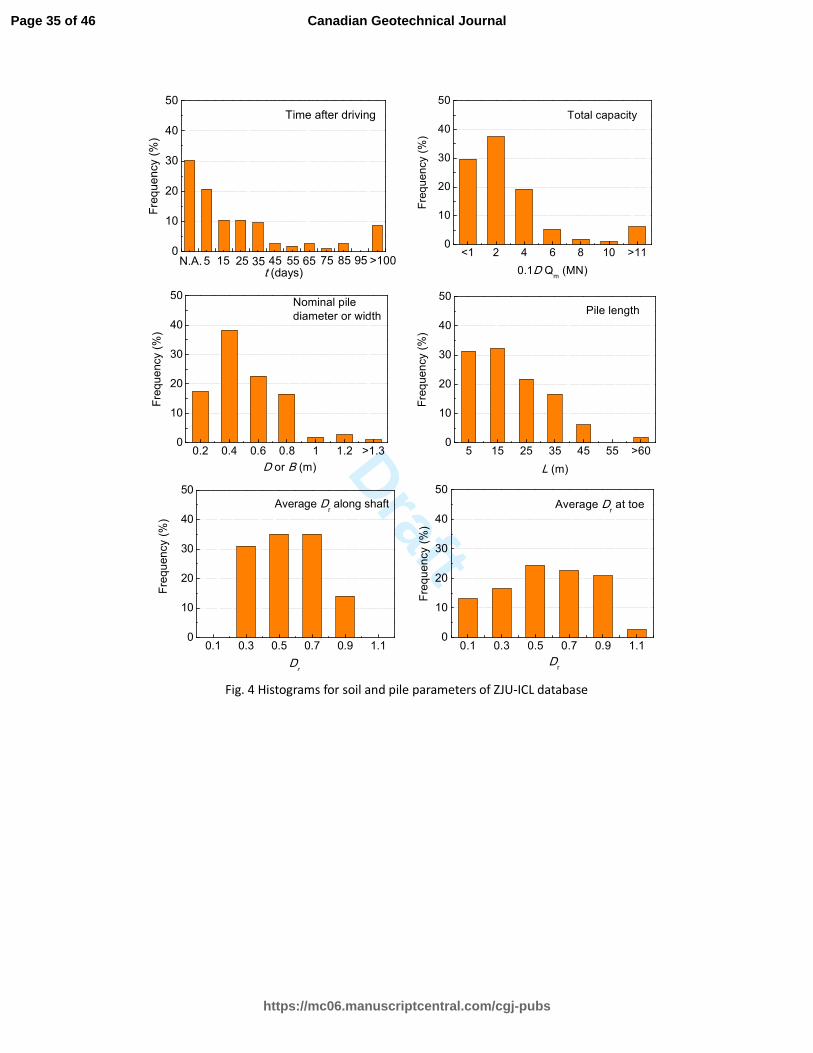
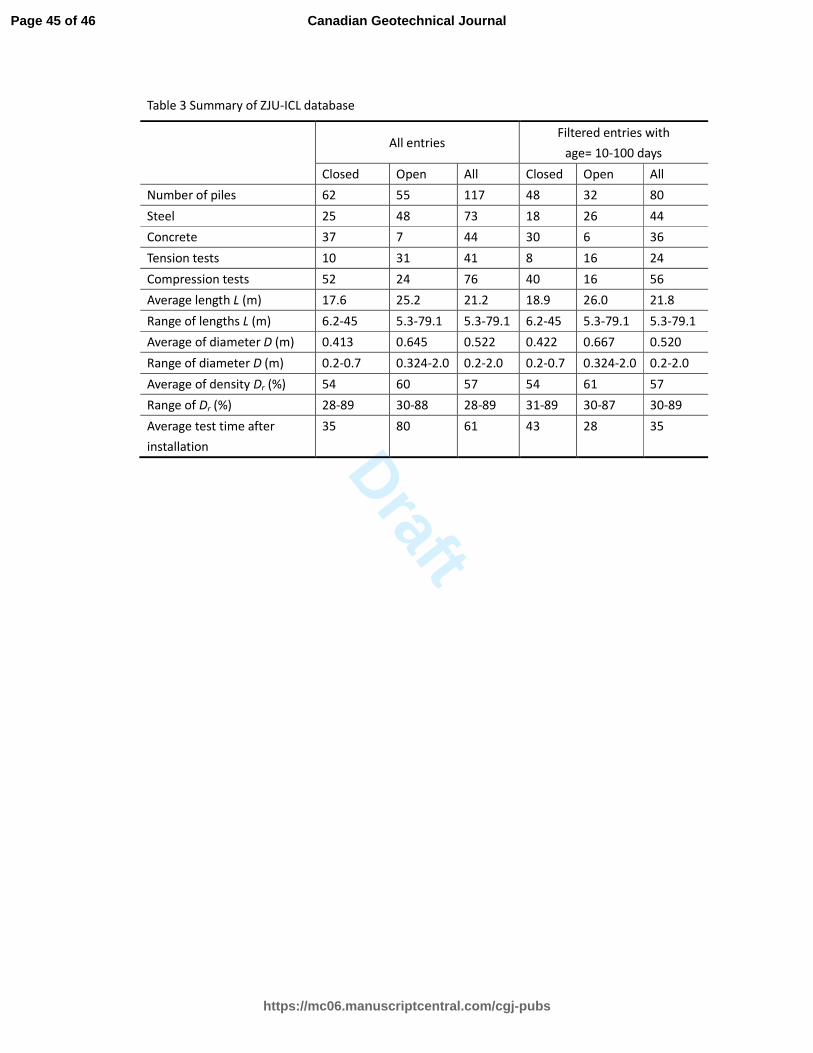
Table 3 summarises the tests (from 13 countries) while Fig. 4 presents histograms that illustrate
the distributions of: pile age, total capacity, diameter/width, length and average relative density
for each shaft and toe. Points to note include:
1. All cases that fall outside the 10-100 day age range are excluded. However, the 35 entries
whose ages are unknown are assumed to fall within the target range, which was considered
typical of practical pile test ages.
2. Most piles developed capacities below 6 MN; only 6 tests exceeded 10 MN.
3. The diameters and lengths are concentrated in the 200 to 800 mm and 5 to 45 m ranges.
4. The average relative densities classify as medium to very dense over most shafts. The toe
regions show wider variations because their averages are computed over shorter depth
intervals.
5. In total 32 tests (at 7 sites) involved sands whose average relative densities fall outside the
range over which the current API Main Text applies.
Evaluation of eight total capacity methods
Total capacity
Page 14 of 46
https://mc06.manuscriptcentral.com/cgj-pubs
Canadian Geotechnical Journal
Draft
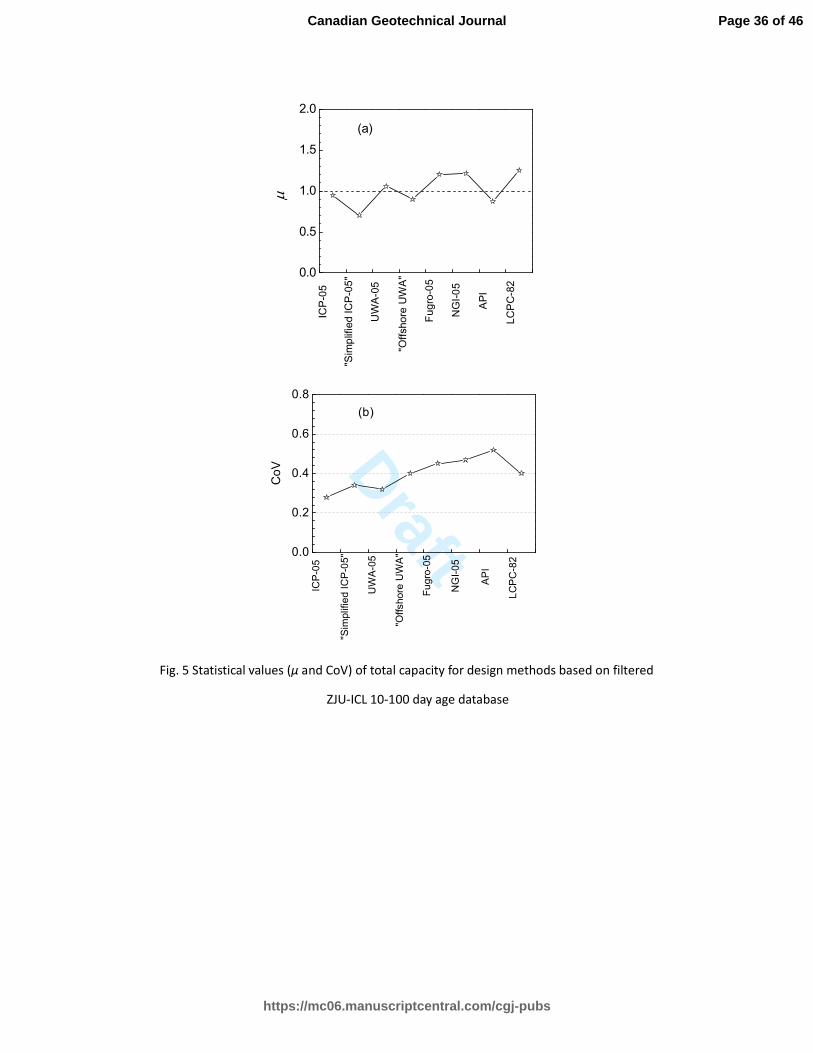
The eight methods’ predictions for the 80 ‘age-filtered’ ZJU-ICL cases are summarised in Table 4
and Fig. 5 in terms of the Qc/Qm means μ and CoVs (established assuming arithmetic rather than
log-normal distributions and shown as ± values). Table 4 also adds for reference assessments
made against the tests entered into the original ICP and UWA databases. An additional row is
provided in Table 4 that reports the results obtained from the full, unfiltered, ZJU-ICL database.
The influence of the few late tests (conducted after >100 days) exceeds that of the more
numerous early age (<10 day) tests, leading to generally lower Qc/Qm ratios. Overall, we note:
• Broad agreement with the equivalent comparisons reported by Jardine et al. (2005) and
Schneider et al. (2008).
• Overall mean Qc/Qm values spanning from 0.68 to 1.25 over all the cases covered and CoVs
from 0.30 to 0.55, with the Main Text API giving consistently higher CoVs than the CPT
approaches.
• The ‘full’ ICP and UWA methods giving significantly lower CoVs (0.30 to 0.35 respectively)
than the other CPT-based approaches (0.47 to 0.48) as well as mean overall Qc/Qm μ values
that are closer to unity (0.94 to 1.05, compared with 1.20 to 1.23).
• The LCPC-82 CPT procedures giving broadly similar outcomes to the Fugro-05 and NGI-05
methods.
• The ‘simplified ICP’ and ‘offshore’ UWA having significantly lower μ values and larger CoVs
than their ‘full’ versions. Their degrees of fit do not improve as pile diameter increases and
the ICP simplifications lead to unnecessary conservatism.
• The ‘full’ UWA version appears marginally non-conservative, suggesting that the ‘offshore’
version may be preferable for design, despite its higher CoV.
Page 15 of 46
https://mc06.manuscriptcentral.com/cgj-pubs
Canadian Geotechnical Journal

Draft
• A tendency for all methods to under-predict the shaft capacities, as measured in the 20
instrumented compression and 24 tension 10 to 100 day age tests. This is interpreted as
being due primarily to the shaft ageing trends discussed above. All eight shaft methods
appear to predict capacities at earlier mean ages after driving.
Open-ended shaft and base capacity
One of the key differences between the design methods is how they allow for open-ended
conditions. The time-filtered ZJU-ICL dataset was used to check for Qc/Qm scatter and bias related
to end condition, giving the results presented in Table 4. In only total 21 (tension and
compression) shaft cases could be considered and compared with the overall trends. Adding two
additional tests (TP4 and TP5 from Kikuchi et al. 2007, whose main shaft sections penetrated
through clays) increases the limited base capacity dataset to 13 cases. Considering the shaft first,
no method led to a mean Qc/Qm significantly greater than unity for open pile shafts and the CoVs
were also lower than for total capacity in most cases. Moving to open-ended base resistance, the
methods that apply CPT qc data directly give lower CoVs than those that do not (i.e. NGI-05 and
API). It also appears that all approaches except the ICP and HKU methods have non-conservative
bias, especially those that do not incorporate diameter dependency: Fugro-05, NGI-05, API and
LCPC-82. However, the dataset is small and the statistical outcomes could be sensitive to minor
changes in the number of entries.
Loading sense
While the API and LCPC methods assume that similar shaft capacities are developed under
Page 16 of 46
https://mc06.manuscriptcentral.com/cgj-pubs
Canadian Geotechnical Journal
Draft
compression and tension loading, the other ‘CPT methods’ adopt discounted parameters or
factors when calculating tension capacity. Jardine et al. (2005) argued that lower shaft capacities
develop in tension because: (i) the Poisson's straining under axial load leads to the pile
contracting radially and unloading the soil mass, rather than bulging outward and imposing
additional radial and vertical stresses and (ii) the major principal stress axis direction imposed by
tension loading is rotated away from that applying at the EoD. The age filtered ZJU-ICL database
was employed to examine the possible statistical biases applying to loading sense effect,
considering 20 compression piles in which shaft capacity could be identified and 24 tension piles.
In addition to revealing a generally conservative bias, which is probably due to pile age as
explained earlier, Table 4 appears to indicate a tendency for all eight design methods to over
compensate for the difference between tension and compression loading. The ICP (simplified and
full) shows the smallest offsets related to loading sense (0.06 and 0.1 respectively), while the
UWA and ICP approaches both lead to marginally conservative means and lower CoVs in tension
than compression. The LCPC method appears significantly non-conservative in tension, with the
largest μ offset, while the API leads to the highest CoV in tension. The other methods give
intermediate trends.
A further point to note is that the higher CoVs seen for compressive shaft capacities. As noted
earlier, the latter can only be determined from the relatively few instrumented pile tests included
in the database. In addition, difficulties in interpreting strain gauge measurements and allowing
for base stresses locked in by driving reduce the reliability of compression shaft capacity
determination and add to its scatter.
Page 17 of 46
https://mc06.manuscriptcentral.com/cgj-pubs
Canadian Geotechnical Journal
Draft
Pile material
A second key difference, which is particularly important in mainstream civil engineering
applications, is the way the methods consider pile material. Only NGI-05 and LCPC-82 stipulate
different parameters for steel and concrete piles. The ICP-05 procedure recommends determining
δf from ring-shear tests conducted with the appropriate interface material. We apply here the
revised guidance given in Fig. 1 that indicate lower δf values applying against concrete shafts,
even when they have similar roughnesses (RCLA ≈ 10μm) to industrial steel piles.
Grouping the various methods’ predictions according to material type leads to the outcomes
given in Table 4 for shaft (tension and compression) capacity. In general, the API and LCPC
methods show the largest and most non-conservative offsets between the mean Qc/Qm values
applying to concrete and steel piles. All except Fugro-05 indicate lower CoVs for steel piles and
the full ICP-05 and UWA-05 approaches appear the least sensitive to pile material type. The
allowance made for concrete piles in LCPC-82 appears to be non-conservative. However, the
relatively low number (N = 10) of concrete pile tests limits the confidence with which conclusions
can be drawn without further high quality field tests.
Pile dimensions
Slenderness ratio
Jardine and Chow (1996) and Schneider et al. (2008) showed that incorporating the ‘h/R*’ and
h/D factors identified from highly instrumented pile tests into their shaft capacity expressions
Page 18 of 46
https://mc06.manuscriptcentral.com/cgj-pubs
Canadian Geotechnical Journal
Draft
allowed the ICP-05 and UWA-05 CPT based methods to eliminate the Main Text API method’s
strong skewing with respect to both sand relative density and pile slenderness L/D. The ZJU-ICL
database shows similar trends, as demonstrated for L/D by the Qc/Qm scatter plots given by each
total capacity method in Fig. 6 and for shaft capacity alone (separating compression and tension
cases) in Fig. 7. The regression line established through the scattered API data points indicates
the most marked skewing with respect to L/D, confirming that the method’s lack of any h/R or
friction fatigue factor leads to over-conservative bias at low L/D, while the full ICP-05 and
UWA-05 methods indicate the least. The plots also underscore the Simplified ICP-05 and Offshore
UWA-05 shaft methods’ tendency to be systematically over-conservative.
Diameter dependence
Designing piles whose diameters fall outside the test dataset (Fig. 2 and Table 3) involves
assuming that the calculation method can extrapolate the field tests reliably. However, as
summarised earlier, the available methods incorporate a wide range of assumptions regarding
the dimensional dependence of base and shaft components.
We consider base resistance first, noting that (i) there are no reliable tests on closed-end large
diameter piles and (ii) the HKU method is only applicable to open-ended piles. Open (N=20) and
closed (N=13) base capacities are distinguished in Fig. 8, which reports how the alternative
methods’ overall Qc/Qm trends vary with diameter D. Although limited to 33 tests, it is clear that
the diameter-dependency built into ICP-05, UWA-05 and HKU leads to less scatter and skew than
the diameter-independent Fugro, NGI, API or LCPC expressions, which become less conservative
Page 19 of 46
https://mc06.manuscriptcentral.com/cgj-pubs
Canadian Geotechnical Journal
Draft
with increasing D, although ICP-05 may be slightly conservative with large piles. Linear regression
fitting indicates that an ascending order of bias applies to the Fugro, NGI, API and LCPC methods.
We move next to consider the potential biases of shaft capacity with D. As noted by Knudsen et al.
(2012), the ICP, UWA and Fugro methods all employ ‘friction fatigue’ relationships that are
normalised to depend on h/R* or h/D, while NGI-05 is independent of pile dimensions (or L/D)
and the API and LCPC-82 neglect ‘friction fatigue’ altogether. Although countered by the full ICP’s
and UWA’s shaft dilation components being inversely dependent on diameter, shaft capacity
calculations tend to show, for piles of fixed length, average shaft resistance qs growing with
diameter for ICP-05, UWA-05 and Fugro-05. Only data from the 44 instrumented compression
and tension tests can be included in the scatter diagrams presented in Fig. 9, which suffer from
the uncertainties mentioned earlier related to ageing, strain-gauge interpretation and locked-in
base loads. While LCPC-82 appears to suffer from a significant degree of (conservative) bias with
respect to D, the dataset appears to be too scattered to draw further conclusions.
Length dependence
In addition to the effects of pile slenderness (L/D) discussed above, API and LCPC-82 include
absolute upper limits to τf, while the ICP, UWA and Fugro approaches incorporate lower limits to
the h/R or h/R* ratios that should be substituted into their shaft capacity calculations. A further
consideration is the fundamental cause of the decay of radial shaft stresses with relative pile tip
depth, h. If this was related principally to geometrical effects it would scale with diameter D or R*,
while if it was dominated by shaft load cycling during driving it might scale with the number of
Page 20 of 46
https://mc06.manuscriptcentral.com/cgj-pubs
Canadian Geotechnical Journal

Draft
pile blows, and so generally increase with the absolute values of h or L. All of these factors could
lead to different trends for Qc/Qm with L. Recent instrumented model pile tests suggest that,
above a limited number of cycles, geometrical effects dominate (Jardine et al. 2013). However, as
with pile diameter, it is important to check for any bias when considering which of the methods is
safer to apply when designing piles with lengths that fall outside the ZJU-ICL database.
Figure 10 presents the eight methods’ scatter diagrams for shaft Qc/Qm against absolute pile
length. As in Fig. 9, the ICP-05 and NGI-05 approaches appear to lead to the least bias, despite
their different ‘friction-fatigue’ formulations.
Wall thickness ratio effect
Open-ended pipe piles are driven with a range of pile diameter to wall thickness ratios, D/t.
Ratios between 15 and 45 are typical in offshore oil and gas (Jardine and Chow 2007), but
offshore wind turbines often adopt far higher ratios and civil engineering concrete pipe piles can
have D/t <5; Yang et al. (2015c). Allowance is made for open or closed ends in all the methods
except the LCPC-82 approach, but only ICP-05 and UWA-05 incorporate an influence of D/t on
shaft capacity, through the former’s h/R* normalisation and the latter’s ‘effective base area’
terms.
The full set of 21 open-ended (tension or instrumented compression) ZJU-ICL pile tests from
which shaft capacity can be determined are shown in Fig. 11, plotting Qc/Qm against D/t for all
eight methods. While the degree of scatter is large for the Fugro-05 and LCPC-82 cases, their
Page 21 of 46
https://mc06.manuscriptcentral.com/cgj-pubs
Canadian Geotechnical Journal
Draft
regression lines suggest upward (non-conservative at high D/t) bias. This trend is clearer for the
API method, while the ICP, UWA and NGI trend lines are principally flat.
Parameter section and reliability in service
In setting out the ICP-05 procedures Jardine et al. (2005) employed reliability-based arguments to
comment on the safety or load and resistance factors required to meet target probabilities that
foundations could carry the intended loads safely under stated conditions. To be meaningful,
such calculations should address total uncertainty through the biases and CoVs applying to loads
and capacities. Jardine et al. (2005) suggested that the statistics found with routine offshore
design methods for piles driven in sand were incompatible with the desired reliability levels when
combined with currently recommended safety or load and resistance factors. While reliability can
be improved by adopting lower CoV CPT based methods, more stringent factors than are
currently employed in routine offshore practice appear necessary to achieve suitably low failure
probabilities.
In principle, the design factors should be varied to match the reliability of the design and site
investigation methods applied, as well as the loading uncertainty – which varies between
applications. Designers should also account for pile age (Jardine et al. 2005; Yang and Liang 2009;
Rimoy et al. 2015) spatial variability, the greater uncertainty associated with base resistance than
shaft and the relatively large displacements required to mobilise tip loads. Noting that spatial
variability in CPT parameters makes it is harder to establish statistically reliable predictions for
Page 22 of 46
https://mc06.manuscriptcentral.com/cgj-pubs
Canadian Geotechnical Journal

Draft
base Qb values than to predict the integrated effects of varying qc profiles on shaft QS, Jardine et
al. (2015) recommend applying credible lower bound base qc design parameters while continuing
to adopt cautiously interpreted mean qc trends for pile shaft resistance. Base capacity may
provide an additional reserve under compressive loading, but only at the expense of large
settlements developing.
Onshore design codes typically require more conservative safety, load and resistance factors than
are employed offshore. In addition, pile load tests are often carried out to check performance
and reduce the likelihood of problems in service. Jardine and Chow (2007) discuss the low
incidence of reported offshore field failures, noting that the trend towards higher-than-average
relative densities in marine sands and the strong shaft ageing trends identified in Fig. 2 had the
potential to overcome other non-conservative aspects of conventional approaches. Recent
research (see for example Rimoy et al. 2015) has strengthened the case regarding pile ageing.
Recent field re-strike tests have added confirmation that large offshore piles gain capacity
markedly with time after driving in sand; see for example Jardine et al. (2015). However, Jardine
et al. (2012) and Andersen et al. (2013) also argue that designers should move to address more
routinely the potentially negative effects of load cycling on axial capacity. While low level load
cycling can be mildly beneficial (Jardine and Standing 2012; Tsuha et al. 2012) high level cycling
can cause marked and rapid shaft capacity losses.
Conclusions
The following main conclusions are drawn:
Page 23 of 46
https://mc06.manuscriptcentral.com/cgj-pubs
Canadian Geotechnical Journal

Draft
1. The accurate prediction of axial capacity remains challenging for piles driven in sands.
2. Rigorous database studies are key to assessing the potential efficacy of design methods.
Analysis of the Zhejiang University/Imperial College London (ZJU-ICL) expanded test
database has provided a more comprehensive assessment of the potential predictive
biases and scatters of nine design procedures than was possible previously.
3. The analysis presented herein highlights the critical importance of addressing: (i) pile age
after driving, (ii) open and closed conditions, (iii) open piles’ D/t ratios, (iv) different
tension and compression loading responses and (v) concrete versus steel pile
construction.
4. The database analysis identify the hierarchies of reliability parameters associated with
each approach. The ‘full’ ICP approach and UWA methods have significant advantages in
helping to eliminate potential bias and scatter. Noting that compressive shaft capacity
measurements are subject to more scatter than tension equivalents, the UWA and ICP
methods show better fitting trends for both (i) shaft-to-base capacity splits and (ii) the
relative magnitudes of tension and compression shaft resistances.
5. The ‘simplified’ ICP approach offers no practical advantage over the ‘full’ ICP and leads to
unnecessarily conservative predictions at the pile scales covered by the database.
6. Base capacity measurements and predictions are inherently more difficult and less
reliable than those for shaft resistance. It is recommended that credible lower bound qc
parameters should be applied for end bearing assessment in varying ground profiles.
7. Cyclic loading effects should also be addressed carefully.
8. Design Load and Resistance or Safety Factors should be varied to match the reliability of
Page 24 of 46
https://mc06.manuscriptcentral.com/cgj-pubs
Canadian Geotechnical Journal
Draft
the design and site investigation methods applied, as well as the loading uncertainty.
Acknowledgments
The research described was funded by the National Key R & D program of China (No.
2016YFC0800204), the Natural Science Foundation of China (Grant Nos. 51178421 and 51322809)
and the Chinese Ministry of Education Distinguished Overseas Professorship Programme. Their
financial support is gratefully acknowledged.
References
Abu-Hejleh, N.M., Abu-Farsakh, M., Suleiman, M.T., and Tsai, C. 2015. Use and development of
deep foundation load test databases, 94th
Transportation Research Board Annual Meeting,
in press.
American Petroleum Institute (API). 2000. Recommended practice for planning, designing, and
constructing fixed offshore platforms-Working stress design, API RP2A, 21st Ed., Washington,
DC.
American Petroleum Institute (API). 2014. ANSI/API recommended practice 2GEO, 1st Ed.,
RP2GEO, Washington, DC.
Andersen, K.A., Puech, A.A., and Jardine, R.J. 2013. Cyclic resistant geotechnical design and
parameter selection for offshore engineering and other applications, Paris, TC-209
Workshop, ‘Design for cyclic loading: piles and other foundations’, Publisher: Presses des
Ponts, 9-44
Barmpopoulos, I.H., Ho, T.Y.K., Jardine, R.J., and Anh-Minh, N. 2009. The large displacement shear
Page 25 of 46
https://mc06.manuscriptcentral.com/cgj-pubs
Canadian Geotechnical Journal

Draft
characteristics of granular media against concrete and steel interfaces. Proc. Research
Symposium on the Characterization and Behaviour of Interfaces (CBI). Atlanta, Frost, J.D.
Editor, IOS Press, Amsterdam, 17-24.
Burlon, S., Frank, R., Baguelin, F., Habert, J., and Legrand, S. 2014. Model factor for the bearing
capacity of piles from pressuremeter test results-Eurocode 7 approach. Géotechnique, 64(7),
513-525.
Bustamante, M., and Gianeselli, L. 1982. Pile bearing capacity by means of static penetrometer
CPT. 2nd
Eur. Symp. On Penetration Testing, Amsterdam, 493-500.
Chow, F.C. 1997. Investigations into displacement pile behaviour for offshore foundations. PhD
thesis, Imperial College, London, UK.
Chow, F.C., and Jardine, R.J. 1997. Applying the new Imperial College piles design methods to
large open-ended piles in clay and sand. Proc. 8th
Int. Conf. on the Behaviour of Offshore
Structures (BOSS), Delft, Pergamon Press (UK), 109-124.
Clausen, C.J.F., Aas, P.M., and Karlsrud, K. 2005. Bearing capacity of driven piles in sand, the NGI
approach. Proc., Int. Symp. On Frontiers in Offshore Geotechnics, Taylor & Francis, London,
677-681.
Gavin, K.G., Igoe, D.J.P., and Kirwan, L. 2013. The effect of ageing on the axial capacity of piles in
sand. Proceedings of the ICE-Geotechnical Engineering, 166(2), 122-130.
Ho, T.Y.K., Jardine R.J., and Anh-Minh, N. 2011. Large-displacement interface shear between steel
and granular media. Géotechnique, 61(3), 221-234.
Jardine, R.J., and Chow, F.C. 1996. New design methods for offshore piles. Marine Technology
Directorate (MTD) Publication 96/103. London: MTD.
Page 26 of 46
https://mc06.manuscriptcentral.com/cgj-pubs
Canadian Geotechnical Journal
Draft
Jardine, R.J., and Chow, F.C. 2007. Some developments in the design of offshore piles. Proc. 6th
Int. Conf. on Offshore Site Investigations and Geotechnics, Society for Underwater
Technology, London.
Jardine, R.J., Puech, A., and Andersen, K.H. 2012. Cyclic loading of offshore piles: potential effects
and practical design. Proceedings of the 7th
International Conference on Offshore Site
Investigation and Geotechnics: Integrated Geotechnologies – Present and Future, 59-97.
Jardine, R.J., Chow, F.C., Overy, R., and Standing, J.R. 2005. ICP design methods for driven piles in
sands and clays, Thomas Telford, London.
Jardine, R.J., Standing, J.R. 2012. Field axial cyclic loading experiments on piles driven sand. Soils
and Foundations, 52(4), 723–736.
Jardine, R.J., Standing, J.R., and Chow, F.C. 2006. Some observations of the effects of time on the
capacity of piles driven in sand. Géotechnique, 56(4), 227-244.
Jardine, R.J., Thomsen, N.V., Mygindt, M., Liingaard, M.A., and Thilsted, C.L. 2015. Axial capacity
design practice for North European wind-turbine projects. Proc. Int. Symp. On Frontiers in
Offshore Geotechnics III (ISFOG), Taylor & Francis Group, London, V. Meyer (Ed.), 581-586.
Karlsrud K., Jensen T. G., Wensaas Lied E. K., Nowacki F. and Simonsen A.S. 2014. Significant
ageing effects for axially loaded piles in sand and clay verified by new field load tests.
Offshore Technology Conference, Houston, doi:10.4043/25197-MS.
Kikuchi, Y., Mizutani, T., and Yamashita, H. 2007. Vertical bearing capacity of large diameter steel
pipe piles. Proc., Int. Workshop on Recent Advances of Deep Foundations, Taylor & Francis,
London, 711–716.
Knudsen, S., Langford, T., Lacasse, S., and Aas, P.M. 2012. Axial capacity of offshore piles driven in
Page 27 of 46
https://mc06.manuscriptcentral.com/cgj-pubs
Canadian Geotechnical Journal
Draft
sand using four CPT-based methods. In Offshore Site Investigation and Geotechnics:
Integrated Technologies-Present and Future. Society of Underwater Technology, 449-457.
Kolk, H.J., Baaijens, A.E., and Sender, M. 2005a. Design criteria for pipe piles in silica sands. Proc.,
Int. Symp. on Frontiers in Offshore Geotechnics, Taylor & Francis, London, 711-716.
Kolk, H.J., Baaijens, A.E., and Vergobi, P. 2005b. Results of axial load tests on pipe piles in very
dense sands: The EURIPIDES JIP. Proc. Int. Symp. on Frontiers in Offshore Geomechanics,
ISFOG, Taylor & Francis, London, 661-667.
Lehane, B.M. 1992. Experimental investigations of pile behaviour using instrumented field piles.
PhD thesis, Imperial College, London, UK.
Lehane, B.M., Jardine, R.J., Bond, A.J. and Frank, R. 1993. Mechanisms of shaft friction in sand
from instrumented pile tests. J. Geotech. Engng. Div., ASCE, 119(1), 19-35.
Lehane, B.M., and Jardine, R.J. 1994. Shaft capacity of driven piles in sand: a new design
approach. Proc. Conf. on the Behaviour of Offshore Structures (BOSS), 23-36.
Lehane, B.M., Schneider, J.A., and Xu, X. 2005a. A review of design methods for offshore driven
piles in siliceous sand. UWA Rep. No. GEO 05358, The Univ. of Western Australia, Perth,
Australia.
Lehane, B.M., Schneider, J.A., and Xu, X. 2005b. The UWA-05 method for prediction of axial
capacity of driven piles in sand. Proc. Int. Symp. On Frontiers in Offshore Geomechanics ISFOG,
Taylor & Francis, London, 683-689.
Mayne, P.W. 2013. Private communication, FHWA Deep Foundation Load Test Database (DFLTD).
Rimoy, S., Silva, M., Jardine, R.J., Yang, Z.X., Zhu, B. T., and Tsuha, C.H.C. 2015. Field and model
investigations into the influence of age on axial capacity of displacement piles in silica sands.
Page 28 of 46
https://mc06.manuscriptcentral.com/cgj-pubs
Canadian Geotechnical Journal
Draft
Géotechnique, 65(7), 576-589.
Rücker, W., Karabeliov, K., Cuéllar, P., Baeßler, M., and Georgi, S. 2013. Großversuche an
Rammpfählen zur Ermittlung der Tragfähigkeit unter zyklischer Belastung und Standzeit.
Geotechnik, 36(2), 77-89.
Schneider, J.A., Xu, X., and Lehane, B.M. 2008. Database assessment of CPT-based design
methods for axial capacity of driven piles in siliceous sands. Journal of Geotechnical and
Geoenvironmental Engineering, 134(9), 1227-1244.
Tavenas, F. and Audy, R. 1972. Limitations of the driving formulas for predicting the bearing
capacities of piles in sand. Canadian Geotechnical Journal, 9(1), 47–62.
Tsuha, C.H.C., Foray, P.Y., Jardine, R.J., Yang, Z.X., Silva, M., and Rimoy, S. 2012. Behaviour of
displacement piles in sand under cyclic axial loading. Soils and Foundations, 52(3), 393-410.
Toolan, F.E., Lings, M.L. and Mirza, U.A. 1990. An appraisal of API RP2A recommendations for
determining skin friction of piles in sand. Houston, Texas: Proceedings of the 22nd
Annual
Offshore Technology Conference, 33-42.
Yang, L., and Liang, R. 2009. Incorporating setup into load and resistance factor design of driven
piles in sand. Canadian Geotechnical Journal, 46(3), 296-305.
Yang, Z.X., Jardine, R.J., Guo, W.B., Chow, F. 2015a. A new and openly accessible database of tests
on piles driven in sands, Géotechnique Letters, 5 (January–March), 12-20.
Yang, Z.X., Jardine, R.J., Guo, W.B., Chow, F. 2015b. A comprehensive database of tests on axially
loaded piles driven in sands, Zhejiang University Press – Elsevier.
Yang, Z.X., Guo, W.B, Zha, F.S, Jardine, R.J., Xu, C.J., Cai, Y.Q. 2015c. Field behaviour of driven
Pre-stressed High-strength Concrete piles in sandy soils, Journal of Geotechnical and
Page 29 of 46
https://mc06.manuscriptcentral.com/cgj-pubs
Canadian Geotechnical Journal

Draft
Geoenvironmental Engineering, ASCE, 141(6), 04015020.
Yu, F., and Yang, J. 2011. Base capacity of open-ended steel pipe piles in sand. Journal of
Geotechnical and Geoenvironmental Engineering, 138(9), 1116-1128.
Page 30 of 46
https://mc06.manuscriptcentral.com/cgj-pubs
Canadian Geotechnical Journal

Draft
Figure Captions
Fig. 1 Comparison of the trends of mean particle size and interface friction angle for silica
sand.
Fig. 2 Ratio of Qm/Qc measured total capacity to calculated capacity from ICP-05 against test
pile age after driving.
Fig. 3 Measured shaft capacity normalised by ICP-05 shaft capacity against time after
installation distinguishing (a) four ranges of L/D ratios; (b) three ranges of outside pile
diameters D.
Fig. 4 Histograms for soil and pile parameters of ZJU-ICL database.
Fig. 5 Statistical values (μ and CoV) of total capacity for design methods based on filtered
ZJU-ICL 10-100 day age database.
Fig. 6 Distribution of Qc/Qm (for total capacity) with respect to pile slenderness ratio L/D
ICP-05; (b) “Simplified” ICP-05; (c) UWA-05; (d) “Offshore” UWA-05; (e) Fugro-05; (f) NGI-05;
(g) API Main Text; (h) LCPC-82 – tested against filtered ZJU-ICL 10 to 100 day age dataset.
Linear regression dashed lines are shown on the plots.
Fig. 7 Distribution of Qc/Qm (shaft capacity) with respect to pile slenderness ratio L/D (a)
ICP-05; (b) “Simplified” ICP-05; (c) UWA-05; (d) “Offshore” UWA-05; (e) Fugro-05; (f) NGI-05;
(g) API Main Text; (h) LCPC-82 – tested against filtered ZJU-ICL 10 to 100 day age dataset for
both compression and tension piles. Linear regression dashed lines are shown on the plots.
Fig. 8 Distribution of Qc/Qm (base capacity) with respect to pile diameter for both open and
closed piles. Linear regression dashed lines are shown on the plots.
Fig. 9 Distribution of Qc/Qm (shaft capacity) by ICP-05 with respect to pile diameter D ICP-05;
(b) “Simplified” ICP-05; (c) UWA-05; (d) “Offshore” UWA-05; (e) Fugro-05; (f) NGI-05; (g) API
Main Text; (h) LCPC-82 – tested against filtered ZJU-ICL 10 to 100 day age dataset. Linear
regression dashed lines are shown on the plots.
Fig. 10 Distribution of Qc/Qm (shaft capacity) by ICP-05 with respect to pile length L (a) ICP-05;
(b) “Simplified” ICP-05; (c) UWA-05; (d) “Offshore” UWA-05; (e) Fugro-05; (f) NGI-05; (g) API
Main Text; (h) LCPC-82 – tested against filtered ZJU-ICL 10 to 100 day age dataset. Linear
regression dashed lines are shown on the plots.
Fig. 11 Distribution of Qc/Qm (shaft capacity) with respect to pile diameter to wall thickness
ratio D/t (a) ICP-05; (b) “Simplified” ICP-05; (c) UWA-05; (d) “Offshore” UWA-05; (e) Fugro-05;
(f) NGI-05; (g) API Main Text; (h) LCPC-82 – tested against filtered ZJU-ICL 10 to 100 day age
dataset. Linear regression dashed lines are shown on the plots.
Page 31 of 46
https://mc06.manuscriptcentral.com/cgj-pubs
Canadian Geotechnical Journal
Draft0.01 0.1 1 10
20
22
24
26
28
30
32
34
36
38 Ho et al (2011): Ring shear for steel
Jardine et al (1992): Direct shear for steel
Barmpopoulos et al (2009): Ring shear for concrete
Jardine et al (2005): Shell UK Ltd database trendline
Inte
rfa
ce frictio
n a
ngle
δf:
de
gre
es
Mean particle size d50
: mm
Fig. 1 Comparison of the trends of mean particle size and interface friction angle for silica
sand
Page 32 of 46
https://mc06.manuscriptcentral.com/cgj-pubs
Canadian Geotechnical Journal

Draft
1 10 100 10000.0
0.5
1.0
1.5
2.0
2.5
Qm/Q
c
Time after installation: days
Linear regression line
age=3-300 days
Fig. 2 Ratio of Qm/Qc measured total capacity to calculated capacity from ICP-05 against test
pile age after driving
Page 33 of 46
https://mc06.manuscriptcentral.com/cgj-pubs
Canadian Geotechnical Journal
Draft
0.1 1 10 100 1000 100000.0
1.0
2.0
3.0
Qs(t
)/Q
s(I
CP
)
Time after installation: days
updated IAC
ZJU-ICL
database trend
1 10 100 1000 100000.0
1.0
2.0
3.0 D=200-400
D=400-600
D>600
Qs(t
)/Q
s(I
CP
)
Time after installation: days
updated IAC
ZJU-ICL
database trend
Fig. 3 Measured shaft capacity normalised by ICP-05 shaft capacity against time after
installation distinguishing (a) four ranges of L/D ratios; (b) three ranges of outside pile
diameters D
L/D≤20
20<L/D≤40
40<L/D≤60
L/D>60
200≤D<400 mm
400≤D<600 mm
D≥600 mm
Page 34 of 46
https://mc06.manuscriptcentral.com/cgj-pubs
Canadian Geotechnical Journal
Draft
0
10
20
30
40
50
352515
Fre
qu
en
cy (
%)
t (days)
Time after driving
N.A.5 75655545 >1009585
<1 2 4 6 8 10 >110
10
20
30
40
50
Fre
qu
en
cy (
%)
0.1D Qm (MN)
Total capacity
0.2 0.4 0.6 0.8 1 1.2 >1.30
10
20
30
40
50
Fre
qu
ency (
%)
D or B (m)
Nominal pile
diameter or width
5 15 25 35 45 55 >600
10
20
30
40
50
Fre
qu
en
cy (
%)
L (m)
Pile length
0.1 0.3 0.5 0.7 0.9 1.10
10
20
30
40
50
Fre
qu
en
cy (
%)
Dr
Average Dr along shaft
0.1 0.3 0.5 0.7 0.9 1.10
10
20
30
40
50
Fre
qu
en
cy (
%)
Dr
Average Dr at toe
Fig. 4 Histograms for soil and pile parameters of ZJU-ICL database
Page 35 of 46
https://mc06.manuscriptcentral.com/cgj-pubs
Canadian Geotechnical Journal
Draft
0.0
0.5
1.0
1.5
2.0
LCPC
-82
NG
I-05
API
"Sim
plifi
ed IC
P-05
"
"Offs
hore
UW
A"
µ
Fugr
o-05
ICP-
05
UW
A-05
(a)
0.0
0.2
0.4
0.6
0.8
LCPC
-82
API
"Sim
plifi
ed IC
P-05
"
"Offs
hore
UW
A"
Co
V
Fugr
o-05
ICP-
05
UW
A-05
NG
I-05
(b)
Fig. 5 Statistical values (μ and CoV) of total capacity for design methods based on filtered
ZJU-ICL 10-100 day age database
Page 36 of 46
https://mc06.manuscriptcentral.com/cgj-pubs
Canadian Geotechnical Journal

Draft
0 30 60 90 120 1500.0
0.5
1.0
1.5
2.0
2.5
3.0
3.5
Qc/Q
m
L/D
(a) ICP-05
0 30 60 90 120 1500.0
0.5
1.0
1.5
2.0
2.5
3.0
3.5
Qc/Q
m
L/D
(b) Simplified ICP-05
0 30 60 90 120 1500.0
0.5
1.0
1.5
2.0
2.5
3.0
3.5
Qc/Q
m
L/D
(c) UWA-05
0 30 60 90 120 1500.0
0.5
1.0
1.5
2.0
2.5
3.0
3.5
Qc/Q
m
L/D
(d) Offshore UWA-05
0 30 60 90 120 1500.0
0.5
1.0
1.5
2.0
2.5
3.0
3.5
Qc/Q
m
L/D
(e) Fugro-05
0 30 60 90 120 1500.0
0.5
1.0
1.5
2.0
2.5
3.0
3.5
Qc/Q
m
L/D
(f) NGI-05
0 30 60 90 120 1500.0
0.5
1.0
1.5
2.0
2.5
3.0
3.5
Qc/Q
m
L/D
(g) API Main Text
0 30 60 90 120 1500.0
0.5
1.0
1.5
2.0
2.5
3.0
3.5
Qc/Q
m
L/D
(h) LCPC-82
Fig. 6 Distribution of Qc/Qm (for total capacity) with respect to pile slenderness ratio L/D
(a) ICP-05; (b) “Simplified” ICP-05; (c) UWA-05; (d) “Offshore” UWA-05; (e) Fugro-05; (f)
NGI-05; (g) API Main Text; (h) LCPC-82 – tested against filtered ZJU-ICL 10 to 100 day age
dataset. Linear regression dashed lines are shown on the plots.
Page 37 of 46
https://mc06.manuscriptcentral.com/cgj-pubs
Canadian Geotechnical Journal

Draft
0 20 40 60 80 1000.0
0.5
1.0
1.5
2.0
2.5
3.0
3.5 Compression
Tension
Qc/Q
m
L/D
(a) ICP-05
0 20 40 60 80 1000.0
0.5
1.0
1.5
2.0
2.5
3.0
3.5
Qc/Q
m
L/D
(b) Simplified ICP-05
0 20 40 60 80 1000.0
0.5
1.0
1.5
2.0
2.5
3.0
3.5
Qc/Q
m
L/D
(c) UWA-05
0 20 40 60 80 1000.0
0.5
1.0
1.5
2.0
2.5
3.0
3.5
Qc/Q
m
L/D
(d) Offshore UWA-05
0 20 40 60 80 1000.0
0.5
1.0
1.5
2.0
2.5
3.0
3.5
Qc/Q
m
L/D
(e) Fugro-05
0 20 40 60 80 1000.0
0.5
1.0
1.5
2.0
2.5
3.0
3.5
Qc/Q
m
L/D
(f) NGI-05
0 20 40 60 80 1000.0
0.5
1.0
1.5
2.0
2.5
3.0
3.5
Qc/Q
m
L/D
(g) API Main Text
0 20 40 60 80 1000.0
0.5
1.0
1.5
2.0
2.5
3.0
3.5
Qc/Q
m
L/D
(h) LCPC-82
Fig. 7 Distribution of Qc/Qm (shaft capacity) with respect to pile slenderness ratio L/D (a)
ICP-05; (b) “Simplified” ICP-05; (c) UWA-05; (d) “Offshore” UWA-05; (e) Fugro-05; (f) NGI-05;
(g) API Main Text; (h) LCPC-82 – tested against filtered ZJU-ICL 10 to 100 day age dataset for
both compression and tension piles. Linear regression dashed lines are shown on the plots.
Page 38 of 46
https://mc06.manuscriptcentral.com/cgj-pubs
Canadian Geotechnical Journal

Draft
0 500 1000 1500 2000 25000
1
2
3
4
5 Open-ended
Closed-ended
Qc/Q
m
D (mm)
ICP-05
0 500 1000 1500 2000 25000
1
2
3
4
5
Qc/Q
m
D (mm)
UWA-05
0 500 1000 1500 2000 25000
1
2
3
4
5
Qc/Q
m
D (mm)
Offshore UWA-05
0 500 1000 1500 2000 25000
1
2
3
4
5
Qc/Q
m
D (mm)
HKU
(a) no dependency with pile diameter D
0 500 1000 1500 2000 25000
1
2
3
4
5
Qc/Q
m
D (mm)
Fugro-05
13.0*10
-4
0 500 1000 1500 2000 25000
1
2
3
4
5
Qc/Q
m
D (mm)
NGI-05
1
7.0*10-4
0 500 1000 1500 2000 25000
1
2
3
4
5
Qc/Q
m
D (mm)
API Main Text
1
1.3*10-3
0 500 1000 1500 2000 25000
1
2
3
4
5
Qc/Q
m
D (mm)
LCPC-82
1
2.0*10-3
(b) strong dependency with pile diameter D
Fig. 8 Distribution of Qc/Qm (base capacity) with respect to pile diameter for both
open and closed piles. Linear regression dashed lines are shown on the plots.
Page 39 of 46
https://mc06.manuscriptcentral.com/cgj-pubs
Canadian Geotechnical Journal

Draft
0 500 1000 1500 2000 25000.0
0.5
1.0
1.5
2.0
2.5
3.0
3.5
Qc/Q
m
D (mm)
(a) ICP-05
0 500 1000 1500 2000 25000.0
0.5
1.0
1.5
2.0
2.5
3.0
3.5
Qc/Q
m
D (mm)
(b) Simplified ICP-05
0 500 1000 1500 2000 25000.0
0.5
1.0
1.5
2.0
2.5
3.0
3.5
Qc/Q
m
D (mm)
(c) UWA-05
0 500 1000 1500 2000 25000.0
0.5
1.0
1.5
2.0
2.5
3.0
3.5
Qc/Q
m
D (mm)
(d) Offshore UWA-05
0 500 1000 1500 2000 25000.0
0.5
1.0
1.5
2.0
2.5
3.0
3.5
Qc/Q
m
D (mm)
(e) Fugro-05
0 500 1000 1500 2000 25000.0
0.5
1.0
1.5
2.0
2.5
3.0
3.5
Qc/Q
m
D (mm)
(f) NGI-05
0 500 1000 1500 2000 25000.0
0.5
1.0
1.5
2.0
2.5
3.0
3.5
Qc/Q
m
D (mm)
(g) API Main Text
0 500 1000 1500 2000 25000.0
0.5
1.0
1.5
2.0
2.5
3.0
3.5
Qc/Q
m
D (mm)
(h) LCPC-82
Fig. 9 Distribution of Qc/Qm (shaft capacity) by ICP-05 with respect to pile diameter D
(a) ICP-05; (b) “Simplified” ICP-05; (c) UWA-05; (d) “Offshore” UWA-05; (e) Fugro-05; (f)
NGI-05; (g) API Main Text; (h) LCPC-82 – tested against filtered ZJU-ICL 10 to 100 day age
dataset. Linear regression dashed lines are shown on the plots.
Page 40 of 46
https://mc06.manuscriptcentral.com/cgj-pubs
Canadian Geotechnical Journal

Draft
0 20 40 60 80 1000.0
0.5
1.0
1.5
2.0
2.5
3.0
3.5
Qc/Q
m
L (m)
(a) ICP-05
0 20 40 60 80 1000.0
0.5
1.0
1.5
2.0
2.5
3.0
3.5
Qc/Q
m
L (m)
(b) Simplified ICP-05
0 20 40 60 80 1000.0
0.5
1.0
1.5
2.0
2.5
3.0
3.5
Qc/Q
m
L (m)
(c) UWA-05
0 20 40 60 80 1000.0
0.5
1.0
1.5
2.0
2.5
3.0
3.5
Qc/Q
m
L (m)
(d) Offshore UWA-05
0 20 40 60 80 1000.0
0.5
1.0
1.5
2.0
2.5
3.0
3.5
Qc/Q
m
L (m)
(e) Fugro-05
0 20 40 60 80 1000.0
0.5
1.0
1.5
2.0
2.5
3.0
3.5
Qc/Q
m
L (m)
(f) NGI-05
0 20 40 60 80 1000.0
0.5
1.0
1.5
2.0
2.5
3.0
3.5
Qc/Q
m
L (m)
(g) API Main Text
0 20 40 60 80 1000.0
0.5
1.0
1.5
2.0
2.5
3.0
3.5
Qc/Q
m
L (m)
(h) LCPC-82
Fig. 10 Distribution of Qc/Qm (shaft capacity) by ICP-05 with respect to pile length L
(a) ICP-05; (b) “Simplified” ICP-05; (c) UWA-05; (d) “Offshore” UWA-05; (e) Fugro-05; (f)
NGI-05; (g) API Main Text; (h) LCPC-82 – tested against filtered ZJU-ICL 10 to 100 day age
dataset. Linear regression dashed lines are shown on the plots.
Page 41 of 46
https://mc06.manuscriptcentral.com/cgj-pubs
Canadian Geotechnical Journal

Draft
0 20 40 60 80 1000.0
0.5
1.0
1.5
2.0
2.5
Qc/Q
m
D/t
(a) ICP-05
0 20 40 60 80 1000.0
0.5
1.0
1.5
2.0
2.5
Qc/Q
m
D/t
(b) Simplified ICP-05
0 20 40 60 80 1000.0
0.5
1.0
1.5
2.0
2.5
Qc/Q
m
D/t
(c) UWA-05
0 20 40 60 80 1000.0
0.5
1.0
1.5
2.0
2.5
Qc/Q
m
D/t
(d) Offshore UWA-05
0 20 40 60 80 1000.0
0.5
1.0
1.5
2.0
2.5
Qc/Q
m
D/t
(e) Fugro-05
0 20 40 60 80 1000.0
0.5
1.0
1.5
2.0
2.5
Qc/Q
m
D/t
(f) NGI-05
0 20 40 60 80 1000.0
0.5
1.0
1.5
2.0
2.5
Qc/Q
m
D/t
(g) API Main Text
0 20 40 60 80 1000.0
0.5
1.0
1.5
2.0
2.5
Qc/Q
m
D/t
(h) LCPC-82
Fig. 11 Distribution of Qc/Qm (shaft capacity) with respect to pile diameter to wall thickness
ratio D/t (a) ICP-05; (b) “Simplified” ICP-05; (c) UWA-05; (d) “Offshore” UWA-05; (e)
Fugro-05; (f) NGI-05; (g) API Main Text; (h) LCPC-82 – tested against filtered ZJU-ICL 10 to
100 day age dataset. Linear regression dashed lines are shown on the plots.
Page 42 of 46
https://mc06.manuscriptcentral.com/cgj-pubs
Canadian Geotechnical Journal
Draft
Table 1 Summary of major databases for pile load tests in sand
Database
reference
adopted
herein
Driven piles
Other
piles Total
Accepted
by ZJU-ICL
Sand
Database
References Open-ended Closed-ended
ICP-94 0 23 0 23 11 Lehane and Jardine 1994
ICP-97 24 31 10 65 24 Chow and Jardine 1997
ICP-05 42 31 10 83 54 Jardine et al. 2005
UWA-05 32 42 0 74 65 Lehane et al. 2005a
33 44 0 77 65 Schneider et al. 2008
NGI-05 23 57 5 85 19 Clausen et al. 2005
Fugro-05 27 18 0 45 25 Kolk et al. 2005a
LCPC 5 14 34 53 0 Burlon et al. 2014
DLFTD 10 238 318 566 12 Mayne 2013
Page 43 of 46
https://mc06.manuscriptcentral.com/cgj-pubs
Canadian Geotechnical Journal

Draft
Table 2 General characteristics and quality criteria of ICP, UWA and ZJU-ICL Databases.
ICP-05 UWA-05 ZJU-ICL (2015)
Total no of tests in
each database 83 77 117
Provenance of tests
brought into each
database
19 new, adding to 64 from ICP-97 26 new, adding to 51 from ICP-97 49 new, adding to 54 from ICP-05
and 14 from UWA-05
Pile types Mainly driven piles, but with 8
jacked and 1 vibro-driven Only driven piles Only driven piles
Pile Shape Circular, square, and octagonal
piles
Circular, square and octagonal
piles
Circular, square and octagonal
piles
Pile diameter (mm) 200~2000 200~2000 200~2000
Pile length (m) 5.3~46.7 5.3~79.1 5.3~79.1
Soil description
Mainly siliceous sands, carbonate
contents less than 15%, shaft
length in clay less than 40%
Pile tips bearing a siliceous sand
and siliceous sand contributes >
50% of shaft capacity
Pile tips bearing a siliceous sand
and siliceous sand contributes >
65% of shaft capacity
Load test Static; base and shaft capacity
separated individually Static Static
Failure criterion
If no clear peak indicated in
compression, pile head
displacement of 0.1D (outer
diameter);
Failure in tension was usually well
defined.
If no clear peak indicated in
compression, pile head
displacement of 0.1D (outer
diameter);
Tension was defined as the
maximum uplift load minus pile
weight
If no clear peak indicated in
compression, pile head
displacement of 0.1D (outer
diameter);
Tension was defined as the
maximum uplift load minus pile
weight
Age on testing
Pile tests were conducted 0.5 to
200 days after driving. Average age
after driving =34 days after driving.
Time details were reported in 74%
of case records
Time between driving and load
testing is typically 0.5 to 200 days
(average t=24 days). Time details
were reported in 77% of the case
records
Pile tests were conducted 0.5 to
220 days, with an average of t=33
days after driving. Time details
were reported in 65% of the case
records
Page 44 of 46
https://mc06.manuscriptcentral.com/cgj-pubs
Canadian Geotechnical Journal
Draft
Table 3 Summary of ZJU-ICL database
All entries
Filtered entries with
age= 10-100 days
Closed Open All Closed Open All
Number of piles 62 55 117 48 32 80
Steel 25 48 73 18 26 44
Concrete 37 7 44 30 6 36
Tension tests 10 31 41 8 16 24
Compression tests 52 24 76 40 16 56
Average length L (m) 17.6 25.2 21.2 18.9 26.0 21.8
Range of lengths L (m) 6.2-45 5.3-79.1 5.3-79.1 6.2-45 5.3-79.1 5.3-79.1
Average of diameter D (m) 0.413 0.645 0.522 0.422 0.667 0.520
Range of diameter D (m) 0.2-0.7 0.324-2.0 0.2-2.0 0.2-0.7 0.324-2.0 0.2-2.0
Average of density Dr (%) 54 60 57 54 61 57
Range of Dr (%) 28-89 30-88 28-89 31-89 30-87 30-89
Average test time after
installation
35 80 61 43 28 35
Page 45 of 46
https://mc06.manuscriptcentral.com/cgj-pubs
Canadian Geotechnical Journal

Draft
Table 4 Summary of ZJU-ICL assessment of total capacity statistics (mean ± CoV of Qc/Qm
ratios) for API, LCPC-82, and CPT methods
Total capacity for all piles
Database ICP-05 UWA-05
Fugro-05 NGI-05 API LCPC-82 HKU Full Simplified Full Offshore
ICP (N=54) 0.97±0.35 0.69±0.38 1.00±0.32 0.84±0.38 1.11±0.41 1.16±0.50 0.87±0.66 1.23±0.49
Not
applicable
UWA (N=65) 0.93±0.34 0.69±0.37 1.00±0.32 0.85±0.38 1.12±0.42 1.19±0.49 0.83±0.63 1.21±0.47
Age Filtered
ZJU-ICL data
(N=80)
0.94±0.30 0.68±0.35 1.05±0.35 0.89±0.45 1.20±0.47 1.23±0.48 0.88±0.55 1.25±0.40
Total
ZJU-ICL data
(N=117)
0.92±0.32 0.67±0.41 1.01±0.34 0.85±0.41 1.15±0.54 1.13±0.47 0.85±0.53 1.20±0.40
Shaft capacity for open-ended piles
Age Filtered
ZJU-ICL data
(N=21)
0.85±0.21 0.55±0.27 0.88±0.22 0.63±0.19 1.01±0.58 0.90±0.26 0.78±0.60 1.01±0.38 Not
applicable
Base capacity for open-ended piles
All ZJU-ICL data*
(N=13) 0.83±0.35 1.28±0.27 1.07±0.30 1.60±0.32 1.37±0.59 1.42±0.66 2.45±0.46 0.75±0.34
Shaft capacity for piles under compression and tension
Age Filtered
ZJU-ICL
Compression
piles (N=20)
0.81±0.33 0.51±0.37 0.76±0.28 0.61±0.30 0.71±0.43 0.81±0.48 0.72±0.59 0.81±0.52
Not
applicable Age Filtered
ZJU-ICL tension
piles (N=24)
0.91±0.24 0.57±0.27 0.96±0.21 0.71±0.23 1.07±0.50 1.07±0.41 0.95±0.68 1.46±0.66
Shaft capacity for steel and concrete piles
Age Filtered
ZJU-ICL Steel
piles (N=34)
0.86±0.26 0.56±0.29 0.89±0.26 0.68±0.26 0.96±0.53 0.98±0.40 0.76±0.62 1.09±0.46
Not
applicable Age Filtered
ZJU-ICL Concrete
piles (N=10)
0.87±0.39 0.47±0.39 0.81±0.32 0.62±0.32 0.72±0.41 0.86±0.64 1.12±0.63 1.48±0.67
Base capacity for all piles
All ZJU-ICL data*
(N=32) 0.90±0.45 1.16±.46 1.08±0.45 1.70±0.51 1.33±0.62 1.00±0.92 1.51±0.76 0.75±0.34**
* Two cases in Kikuchi et al (2007) were not included in ZJU-ICL database but used for base capacity assessment only
** Only open-ended piles are counted as HKU end bearing procedure is only applicable to open-ended piles.
Page 46 of 46
https://mc06.manuscriptcentral.com/cgj-pubs
Canadian Geotechnical Journal