draft traffic safety white paper - illinois
TRANSCRIPT
Page 1 of 56 Traffic Safety White Paper
Draft Traffic Safety White Paper November 2017
Page 2 of 56 Traffic Safety White Paper
Table of Contents Introduction ............................................................................................................................................... 4
Key themes .................................................................................................................................................. 7
Changing driver behavior is of primary importance............................................................................. 7
Enforcement by local agencies has a key role ........................................................................................ 8
Engineering has a supporting role ...................................................................................................... 10
Vulnerable users deserve priority treatment ....................................................................................... 10
Vehicle technology will ultimately have a major effect ....................................................................... 10
Data quality and availability need improvement ............................................................................... 11
Safety planning in the CMAP region .................................................................................................... 11
Illinois Department of Transportation .................................................................................................. 11
City of Chicago ......................................................................................................................................... 12
County DOTs ............................................................................................................................................ 12
Emphasis Areas ........................................................................................................................................ 13
Pedestrian and bicyclist ........................................................................................................................... 14
Vehicle speed ....................................................................................................................................... 15
Location of pedestrians in severe crashes ............................................................................................ 16
Complete streets and modal hierarchy ................................................................................................ 19
Time of day and lighting ..................................................................................................................... 20
Speeding and aggressive driving........................................................................................................... 20
Traditional and automated enforcement ............................................................................................. 21
Education ............................................................................................................................................ 22
Traffic calming .................................................................................................................................... 23
Seat belt use ............................................................................................................................................... 26
Alcohol use/impaired driver .................................................................................................................. 28
Penalties and enforcement .................................................................................................................. 29
Technology .......................................................................................................................................... 31
Intersections .............................................................................................................................................. 32
Countermeasures ................................................................................................................................ 32
Automated enforcement ...................................................................................................................... 38
Roadway departure ................................................................................................................................. 39
Age of drivers ........................................................................................................................................... 40
Driver licensing and education .......................................................................................................... 41
Time of day effects ............................................................................................................................... 42
Design for older drivers ...................................................................................................................... 44
Distracted drivers ..................................................................................................................................... 45
Vehicle type............................................................................................................................................... 46
Potential CMAP roles .............................................................................................................................. 47
Incorporate safety measures into local programming ........................................................................ 47
Highway projects funded with CMAQ .............................................................................................. 48
Highway projects funded with local STP ........................................................................................... 48
Bicycle projects funded by CMAQ or TAP ........................................................................................ 49
Assist local agencies in safety planning ................................................................................................ 49
Produce actionable safety analysis for communities ........................................................................... 49
Page 3 of 56 Traffic Safety White Paper
Provide assistance for local HSIP funding ......................................................................................... 50
Support local road safety plans and road safety audits (RSA) ........................................................... 51
Seek safety behavioral funding at the MPO level ............................................................................... 51
Collaborate with IDOT to expedite the release of regional crash information .................................... 52
Developing regional safety targets ........................................................................................................ 53
ON TO 2050 safety targets ................................................................................................................ 53
Advances in transportation technology ................................................................................................ 54
Next steps .................................................................................................................................................. 56
Page 4 of 56 Traffic Safety White Paper
Introduction This paper explores ways to improve the safety of the region’s roadway system for motorists,
bicyclists, and pedestrians. It identifies key recommendations for the CMAP region that can be
carried forward in ON TO 2050, the region’s next comprehensive plan, as well as in other
initiatives. It focuses on reducing serious injury and fatal crashes as opposed to less severe
crashes involving only minor injury or property damage.
Travel has always involved some measure of risk, and since the advent of the automobile, traffic
fatalities have seemed to be an unavoidable consequence of travel in the United States. National public outcry over traffic fatalities resulted in the passage of the Highway Safety Act
and the National Traffic and Motor Vehicle Safety Act in 1966. This was the first legislation
passed by the federal government to address automobile safety. The Highway Safety Act of
1970 established the National Highway Traffic Safety Administration (NHTSA) to regulate
traffic and vehicle safety.1 More recently, Moving Ahead for Progress in the 21st Century (MAP-
21) and the Fixing America’s Surface Transportation (FAST) Act have continued to address
safety through an enhanced focus on measuring outcomes in the Highway Safety Improvement
Program.
New technology, improved roads, public education, mandatory seat belt use, graduated driver
licensing,2 and lowered blood alcohol limits have already increased traffic safety. These have
had tremendous success across the nation: total traffic deaths have fallen 36 percent from their
peak in 1972 when nearly 55,000 individuals lost their lives in traffic crashes.3 The fatality rate
per vehicle mile of travel is only a quarter of the 1972 rate. Hundreds of thousands of people
are alive today thanks to these efforts, but there is still a great deal of work to do. Behavioral
issues such as distracted driving, aggressive driving, and substance abuse continue to make
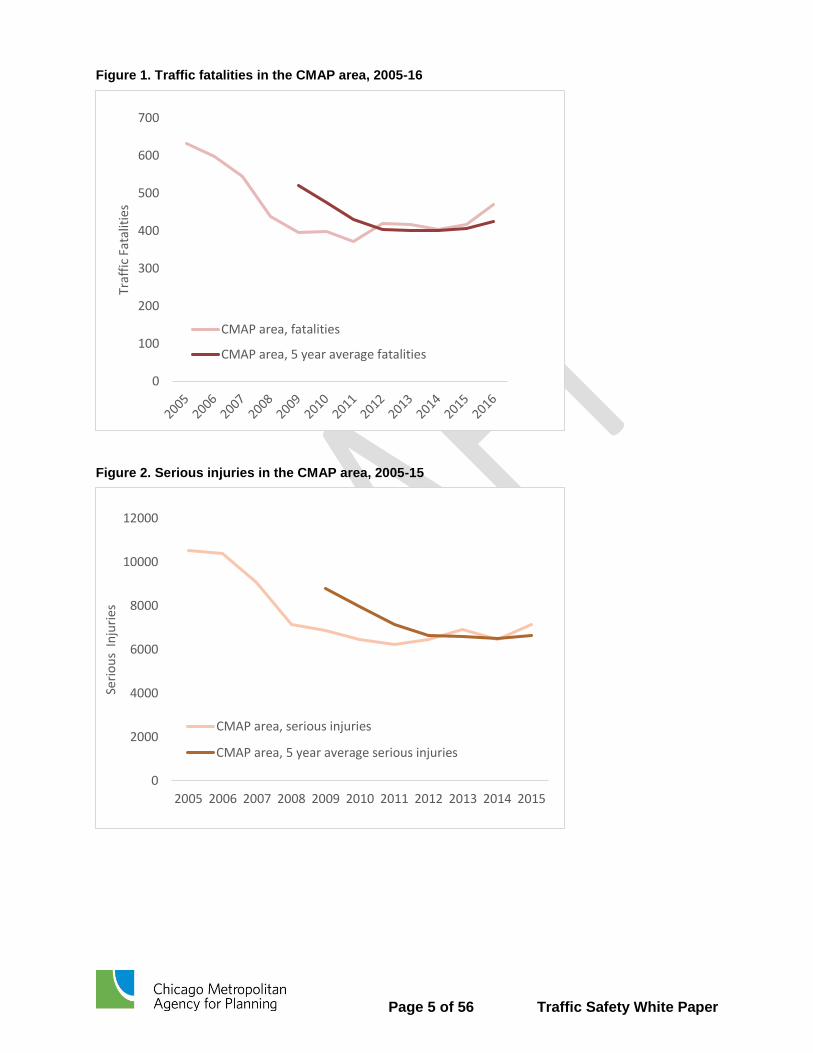
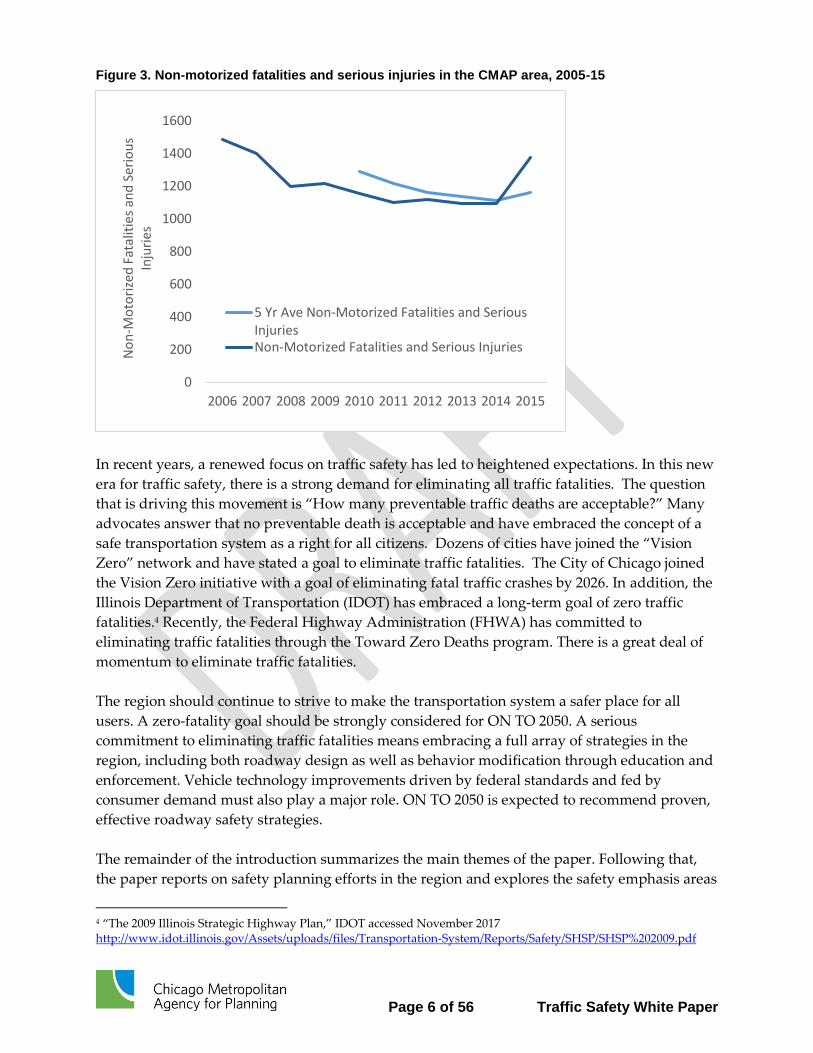
driving dangerous. Traffic fatality rates have now begun creeping upward again, and spiked in
2016 (Figures 1 – 3).
1 NHTSA,” accessed October 2017. http://www.allgov.com/departments/department-of-transportation-dot/national-highway-traffic-safety-administration?agencyid=7241
2 https://www.nih.gov/news-events/news-releases/graduated-drivers-licensing-programs-reduce-fatal-teen-crashes.
3 “Motor vehicle fatalities in 2008, 2010,” NHTSA, accessed October 2017. https://crashstats.nhtsa.dot.gov/Api/Public/ViewPublication/812318
Page 5 of 56 Traffic Safety White Paper
Figure 1. Traffic fatalities in the CMAP area, 2005-16
Figure 2. Serious injuries in the CMAP area, 2005-15
0
100
200
300
400
500
600
700Tr
affi
c Fa
talit
ies
CMAP area, fatalities
CMAP area, 5 year average fatalities
0
2000
4000
6000
8000
10000
12000
2005 2006 2007 2008 2009 2010 2011 2012 2013 2014 2015
Seri
ou
s In
juri
es
CMAP area, serious injuries
CMAP area, 5 year average serious injuries
Page 6 of 56 Traffic Safety White Paper
Figure 3. Non-motorized fatalities and serious injuries in the CMAP area, 2005-15
In recent years, a renewed focus on traffic safety has led to heightened expectations. In this new
era for traffic safety, there is a strong demand for eliminating all traffic fatalities. The question
that is driving this movement is “How many preventable traffic deaths are acceptable?” Many
advocates answer that no preventable death is acceptable and have embraced the concept of a
safe transportation system as a right for all citizens. Dozens of cities have joined the “Vision
Zero” network and have stated a goal to eliminate traffic fatalities. The City of Chicago joined
the Vision Zero initiative with a goal of eliminating fatal traffic crashes by 2026. In addition, the
Illinois Department of Transportation (IDOT) has embraced a long-term goal of zero traffic
fatalities.4 Recently, the Federal Highway Administration (FHWA) has committed to
eliminating traffic fatalities through the Toward Zero Deaths program. There is a great deal of
momentum to eliminate traffic fatalities.
The region should continue to strive to make the transportation system a safer place for all
users. A zero-fatality goal should be strongly considered for ON TO 2050. A serious
commitment to eliminating traffic fatalities means embracing a full array of strategies in the
region, including both roadway design as well as behavior modification through education and
enforcement. Vehicle technology improvements driven by federal standards and fed by
consumer demand must also play a major role. ON TO 2050 is expected to recommend proven,
effective roadway safety strategies.
The remainder of the introduction summarizes the main themes of the paper. Following that,
the paper reports on safety planning efforts in the region and explores the safety emphasis areas
4 “The 2009 Illinois Strategic Highway Plan,” IDOT accessed November 2017 http://www.idot.illinois.gov/Assets/uploads/files/Transportation-System/Reports/Safety/SHSP/SHSP%202009.pdf
0
200
400
600
800
1000
1200
1400
1600
2006 2007 2008 2009 2010 2011 2012 2013 2014 2015
No
n-M
oto
rize
d F
atal
itie
s an
d S
erio
us
Inju
ries
5 Yr Ave Non-Motorized Fatalities and SeriousInjuriesNon-Motorized Fatalities and Serious Injuries
Page 7 of 56 Traffic Safety White Paper
the CMAP region should focus on to reduce fatal and serious injury crashes. The paper
discusses the role CMAP can play in safety planning and programming and ends with a
discussion of the future of automotive technology and automated vehicles.
Key themes
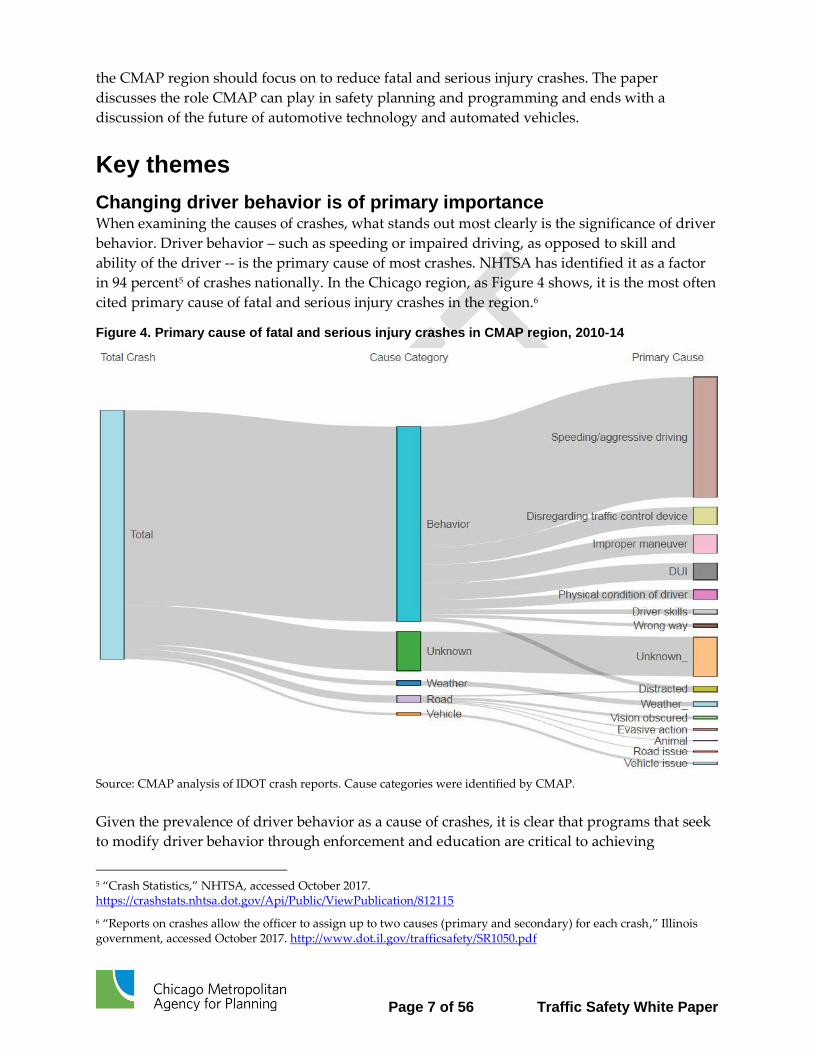
Changing driver behavior is of primary importance When examining the causes of crashes, what stands out most clearly is the significance of driver
behavior. Driver behavior – such as speeding or impaired driving, as opposed to skill and
ability of the driver -- is the primary cause of most crashes. NHTSA has identified it as a factor
in 94 percent5 of crashes nationally. In the Chicago region, as Figure 4 shows, it is the most often
cited primary cause of fatal and serious injury crashes in the region.6
Figure 4. Primary cause of fatal and serious injury crashes in CMAP region, 2010-14
Source: CMAP analysis of IDOT crash reports. Cause categories were identified by CMAP.
Given the prevalence of driver behavior as a cause of crashes, it is clear that programs that seek
to modify driver behavior through enforcement and education are critical to achieving
5 “Crash Statistics,” NHTSA, accessed October 2017. https://crashstats.nhtsa.dot.gov/Api/Public/ViewPublication/812115
6 “Reports on crashes allow the officer to assign up to two causes (primary and secondary) for each crash,” Illinois government, accessed October 2017. http://www.dot.il.gov/trafficsafety/SR1050.pdf
Page 8 of 56 Traffic Safety White Paper
significant reductions in fatalities and serious injuries. In many cases, they represent the best
use of discretionary safety funding. If these are not made priorities, there will be limited
improvement in safety over the short- and medium-term. Nevertheless, roadway improvements
remain important as well. Some engineering solutions can eliminate conflicts (that is, crash
opportunities) between drivers and between drivers and other road users, such as separating
pedestrians from vehicular traffic, or make the roadway more forgiving, such as improved
guardrail systems or anti-skid treatments. Roads and vehicles can continue to be improved so
that it is more difficult for drivers to make critical errors and when they do, the consequences
are less lethal, but driver error will be the main obstacle to achieving our goals for traffic safety.
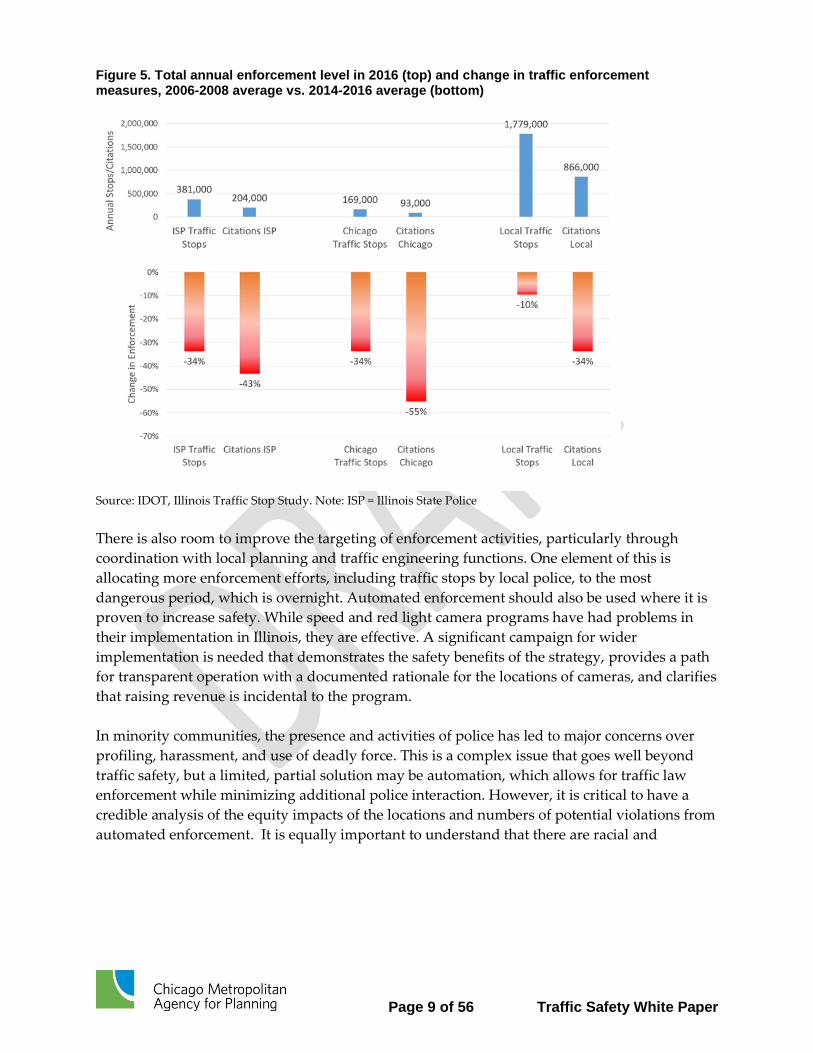
Enforcement by local agencies has a key role Traffic enforcement by local authorities targeting speeding, aggressive and impaired driving is
one key to reducing traffic fatalities. Aggressive goals for reducing deaths cannot be
accomplished without more effective traffic enforcement. Additional enforcement increases
costs, but is necessary with current vehicle technology. However, enforcement has waned, most
significantly at the state level and in the City of Chicago (Figure 5). The graph shows that traffic
stops have been reduced by one-third in Chicago and by the Illinois state police. The number of
citations has had a larger reduction for both agencies, but this may be a result of changes in
policies. The local communities across the state have experienced a 10 percent drop in traffic
stops and a one-third reduction in citations. It is important to note that automated traffic
enforcement is not captured in these totals. Starting in 2015, police officer performance could
not be based on ticket quotas or citation records.7 The operations division of the Illinois State
Police has seen a 21 percent reduction in headcount from 2010 to 2015.8 These trends have
consequences: for example, in one analysis, the risk of a fatal crash was 35 percent less in the
month following a traffic ticket conviction9.
7). “Public Act 98-0650,” Illinois Government, accessed October 2017. www.ilga.gov/legislation/publicacts/fulltext.asp?Name=098-0930
8 Reynolds, John, "Speeding ticket numbers down, fatalities up on Illinois roads," The State Journal-Register, December, 17, 2016, http://www.sj-r.com/news/20161217/speeding-ticket-numbers-down-fatalities-up-on-illinois-roads
9 Donald Redelmeier and colleagues, "Traffic report: Increasing the frequency of traffic enforcement might further
reduce total deaths," Volume 361, Number 9376, June 28, 2003, Lancet.
Page 9 of 56 Traffic Safety White Paper
Figure 5. Total annual enforcement level in 2016 (top) and change in traffic enforcement measures, 2006-2008 average vs. 2014-2016 average (bottom)
Source: IDOT, Illinois Traffic Stop Study. Note: ISP = Illinois State Police
There is also room to improve the targeting of enforcement activities, particularly through
coordination with local planning and traffic engineering functions. One element of this is
allocating more enforcement efforts, including traffic stops by local police, to the most
dangerous period, which is overnight. Automated enforcement should also be used where it is
proven to increase safety. While speed and red light camera programs have had problems in
their implementation in Illinois, they are effective. A significant campaign for wider
implementation is needed that demonstrates the safety benefits of the strategy, provides a path
for transparent operation with a documented rationale for the locations of cameras, and clarifies
that raising revenue is incidental to the program.
In minority communities, the presence and activities of police has led to major concerns over
profiling, harassment, and use of deadly force. This is a complex issue that goes well beyond
traffic safety, but a limited, partial solution may be automation, which allows for traffic law
enforcement while minimizing additional police interaction. However, it is critical to have a
credible analysis of the equity impacts of the locations and numbers of potential violations from
automated enforcement. It is equally important to understand that there are racial and
Page 10 of 56 Traffic Safety White Paper
economic disparities in traffic fatalities.10, 11 As discussed below, this is particularly true for
non-motorized users. Thus, there is an opportunity to address multiple equity impacts by
piloting community-centered enforcement approaches.
Engineering has a supporting role While it is not the largest opportunity for crash reduction, the road network needs to be made
as safe as possible so that driving errors do not lead to traffic fatalities. Effective lighting,
improved sight lines, safer intersections, conspicuous signs, lane markings and warning
devices, less dangerous roadside equipment and barriers, appropriate use of two way left turn
lanes, and improved signal timing all can be implemented where appropriate to make traveling
less dangerous.
Vulnerable users deserve priority treatment Pedestrians and bicyclists are the most vulnerable users of the transportation network; non-
motorized crashes disproportionately affect minority and low-income individuals. Crash data
suggests that serious crash rates for bicyclists and pedestrians are increasing faster than those
for vehicle occupants. Non-motorized users should be accommodated in as many locations as
possible without the danger of being hit by a vehicle. Strong consideration should be given to
local and state policies to reduce speed limits where pedestrians and bicyclists share the road
with motorists in significant numbers. Complete streets policies providing non-motorized
separation or protection from vehicles should be encouraged.
Vehicle technology will ultimately have a major effect Vehicle technology has had a major impact on traffic safety, and in the coming years some of
the biggest opportunities to improve safety may lie in technological solutions. Vehicles
increasingly include features to improve survivability as well as crash avoidance. There may be
opportunities to use technology to influence behaviors that are resistant to change, such as
failing to wear a seat belt or impaired driving. Increasing automation may eliminate at least
some of the human factors responsible for crashes. On the other hand, the most vulnerable
roadway users, bicyclists and pedestrians, are not completely protected by improvements to
crashworthiness,12 so highway engineering remains the most important way to address non-
motorized serious injuries and fatalities. Furthermore, lower-income groups tend to drive older
10 City of Chicago. Vision Zero Action Plan. June 2017. P. 17. Posted at http://visionzerochicago.org/wp-content/uploads/2016/05/17_0612-VZ-Action-Plan_FOR-WEB.pdf.
11 Huda Hamdan. Racial/Ethnic Differences in Fatality Rates from Motor Vehicle Crashes: An Analysis from a Behavioral and Cultural Perspective. Thesis. Virginia Commonwealth University. 2013.
12 Some vehicle improvements are being developed to eliminate or reduce the severity of non-motorized crashes, including technologies to help connected vehicles avoid crashes with pedestrians, redesigns of the front portions of vehicles to reduce the injury severity in case of an impact (Insurance Institute for Highway Safety, http://www.iihs.org/iihs/sr/statusreport/article/48/10/3), and truck side guards to prevent bicyclists and pedestrians from being swept under the rear wheels of a turning truck (Volpe Center, https://www.volpe.dot.gov/our-work/truck-side-guards-resource-page).
Page 11 of 56 Traffic Safety White Paper
cars with fewer safety features, so they benefit to a lesser degree from technological
improvements.
Data quality and availability need improvement In order to have a data-driven approach to improving traffic safety, crash data needs to be
available in a timely manner. Annual state crash data have typically been released about nine
months after the end of the year, but recently it has taken longer for IDOT to provide this data
to the various agencies who rely upon crash records for their analysis. It can be especially
difficult to quickly observe whether safety improvements are working; three years of data are
typically required for analyses, which may take five years to obtain after an improvement. State
and regional partners, including CMAP, need to work together to hasten data availability
through electronic reporting and improved data definitions and standards. Additional
resources may be necessary for this effort.
Safety planning in the CMAP region Transportation agencies across the region are very active in planning and building a safe
transportation system for all users. To help understand how transportation agencies in the
region currently plan for safety, identify safety strategies that have been successful in the
region, and help define CMAP’s role in safety planning for the region, CMAP staff interviewed
safety engineers and planners from highway agencies in the region.
Illinois Department of Transportation IDOT plays a leading role in improving the safety of the state and regional transportation
system. IDOT uses a data-driven approach to identify and address safety deficiencies. The
Strategic Highway Safety Plan (SHSP) produced by IDOT creates a roadmap for the state and
local transportation agencies to reduce the number of fatal and serious-injury crashes on all
public roads in the state. The SHSP designates emphasis areas that agencies should focus safety
efforts towards, so as to reduce crashes. Efforts entail using one of the 4Es (engineering,
enforcement, education, and emergency response) of transportation safety. In 2016, IDOT
released county-level SHSPs that focused on counties in Illinois that had a significant number of
serious and fatal crashes between 2010 and 2014. Emphasis areas for local agencies, crash heat
maps, and other disaggregate crash statistics were included in the county SHSPs to help local
agencies locate and address locations with a high rate of severe crashes.
In addition to the SHSP, IDOT annually releases the Highway Safety Plan (HSP) and Annual
Evaluation Report. The HSP documents the safety programs and agencies that receive federal
highway safety funds to reduce fatal and serious-injury crashes through non-engineering
solutions such as enforcement and public education or outreach. The Annual Evaluation
Report provides an evaluation of the safety programs identified in the HSP.
IDOT also releases a “five percent report” that identifies the top five percent locations that are
in need of a safety improvement on state and local roads and intersections. High-risk behaviors
Page 12 of 56 Traffic Safety White Paper
like speeding, drinking and driving, and not wearing a seat belt are often the cause of severe
crashes at five percent locations.13 The five percent reports are designed to help IDOT and local
agencies target projects to improve safety at dangerous locations on the road network.
Recently, IDOT developed a set of performance measures to evaluate and prioritize road
projects that includes two safety measures, the Safer Roads Index (SRI) and the “benefit of
safety improvement.” Based on historical severe crash data and exposure rates, the SRI ranks
the safety risk of a roadway. The “benefit of safety improvement” uses crash modification
factors to predict the reduction of different types of crashes based on selected safety counter-
measures to calculate the benefit-cost ratio of a certain project type.
City of Chicago Along with IDOT, the City of Chicago is very active in safety planning. Like many cities across
the United States, the City of Chicago committed to the “Vision Zero” initiative. Chicago first
committed to Vision Zero in 2012, and the Chicago Department of Transportation (CDOT)
recently released a 2017 – 2019 action plan to achieve zero fatalities and serious injury crashes
by 2026. Chicago’s Vision Zero action plan aims to reduce fatalities and serious injuries from
traffic crashes by 20 percent and 35 percent, respectively, by 2020 and eliminate both by 2026.
Chicago plans to achieve the goals presented in the plan by the following actions:
Invest equitably in areas that are most affected by severe traffic crashes
Develop a culture of safety by changing behaviors and perceptions
Make streets safer for all users through redesigning streets to be safer for all users
Make drivers and vehicles safer through implementing policies, offering training, and
supporting technologies that improve safety for all road users
The City has completed a number of other plans in which safety played a prominent role,
including a complete streets plan, bike plan, and pedestrian plan. The complete streets plan
developed a pedestrian-first modal hierarchy in which roads are designed for pedestrians first
instead of the automobile, except in special circumstances.14
County DOTs The county transportation departments in the CMAP region also plan and design for roads to
be safer for all users. Many of the counties in the region have successfully applied for the local
Highway Safety Improvement Program (HSIP) to fund safety counter-measures on roads they
operate and maintain. For example, DuPage DOT conducts inter-departmental safety project
13, “Illinois Local Roads Five Percent Report 2014,” Illinois Department of Transportation, accessed October 2017. http://www.idot.illinois.gov/Assets/uploads/files/Transportation-System/Bulletins-&-Circulars/Bureau-of-Local-Roads-and-Streets/Circular-Letters/Informational/CL2014-01%20HSIP%20Revised.pdf (“accessed” Oct 15, 2017).
14 Chicago Department of Transportation. “Complete Streets Chicago, 2013,” accessed October 2017.
https://www.cityofchicago.org/content/dam/city/depts/cdot/Complete%20Streets/CompleteStreetsGuidelines.pdf
Page 13 of 56 Traffic Safety White Paper
meetings to identify projects at high crash locations in the county. Additionally, IDOT has met
with each county to introduce the county-level SHSP and discuss how they can use the reports
to help identify locations with safety issues on the county system as well as work with
municipalities in the county that have high-priority locations on the local system. An excellent
example of a multi-disciplinary approach to safety planning is the Lake County Department of
Transportation (DOT), which holds quarterly meetings with local police and the sheriff’s office
to discuss how they can work together to develop strategies to address current safety issues in
the county.
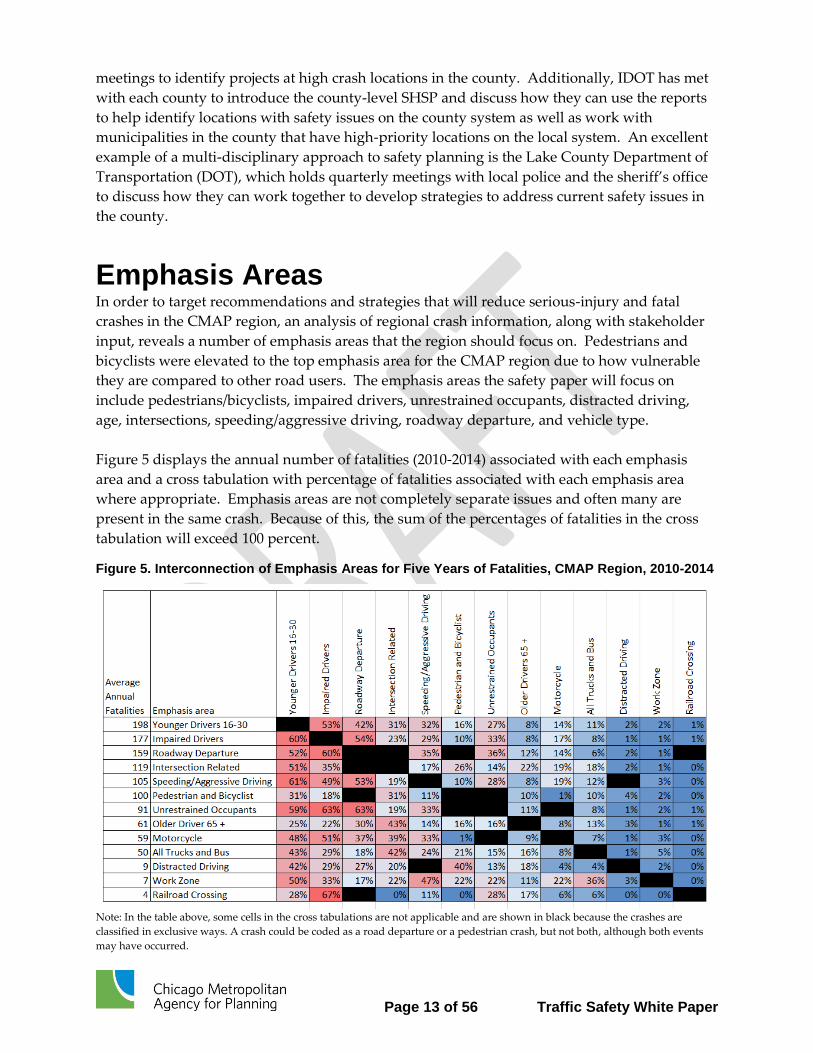
Emphasis Areas In order to target recommendations and strategies that will reduce serious-injury and fatal
crashes in the CMAP region, an analysis of regional crash information, along with stakeholder
input, reveals a number of emphasis areas that the region should focus on. Pedestrians and
bicyclists were elevated to the top emphasis area for the CMAP region due to how vulnerable
they are compared to other road users. The emphasis areas the safety paper will focus on
include pedestrians/bicyclists, impaired drivers, unrestrained occupants, distracted driving,
age, intersections, speeding/aggressive driving, roadway departure, and vehicle type.
Figure 5 displays the annual number of fatalities (2010-2014) associated with each emphasis
area and a cross tabulation with percentage of fatalities associated with each emphasis area
where appropriate. Emphasis areas are not completely separate issues and often many are
present in the same crash. Because of this, the sum of the percentages of fatalities in the cross
tabulation will exceed 100 percent.
Figure 5. Interconnection of Emphasis Areas for Five Years of Fatalities, CMAP Region, 2010-2014
Note: In the table above, some cells in the cross tabulations are not applicable and are shown in black because the crashes are
classified in exclusive ways. A crash could be coded as a road departure or a pedestrian crash, but not both, although both events
may have occurred.
Page 14 of 56 Traffic Safety White Paper
The cross tabulation values highlight the interconnection between the emphasis areas with the
cells shaded red (high) to blue (low). For example, of the 159 annual fatalities in the region that
involved a roadway departure crash, 60 percent included an impaired driver. Roadway
departures result in fatalities for 12 percent of all the severe injuries so every crash averted has a
significant chance to prevent a fatality. The distracted driving emphasis area is under reported
because it is currently difficult to capture in crash reports and the data used in the analysis does
not associate many serious injuries or fatalities with distracted driving.15
For each regional emphasis area, background information and statistics were compiled using
input from transportation agencies in the region and crash data provided by IDOT.
Additionally, recommendations are included that transportation agencies should consider
implementing in our region to actively reduce serious injury and fatal crashes in each emphasis
area.
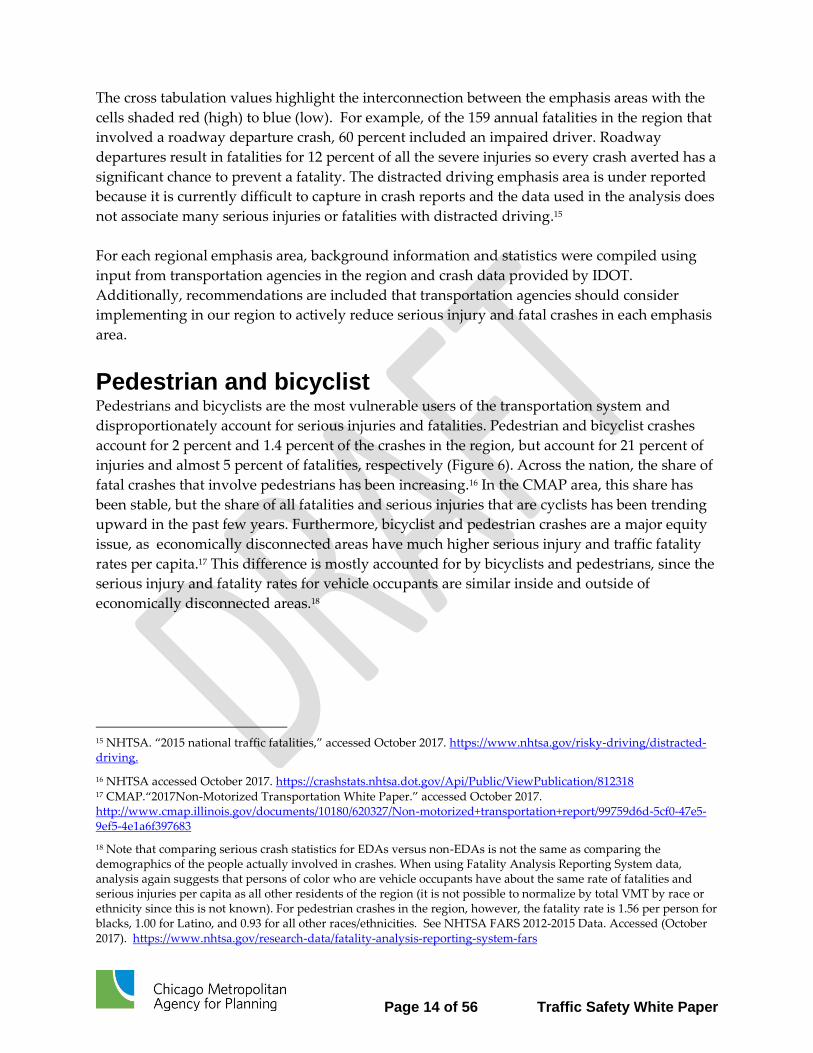
Pedestrian and bicyclist Pedestrians and bicyclists are the most vulnerable users of the transportation system and
disproportionately account for serious injuries and fatalities. Pedestrian and bicyclist crashes
account for 2 percent and 1.4 percent of the crashes in the region, but account for 21 percent of
injuries and almost 5 percent of fatalities, respectively (Figure 6). Across the nation, the share of
fatal crashes that involve pedestrians has been increasing.16 In the CMAP area, this share has
been stable, but the share of all fatalities and serious injuries that are cyclists has been trending
upward in the past few years. Furthermore, bicyclist and pedestrian crashes are a major equity
issue, as economically disconnected areas have much higher serious injury and traffic fatality
rates per capita.17 This difference is mostly accounted for by bicyclists and pedestrians, since the
serious injury and fatality rates for vehicle occupants are similar inside and outside of
economically disconnected areas.18
15 NHTSA. “2015 national traffic fatalities,” accessed October 2017. https://www.nhtsa.gov/risky-driving/distracted-driving.
16 NHTSA accessed October 2017. https://crashstats.nhtsa.dot.gov/Api/Public/ViewPublication/812318 17 CMAP.“2017Non-Motorized Transportation White Paper.” accessed October 2017. http://www.cmap.illinois.gov/documents/10180/620327/Non-motorized+transportation+report/99759d6d-5cf0-47e5-9ef5-4e1a6f397683
18 Note that comparing serious crash statistics for EDAs versus non-EDAs is not the same as comparing the demographics of the people actually involved in crashes. When using Fatality Analysis Reporting System data, analysis again suggests that persons of color who are vehicle occupants have about the same rate of fatalities and serious injuries per capita as all other residents of the region (it is not possible to normalize by total VMT by race or ethnicity since this is not known). For pedestrian crashes in the region, however, the fatality rate is 1.56 per person for blacks, 1.00 for Latino, and 0.93 for all other races/ethnicities. See NHTSA FARS 2012-2015 Data. Accessed (October 2017). https://www.nhtsa.gov/research-data/fatality-analysis-reporting-system-fars
Page 15 of 56 Traffic Safety White Paper
Figure 6. Pedestrian, bicyclist, and vehicle occupant shares of crashes, injuries, and fatalities
Source: CMAP analysis of IDOT Safety Portal data
While vehicle-to-vehicle crashes can be made less deadly by improvements to vehicle designs,
pedestrian and bicyclist crashes need to be eliminated, since vehicle designs can only reduce
injury severity in the event of an impact. This puts much of the focus on engineering the
roadway to better accommodate bicyclists and pedestrians. In addition, pedestrians and
bicyclist need to be educated about the safest ways to interact with vehicles and the dangers of
being distracted or under the influence of drugs or alcohol19. Since CMAP has gone into greater
detail on bicyclist and pedestrian safety in the ON TO 2050 Non-Motorized Transportation
White Paper, this paper tries to extend its findings.
Vehicle speed Available information suggests that vehicle speed is a leading culprit in non-motorized serious
injuries and fatalities. As vehicle speeds in crashes increase, the harm to pedestrians and
bicyclists increases disproportionally.20 While the crash data on pedestrian serious injuries in
Illinois is often missing information on the cause of the crash, in fatal pedestrian crashes 29
percent of the crashes with identified causes listed “failing to reduce speed to avoid crash” as
19 One in every three (34%) of fatal pedestrian crashes involved a pedestrian with a blood alcohol concentration (BAC) of at least 0.08 grams per deciliter (g/dL) CDC accessed January 2018 www.cdc.gov/motorvehiclesafety/pedestrian_safety/index.html
“2016 Dangerous by Design report”At 20 mph, the risk of death to a person on foot struck by a vehicle is 6 percent. At 30 mph, that risk of death is three times greater. And at 45 mph, the risk of death is 65 percent—11 times greater than at 20 mph. When struck by a car going 50 mph, pedestrian fatality rates are 75 percent and injury rates are more than 90 percent.” NextCity.Org., accessed October 2017. https://nextcity.org/pdf/dangerous-by-design-2016.pdf
0%
20%
40%
60%
80%
100%
All crashes All serious injuries All fatalities
Pedestrians Bicyclists Vehicle occupants
Page 16 of 56 Traffic Safety White Paper
the cause.21 In pedestrian crashes that have the cause identified, failing to yield right of way is
the cause on over half of serious pedestrian crashes. Speeding was rarely cited as the cause of
those serious and fatal crashes. Thus, within the limits of the available data, it appears that legal
vehicle speed where pedestrians and vehicles share the road is fast enough to cause serious
harm when a pedestrian is struck. This suggests that, in many cases, the currently permitted
speeds are too fast for drivers to identify the actions of pedestrians and result in the drivers
failing to yield the right of way. To significantly reduce the number of pedestrian and bicyclist
fatalities, vehicle speeds need to be reduced in areas with pedestrians or bicyclists present.
Location of pedestrians in severe crashes Analysis of the data suggests that the most serious safety issues for pedestrians related to
location are being hit outside of crosswalks and being hit in intersections by vehicles turning
left (Figure 7). In 2014, 64 percent of the pedestrian crashes were in the roadway, not the
crosswalk. Where crosswalks are less common or people park mid-block and cross directly to
their destination, the frequency of pedestrian activity in the roadway (outside a crosswalk)
increases, exposing them to vehicle traffic. The data generally reflects this relationship. The
City of Chicago has more crosswalks compared to the rest of the region, and just over half of the
severe crashes are outside crosswalks, whereas in the suburbs, three-fourths of the severe
pedestrian crashes are outside crosswalks.
21 “2014 Illinois crash data,” accessed October 2017. https://www.idot.illinois.gov/Assets/uploads/files/...System/.../Crash.../crash.../2014%20CF.pdf 34.6% of the pedestrian crashes that resulted in a serious injury did not have a cause listed.
Page 17 of 56 Traffic Safety White Paper
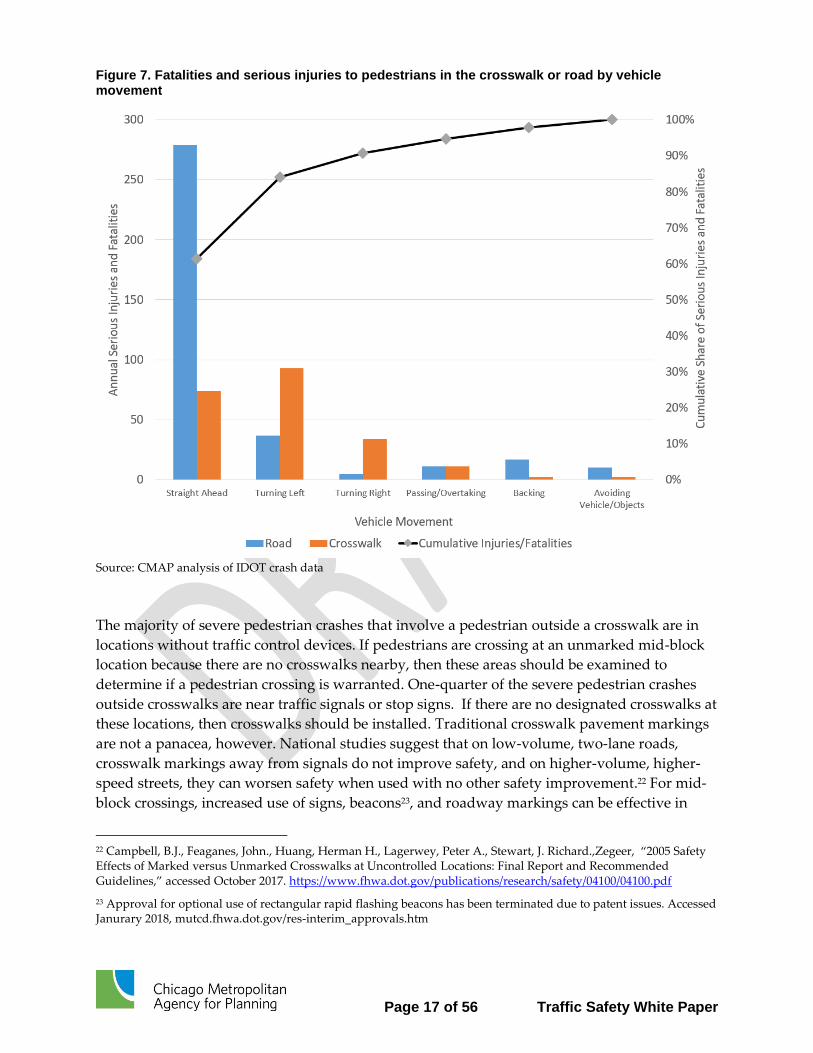
Figure 7. Fatalities and serious injuries to pedestrians in the crosswalk or road by vehicle movement
Source: CMAP analysis of IDOT crash data
The majority of severe pedestrian crashes that involve a pedestrian outside a crosswalk are in
locations without traffic control devices. If pedestrians are crossing at an unmarked mid-block
location because there are no crosswalks nearby, then these areas should be examined to
determine if a pedestrian crossing is warranted. One-quarter of the severe pedestrian crashes
outside crosswalks are near traffic signals or stop signs. If there are no designated crosswalks at
these locations, then crosswalks should be installed. Traditional crosswalk pavement markings
are not a panacea, however. National studies suggest that on low-volume, two-lane roads,
crosswalk markings away from signals do not improve safety, and on higher-volume, higher-
speed streets, they can worsen safety when used with no other safety improvement.22 For mid-
block crossings, increased use of signs, beacons23, and roadway markings can be effective in
22 Campbell, B.J., Feaganes, John., Huang, Herman H., Lagerwey, Peter A., Stewart, J. Richard.,Zegeer, “2005 Safety Effects of Marked versus Unmarked Crosswalks at Uncontrolled Locations: Final Report and Recommended Guidelines,” accessed October 2017. https://www.fhwa.dot.gov/publications/research/safety/04100/04100.pdf
23 Approval for optional use of rectangular rapid flashing beacons has been terminated due to patent issues. Accessed Janurary 2018, mutcd.fhwa.dot.gov/res-interim_approvals.htm
Page 18 of 56 Traffic Safety White Paper
alerting drivers to be aware of pedestrian activity in areas without standard traffic control
equipment. Lower speeds on roads also provide drivers with more time to see and react to
pedestrians.
For pedestrians in the crosswalk in intersections, left-turning vehicles are nearly three times as
likely to seriously injure or kill a pedestrian compared to vehicles making right turns.24 Left-
turning motorists may accelerate through an intersection and may be focused on opposing
traffic, rather than distant pedestrians in a crosswalk. Traffic signals control traffic at the
locations of three-fifths of the severe crashes where the pedestrian was in the crosswalk. In areas
with substantial left-turn/pedestrian conflicts, “permitted” left turn phasing can be replaced by
“protected” left turn phasing and turn bays, so walk and pedestrian clearance intervals do not
coincide with left-turning vehicle movements. At intersections that do not have leading left-
turn phases, leading pedestrian intervals (at least 3 seconds) can further reduce the amount of
time that pedestrians intersect with vehicles. The installation of accessible pedestrian islands or
medians in high traffic areas for children, the elderly population and especially people with
disabilities using wheeled accessories also provide a refuge from vehicle traffic. Intersections
can be restriped using pedestrian scramble (diagonal) crosswalks that allow pedestrians to cross
during all red signal phases that reduce total street crossing time. A working example of this
type of crosswalk safety design is located in Chicago at the intersection of State Street and
Jackson Boulevard. Pedestrian countdown signals, required by the Manual of Uniform Traffic
Control Devices for most intersections with pedestrian signals, can be prioritized in areas with
high pedestrian conflict with high vehicular presence. Improved signage and crosswalk
striping such as reflective striping and various pavement materials can further reduce crashes
by providing advanced notice to drivers that they are approaching an intersection where
pedestrians may be walking.
In general, pedestrian countdown signals, better road markings, protected left turn phases,
designs that lower left turn speeds, and traffic calming designs will all improve the safety of
pedestrians at intersections. Communities in the region have implemented a number of these
improvements in recent years, but continued progress is needed (Figure 8).
24 One possible explanation for this is that drivers of the left-turning vehicles are very focused on the on-coming vehicle traffic while at the same time identifying pedestrians. Also, in heavy traffic, the gap available for left turns may lead them to use higher speeds as they proceed through the intersection. Having a greater turning radius also allow left turning vehicles to attain higher speeds compared to right turn maneuvers. Drivers making right turns do not have to worry about on-coming traffic and can devote more attention to the pedestrians that are near them. ”Left-Turn, Pedestrian and Bicycle Crash Study,” FHWA, accessed October 2017. http://www.nyc.gov/html/dot/downloads/pdf/left-turn-pedestrian-and-bicycle-crash-study.pdf
Page 19 of 56 Traffic Safety White Paper
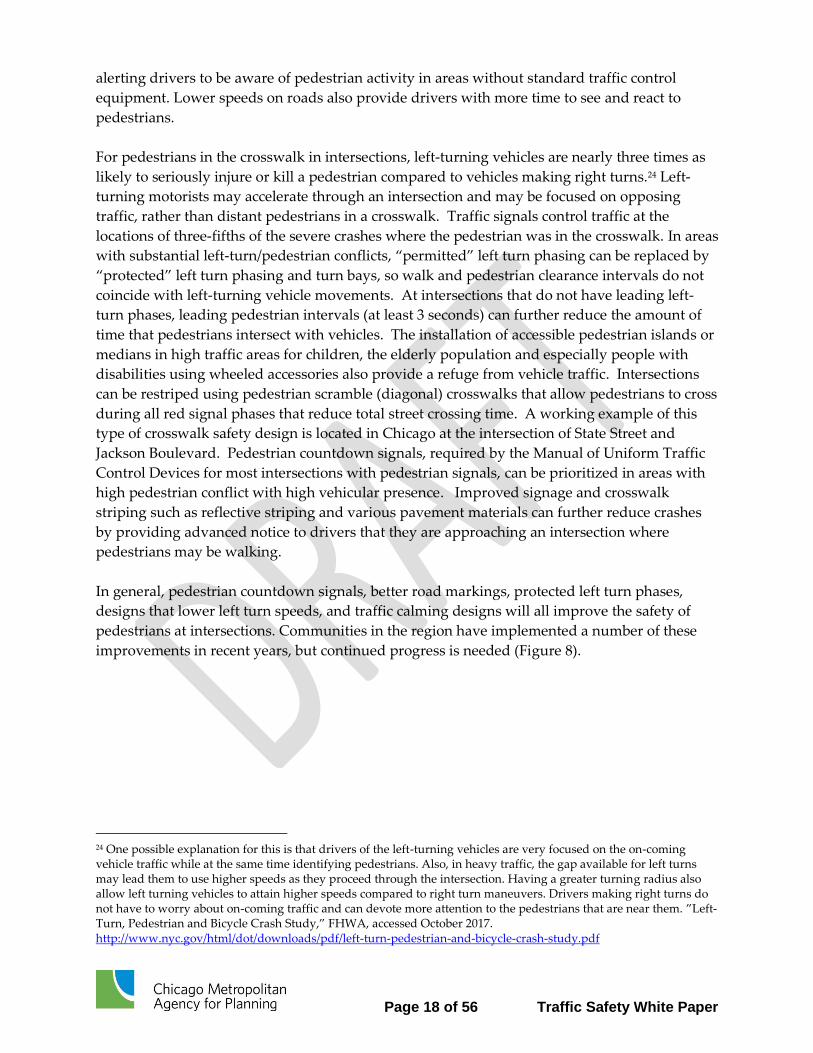
Figure 8. Examples of pedestrian-friendly roadway designs.
Source: CMAP Non-Motorized Transportation Snapshot
Complete streets and modal hierarchy Lack of effective crosswalks and the dangerousness of crossing against traffic turning left are
part of a larger general issue with the design of the roadway environment, which has
prioritized motorists in many places. To address this issue, communities should start with a
complete streets policy that commits to designing and operating roads in a way that
accommodates all users, regardless of age, ability, or mode of transportation. While progress
has been made, more is needed; as of 2016, almost 40 communities out of 284 in the CMAP
region have adopted complete streets policies.25 In particular, communities should strongly
consider adopting a default modal hierarchy that prioritizes pedestrian and bicyclist
accommodation (that is, safety) over cars when planning transportation system improvements.26
This modal hierarchy was adopted by the City of Chicago as part of the Complete Streets
Design Guidelines released in 2013; similar policies have been adopted elsewhere. As part of
this, geometric improvements that benefit pedestrians and bicyclists such as median refuge
areas, clearly signed and marked crosswalks, widened outside through-lanes for bikes, and
25 “Complete Streets Policy Atlas,” Smart GrowthAmerica.org, accessed February 2017. https://smartgrowthamerica.org/program/national-complete-streets-coalition/policy-development/policy-atlas/
26 “2015 Complete Streets: Overall Design Concepts and Considerations,” CMAP accessed October 2017. http://www.cmap.illinois.gov/documents/10180/391170/FY15-0085+COMPLETE+STREETS+DESIGN+CONC.pdf/ddd3e4f6-d3be-4bf1-abd6-d6c2c2d94433
Page 20 of 56 Traffic Safety White Paper
physical barriers that protect pedestrians and bicyclists need to be included in the evaluation
when improving roadway design to protect the most vulnerable road users.
Time of day and lighting The most dangerous period to be a pedestrian, based on the total number of serious injuries or
fatalities, is in the early evening after sunset from mid-October through the end of December. In
these months when the sun sets the earliest, many people are leaving work or school when it is
already dark. While other factors may increase the danger of pedestrian travel in the winter
time, it is most likely the poor visibility during these months for both the drivers and the
pedestrians. Initiatives that increase the visibility and detection of pedestrians to drivers would
reduce pedestrian deaths. Left-turn movements with protected phases would separate the
pedestrian and vehicle conflict if the pedestrian obeys their signal. Having the protected left-
turn phase may reduce the chance of drivers not noticing a hard-to-see pedestrian who stray
into their path.
Studies of the effectiveness of improved lighting for reducing pedestrian crashes are not
definitive, but do suggest that lighting helps prevent crashes.27 A study from the Netherlands
estimated 13 percent reduction in crashes for intersections with lighting compared to
intersections without lighting.28 Older work estimated a 50 percent reduction in pedestrian
crashes by improved illumination.29 In areas with pedestrian activity at dusk or at night,
particular emphasis should be placed on vertical illuminance, assuring that pedestrians are
visible to drivers, rather than visible from the sky.30 Analysis of the effectiveness of newer LED
lighting has not been completed due to the lack of relevant before/after data. Improving the
lighting wherever pedestrians are interacting with vehicles is likely to save pedestrian lives.
Speeding and aggressive driving
27 “Road Safety Factsheet: Street Lighting and Road Safety,” Royal Society for the Prevention of Accidents, March
2017, accessed October 2017. http://www.rospa.com/rospaweb/docs/advice-services/road-safety/roads/street-
lighting.pdf
28 Wanvik, W., "Effects of road lighting: An analysis based on Dutch accident statistics 1987-2006." Accident Analysis
and Prevention, Vol. 41, No. 1, Oxford, N.Y., Pergamon Press, (2009) pp. 123-128. Also
http://www.lrc.rpi.edu/resources/newsroom/pdf/2007/StreetLightingSafety8511.pdf
29 Elvik, R. “Meta-Analysis of Evaluations of Public Lighting as Accident Countermeasure.” Transportation Research
Record 1485, TRB, National Research Council, Washington, D.C., (1995): pp. 112-123.
https://trid.trb.org/view.aspx?id=451827
30 FHWA. FHWA Lighting Handbook. August, 2012. https://safety.fhwa.dot.gov/roadway_dept/night_visib/lighting_handbook/
Page 21 of 56 Traffic Safety White Paper
Speeding and aggressive driving31 are the leading causes of fatal and serious injury crashes in
the region. In the CMAP region, 26 percent of all fatalities in the past five years had speeding
and/or aggressive driving as a primary cause for the crash. A recent study conducted by the
National Transportation Safety Board found that speeding increases the risk of being involved
in a crash and increases the severity of injuries.32 Speeding is also widespread. According to an
AAA survey, nearly half of the drivers have driven 15 mph over the speed limit on a freeway
(46 percent) and have driven 10 mph over the speed limit on a residential street (46 percent) in
the past 30 days.33 Because it is a behavioral issue, all fatalities and serious injuries caused by
speeding are preventable. The majority of recommendations are also behavioral, that is, based
on enforcement, education, and training. A number of traffic calming measures can also reduce
motorist speed.
Traditional and automated enforcement Enforcement can be an effective way to deter aggressive driving. With traditional on-the-
ground enforcement, police presence needs to be highly visible so drivers become aware that
law enforcement personnel are actively enforcing the speed limit. Through a data-driven
process, law enforcement agencies should target corridors that experience a high number of
fatal and serious injury crashes. Funding programs for additional enforcement, often targeted
on holidays with binge drinking should also be used, as currently permitted, at locations that
have consistent issues with severe crashes caused by speeding and aggressive driving
throughout the year. CMAP should work with local agencies to assist in identifying corridors
in the region that experience high numbers of serious injury and fatal crashes resulting from
speeding.
Automated speed enforcement (ASE) through speed cameras is an effective tool that should be
used more widely in the region. A review of ASE programs found fatality reductions of 17 to 71
percent.34 ASE can free law enforcement personnel to focus on other issues and also limits the
danger of escalation from routine traffic stops. The City of Chicago has found its automated
program to be a success with speeding decreasing by half at locations where cameras are
installed within 90 days and an 18 percent decrease in injury-causing crashes in Child Safety
31 In this paper, speeding and aggressive driving are defined as any fatal or serious injury crash with a primary cause
of exceeding authorized speed limit, exceeding safe speed for conditions, failing to reduce speed to avoid a crash, or
operating vehicle in an erratic, reckless, careless, negligent or aggressive manner.
32 “Reducing Speeding-Related Crashes Involving Passenger Vehicles, 2017,” National Transportation Safety Board,
accessed October 2017. https://www.ntsb.gov/safety/safety-studies/Documents/SS1701.pdf
33 “2016 Traffic Safety Culture Index February 2017,”AAA Foundation for Traffic Safety, accessed October 2017.
https://www.aaafoundation.org/sites/default/files/2016TrafficSafetyCultureIndexReportandCover_0.pdf
34 Bellamy, Nicholas., Le Brocque, Robyne., Willis, Charlene., Wilson, Cecilia., Hendrikz, Joan K. . “Speed Cameras
for the Prevention of Road Traffic Injuries and Deaths,” 2010 Cochrane Database of Systematic Reviews (11), accessed
October 2017. https://www.cochranelibrary.com/topic/.../Prevention%20of%20road%20traffic%20injuries/
Page 22 of 56 Traffic Safety White Paper
Zones in the first year.35 Currently, however, only the City of Chicago is authorized under state
law to use automated speed limit enforcement (the use of automated enforcement for running
red lights is more broadly allowed in the CMAP area except in Kendall County).36 IDOT can
currently only use automated enforcement for speed limit compliance in work zones. The
General Assembly should broaden permissions for IDOT, the Illinois State Police, the Illinois
Tollway, and municipal and county agencies to implement automated speed limit enforcement
programs in locations with high numbers of serious crashes where speeding is implicated. As a
last policy barrier to wider use of ASE, the FAST Act specifically prohibits using HSIP funding
or NHTSA funding under 23 USC 402 to pay for ASE equipment or operation except in school
zones; CMAP should support eliminating these restrictions in the next federal reauthorization.
If national statistics are representative of the Chicago area, automated enforcement is not yet a
widely-supported concept. AAA found that of drivers surveyed for their 2016 Traffic Safety
Culture Index that only 43 percent support using cameras on residential streets, 42 percent in
urban areas, and 32 percent on freeways.37 A significant campaign for its implementation is
needed that demonstrates the safety benefits of the strategy, the rationale for the locations of
cameras, and clarifies that raising revenue is incidental to the program. Equity impacts and a
community focus for non-expressway locations can also be considered for such a program.
CMAP should provide support to agencies in the region that would like to establish an
automated enforcement program. CMAP support can be in the form of public outreach about
the benefits of such a program and creating brochures and reports that highlights the safety
benefits of automated enforcement.
Because vehicles are travelling at such high speeds on expressways, a limited number of
strategically placed automated speed cameras should be deployed on expressways in the
region. While expressways are generally safer than other functional classes, the crashes that do
occur have a higher likelihood of causing a serious injury or fatality because of higher speeds.
European countries extensively use automated enforcement on their freeways, while only two
states in the United States operate speed cameras on expressways.38
Education Because speeding and aggressive driving are behavioral issues, educational campaigns and
driver training should be encouraged regionally. As part of its Vision Zero strategy, the City of
Chicago plans to emphasize education over fines by working with police department to make
35 “Vision Zero Chicago Action Plan 2017,”CDOT June 2017, accessed October 2017. http://visionzerochicago.org/wp-
content/uploads/2016/05/17_0612-VZ-Action-Plan_FOR-WEB.pdf
36 Illinois Statutes 625 ILCS 5/11-208.6, 625 ILCS 5/11-208.8, accessed October 2017.
www.ilga.gov/legislation/ilcs/fulltext.asp?DocName=062500050K11-208.8
37 “2016 Traffic Safety Culture Index,”AAA Foundation for Traffic Safety,”accessed February 2017. https://www.aaafoundation.org/sites/default/files/2016TrafficSafetyCultureIndexReportandCover_0.pdf
38 Howie, Craig. “Speed cameras on U.S. highways?.” CNN.com. Cable News Network, 4 June 2009. Web. 7, accessed March 2017. https://www.cnn.com/2009/LIVING/wayoflife/06/04/aa.speed.cameras.highways/index.html
Page 23 of 56 Traffic Safety White Paper
sure drivers are aware of traffic safety school options that could lower the cost of a citation and
work with the Cook County Courts to ensure effective programs exists.39 To change drivers’
behaviors in the region, CMAP should support driver safety training options for drivers that
receive a citation involving speeding or aggressive driving. CMAP should actively support
outreach and driver educational campaigns through its social media accounts and online
presence.
Traffic calming A number of traffic calming measures are available that reduce motorists’ speed and aggressive
driving while at the same time enhancing the roadway environment for non-motorists. Spot
design elements that create vertical deflections such as speed hump, speed table, and raised
intersections, horizontal shifts such as a neighborhood traffic circle, and roadway narrowing
such as a choker or center island narrowing, can make motorists to slow down and drive safer.
These traffic calming elements are best suited for lower-volume roads and are more effective
when implemented along a corridor. For example, speeds between speed humps have been
observed to be reduced between 20 and 25 percent on average.40
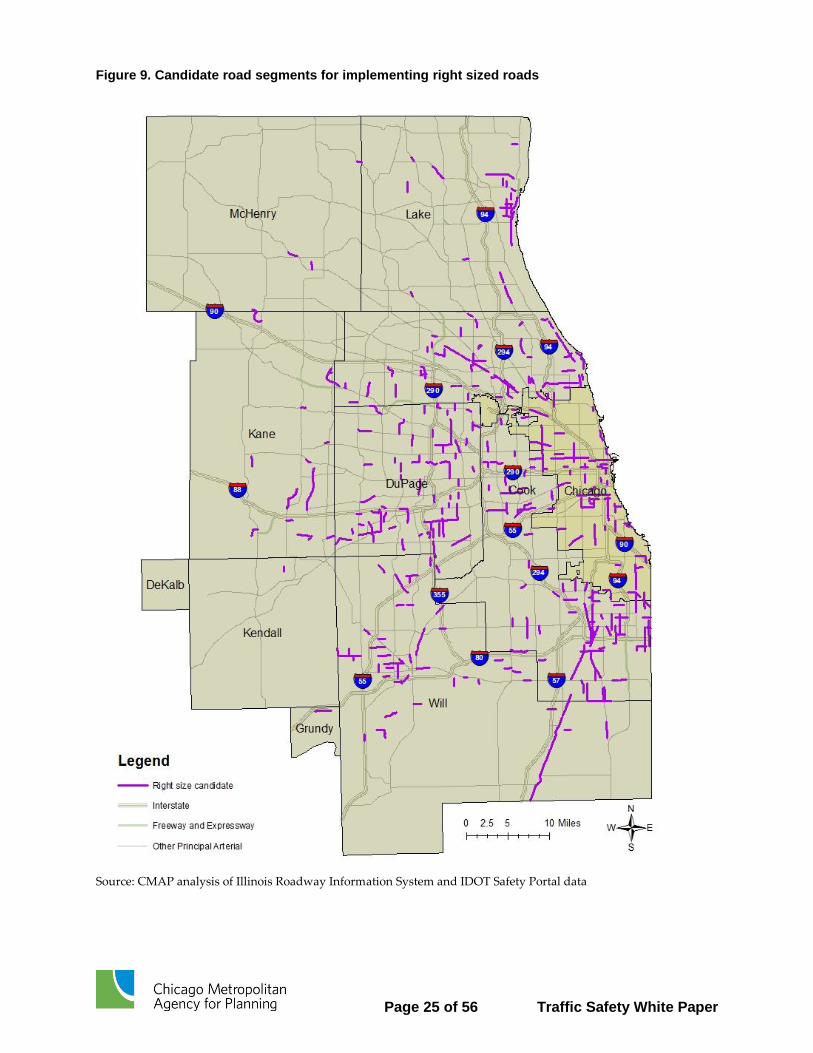
A “road diet” or “right-sizing” a road is a proven design treatment that can reduce motorists’
speeds and help make roads safer for all users. Typically, right-sizing a road involves
converting a road made up of four undivided lanes (two in each direction) to three lanes (one
lane in each direction, plus a center two-way, left-turn lane).41 Implementing a right-sized road
also opens up space for bike lanes, pedestrian refuge islands, and transit stops. It has many
safety benefits including reduced speed differential between cars, which can decrease the
number and severity of crashes. It also is thought to be beneficial for older drivers with slower
reaction times and reflexes.42 A case study on implementing a road diet in Seattle found
significant speed reduction along the corridor with more than a 60-percent reduction in
motorists driving over the speed limit and 23-percent reduction in collisions.43
CMAP preliminarily identified road segments in the region that may be candidates for right-
sizing (Figure 9). This is a planning-level analysis and more thorough engineering study would
39 Vision Zero Chicago Action Plan 2017, accessed June 2017. https://www.visionzerochicago.org/wp-content/.../05/17_0612-VZ-Action-Plan_FOR-WEB.pdf
40 “Traffic Calming Measures – Speed Hump,” Institute of Transportation Engineers (ITE), accessed October 2017. http://www.ite.org/traffic/hump.asp
41 “Road Diets (Road Reconfiguration),” U.S. Department of Transportation Federal Highway Administration, accessed October 2017. https://safety.fhwa.dot.gov/road_diets/
42 “Road Diet Informational Guide, 2014,” U.S. Department of Transportation Federal Highway Administration, accessed October 2017. https://safety.fhwa.dot.gov/road_diets/guidance/info_guide/rdig.pdf
43 “Case Study: Road Diet (San Francisco, CA),” accessed October 2017. http://www.nctcog.org/trans/sustdev/bikeped/workshops/documents/6_DPS201_RoadDiets.pdf
Page 24 of 56 Traffic Safety White Paper
be needed before implementation. Modeled after a study done for the Iowa DOT,44 the analysis
identified 4-lane undivided roadways with total AADT less than 18,000. Segments of relatively
uniform length were constructed in GIS, then crash rates were computed for each segment
which can help identify which candidate locations should be a higher priority.
CMAP should continue to encourage and support communities to implement traffic calming
measures and to right-size roads. Given the FHWA requirements to set performance targets
both for safety and for mobility measures, CMAP should work with its partners to develop
policy guidance on prioritizing roads for mobility and safety characteristics, including
operating speed and number of lanes.
44 “Statewide Screening for Potential Lane Reconfiguration,” Iowa Department of Transportation, accessed October
2017.
https://iowadot.gov/systems_planning/pr_guide/Safety/StatewideScreeningforPotentialLaneReconfiguration.pdf
Page 25 of 56 Traffic Safety White Paper
Figure 9. Candidate road segments for implementing right sized roads
Source: CMAP analysis of Illinois Roadway Information System and IDOT Safety Portal data
Page 26 of 56 Traffic Safety White Paper
Seat belt use Increasing seat belt use is one of the most important steps the region could take to reduce
fatalities. Analysis by NHTSA shows that the risk of fatal injuries to front seat occupants is
reduced by 45 percent and the risk of moderate-to-critical injury by 50 percent when seat belts
are used.45 Seat belt use is mandatory in Illinois and is a primary law, meaning that a driver can
be stopped and ticketed for not wearing one. Seat belt use in Illinois has increased annually, and
in the last published survey results for the state (2015), 95 percent of front seat occupants were
observed wearing seat belts during the daytime.46
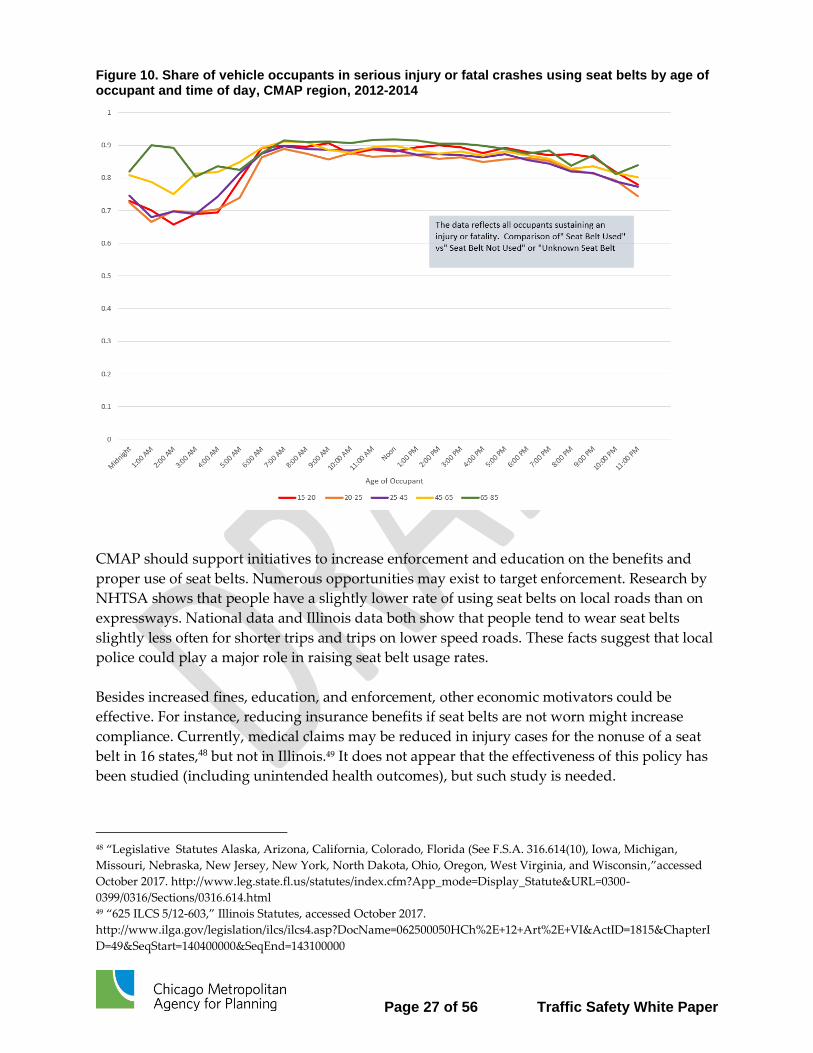
However, rates of seat belt usage are much lower among the vehicle occupants in fatal crashes.
This is particularly the case at night and among drivers younger than 45, and has significant
overlap with impaired driving (Figure 10). If seat belt use could be raised to 100 percent from 95
percent, analysis suggests that one-quarter to one-third of fatalities could be prevented.47
45 “Seat Belts-Consequences,” NHTSA accessed October 2017. https://www.nhtsa.gov/risky-driving/seat-belts
46 “Safety Belt Usage in Illinois,” IDOT accessed October 2017. http://www.idot.illinois.gov/Assets/uploads/files/Transportation-System/Reports/Safety/Evaluations/SafetyBeltObservationReports/2015%20safety%20belt%20-one%20sheet-jun2015.pdf. Within the region, the City of Chicago had the lowest seat belt use observed at 90.4% while the rest of the region has a seat belt use of about 96.3%.
47 Using the three most recent years of data, during the daytime between 6 AM and 6 PM, 28 percent of the drivers who died in a crash, where the status of seat belt use could be determined, were not using a seat belt. If the drivers who were not wearing seat belts had the same driving skills as those who did wear seat belts, we can assume that they would have had similar survivorship rates had they also worn seat belts. Based on 90 percent of drivers wearing seat belts, the day-time fatality numbers were 20 percent higher than they would be expected to be if all drivers wore safety belts. If 95% of drivers wore seat belts during this driving period, then raising the use of belts to 100% should result in a 24% reduction in driver fatalities.
Between the evening and late-night hours of 6 PM until 6 AM, the number of drivers who died but were not wearing safety belts increased to 53% of the drivers. During the evening and late-night hours, driver behavior, speeds and lighting conditions are different from the daytime. It is not known if drivers who decide to not wear seat belts have the same driving competence during this time frame as drivers who choose to wear seat belts. If they have similar abilities to drive, and 80% of the drivers are wearing seat belts, then 20% of the population not wearing seat belts accounts for half of the fatalities. If all of the drivers wore seat belts during this time period, the fatality rate for drivers would drop by 41% in this 12 hour period. If the nighttime drivers use seat belts at a lower rate than daytime drivers, assume 70% instead of 80%, them making all nighttime drivers wear seat belts should reduce these fatalities by 32%.
Page 27 of 56 Traffic Safety White Paper
Figure 10. Share of vehicle occupants in serious injury or fatal crashes using seat belts by age of occupant and time of day, CMAP region, 2012-2014
CMAP should support initiatives to increase enforcement and education on the benefits and
proper use of seat belts. Numerous opportunities may exist to target enforcement. Research by
NHTSA shows that people have a slightly lower rate of using seat belts on local roads than on
expressways. National data and Illinois data both show that people tend to wear seat belts
slightly less often for shorter trips and trips on lower speed roads. These facts suggest that local
police could play a major role in raising seat belt usage rates.
Besides increased fines, education, and enforcement, other economic motivators could be
effective. For instance, reducing insurance benefits if seat belts are not worn might increase
compliance. Currently, medical claims may be reduced in injury cases for the nonuse of a seat
belt in 16 states,48 but not in Illinois.49 It does not appear that the effectiveness of this policy has
been studied (including unintended health outcomes), but such study is needed.
48 “Legislative Statutes Alaska, Arizona, California, Colorado, Florida (See F.S.A. 316.614(10), Iowa, Michigan,
Missouri, Nebraska, New Jersey, New York, North Dakota, Ohio, Oregon, West Virginia, and Wisconsin,”accessed
October 2017. http://www.leg.state.fl.us/statutes/index.cfm?App_mode=Display_Statute&URL=0300-
0399/0316/Sections/0316.614.html 49 “625 ILCS 5/12-603,” Illinois Statutes, accessed October 2017.
http://www.ilga.gov/legislation/ilcs/ilcs4.asp?DocName=062500050HCh%2E+12+Art%2E+VI&ActID=1815&ChapterI
D=49&SeqStart=140400000&SeqEnd=143100000
Page 28 of 56 Traffic Safety White Paper
In the longer term, tying the operability of vehicles to the correct use of seat belts is the most
likely way to ensure seat belt use. If a vehicle will not operate without the seat belts on, many
lives will be saved. Among its other federal agenda priorities, CMAP should consider
advocating for congressional or regulatory agency action to require automakers to disable
ignition when seat belts are not engaged. It is unlikely that aggressive safety goals can be met
without such requirements.
While occupants of light cars and trucks are the main concern, other vehicles present
opportunities to improve safety through increased use of seat belts. For instance, while bus
travel in general is safer than passenger car travel, there are a small number of school bus
injuries each year. Requirements for seat belts on school buses in Illinois would be beneficial.50
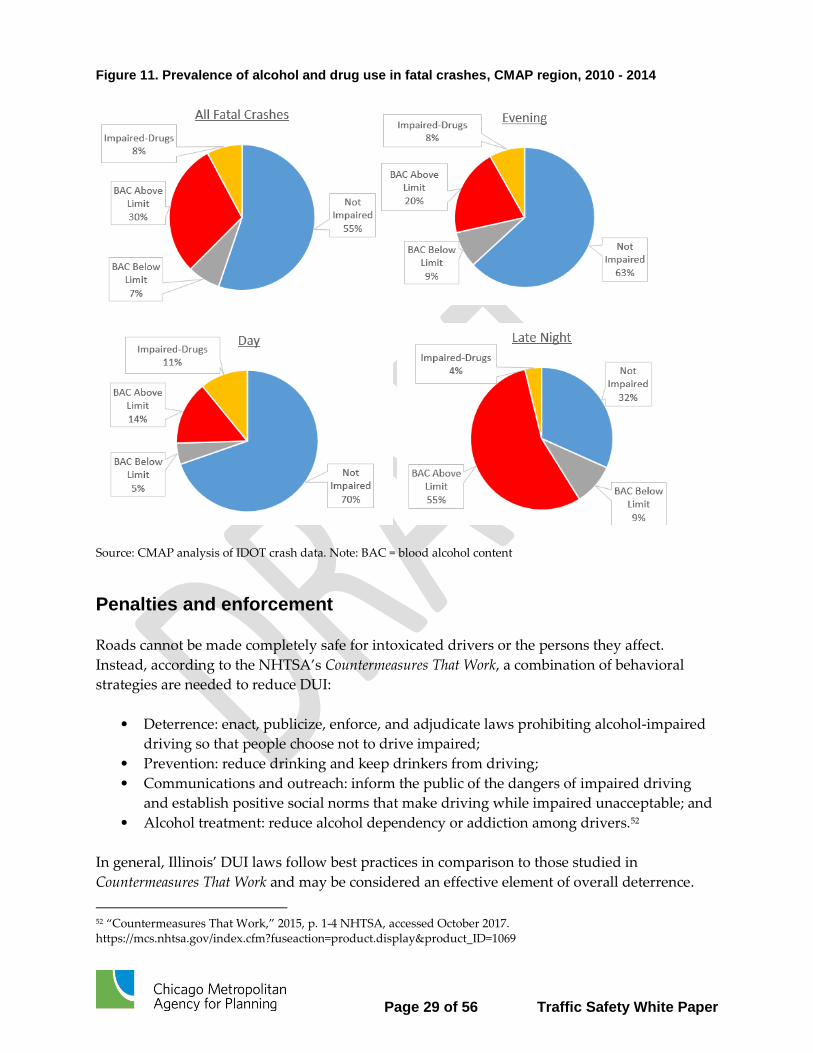
Alcohol use/impaired driver Driving vehicles while under the influence of alcohol or drugs has been a major contributing
factor in fatal crashes for many decades. Over 2010-2014, 45 percent of the fatal crashes in the
Chicago region involved a driver who had been drinking or taking drugs (Figure 11). These
drivers have impaired reflexes and judgment and also increase their risk of being in a serious or
fatal crash by driving aggressively. These drivers are also more likely to die in crashes due to
their lower rate of seat belt use. Most of these drivers are younger, but drivers of all ages drive
under the influence of drugs or alcohol. In general, alcohol use is part of a group of risk factors
involving late night driving, speeding, and lower use of seat belts.51
50 By federal regulation, beginning in 2013, motorcoaches and other large buses have been required to install lap and shoulder straps for all new vehicles, but not regular school buses. Small school buses (with a gross vehicle weight rating of 10,000 pounds or less) must be equipped with lap and/or lap/shoulder belts at all designated seating positions. Currently six states -- California, Florida, Louisiana, New Jersey, New York and Texas -- have some sort of legislation in place requiring seat belts on school buses. The states’ laws vary in levels of enforcement; some simply require two-point seat belts to be present on school buses, while others require that all passengers use the more secure, three-point belts.
51 Intoxicated drivers show poor judgement in numerous ways. Data on seat belt use is difficult to verify, but the information shows interesting relationships. Ignoring the non-reported seat belt use, for drivers in fatal crashes that have some amount of alcohol or drugs in their system, 70 percent were found to have used their seat belt during the day time and evening, but in the late-night only 53 percent were found to use the seat belt in this time period. In addition, drivers using alcohol or drugs were more likely to be identified as speeding in the late-night compared to the day and evening. This is reasonable because increased levels of traffic limit the upper speed that a car can achieve (but it does not prevent drivers from driving too fast for conditions). Drivers who choose not to wear seat belts are also cited for driving too fast more often than the intoxicated drivers who choose to use their seat belts. This varies between nearly 20 percent in the late-night when there are relatively more speeding issues identified, to over 70 percent higher evening hours.
Page 29 of 56 Traffic Safety White Paper
Figure 11. Prevalence of alcohol and drug use in fatal crashes, CMAP region, 2010 - 2014
Source: CMAP analysis of IDOT crash data. Note: BAC = blood alcohol content
Penalties and enforcement
Roads cannot be made completely safe for intoxicated drivers or the persons they affect.
Instead, according to the NHTSA’s Countermeasures That Work, a combination of behavioral
strategies are needed to reduce DUI:
• Deterrence: enact, publicize, enforce, and adjudicate laws prohibiting alcohol-impaired
driving so that people choose not to drive impaired;
• Prevention: reduce drinking and keep drinkers from driving;
• Communications and outreach: inform the public of the dangers of impaired driving
and establish positive social norms that make driving while impaired unacceptable; and
• Alcohol treatment: reduce alcohol dependency or addiction among drivers.52
In general, Illinois’ DUI laws follow best practices in comparison to those studied in
Countermeasures That Work and may be considered an effective element of overall deterrence.
52 “Countermeasures That Work,” 2015, p. 1-4 NHTSA, accessed October 2017. https://mcs.nhtsa.gov/index.cfm?fuseaction=product.display&product_ID=1069
Page 30 of 56 Traffic Safety White Paper
Improvement could potentially be made in enforcing and adjudicating the laws, however. One
of the most effective enforcement strategies is to expand the use of sobriety checkpoints. They
are meant to be publicized, highly visible reminders of the consequences of drunk driving that
deter rather than catch impaired drivers.53 They have been shown to reduce alcohol-related fatal
crashes by 9 – 17 percent.54 To some extent, local police already have sobriety checkpoints, but
putting additional resources toward expanding them would have a significant effect on fatal
crashes. They are relatively costly to carry out, but NHTSA has prepared guidelines on how to
conduct low-staffing and therefore low-cost checkpoints. Saturation patrols in areas where
drunk driving is anticipated can also be effective. Note that DUI enforcement through location-
specific measures also raises equity issues, as it can disproportionately affect minority areas
unless appropriately designed.55
Law enforcement communities should consider supporting officer training to detect the
presence of other drugs that affect drivers. In the future, supplying officers with the most
advanced drug testing equipment will augment the field sobriety tests and allow them to make
more accurate judgments concerning a person’s fitness to drive .56. The Governors Highway
Safety Association has called on states to take action on drug-impaired driving. 57
State law in Illinois provides severe punishment for DUI convictions.58 While further increasing
penalties has some intuitive attractiveness, evidence suggests making penalties for drunk
driving incrementally more severe has little additional deterrent value; focusing instead on
making punishment swift and sure is a more effective strategy.59 For that reason, Illinois law
allows for administrative license revocation (ALR) by the Secretary of State immediately upon
arrest for DUI along with a separate license revocation that is dependent on being convicted.
This is a well-supported and effective countermeasure. However, it is possible that the law does
not have its full deterrent effect because ALR is not in fact automatically applied. Evidence
suggests “plea deals” are used in certain counties and municipalities that end up allowing DUI
53 Media coverage has sometimes focused on the apparent ineffectiveness of checkpoints based on the number of DUI arrests – for instance, “Sobriety checkpoints yield thousands of minor citations but few DUI arrests,” Chicago Tribune, May 8, 2015—when the main goal is deterrence.
54 “Countermeasures That Work, p. 1-21,” NHTSA, accessed October 2017.
https://www.nhtsa.gov/staticfiles/nti/pdf/811727.pdf
55 Caputo, Angela “Analysis of Chicago DUI checkpoints shows minority disparity,” Chicago Tribune, May 6, 2015,
accessed October 2017. www.chicagotribune.com/news/.../ct-dui-checkpoints-chicago-met-20150507-story.ht...
56 “Drugs and driving: the law,” Gov.UK, Accessed October 2017 https://www.gov.uk/drug-driving-law
57 “New Report Calls States to Take Action on Drug-Impaired Driving,” Governors Highway Safety Association,
accessed July 2017. http://www.ghsa.org/resources/news-releases/duid-update17
58 “625 ILCS 5/11-501,” Illinois State Statutes, accessed October 2017.
https://www.ilga.gov/legislation/ilcs/fulltext.asp?DocName=062500050K11-501
59 “Countermeasures That Work,” p. 1-10, NHTSA, accessed October 2017. https://www.nhtsa.gov/staticfiles/nti/pdf/811727.pdf
Page 31 of 56 Traffic Safety White Paper
arrestees to drive again, even some with prior DUI arrests.60 It may be that ALR is not uniformly
applied because it is considered too harsh for first-time offenders, which most DUI offenders
(86 percent) are.61 However, most serious injury and fatal crashes that are caused by DUI
involve drivers who have not previously been arrested for DUI, so deterring them is critical.62
Another potential approach to reduce DUI crashes is to further lower BAC limits, as the NTSB
has recommended and that many industrialized countries have adopted.63 Across the US, every
state enforces a BAC value of 0.08 grams of alcohol per deciliter of blood, with the exception of
Utah which has a lower limit of 0.05. . It is estimated that a BAC of 0.05 doubles the risk of a
driver being involved in a crash64.Lowering the BAC limit to 0.05 may discourage drivers from
drinking anything or may make responsible drivers drink less when they have to drive.
Currently seven percent of the drivers in fatal crashes have some amount of alcohol in their
system, but below the legal limit It is not known if the small amount of alcohol in their system
led to the fatal crash, but it can be assumed that a BAC value of 0.05 will prevent some fatal
crashes among this seven percent of all fatalities. However, given the much larger number of
people who violate the less lenient standard, it seems apparent that applying the current law
more assuredly would be more effective than making a new lower standard.
Technology
As in the case of seat belts, more universally tying vehicle operability to passing a breathalyzer
test would likely have a much larger impact than anything else. NHTSA has spent several years
working on the Driver Alcohol Detection System for Safety (DADSS) program, which is meant
to find technologies that would accomplish that goal without inconvenience or intrusiveness.
Given the fact that alcohol interlock devices are required after conviction, they currently only
address the problem of repeat offenders, which represent a relatively small number of the DUI
driver population. As a nearer-term option, drivers could be required to carry disposable
breathalyzers in their vehicles as has been mandatory in France since 2012, which may remind
and provide the means for drivers to voluntarily test themselves before driving. Proof could be
required at any traffic stop. The effectiveness of this requirement should be studied as it would
likely face limited public acceptance in the United States.
60 Gregory, Ted. Mahr, Joe “DUI plea deals sidestep mandatory license loss,” Chicago Tribune, September 6, 2014, http://www.chicagotribune.com/news/ct-dui-deals-met-20140905-story.html
61 “Illinois 2017 DUI Fact Book,” Illinois Fact Book, Accessed (October, 2017). https://www.cyberdriveillinois.com/publications/pdf_publications/dsd_a118.pdf.
62 Jones, Ralph K., Lacey, John H.,” State of Knowledge of Alcohol-Impaired Driving: Research on Repeat DWI Offenders,” accessed October 2017. http://www.popcenter.org/problems/drunk_driving/PDFs/Jones&Lacey_2000.pdf
63“Safety Report on Eliminating Impaired Driving - Frequently Asked Questions,” NTSB, accessed October 2017. https://www.ntsb.gov/news/events/Pages/2013_Impaired_Driving_BMG-FAQs.aspx
64“Drug and Alcohol Crash Risk,” NHTSA, DOTHS812117 February 2015, accessed December 2017 https://www.nhtsa.gov/staticfiles/nti/pdf/812117-Drug_and_Alcohol_Crash_Risk.pdf
Page 32 of 56 Traffic Safety White Paper
Other technologies and transportation innovations may have an influence on drunk driving.
Transportation network companies have claimed that their service reduces drunk driving,
which has been supported in some studies but not in others.65 Vehicle automation may
ultimately raise numerous issues regarding the proper application of DUI laws.
Intersections Intersections are one of the most dangerous elements of the transportation network. The
numerous turning movements at intersections create several conflict points between users that
result in an increased risk of being involved in a serious injury or fatal crash. For the last five
years, almost half of serious injury and fatal crashes have occurred at intersections, and about
one-fifth of these involved a pedestrian or bicyclist. For this paper, an intersection crash is a
crash that occurred at or in relation to an intersection according to the IDOT crash report.
In general, consideration of safety countermeasures needs to be driven deeply into the design
process, even for projects motivated mostly by the need to reconstruct the roadway or improve
capacity. Rather than simply building to current standards, which are considered nominally
safe, agencies need to include specific safety countermeasures whenever possible and cost-
effective to substantively improve safety. Numerous safety countermeasures can be
implemented at intersections and there is no one-size-fits-all solution to making an intersection
safer.
Countermeasures Agencies across the region are actively implementing safety counter-measures at intersections
to make them safer for all road users. For example, Kane DOT installed flashing yellow left
turn signals at two intersections on Randall Road. Flashing yellow turn signals are a proven
countermeasure and reduce severe crashes at intersections. Other examples are Lake County
DOT, which is taking an active role in converting intersections to roundabouts, and DuPage
County DOT, which is applying for HSIP funds to add dedicated turning lanes to intersections.
Other safety countermeasures that agencies in the region routinely implement include skid
resistant pavement in and approaching intersections.
When planning for an intersection improvement, agencies should always evaluate ways to
improve the channelization66 of traffic through intersections by providing left- and right-turn
bays. Channelization is an effective safety countermeasure at both signalized and unsignalized
intersections by providing space for vehicles to slow down to make the turning maneuver
65 Brazil, Noli., Kirk, David S..”Uber and Metroplolitan Traffic Fatalities in the United States,” American Journal of Epidemiology, Volume 184, Issue 3, 1 August 2016, Pages 192–198, Accessed (October 2017). https://academic.oup.com/aje/article/184/3/192/2195589,
66 ”Intersection channelization guidelines,” FHWA, accessed October 2017. https://safety.fhwa.dot.gov/intersection/.../Design%20Guidelines%20for%20At-Grade...
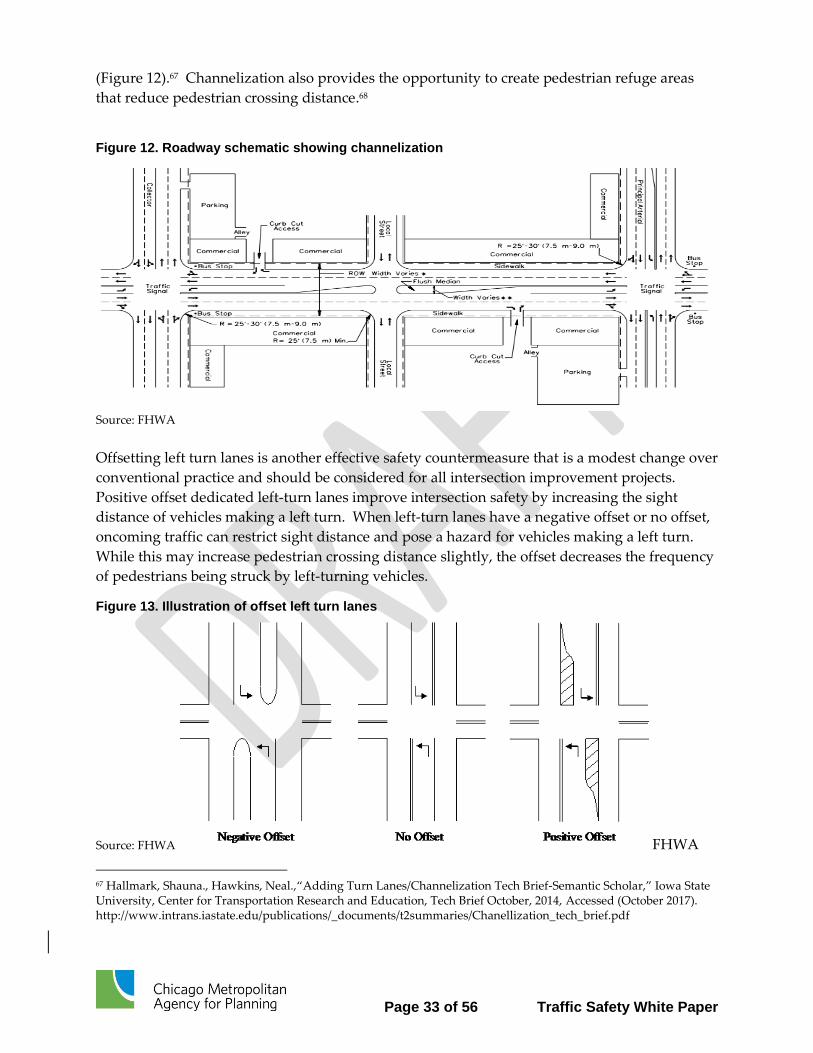
Page 33 of 56 Traffic Safety White Paper
(Figure 12).67 Channelization also provides the opportunity to create pedestrian refuge areas
that reduce pedestrian crossing distance.68
Figure 12. Roadway schematic showing channelization
Source: FHWA
Offsetting left turn lanes is another effective safety countermeasure that is a modest change over
conventional practice and should be considered for all intersection improvement projects.
Positive offset dedicated left-turn lanes improve intersection safety by increasing the sight
distance of vehicles making a left turn. When left-turn lanes have a negative offset or no offset,
oncoming traffic can restrict sight distance and pose a hazard for vehicles making a left turn.
While this may increase pedestrian crossing distance slightly, the offset decreases the frequency
of pedestrians being struck by left-turning vehicles.
Figure 13. Illustration of offset left turn lanes
Source: FHWA FHWA
67 Hallmark, Shauna., Hawkins, Neal.,“Adding Turn Lanes/Channelization Tech Brief-Semantic Scholar,” Iowa State University, Center for Transportation Research and Education, Tech Brief October, 2014, Accessed (October 2017). http://www.intrans.iastate.edu/publications/_documents/t2summaries/Chanellization_tech_brief.pdf
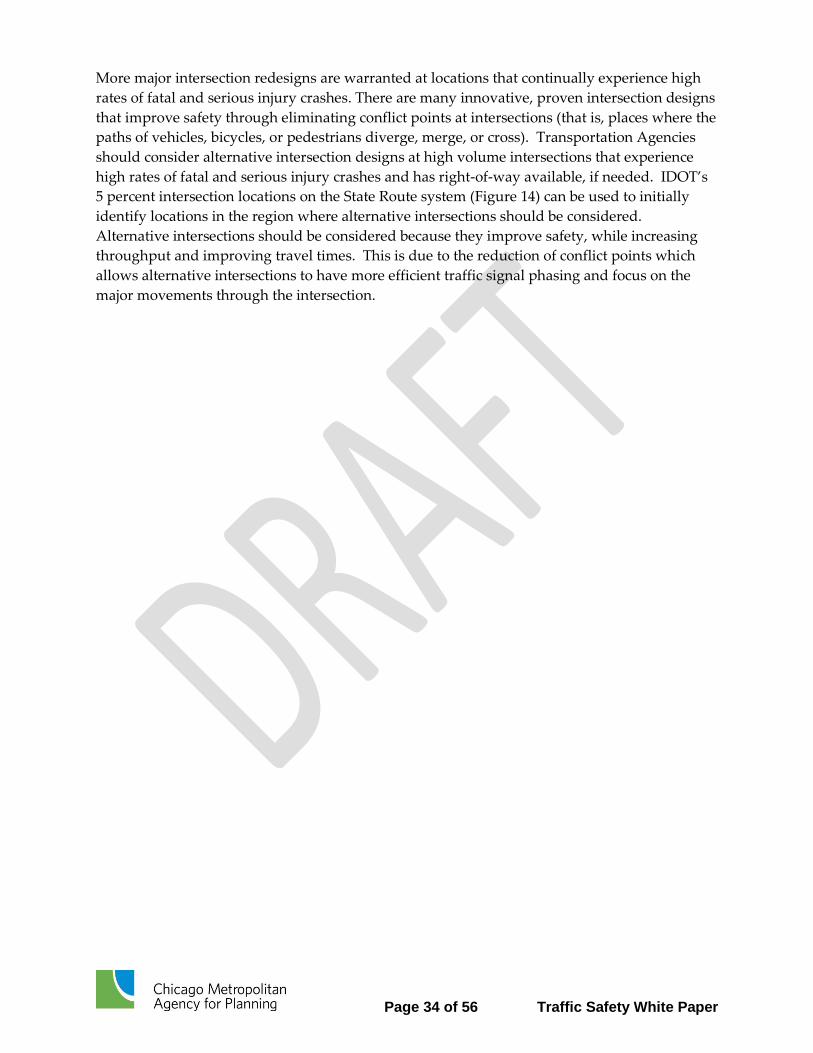
Page 34 of 56 Traffic Safety White Paper
More major intersection redesigns are warranted at locations that continually experience high
rates of fatal and serious injury crashes. There are many innovative, proven intersection designs
that improve safety through eliminating conflict points at intersections (that is, places where the
paths of vehicles, bicycles, or pedestrians diverge, merge, or cross). Transportation Agencies
should consider alternative intersection designs at high volume intersections that experience
high rates of fatal and serious injury crashes and has right-of-way available, if needed. IDOT’s
5 percent intersection locations on the State Route system (Figure 14) can be used to initially
identify locations in the region where alternative intersections should be considered.
Alternative intersections should be considered because they improve safety, while increasing
throughput and improving travel times. This is due to the reduction of conflict points which
allows alternative intersections to have more efficient traffic signal phasing and focus on the
major movements through the intersection.
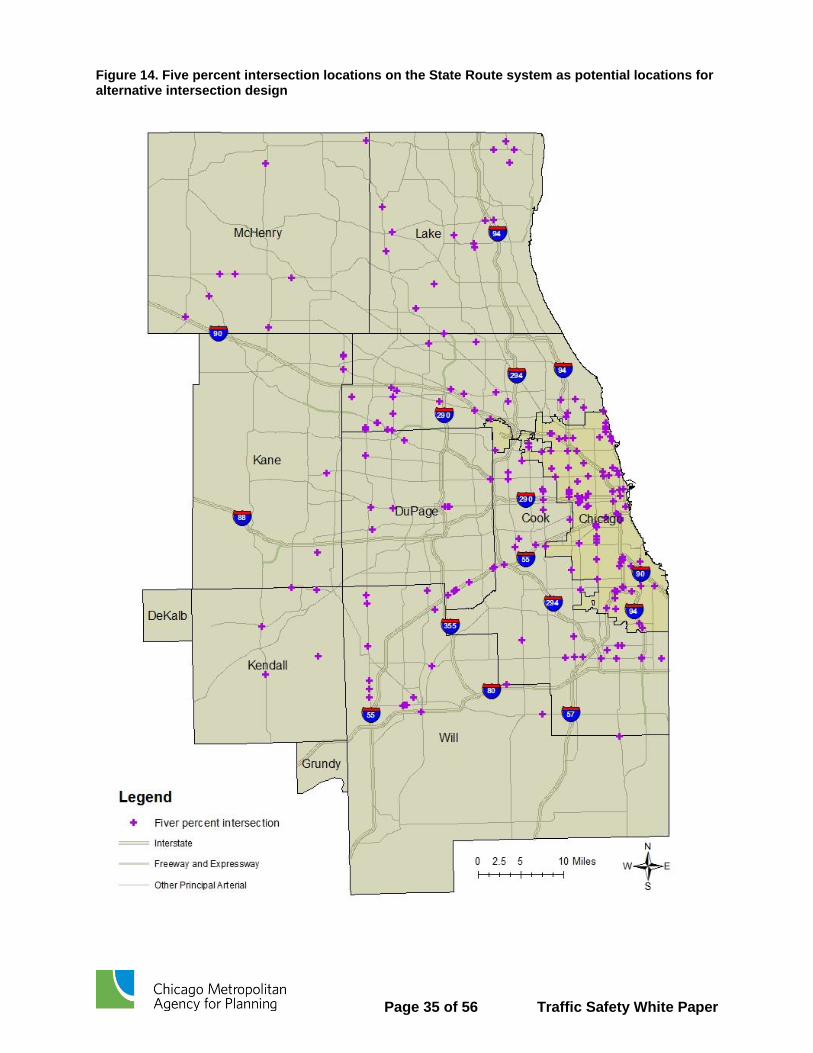
Page 35 of 56 Traffic Safety White Paper
Figure 14. Five percent intersection locations on the State Route system as potential locations for alternative intersection design
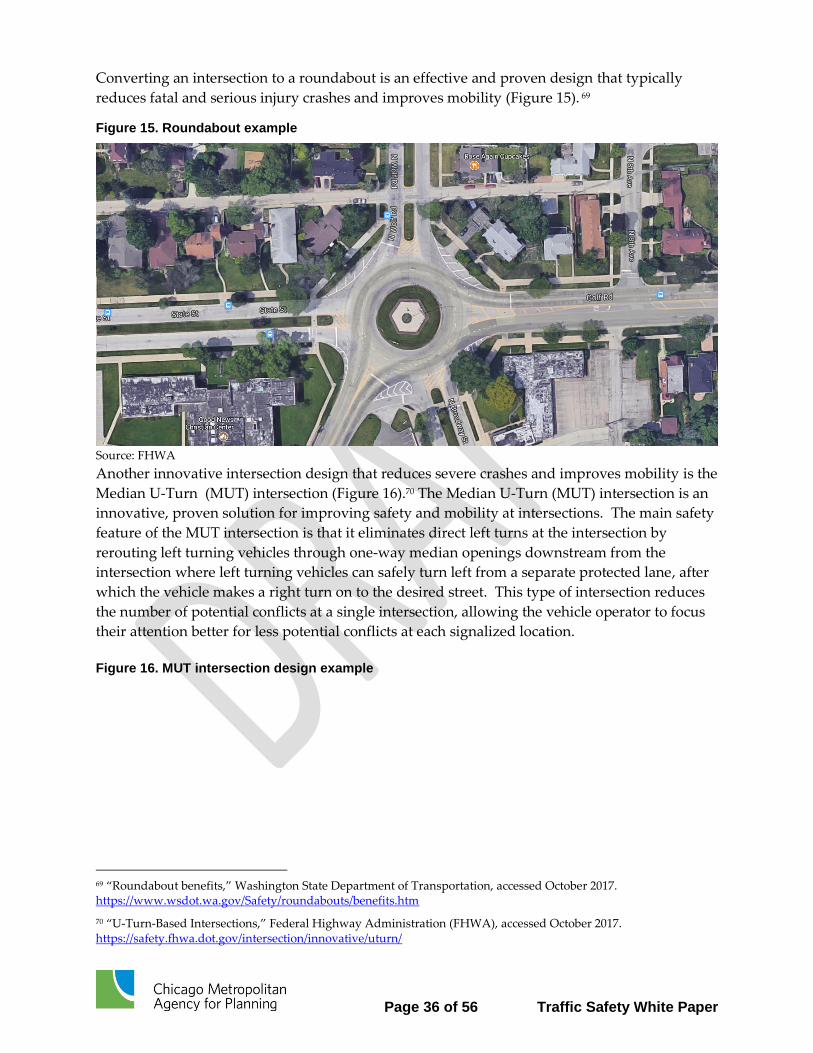
Page 36 of 56 Traffic Safety White Paper
Converting an intersection to a roundabout is an effective and proven design that typically
reduces fatal and serious injury crashes and improves mobility (Figure 15). 69
Figure 15. Roundabout example
Source: FHWA
Another innovative intersection design that reduces severe crashes and improves mobility is the
Median U-Turn (MUT) intersection (Figure 16).70 The Median U-Turn (MUT) intersection is an
innovative, proven solution for improving safety and mobility at intersections. The main safety
feature of the MUT intersection is that it eliminates direct left turns at the intersection by
rerouting left turning vehicles through one-way median openings downstream from the
intersection where left turning vehicles can safely turn left from a separate protected lane, after
which the vehicle makes a right turn on to the desired street. This type of intersection reduces
the number of potential conflicts at a single intersection, allowing the vehicle operator to focus
their attention better for less potential conflicts at each signalized location.
Figure 16. MUT intersection design example
69 “Roundabout benefits,” Washington State Department of Transportation, accessed October 2017. https://www.wsdot.wa.gov/Safety/roundabouts/benefits.htm
70 “U-Turn-Based Intersections,” Federal Highway Administration (FHWA), accessed October 2017. https://safety.fhwa.dot.gov/intersection/innovative/uturn/
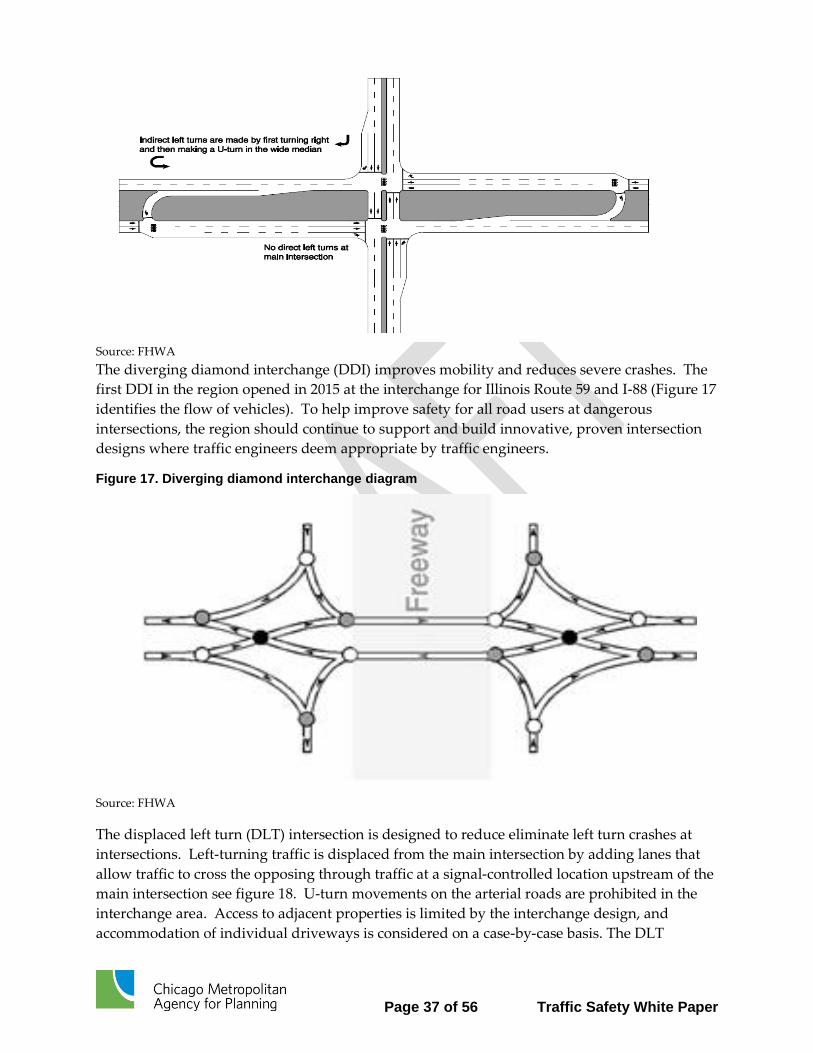
Page 37 of 56 Traffic Safety White Paper
Source: FHWA
The diverging diamond interchange (DDI) improves mobility and reduces severe crashes. The
first DDI in the region opened in 2015 at the interchange for Illinois Route 59 and I-88 (Figure 17
identifies the flow of vehicles). To help improve safety for all road users at dangerous
intersections, the region should continue to support and build innovative, proven intersection
designs where traffic engineers deem appropriate by traffic engineers.
Figure 17. Diverging diamond interchange diagram
Source: FHWA
The displaced left turn (DLT) intersection is designed to reduce eliminate left turn crashes at
intersections. Left-turning traffic is displaced from the main intersection by adding lanes that
allow traffic to cross the opposing through traffic at a signal-controlled location upstream of the
main intersection see figure 18. U-turn movements on the arterial roads are prohibited in the
interchange area. Access to adjacent properties is limited by the interchange design, and
accommodation of individual driveways is considered on a case-by-case basis. The DLT
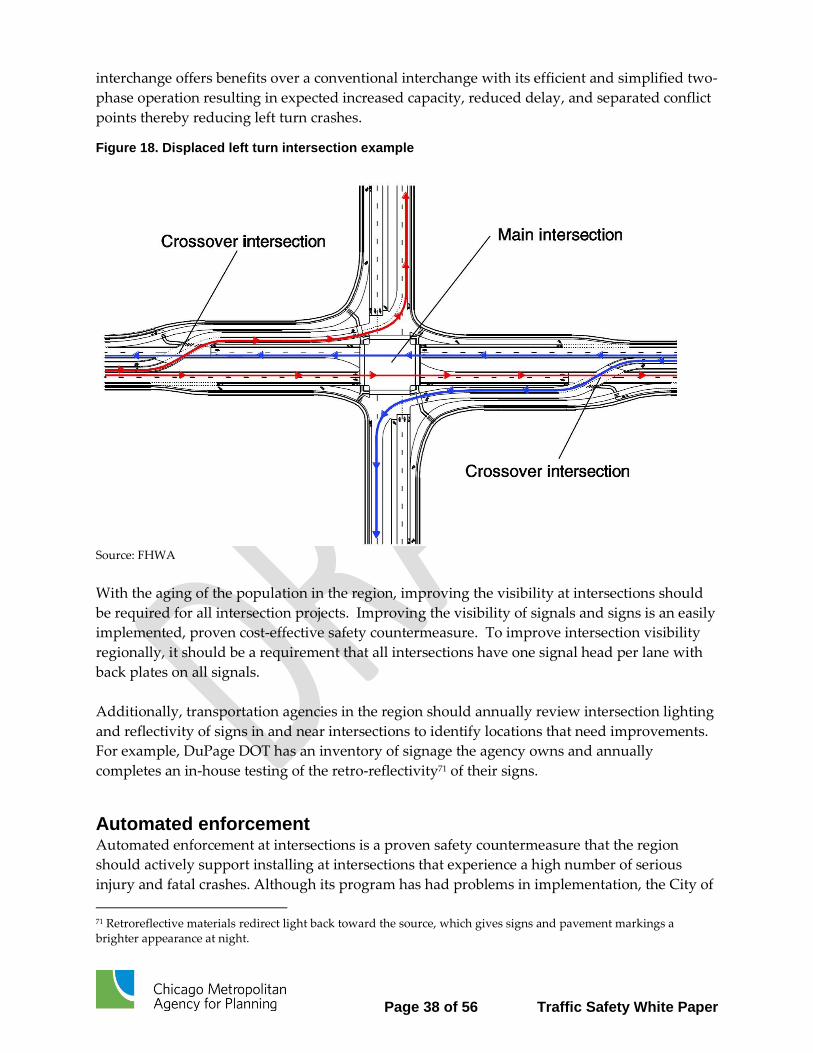
Page 38 of 56 Traffic Safety White Paper
interchange offers benefits over a conventional interchange with its efficient and simplified two-
phase operation resulting in expected increased capacity, reduced delay, and separated conflict
points thereby reducing left turn crashes.
Figure 18. Displaced left turn intersection example
Source: FHWA
With the aging of the population in the region, improving the visibility at intersections should
be required for all intersection projects. Improving the visibility of signals and signs is an easily
implemented, proven cost-effective safety countermeasure. To improve intersection visibility
regionally, it should be a requirement that all intersections have one signal head per lane with
back plates on all signals.
Additionally, transportation agencies in the region should annually review intersection lighting
and reflectivity of signs in and near intersections to identify locations that need improvements.
For example, DuPage DOT has an inventory of signage the agency owns and annually
completes an in-house testing of the retro-reflectivity71 of their signs.
Automated enforcement Automated enforcement at intersections is a proven safety countermeasure that the region
should actively support installing at intersections that experience a high number of serious
injury and fatal crashes. Although its program has had problems in implementation, the City of
71 Retroreflective materials redirect light back toward the source, which gives signs and pavement markings a brighter appearance at night.
Page 39 of 56 Traffic Safety White Paper
Chicago has taken a very active role in intersection safety with red light camera (RLC)
enforcement that has a goal to reduce angle (“T-bone”) crashes, one of the most hazardous
types of crashes at intersections. A study conducted by the Northwestern University
Transportation Center found that a RLC placed at an intersection reduces angle and turn
crashes by 19 percent, and increases rear-end crashes by 14 percent.72 Angle and turn crashes
tend to be more severe than rear-end crashes. Data collected from five municipalities in the
City of Toronto found that collisions resulting in deaths and personal injuries were reduced by
more than 25 percent at intersections with automated enforcement.73 Another study that
evaluated red light cameras at four to six intersections in San Francisco found that injury
crashes decreased by about 9 percent and fatalities were 50 percent lower (although the
numbers are small) using five years of before and after crash data.74 The Insurance Institute for
Highway Safety analyzed 14 cities with red light cameras and 48 cities without red light
cameras. This study found that between 1992-96 and 2004-08, the cities without red light
cameras had a 14 percent reduction in red light running fatalities, but the cites that used the
cameras had a 35% reduction in these types of fatalities.75 The researchers estimated that the red
light cameras that were in service over the 4 years of analysis, prevented crashes that would
have resulted in 83 fatalities.
Roadway departure Roadway departure crashes are very dangerous events and account for the third-most fatalities
of any emphasis area. These crashes include circumstances where a vehicle overturned, hit a
fixed object, sideswiped in opposite direction, or hit a vehicle head-on76. Adding rumble strips
to the edge and center of the lanes will alert the drivers to their danger. Installing large
chevrons to alert drivers about turns in the roads will enhance safety for all drivers. Larger
shoulders will increase the recovery area for drivers who leave the road. Installing cable
barriers will prevent head-on collisions on separated highways. Removing ditches and fixed
objects from roadsides will improve safety as will surrounding fixed objects with crash barrels
and similar devices.
While roadway departure is an emphasis area amenable to engineering solutions to make the
roadway more “forgiving,” behavioral factors are generally behind the departure. Going too
72 Elfar, Amr. Johnson, Breton L. Mahmassani, Hani S. Mittal, ArchakOstojic, Marija. Schofer, Joseph L. Verbas, Omer. “Chicago Red Light Camera Enforcement: Best Practices & Program Road Map, 2017,” Northwestern University Transportation Center, accessed October 2017. http://www.transportation.northwestern.edu/docs/research/RLC-Report-Web.pdf
73 “Red Light Cameras get extended stay on our roads,” City of Toronto Transportation Services, accessed October 2017. http://www1.toronto.ca/wps/portal/contentonly?vgnextoid=17324074781e1410VgnVCM10000071d60f89RCRD,
74 “Impact of Red Light Camera Enforcement on Crash Experience,” NCHRP Synthesis 310, Transportation Research Board, Washington, DC, 2003, accessed October 2017. http://onlinepubs.trb.org/onlinepubs/nchrp/nchrp_syn_310.pdf
75“ Statement before the Ohio State Senate Government Oversight and Reform Committee: Red Light Camera Research” Michael Fagin, JD Insurance Institute for Highway Safety February 19, 2014
76 Head-on collisions typically are addressed by different countermeasures than other types of roadway departure crashes. These categories were combined to match categories that are used in the IDOT Illinois Strategic Highway Safety Plan 2017.
Page 40 of 56 Traffic Safety White Paper
fast was identified as the cause in about one out of five departure crashes with fatalities or
serious injuries. Thus, increased enforcement can decrease the number of drivers traveling at
dangerous speeds and so decrease the incidence of roadway departure. Automated speed
control of vehicles will be an option in the future whether they serve as a waring or actually
limit the speed of a vehicle will have to be debated. Poor driving skills which could be
addressed by additional training, or they could be the result of aggressive driving. As vehicle
technology advances, more vehicles are expected to have lane departure warnings as standard
features, and this will help reduce roadway departure.
The outside environment can cause road departure crashes and about one in eight severe
roadway departure crashes are due to these. Animals, debris in the road, construction, or
unexpected events can lead drivers to veer off the road. This is a mixture of causes and
remedies. Within our region, Cook County has a very large number of crashes involving deer.
Increased warnings may help drivers to be alert for dangerous areas and reducing speeds
would give drivers more time to react, but deer are very common now and it is difficult to
identify where they will be a hazard. Observing the speed limits in construction and
maintenance zones would allow drivers to maintain control of their vehicles more often.
Age of drivers The age of drivers is correlated with risk of crashes and serious injuries or fatalities, with the 20-
to-35-year-old group having the most noticeable number of traffic fatalities.77 Fatalities drop off
as drivers age, then pick up again at advanced ages (Figure 19). Young drivers are less
experienced than older drivers at both the physical tasks of driving and at understanding the
amount of focus on the road that a driver needs to avoid crashes. At the other end of the
experience spectrum, as drivers age, many of their physical skills diminish and the physical task
of driving becomes more challenging. In the near term and medium term, more aged drivers are
expected to be on the road.
77 “Summary of Travel Trends: 2009 National Household Travel Survey,” National Academy of Sciences, accessed October 2017. https://trid.trb.org/view.aspx?id=1107370 Drivers aged 15 to 20 drive less than people who are in the workforce full time, according to the National Household Travel Survey (2009) for drivers aged 16 to 19. The youngest drivers’ crash rate per VMT is probably the highest of the groups under 65 years of age.
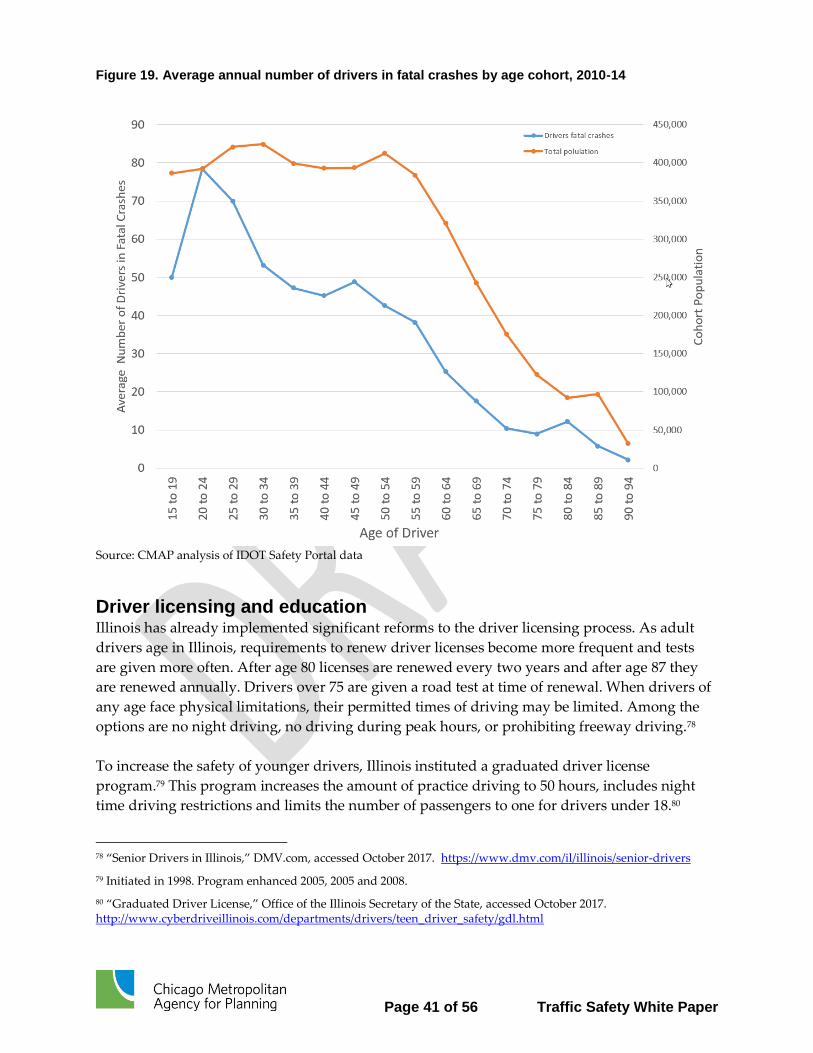
Page 41 of 56 Traffic Safety White Paper
Figure 19. Average annual number of drivers in fatal crashes by age cohort, 2010-14
Source: CMAP analysis of IDOT Safety Portal data
Driver licensing and education Illinois has already implemented significant reforms to the driver licensing process. As adult
drivers age in Illinois, requirements to renew driver licenses become more frequent and tests
are given more often. After age 80 licenses are renewed every two years and after age 87 they
are renewed annually. Drivers over 75 are given a road test at time of renewal. When drivers of
any age face physical limitations, their permitted times of driving may be limited. Among the
options are no night driving, no driving during peak hours, or prohibiting freeway driving.78
To increase the safety of younger drivers, Illinois instituted a graduated driver license
program.79 This program increases the amount of practice driving to 50 hours, includes night
time driving restrictions and limits the number of passengers to one for drivers under 18.80
78 “Senior Drivers in Illinois,” DMV.com, accessed October 2017. https://www.dmv.com/il/illinois/senior-drivers
79 Initiated in 1998. Program enhanced 2005, 2005 and 2008.
80 “Graduated Driver License,” Office of the Illinois Secretary of the State, accessed October 2017. http://www.cyberdriveillinois.com/departments/drivers/teen_driver_safety/gdl.html
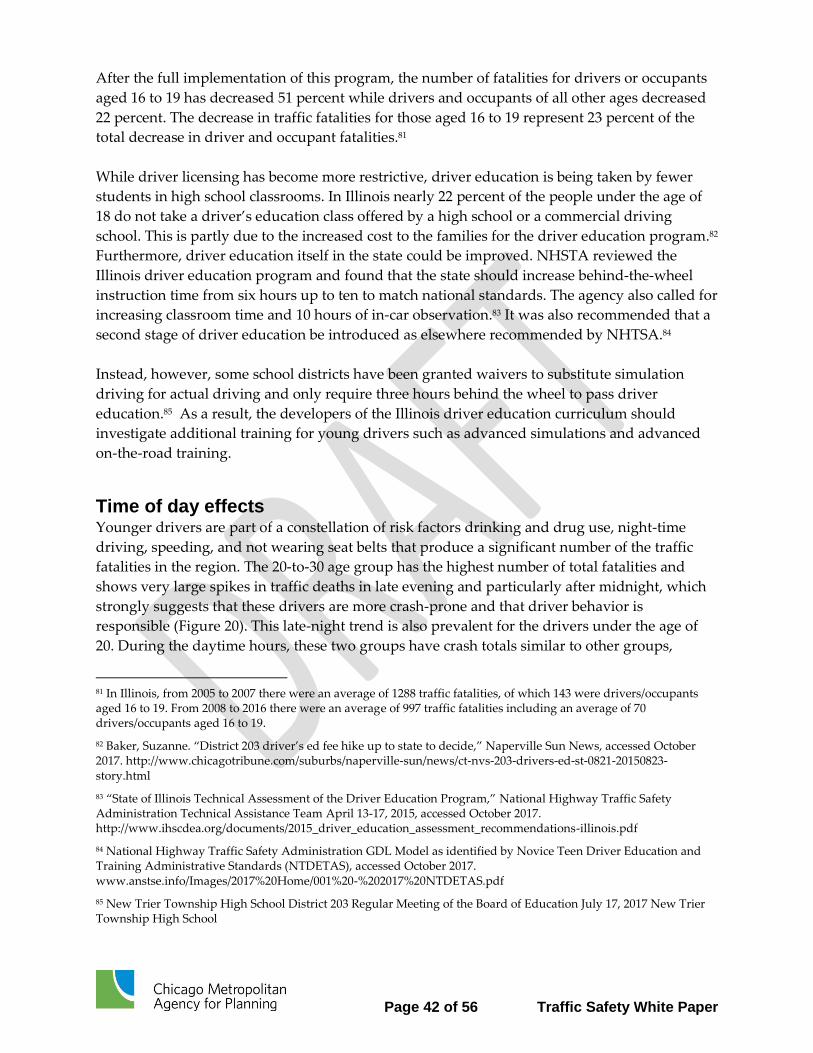
Page 42 of 56 Traffic Safety White Paper
After the full implementation of this program, the number of fatalities for drivers or occupants
aged 16 to 19 has decreased 51 percent while drivers and occupants of all other ages decreased
22 percent. The decrease in traffic fatalities for those aged 16 to 19 represent 23 percent of the
total decrease in driver and occupant fatalities.81
While driver licensing has become more restrictive, driver education is being taken by fewer
students in high school classrooms. In Illinois nearly 22 percent of the people under the age of
18 do not take a driver’s education class offered by a high school or a commercial driving
school. This is partly due to the increased cost to the families for the driver education program.82
Furthermore, driver education itself in the state could be improved. NHSTA reviewed the
Illinois driver education program and found that the state should increase behind-the-wheel
instruction time from six hours up to ten to match national standards. The agency also called for
increasing classroom time and 10 hours of in-car observation.83 It was also recommended that a
second stage of driver education be introduced as elsewhere recommended by NHTSA.84
Instead, however, some school districts have been granted waivers to substitute simulation
driving for actual driving and only require three hours behind the wheel to pass driver
education.85 As a result, the developers of the Illinois driver education curriculum should
investigate additional training for young drivers such as advanced simulations and advanced
on-the-road training.
Time of day effects Younger drivers are part of a constellation of risk factors drinking and drug use, night-time
driving, speeding, and not wearing seat belts that produce a significant number of the traffic
fatalities in the region. The 20-to-30 age group has the highest number of total fatalities and
shows very large spikes in traffic deaths in late evening and particularly after midnight, which
strongly suggests that these drivers are more crash-prone and that driver behavior is
responsible (Figure 20). This late-night trend is also prevalent for the drivers under the age of
20. During the daytime hours, these two groups have crash totals similar to other groups,
81 In Illinois, from 2005 to 2007 there were an average of 1288 traffic fatalities, of which 143 were drivers/occupants aged 16 to 19. From 2008 to 2016 there were an average of 997 traffic fatalities including an average of 70 drivers/occupants aged 16 to 19.
82 Baker, Suzanne. “District 203 driver’s ed fee hike up to state to decide,” Naperville Sun News, accessed October 2017. http://www.chicagotribune.com/suburbs/naperville-sun/news/ct-nvs-203-drivers-ed-st-0821-20150823-story.html
83 “State of Illinois Technical Assessment of the Driver Education Program,” National Highway Traffic Safety Administration Technical Assistance Team April 13-17, 2015, accessed October 2017. http://www.ihscdea.org/documents/2015_driver_education_assessment_recommendations-illinois.pdf
84 National Highway Traffic Safety Administration GDL Model as identified by Novice Teen Driver Education and Training Administrative Standards (NTDETAS), accessed October 2017. www.anstse.info/Images/2017%20Home/001%20-%202017%20NTDETAS.pdf
85 New Trier Township High School District 203 Regular Meeting of the Board of Education July 17, 2017 New Trier Township High School
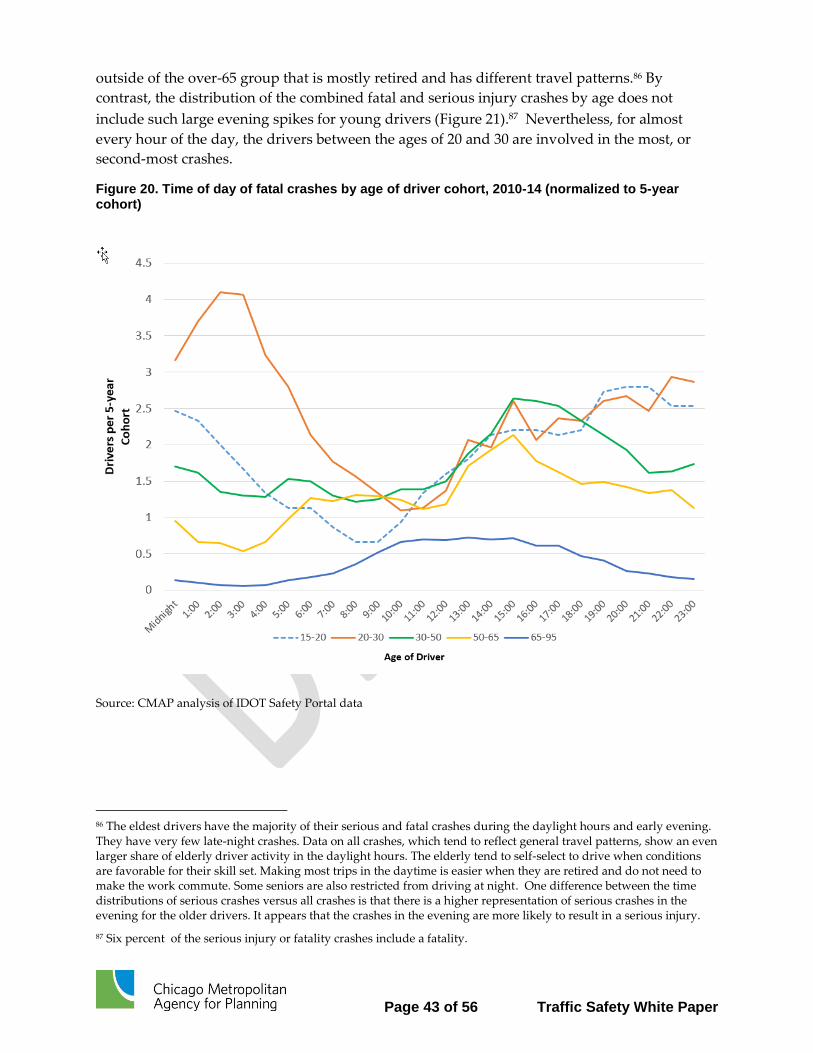
Page 43 of 56 Traffic Safety White Paper
outside of the over-65 group that is mostly retired and has different travel patterns.86 By
contrast, the distribution of the combined fatal and serious injury crashes by age does not
include such large evening spikes for young drivers (Figure 21).87 Nevertheless, for almost
every hour of the day, the drivers between the ages of 20 and 30 are involved in the most, or
second-most crashes.
Figure 20. Time of day of fatal crashes by age of driver cohort, 2010-14 (normalized to 5-year cohort)
Source: CMAP analysis of IDOT Safety Portal data
86 The eldest drivers have the majority of their serious and fatal crashes during the daylight hours and early evening. They have very few late-night crashes. Data on all crashes, which tend to reflect general travel patterns, show an even larger share of elderly driver activity in the daylight hours. The elderly tend to self-select to drive when conditions are favorable for their skill set. Making most trips in the daytime is easier when they are retired and do not need to make the work commute. Some seniors are also restricted from driving at night. One difference between the time distributions of serious crashes versus all crashes is that there is a higher representation of serious crashes in the evening for the older drivers. It appears that the crashes in the evening are more likely to result in a serious injury.
87 Six percent of the serious injury or fatality crashes include a fatality.
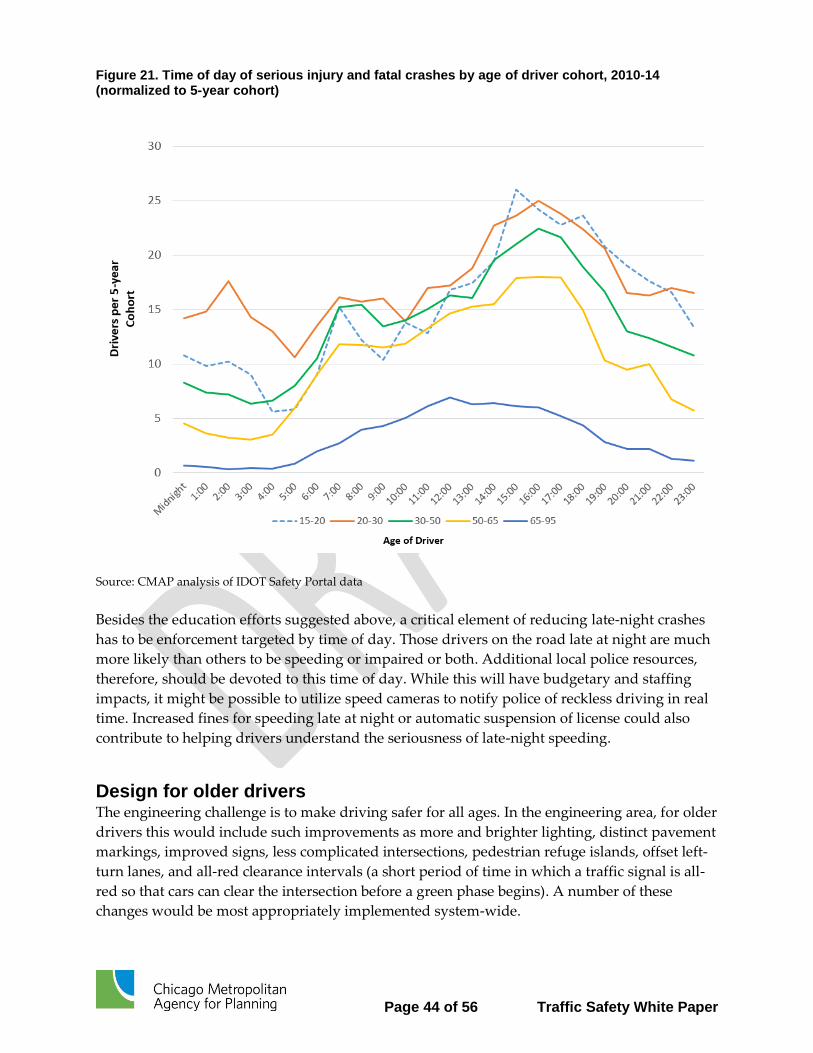
Page 44 of 56 Traffic Safety White Paper
Figure 21. Time of day of serious injury and fatal crashes by age of driver cohort, 2010-14 (normalized to 5-year cohort)
Source: CMAP analysis of IDOT Safety Portal data
Besides the education efforts suggested above, a critical element of reducing late-night crashes
has to be enforcement targeted by time of day. Those drivers on the road late at night are much
more likely than others to be speeding or impaired or both. Additional local police resources,
therefore, should be devoted to this time of day. While this will have budgetary and staffing
impacts, it might be possible to utilize speed cameras to notify police of reckless driving in real
time. Increased fines for speeding late at night or automatic suspension of license could also
contribute to helping drivers understand the seriousness of late-night speeding.
Design for older drivers The engineering challenge is to make driving safer for all ages. In the engineering area, for older
drivers this would include such improvements as more and brighter lighting, distinct pavement
markings, improved signs, less complicated intersections, pedestrian refuge islands, offset left-
turn lanes, and all-red clearance intervals (a short period of time in which a traffic signal is all-
red so that cars can clear the intersection before a green phase begins). A number of these
changes would be most appropriately implemented system-wide.
Page 45 of 56 Traffic Safety White Paper
Distracted drivers Distractions to drivers cause crashes, and recent advances in technology have increased the
number of things that can distract drivers. However, it is not known with much precision how
many crashes are due to distraction or if it is becoming more of a problem. For the nation, 2014
crash and fatality data implicate driver distraction in 10 percent of fatal crashes, 18 percent of
injury crashes, and 16 percent of all motor vehicle traffic crashes in 2014.88 However,
information on distracted driving crashes has only recently begun to be collected and it is
difficult to determine the accuracy of crash data that tracks this behavior.89 Other studies have
suggested that up to 25 percent of crashes involve distraction.90 It is estimated that at any point
in time, about 7 percent of US drivers are using their cell phones.91
Reducing distracted driving likely requires a combination of improved education, enforcement,
and changes in vehicle and phone technology. In some US states, crashes with injuries where
cell phone use was identified are prosecuted like reckless driving or DUI cases. Illinois has
made texting while driving a primary offense with a fine starting at $75 but allows “hands-free”
use of communication devices. By comparison, in the UK a first-time offender now faces a fine
of approximately $250 and six “points” on their driver’s license, compared to the three points a
driver would get for speeding. (Six points for someone who has been driving for less than two
years would mean an automatic loss of their license, while older drivers are only allowed 12
points before they would lose their license.) Interestingly, Sweden, which has a very low fatal
crash rate, does not ban cell phone use, but instead focuses on educating its drivers on the
dangers of distracted driving and appropriate ways to use cell phone technology.
There are many ways phones themselves could limit their own use by drivers. An app is
available that prevents a phone from chiming if a person is driving.92 But phone companies
could also offer “driver mode,” or they could turn off texting or other functions if a navigation
app is on, among many other possibilities. This is an area the federal government should take
the lead in regulating.
88 Traffic Safety Facts Research Note: Distracted Driving 2014
89 People who survive crashes need to self-report their distraction as a cause of a crash. If phone records are available, it is challenging to match them with the exact moment of a crash. There are electronic methods that may provide information on electronic device use in a vehicle, but this will not be the complete story of distractions in crashes.
90 “Technology Transfer: Distracted Driving – Overview Summary of Ways to Alleviate (Project # 2016-013),” Southeastern Transportation Research, Innovation, Development, and Education Center (STRIDE) 2017, accessed October 2017. https://trid.trb.org/view/1473669
91 “Hands-free is not Risk-free,”National Safety Council, accessed October 2017. http://www.nsc.org/learn/NSC-Initiatives/Pages/distracted-driving-hands-free-is-not-risk-free-infographic.aspx
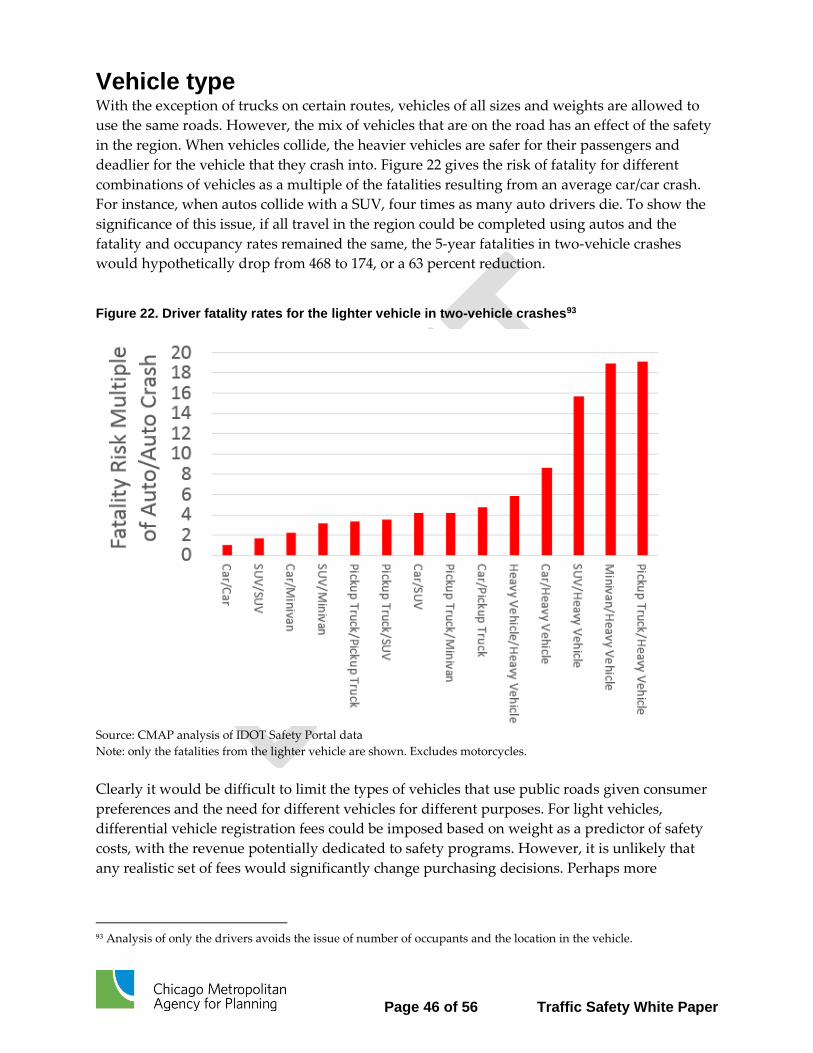
Page 46 of 56 Traffic Safety White Paper
Vehicle type With the exception of trucks on certain routes, vehicles of all sizes and weights are allowed to
use the same roads. However, the mix of vehicles that are on the road has an effect of the safety
in the region. When vehicles collide, the heavier vehicles are safer for their passengers and
deadlier for the vehicle that they crash into. Figure 22 gives the risk of fatality for different
combinations of vehicles as a multiple of the fatalities resulting from an average car/car crash.
For instance, when autos collide with a SUV, four times as many auto drivers die. To show the
significance of this issue, if all travel in the region could be completed using autos and the
fatality and occupancy rates remained the same, the 5-year fatalities in two-vehicle crashes
would hypothetically drop from 468 to 174, or a 63 percent reduction.
Figure 22. Driver fatality rates for the lighter vehicle in two-vehicle crashes93
Source: CMAP analysis of IDOT Safety Portal data
Note: only the fatalities from the lighter vehicle are shown. Excludes motorcycles.
Clearly it would be difficult to limit the types of vehicles that use public roads given consumer
preferences and the need for different vehicles for different purposes. For light vehicles,
differential vehicle registration fees could be imposed based on weight as a predictor of safety
costs, with the revenue potentially dedicated to safety programs. However, it is unlikely that
any realistic set of fees would significantly change purchasing decisions. Perhaps more
93 Analysis of only the drivers avoids the issue of number of occupants and the location in the vehicle.
Page 47 of 56 Traffic Safety White Paper
significant would be road user charges, particularly a VMT fee, that incorporates differential
safety impacts for larger vehicles per mile traveled.
From the standpoint of focusing on the biggest risks, keeping the heaviest vehicles apart from
the lighter cars would save lives. Given that truck traffic, including both over-the-road and
delivery truck traffic, is expected to increase faster than auto traffic, this issue will likely
worsen. Designating truck routes (where geometric design would improve driving conditions
for trucks) coupled with signage that encourages other drivers to seek other routes is a good
option and has been proposed in the region by CMAP in the ON To 2050 Report titled; O’Hare
Subregion Truck Routing and Infrastructure July, 2017. Over the longer term, the region should
seek opportunities to develop truck-only facilities to channel larger volumes of trucks.
Vehicle design and technology can also aid in preventing or reducing the seriousness of certain
crashes involving heavy vehicles. Recently developed side guards on trucks can reduce the
seriousness of pedestrian, bicyclist, and motorcycle crashes, although these affect a fairly
limited94 set of crashes.95 The City of Chicago recently passed an ordinance mandating the
installation of side guards on trucks used by City contractors.
Motorcycle crashes are so dangerous that they need special consideration. Motorcyclists account
for around 14 percent of fatalities in the region annually, yet comprise only 1.4 percent of VMT.
Illinois is one of only three states that has no requirements for riders to wear helmets. While
they certainly will not completely eliminate fatal crashes, motorcycle users should be required
to wear helmets.
Potential CMAP roles
Incorporate safety measures into local programming While numerous actions are needed by the public and private sectors to improve traffic safety,
CMAP may have a particular role in some areas. One role is incorporating safety performance
as a larger priority in transportation project selection, which builds upon CMAP’s role in project
selection for locally programmed federal funds. Incorporating safety performance measures
into programming decisions will help achieve regional safety targets and make sure this vital
aspect of transportation receives adequate consideration.
94 Based on 2015 crash data for the Chicago region, there were 22 bicyclist fatalities, of which 2 were identified as involving a “Truck Single Unit” or a “Tractor with Semi-Trailer”. One additional fatality involved a “Van/Mini-Van” that was determined to be a commercial vehicle. Of the 383 vehicles involved in crashes with a fatality of serious injury to a bicyclist, 7 were with trucks and 3 additional vehicles were vans identified as commercial. For all bicyclist crashes, 1.8% involve one of these vehicles with 25% of these crashes involving a side impact. When bicyclist collide with the side of a truck, the risk of a fatality is very high.
95 “Truck Side Guards Resource Page,” Volpe Center, accessed October 2017. https://www.volpe.dot.gov/our-work/truck-side-guards-resource-page
Page 48 of 56 Traffic Safety White Paper
Highway projects funded with CMAQ Since the region does not meet federal air quality standards for ozone, the region receives
Congestion Mitigation and Air Quality (CMAQ) funding to improve air quality and relieve
traffic congestion. Even though the primary measure for evaluating CMAQ proposals is the
cost-effectiveness of air emissions reductions, CMAP has successfully incorporated other
performance measures, with safety being one of the highway measures, into CMAQ
programming decisions, starting informally in the 2014-18 cycle and formally in the 2016 – 2020
cycle.
In the CMAQ program, the safety performance measure is an all-or-nothing measure where
according to the CMAQ Program Application Booklet “a proposal receives 5 points if the
project addresses an IDOT 5 percent report location and 0 if it does not.” The IDOT 5 percent
report identifies high priority locations on the road network where highway safety, particularly
fatal and serious injury crashes, is an issue.
Going forward, a more thorough evaluation of potential safety benefit should be incorporated
into the programming process. Not only should a proposed project be located at a high-crash
location, the project should also include proven safety countermeasures that would help
improve safety at the location. The safety evaluation would apply only to proposed highway
and bicycle projects. There are several possible approaches to this. One would be to use crash
modification factors and the details of the project to estimate the crash reduction benefits, then
convert the raw crash reduction value or cost-effectiveness of crash reduction into a weighted
score like the other factors used in the CMAQ scoring process. Another approach would be to
identify a specific list of safety countermeasures for sponsors to evaluate during engineering.
For any countermeasure with a benefit-cost ratio greater than one, that countermeasure would
be required to be part of the project design. Alternatively different counter-measures could
simply be assigned point values in the scoring process without estimating the benefit-cost ratio.
Examples of specific safety countermeasures for intersection improvement projects include
signal heads over all lanes, offset left-turn lanes, flashing yellow left turn signals, all-red
clearance interval, or an exclusive pedestrian phase. CMAP would work in consultation with
partner agencies to develop a list of proven and innovative safety countermeasures for the
CMAQ programming process. For any approach, IDOT’s evaluation techniques for HSIP would
likely be adapted for CMAQ. These requirements could realistically be added to project scoring,
as preliminary engineering already has to be complete before project selection.
Highway projects funded with local STP The local Surface Transportation Program, which funds transportation improvement projects on
any federal aid eligible road, also should evaluate candidate projects for their safety benefits.
Most of the Councils of Mayors already have a measure of safety factored into their project
selection methodologies. The safety scores account for 10 to 25 percent of the point totals. Six of
the councils compare the three-year average of a facility to IDOT’s average for that classification
of roadway. Two councils consider bicycle and pedestrian crashes in addition to automobile
crashes, while other councils give additional points if a project will specifically address an at-
Page 49 of 56 Traffic Safety White Paper
grade crossing or provide for a new alignment. None appears to use IDOT’s 5 percent report
locations.
In order to enhance the consideration of safety in the local STP project selection, CMAP and its
partners should collaborate in the development of a regional menu of safety countermeasures
that are evaluated, at the Council’s option, during the project selection process. Any of the
approaches recommended for CMAQ above could be used for STP. The menu of safety
countermeasures would be segregated by project type and can be updated on an annual basis to
account for changing trends in the region. Another method of incorporating safety into the local
STP process would be to score proposed projects on the expected crash benefit of the project.
The project implementers (or the Council or CMAP staff) would analyze the effectiveness of the
countermeasures that are to be implemented as part of the proposed project. Projects could
then be scored based on how effectively they reduce severe crashes.
Bicycle projects funded by CMAQ or TAP Bicyclist serious injuries and fatalities have been increasing in the region. The local
Transportation Alternatives Program, which currently is targeted at building off-street trails
that are part of the Regional Greenways and Trails Plan, does not directly consider safety.
However, scoring for projects that are candidates for TAP funding should include a safety
component. CMAP staff should do more research on how safety benefits for candidate bicycle
projects can estimated and compared.
Assist local agencies in safety planning Crashes occur on all roadway types regardless of jurisdiction, but in the CMAP region 59
percent of fatal crashes and 64 percent of serious injury crashes occurred on non-state controlled
roads from 2012 to 2014. In interviews with partner agencies, a commonly identified role that
CMAP could play would be to work through its committee structure and the Council of Mayors
to assist municipalities in highway safety planning and programming.
Produce actionable safety analysis for communities CMAP should develop data-driven crash reports highlighting safety initiatives that CMAP’s
local partners can implement to make their roads safer for all users. An annual regional report
should be created to identify the crash types, causes, locations, etc. that the reports should
concentrate on. In addition, it will assist in identifying which localities are experiencing a high
number of the identified crash types and locations where they are problems.
The reports should identify a systematic approach to addressing the crash types identified in
the regional report. The special reports would pinpoint problem locations and will feature one
or more low-cost countermeasures that alleviate safety risk. Local law enforcement officials
could use the focused safety reports to target enforcement at high crash locations. For example,
the report could provide a map of locations that are experiencing a high crash rate due to
speeding; a local police department could focus more speed enforcement around that location
Page 50 of 56 Traffic Safety White Paper
to help prevent crashes. Additionally, the report could provide support in identifying locations
where automated enforcement would be effective. The biennial municipal survey should
include questions related to the safety reports to ensure their usefulness.
Developing a regional version of the United States Road Assessment Program (usRAP) to
identify potential projects for municipalities to consider is another safety analysis tool that
CMAP should explore. The usRAP tool is a roadway safety-planning kit that builds upon other
successful international models developed for Europe (EuroRAP) and Australia (AusRAP). The
software analyzes sections of roadway for existing safety elements and identifies programs of
potential projects to improve safety performance. The basis for project selection is the estimated
benefit associated with specific engineering improvements.
IDOT participated in an usRAP pilot study through the USDOT that analyzed rural state
highways. The pilot project used data from 2002 to 2006 and focused on risk mapping, that is,
identifying roadways with the greatest crash risk based on crash history. CMAP should take a
lead role in developing or at a minimum research the opportunity to develop a regional version
of usRAP. The software requires a significant amount of data collection, but it also provides a
structured, straightforward way to identify and screen potential safety improvement projects at
the municipal level.
Provide assistance for local HSIP funding The Highway Safety Improvement Program (HSIP) is a core federal-aid program continued in
the FAST Act that provides funding to reduce the number of traffic fatalities and serious injuries
on all public roads. After set-asides for special programs, IDOT splits the remaining HSIP
funds into to two programs, the HSIP state road program (receiving 80 percent) and the HSIP
local road program (receiving 20 percent), the latter being programmed through a competitive
call for projects. HSIP funds are required to support engineering and operations solutions to
traffic safety.
However, IDOT District 1 has consistently been unable to program all of its local HSIP funds
due to limited numbers of quality applications. A variety of factors may be responsible for this
situation, including the perceived difficulty of the application process and the requirements to
expend funding effectively within two years. To help address this problem, CMAP should assist
municipalities in applying for local HSIP funding, but CMAP and IDOT should work together
to supplement the application process by directly identifying potential projects on local routes
and seeking a municipal partnership to implement them. CMAP has the opportunity to
support many aspects of the funding process from holding training sessions to assisting in the
analytical sections of the HSIP application.96 CMAP should work through the Council of Mayors
96 All the elements that should be included in the local HSIP application can be confusing, especially if local agencies do not have the experience or time to work with crash data. The local HSIP application is data driven and requires local agencies to submit many different sections with the project proposal. The local HSIP application includes sections on location, location characteristics, the crash emphasis area the proposed project targets, fatal and serious injury crash reports, Road Safety Assessment findings, analysis of proposed counter-measures and benefit cost
Page 51 of 56 Traffic Safety White Paper
to determine the best approach to work with municipalities on applying for local road HSIP
funding.
Support local road safety plans and road safety audits (RSA)
Because serious injury and fatal crashes occur on all roadway types, CMAP should encourage
communities, through possible technical assistance, to develop local road safety plans (LRSP).
A LRSP is a proven safety countermeasure that provides a framework to identify and prioritize
safety improvements that reduce fatal and serious injury crashes on the local road network.
The LRSP is developed through stakeholder engagement, collaboration, and data analysis to
tailor it to local safety issues. It is important for the plan to be updated to reflect changes in
local needs and priorities regarding traffic safety.97
A road safety audit (RSA) determines roadway elements that pose a risk to roadway users and
under what conditions those elements are a safety concern, then presents solutions to eliminate
or ease the safety issues identified on that road.98 The usRAP software discussed above creates
high-level RSAs through remote sensing methods, while the traditional RSA requires an in-
person site evaluation.
The results of an RSA, conducted at the proposed project site, is required to be included in local
HSIP applications. CMAP and IDOT should consider hosting RSA training for partner local
agencies in the region on a regular basis. The FHWA also offers RSA training.
Seek safety behavioral funding at the MPO level While the HSIP program focus on engineering improvements for safety, funding authorized at
23 USC 402 (“Section 402”) provides for highway safety grant funds that focus on safety
education and enforcement programs. This would be an entirely new role for CMAP to take on,
but other MPOs have secured Section 402 grant funds for their region. For example, the Mid
America Regional Planning Commission (MARC) through its Destination Safe Leadership
Team received a grant from the Kansas DOT and Missouri DOT to support its Destination Safe
Media Campaign to promote its safety initiative “Destination Safe.” The City of Chicago
received section 402 funds to promote its Vision Zero initiative. If CMAP decided to pursue
joining the Vision Zero initiative, CMAP could potentially use section 402 funds to promote
Vision Zero at the regional level.
analysis of proposed project. The elements that are required for the local HSIP application can be overwhelming to local municipalities if they have never applied for local HSIP funding.
97 “Local Road Safety Plans,” Federal Highway Administration, access November 2017. https://safety.fhwa.dot.gov/provencountermeasures/local_road/
98 “Road Safety Audits (RSA),” Federal Highway Administration, accessed October 2017. https://safety.fhwa.dot.gov/rsa/
Page 52 of 56 Traffic Safety White Paper
Collaborate with IDOT to expedite the release of regional crash information Currently, there is nearly a year lag in the release of annual crash data by IDOT. The delay
hinders agencies’ ability to react to safety issues as they arise. At the extreme, it could take
almost two years to measure the effectiveness of a project that was begun in January of a year.
Working through the councils of government and partner agencies, CMAP should support
IDOT by trying to help local law enforcement agencies in the region implement electronic crash
reporting systems.99 Less than half of local agencies are using electronic reporting currently.
Additionally, CMAP could assist in bringing together multiple law enforcement agencies in the
region to submit an HSP application to help agencies electronic crash reporting system at the
regional level. Other opportunities to work with IDOT to accelerate the release of crash data
should be explored.
To analyze safety initiatives that affect many locations, and in total have large numbers of
crashes, having a timely measure of the effectiveness of the program would help to improve the
projects and save lives. Currently, at the extreme, it could take almost two years to measure the
effectiveness of a project that was begun in January of a year. A goal to strive for would be for
IDOT to release monthly batches of crash reports three months after the month of the crashes.
IDOT has made significant strides in sharing crash data through their on-line Safety Portal and
is in the process of improving it. The City of Chicago will now use mobile crash reporting
technology to send all crash reports to IDOT.100 These efforts will help to streamline the
collection and sharing of crash data. In collaboration with IDOT, the challenge to process the
crash data more quickly should be addressed to determine if combing state, local and regional
resources and manpower can accomplish the goal more effectively.
Considering the data itself, there are consistency issues with how each officer is trained for
evaluating crashes and completing crash reports. Additional training would make the crash
data more consistent. Also, a traffic fatality is understood by all, but the definition of a serious
or incapacitating injury needs to be exactly defined so that the measures are meaningful.
Information on seat belt use, cell phone use and reckless driving is difficult to verify after a
99 Law enforcement personnel collect crash information by an electronic crash reporting system or manually have to fill out paper crash reports. The law enforcement agencies send the crash reports to IDOT, whose staff then enter the crash information into the statewide crash information system (CIS). The electronic crash reporting systems allow agencies to electronically capture and submit crash reports to IDOT. This method of crash data collection is preferred because it is more efficient and easily entered into IDOT’s CIS. When law enforcement agencies submit paper crash reports, IDOT staff have to enter manually the crash report information into the CIS that results in a bottleneck in the processing of crash reports. Currently, 315 out of 878 agencies are submitting electronic crash reports to IDOT. The City of Chicago received HSP funds to implement their Crash Data Integration Project that includes the implementation of an electronic crash reporting system by the Chicago Police Department (CPD). The CPD is expecting to have an electronic crash reporting system implemented in its mobile units by August 2017. This should lead to a dramatic reduction in time spent by IDOT staff entering crash report data from the City of Chicago into the statewide CIS.
100 Illinois Department of Transportation, 2016 Illinois Highway Safety Program Annual Evaluation Report, 2016, accessed October 2017.
http://www.idot.illinois.gov/Assets/uploads/files/Transportation-System/Reports/Safety/HSP/AER16-singles_010317.pdf
Page 53 of 56 Traffic Safety White Paper
crash and could be obtained more accurately through electronic data recorders in vehicles if
legal hurdles concerning privacy can be overcome.
Developing regional safety targets In the spring of 2016, the FHWA published the Highway Safety Improvement Program (HSIP)
and Safety Performance Management Measures (Safety PM) Final Rules in the Federal Register.
The overarching goals for the HSIP and Safety PM are to significantly reduce the number of
fatalities and serious injury crashes that occur on all public roads. The Safety PM rule requires
the following measures to be reported on an annual basis as five-year rolling averages: (1) the
number of fatalities, (2) the rate of fatalities per 100 million VMT, (3) the number of serious
injuries, (4) the rate of serious injuries per 100 million VMT, and (5) the number of non-
motorized fatalities and non-motorized serious injuries. All public roads are to be included,
regardless of functional classification or jurisdiction.
State DOTs and MPOs must set annual targets for each safety measure, with state DOTs
required to establish quantitative targets. The actual target should be set to what the state
believes it can achieve; the rule does not specify or provide guidance for how ambitious the
targets are to be. Each year the FHWA is to evaluate whether states have met, or made
significant progress toward meeting, their targets. FHWA will consider states to be in
compliance if they have met or improved from the baseline at least four of the five required
performance targets. This cycle of setting targets and evaluating performance will recur
annually, but with a significant time lag before the evaluation occurs.
By contrast, MPOs can either choose to set quantitative targets or commit to help implement the
state's target by planning for and programming safety projects. State DOTs are to establish their
targets by the time the annual HSIP report is due to FHWA at the end of August 2017. MPOs
have until the end of February 2018 to establish their targets, but are not required to wait until
the state DOT develops its targets. After that, MPOs are to update their safety targets each year
in a report to the state DOT. If states do not meet their targets, they will be required to use more
of their federal funding for highway safety projects – although this does not affect IDOT since
all HSIP money is used for safety purposes -- and submit a plan for how to meet the targets.
ON TO 2050 safety targets
Because traffic deaths and serious injury crashes are preventable and our partners have
aggressive safety goals, CMAP should strongly consider adopting aggressive safety targets for
2025 and 2050. In order to support the City of Chicago “Vision Zero” initiative, IDOT’s safety
initiative of “Driving Zero Fatalities to a Reality”, and FHWA’s Towards Zero Deaths program,
both targets should be aggressive. For the 2025 target, the region should consider committing to
halving the current five-year average of 405 fatalities to 203 fatalities, a goal based on the safety
progress the region made over 2010 – 2015. Advances in safety technology and legislation in
the near future has the potential to result in a significant decrease in the number of traffic
Page 54 of 56 Traffic Safety White Paper
related fatalities. The decrease will be fast at first, then slow down as the technology and laws
are widely implemented. This has been experienced with other safety initiatives such as the
standardization of anti-lock brake system (ABS) and seat belt laws. The cycle of quick drops
and plateauing will continue as new safety standards are put into place until we reach zero
fatalities.
For the 2050 target, the region should strongly consider zero-fatality goal. In addition, CMAP
should join one of the zero fatality initiatives to solidify CMAP’s goal of achieving its target of
zero traffic related fatalities in the region by 2050. CMAP has the opportunity to join and
participate in the Vision Zero initiative and Towards Zero Deaths program. CMAP should
officially support IDOT’s safety initiative Driving Zero Fatalities to a Reality.
In order for the region to achieve the safety targets that are proposed, safety will need to
become the leading factor in all planning and programming decisions in the region. If every
agency in the region is committed to making roads as safe as possible this goal should be
attainable. CMAP will need to take a leading role and make it a top priority in ON TO 2050.
Advances in transportation technology Perhaps one of the most promising areas for safety improvement is in vehicle technology. Each
new model year has more safety features than the previous one. This is a result of national
standards, automotive corporations’ ingenuity, and demand by consumers. Because of that,
those driving newer cars tend to suffer lower rates of serious injuries and fatalities, simply
because of improved safety features in newer vehicles (Figure 23).101 However, it can take
decades for safety innovation to have its maximum effect because of the speed of fleet
turnover.102 Furthermore, not all groups share in technology’s benefits to the same degree; often
the youngest or lower income groups drive older vehicles which have the fewest number of
safety features.
101 Vehicle maintenance is an issue in 2 to 3 percent of crashes, but previous analysis at CMAP has shown that vehicle keep much of their safety characteristics as they age.
102 For instance, electronic stability control devices, which sense an impending rollover and cut the throttle and apply the brakes to allow the driver to regain control, has been available on some models for many years, but has been mandatory since 2012. According to estimates, in almost 2,000 lives were saved in 2015 in the US by this technology, yet half of the vehicles on the road still do not have the feature.
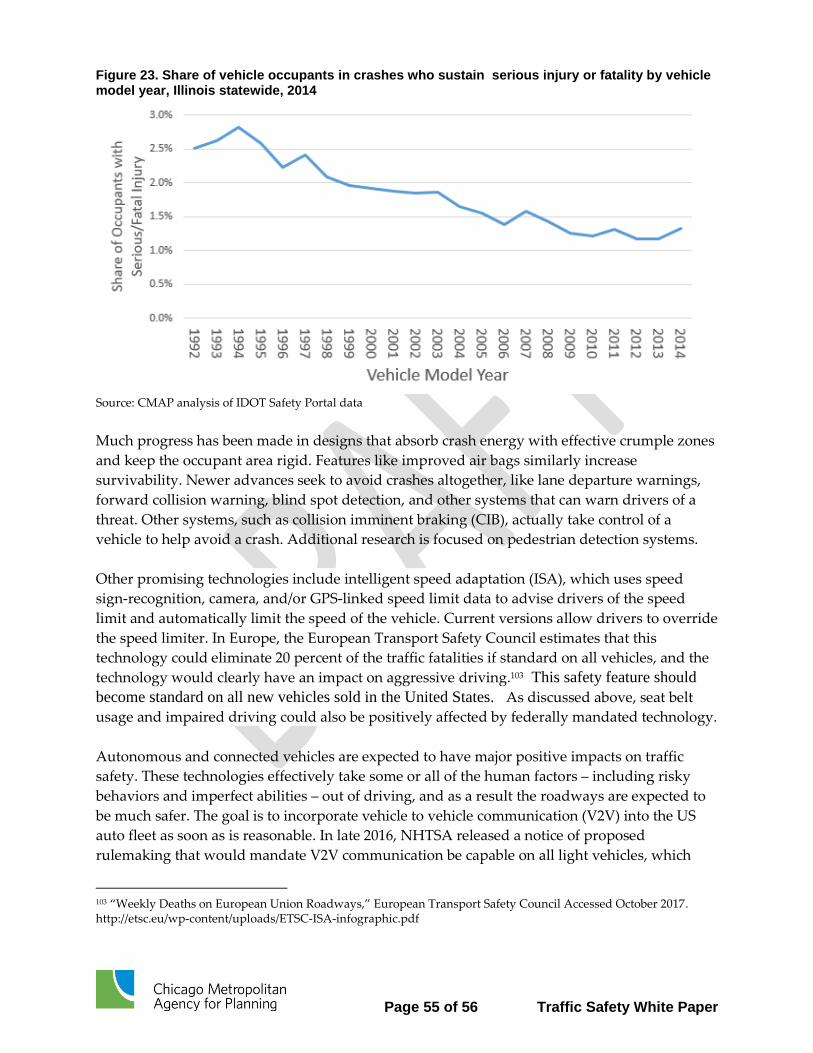
Page 55 of 56 Traffic Safety White Paper
Figure 23. Share of vehicle occupants in crashes who sustain serious injury or fatality by vehicle model year, Illinois statewide, 2014
Source: CMAP analysis of IDOT Safety Portal data
Much progress has been made in designs that absorb crash energy with effective crumple zones
and keep the occupant area rigid. Features like improved air bags similarly increase
survivability. Newer advances seek to avoid crashes altogether, like lane departure warnings,
forward collision warning, blind spot detection, and other systems that can warn drivers of a
threat. Other systems, such as collision imminent braking (CIB), actually take control of a
vehicle to help avoid a crash. Additional research is focused on pedestrian detection systems.
Other promising technologies include intelligent speed adaptation (ISA), which uses speed
sign-recognition, camera, and/or GPS-linked speed limit data to advise drivers of the speed
limit and automatically limit the speed of the vehicle. Current versions allow drivers to override
the speed limiter. In Europe, the European Transport Safety Council estimates that this
technology could eliminate 20 percent of the traffic fatalities if standard on all vehicles, and the
technology would clearly have an impact on aggressive driving.103 This safety feature should
become standard on all new vehicles sold in the United States. As discussed above, seat belt
usage and impaired driving could also be positively affected by federally mandated technology.
Autonomous and connected vehicles are expected to have major positive impacts on traffic
safety. These technologies effectively take some or all of the human factors – including risky
behaviors and imperfect abilities – out of driving, and as a result the roadways are expected to
be much safer. The goal is to incorporate vehicle to vehicle communication (V2V) into the US
auto fleet as soon as is reasonable. In late 2016, NHTSA released a notice of proposed
rulemaking that would mandate V2V communication be capable on all light vehicles, which
103 “Weekly Deaths on European Union Roadways,” European Transport Safety Council Accessed October 2017. http://etsc.eu/wp-content/uploads/ETSC-ISA-infographic.pdf
Page 56 of 56 Traffic Safety White Paper
would allow cars to communicate to each other to avoid crashes.104 Other efforts will attempt to
achieve the same functionality without specifying the technology105. The benefits of these
technologies are partly a function of the rate of market penetration. Also, as the technology
advances, autonomous vehicles will raise many questions about fault, indemnity, and the
culture of driving which will have to be answered at national and state levels. CMAP staff
should continue to stay on top of the fast-changing technology that is coming to vehicles in the
near future. CMAP staff also should work with its partners to support legislation maximizing
the safety benefits of autonomous and connected vehicle technology.
Next steps Ensuring the safety of all people using the region’s transportation system should be a top
priority for all agencies related to transportation. CMAP should take a leading role in planning
and programming for a safer transportation system in our region. To do this, ON TO 2050
should address safety and include recommendations and policies that will make the
transportation system a safer place for all users. The safety white paper outlined initial steps
CMAP can take to advance a safety-first agenda, but there is still work to do. CMAP staff
should continue working on the federal safety performance measures and work with partner
agencies to determine if the region should continue to support IDOTs targets or set its own
safety targets in the future. CMAP should also continue to find ways to increase consideration
of safety in the programming decision-making process.
104 “U.S. DOT advances deployment of Connected Vehicle Technology to prevent hundreds of thousands of crashes,” National Highway Traffic Safety Administration, Accessed (October 2017).
https://www.nhtsa.gov/press-releases/us-dot-advances-deployment-connected-vehicle-technology-prevent-hundreds-thousands
105 “Report: DSRC mandate moving off the table for automakers “https://www.fiercewireless.com/wireless/report-dsrc-mandate-moving-off-table-for-auto-makers