draft sensitivity case results and assumptions · • ev 1% penetration rate per year of the...
TRANSCRIPT

DRAFT Sensitivity Case Results and Assumptions
November 5, 2010
Disclaimer – This presentation, prepared by ICF under contract with RGGI, Inc., is designed to support ongoing evaluation of state RGGI programs. The opinions, data and analysis contained in this report do not necessarily reflect those of RGGI, Inc. or any of the RGGI Participating States.
2
The following slides present select projections from the latest RGGI Reference Case and draft sensitivity cases, based on assumptions in place as of November 1st .
These projections are draft and may change as ICF makes refinements based on state review and input.
The RGGI States specified 6 sensitivities for analysis:1. Higher Load Growth
2. Lower Load Growth
3. Higher Natural Gas Prices & Lower Oil Prices
4. Lower Natural Gas Prices
5. High Emissions Combination
6. Low Emissions Combination
This presentation describes the sensitivity assumptions and results for each related pair of cases (Load Growth, Fuel Prices and Combinations).
The sensitivity case results are shown as compared to the Reference Case and then as compared to each other.
The final section contains the proposed specifications for a Regulatory Sensitivity Case, which has not yet been analyzed.
RGGI SENSITIVITY RESULTS
2
DRAFT RGGI Sensitivity Case Results

3
RGGI SENSITIVITY RESULTS
3
RGGI CO2 EmissionsReference Case and All Sensitivity Cases The chart shows historical and projected CO2 emissions for the RGGI states.
0
20
40
60
80
100
120
140
160
180
200
2005 2010 2015 2020 2025 2030
CO2
Emis
sion
s (M
MTo
ns)
Reference HighDemand
LowDemand
High Gas/Low Oil
LowGas
HighCombo
LowCombo
RGGI Cap
Historical Projected
LOAD GROWTH SENSITIVITY CASES

5
RGGI SENSITIVITY RESULTS
5
DRAFT RGGI Sensitivity Case SpecificationsLoad Growth Sensitivity CasesSensitivity Run Category of Change Components Assumptions
1HIGH LOAD
Higher load growth • Economy • Weather • Additional load, e.g. Electric Vehicles
• Higher economic growth• EV 1% penetration rate per year of the
current fleet. The forecast is 1.6% and 2.4% higher than the reference case in 2020 and 2030, respectively.
• Weather proposal-10% increase over normalized weather
• Includes reference case energy efficiency estimates
• Above is estimated to result in average annual growth rate of 1.3% per year
2LOW LOAD
Lower load growth • Increased Energy Efficiency• State by state calculation of more
aggressive EE targets than reference case

6
The chart shows total firmly planned (“Firm”) and economic capacity additions by type and total retirements projected by IPM.
RGGI SENSITIVITY RESULTS
6
RGGI Cumulative Capacity Changes by 2030Reference Case and Load Growth Sensitivity Cases
-20
-10
0
10
20
30
40
50
Reference HighDemand
LowDemand
Capa
city
Add
ition
s (G
W)
Other
Solar
Biomass
Wind
Gas
Nuclear
Firm Renew.
Firm Conv.
Other Retire
Firm Retire
7
RGGI SENSITIVITY RESULTS
7
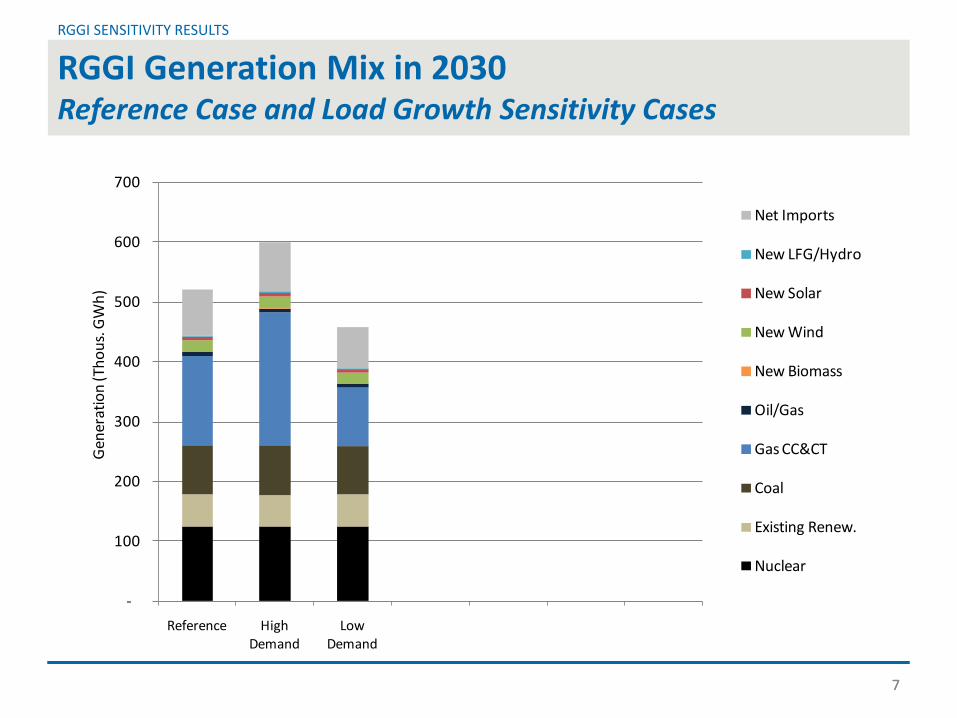
RGGI Generation Mix in 2030Reference Case and Load Growth Sensitivity Cases
-
100
200
300
400
500
600
700
Reference HighDemand
LowDemand
Gen
erat
ion
(Tho
us. G
Wh)
Net Imports
New LFG/Hydro
New Solar
New Wind
New Biomass
Oil/Gas
Gas CC&CT
Coal
Existing Renew.
Nuclear

8
RGGI SENSITIVITY RESULTS
8
RGGI CO2 EmissionsReference Case and Load Growth Sensitivity Cases The chart shows historical and projected CO2 emissions for the RGGI states.
0
20
40
60
80
100
120
140
160
180
200
2005 2010 2015 2020 2025 2030
CO2
Emis
sion
s (M
MTo
ns)
Reference HighDemand
LowDemand
RGGI Cap
Historical Projected

FUEL PRICE SENSITIVITY CASES
10
RGGI SENSITIVITY RESULTS
10
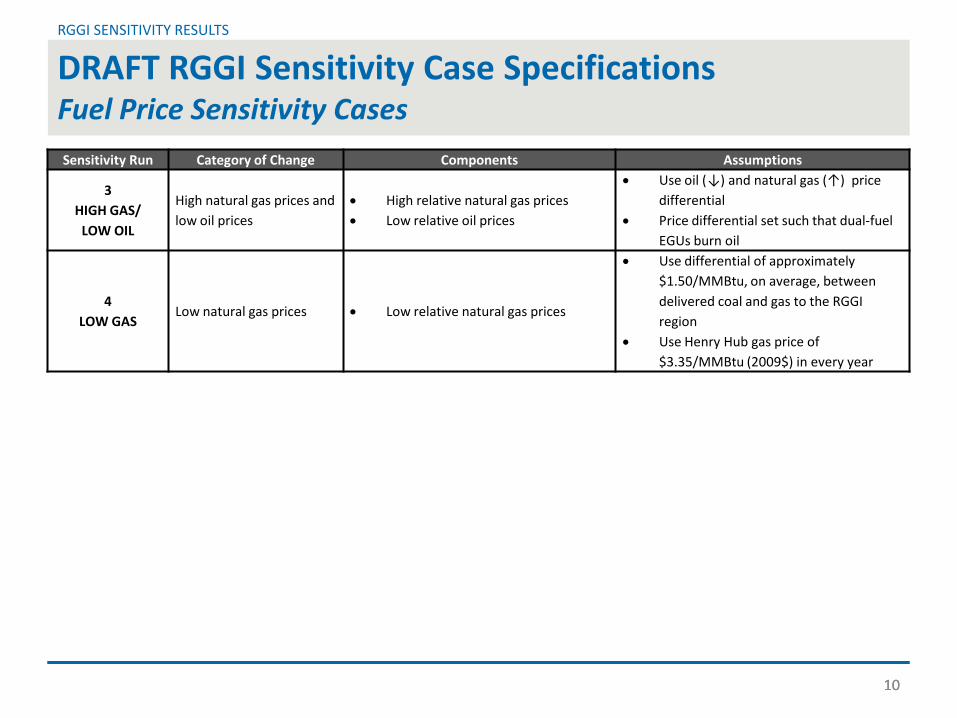
DRAFT RGGI Sensitivity Case SpecificationsFuel Price Sensitivity CasesSensitivity Run Category of Change Components Assumptions
3HIGH GAS/
LOW OIL
High natural gas prices and low oil prices
• High relative natural gas prices• Low relative oil prices
• Use oil (↓) and natural gas (↑) price differential
• Price differential set such that dual-fuel EGUs burn oil
4LOW GAS
Low natural gas prices • Low relative natural gas prices
• Use differential of approximately $1.50/MMBtu, on average, between delivered coal and gas to the RGGI region
• Use Henry Hub gas price of $3.35/MMBtu (2009$) in every year

Fuel Price Sensitivity CasesNatural Gas and Oil Price Assumptions
RGGI SENSITIVITY RESULTS
11
Natural Gas Prices at Henry Hub 0.3%S Resid to New York City
0
2
4
6
8
10
12
14
16
18
2005 2010 2015 2020 2025 2030
2009
$/M
MBt
u
Historical Projected
0
2
4
6
8
10
12
14
16
18
2005 2010 2015 2020 2025 2030
2009
$/M
MBt
u
Historical Reference High Gas/Low Oil
LowGas
Historical Projected
12
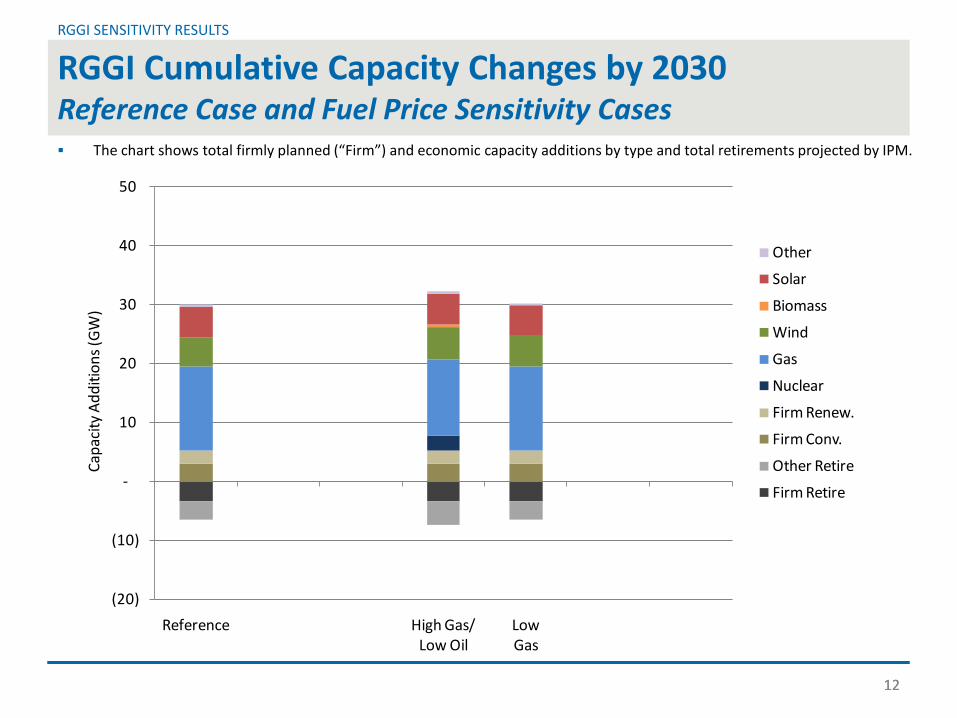
The chart shows total firmly planned (“Firm”) and economic capacity additions by type and total retirements projected by IPM.
RGGI SENSITIVITY RESULTS
12
RGGI Cumulative Capacity Changes by 2030Reference Case and Fuel Price Sensitivity Cases
(20)
(10)
-
10
20
30
40
50
Reference High Gas/Low Oil
LowGas
Capa
city
Add
ition
s (G
W)
Other
Solar
Biomass
Wind
Gas
Nuclear
Firm Renew.
Firm Conv.
Other Retire
Firm Retire

13
RGGI SENSITIVITY RESULTS
13
RGGI Generation Mix in 2030Reference Case and Fuel Price Sensitivity Cases
-
100
200
300
400
500
600
700
Reference High Gas/Low Oil
LowGas
Gen
erat
ion
(Tho
us. G
Wh)
Net Imports
New LFG/Hydro
New Solar
New Wind
New Biomass
Oil/Gas
Gas CC&CT
Coal
Existing Renew.
Nuclear

14
RGGI SENSITIVITY RESULTS
14
RGGI CO2 EmissionsReference Case and Fuel Price Sensitivity Cases The chart shows historical and projected CO2 emissions for the RGGI states.
0
20
40
60
80
100
120
140
160
180
200
2005 2010 2015 2020 2025 2030
CO2
Emis
sion
s (M
MTo
ns)
Reference High Gas/Low Oil
LowGas
RGGI Cap
Historical Projected
EMISSIONS COMBINATION SENSITIVITY CASES
16
RGGI SENSITIVITY RESULTS
16
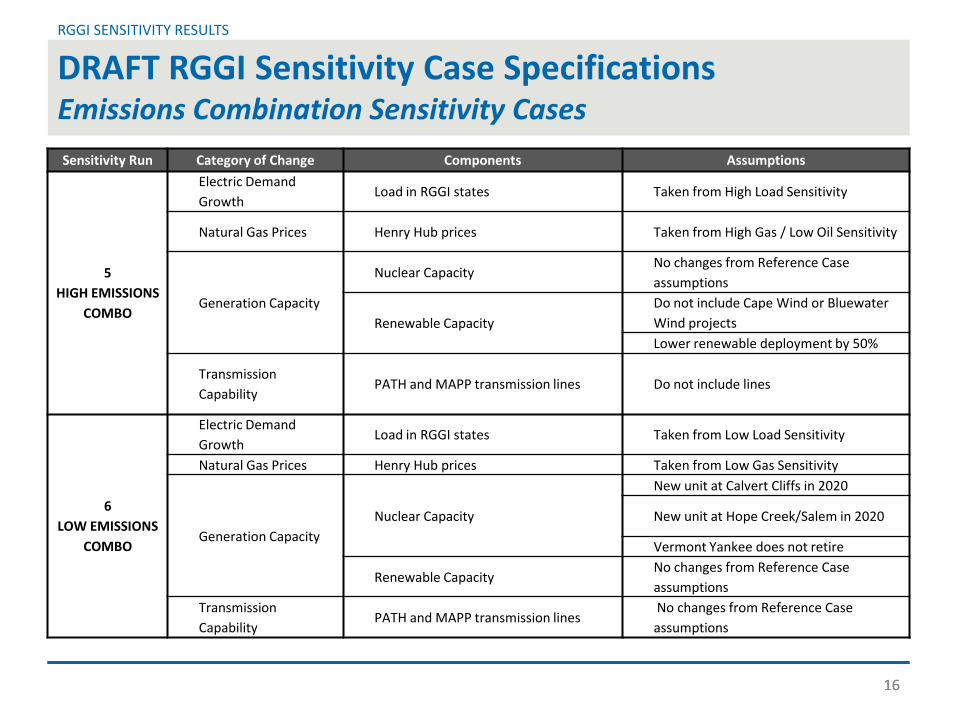
DRAFT RGGI Sensitivity Case SpecificationsEmissions Combination Sensitivity CasesSensitivity Run Category of Change Components Assumptions
5HIGH EMISSIONS
COMBO
Electric Demand Growth
Load in RGGI states Taken from High Load Sensitivity
Natural Gas Prices Henry Hub prices Taken from High Gas / Low Oil Sensitivity
Generation Capacity
Nuclear CapacityNo changes from Reference Case assumptions
Renewable CapacityDo not include Cape Wind or Bluewater Wind projectsLower renewable deployment by 50%
Transmission Capability
PATH and MAPP transmission lines Do not include lines
6LOW EMISSIONS
COMBO
Electric Demand Growth
Load in RGGI states Taken from Low Load Sensitivity
Natural Gas Prices Henry Hub prices Taken from Low Gas Sensitivity
Generation CapacityNuclear Capacity
New unit at Calvert Cliffs in 2020
New unit at Hope Creek/Salem in 2020
Vermont Yankee does not retire
Renewable CapacityNo changes from Reference Case assumptions
Transmission Capability
PATH and MAPP transmission linesNo changes from Reference Case assumptions

17
The chart shows total firmly planned (“Firm”) and economic capacity additions by type and total retirements projected by IPM.
RGGI SENSITIVITY RESULTS
17
RGGI Cumulative Capacity Changes by 2030Reference Case and Emissions Combination Sensitivity Cases
(20)
(10)
-
10
20
30
40
50
Reference HighCombo
LowCombo
Capa
city
Add
ition
s (G
W)
Other
Solar
Biomass
Wind
Gas
Nuclear
Firm Renew.
Firm Conv.
Other Retire
Firm Retire

18
RGGI SENSITIVITY RESULTS
18
RGGI Generation Mix in 2030Reference Case and Emissions Combination Sensitivity Cases
-
100
200
300
400
500
600
700
Reference HighCombo
LowCombo
Gen
erat
ion
(Tho
us. G
Wh)
Net Imports
New LFG/Hydro
New Solar
New Wind
New Biomass
Oil/Gas
Gas CC&CT
Coal
Existing Renew.
Nuclear

19
RGGI SENSITIVITY RESULTS
19
RGGI CO2 EmissionsReference Case and Emissions Combination Sensitivity Cases The chart shows historical and projected CO2 emissions for the RGGI states.
0
20
40
60
80
100
120
140
160
180
200
2005 2010 2015 2020 2025 2030
CO2
Emis
sion
s (M
MTo
ns)
Reference HighCombo
LowCombo
RGGI Cap
Historical Projected

ALL SENSITIVITY CASES
21
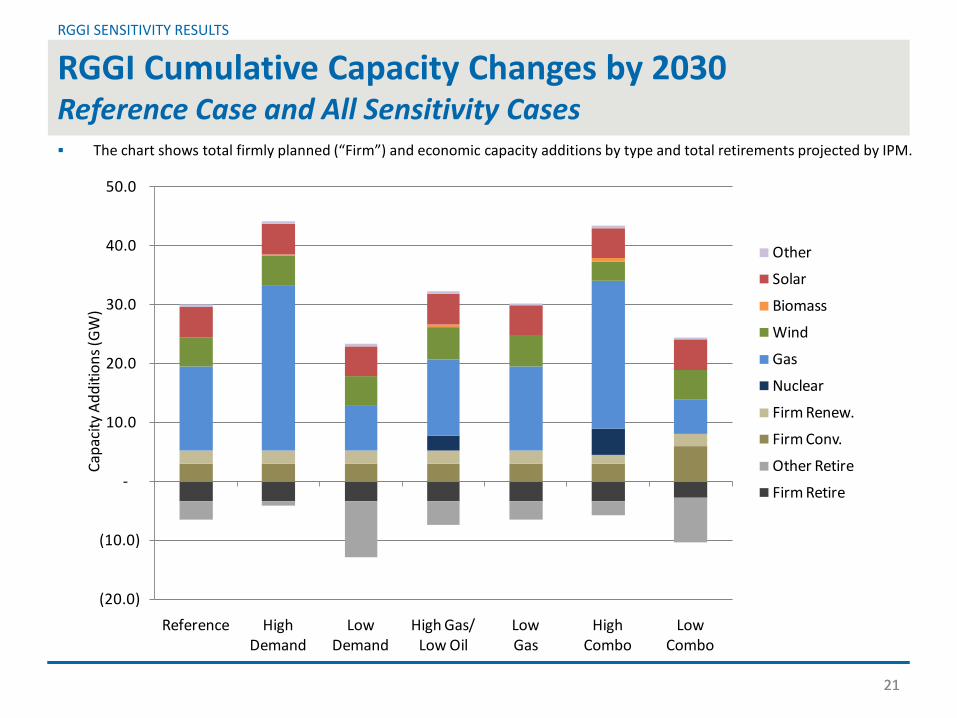
The chart shows total firmly planned (“Firm”) and economic capacity additions by type and total retirements projected by IPM.
RGGI SENSITIVITY RESULTS
21
RGGI Cumulative Capacity Changes by 2030Reference Case and All Sensitivity Cases
(20.0)
(10.0)
-
10.0
20.0
30.0
40.0
50.0
Reference HighDemand
LowDemand
High Gas/Low Oil
LowGas
HighCombo
LowCombo
Capa
city
Add
ition
s (G
W)
Other
Solar
Biomass
Wind
Gas
Nuclear
Firm Renew.
Firm Conv.
Other Retire
Firm Retire

22
RGGI SENSITIVITY RESULTS
22
RGGI Generation Mix in 2030Reference Case and All Sensitivity Cases
-
100
200
300
400
500
600
700
Reference HighDemand
LowDemand
High Gas/Low Oil
LowGas
HighCombo
LowCombo
Gen
erat
ion
(Tho
us. G
Wh)
Net Imports
New LFG/Hydro
New Solar
New Wind
New Biomass
Oil/Gas
Gas CC&CT
Coal
Existing Renew.
Nuclear
23
RGGI SENSITIVITY RESULTS
23
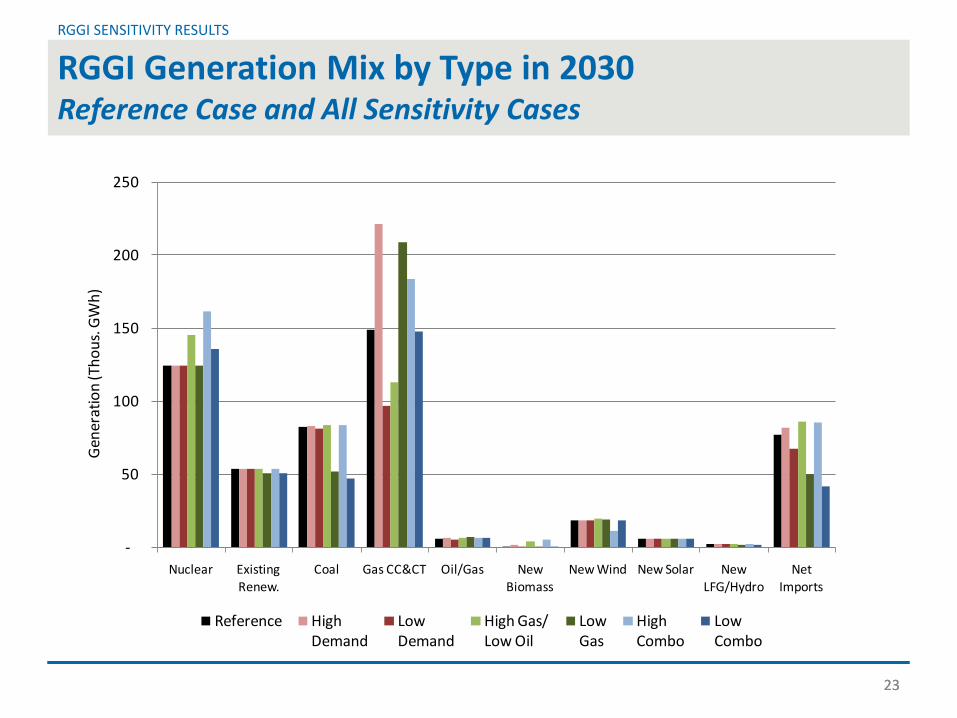
RGGI Generation Mix by Type in 2030Reference Case and All Sensitivity Cases
-
50
100
150
200
250
Nuclear Existing Renew.
Coal Gas CC&CT Oil/Gas New Biomass
New Wind New Solar New LFG/Hydro
Net Imports
Gen
erat
ion
(Tho
us. G
Wh)
Reference HighDemand
LowDemand
High Gas/Low Oil
LowGas
HighCombo
LowCombo
24
RGGI SENSITIVITY RESULTS
24
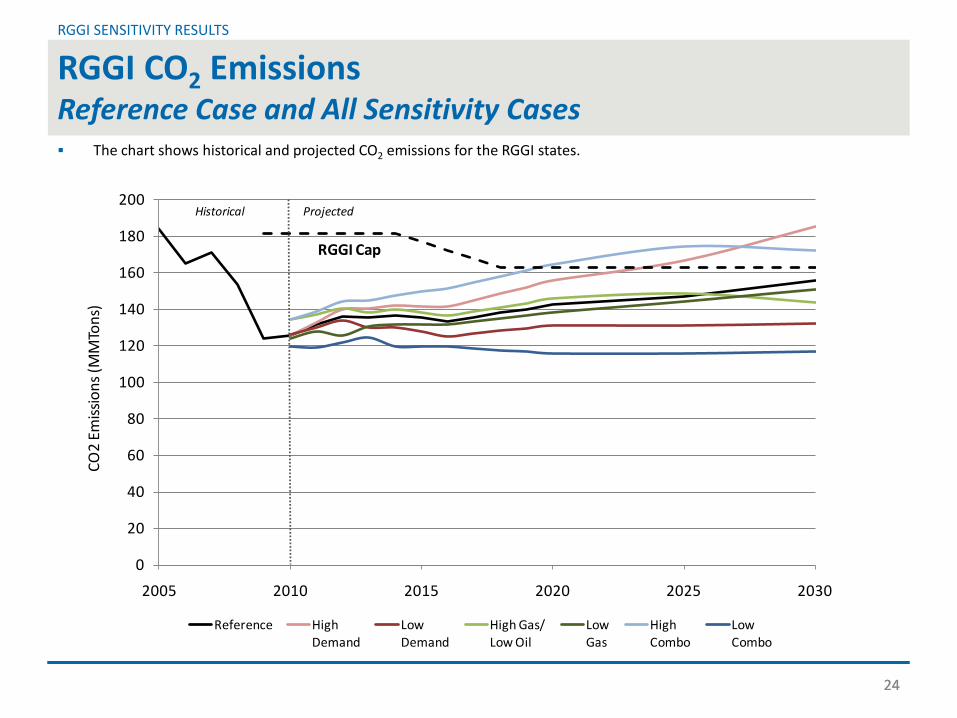
RGGI CO2 EmissionsReference Case and All Sensitivity Cases The chart shows historical and projected CO2 emissions for the RGGI states.
0
20
40
60
80
100
120
140
160
180
200
2005 2010 2015 2020 2025 2030
CO2
Emis
sion
s (M
MTo
ns)
Reference HighDemand
LowDemand
High Gas/Low Oil
LowGas
HighCombo
LowCombo
RGGI Cap
Historical Projected
25
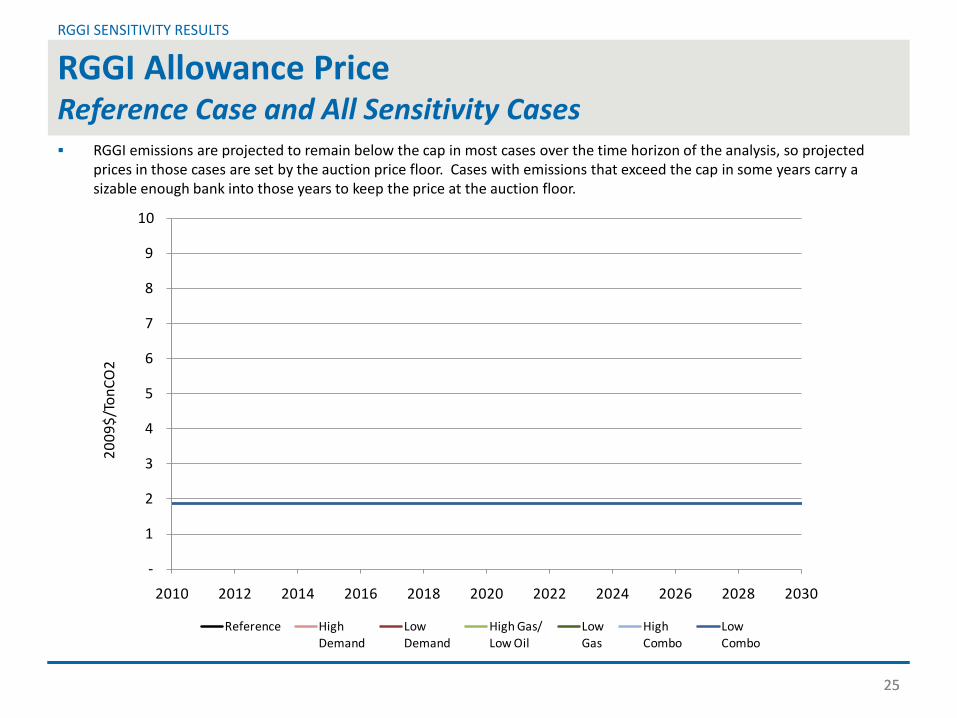
RGGI emissions are projected to remain below the cap in most cases over the time horizon of the analysis, so projected prices in those cases are set by the auction price floor. Cases with emissions that exceed the cap in some years carry a sizable enough bank into those years to keep the price at the auction floor.
RGGI SENSITIVITY RESULTS
25
RGGI Allowance PriceReference Case and All Sensitivity Cases
-
1
2
3
4
5
6
7
8
9
10
2010 2012 2014 2016 2018 2020 2022 2024 2026 2028 2030
2009
$/To
nCO
2
Reference HighDemand
LowDemand
High Gas/Low Oil
LowGas
HighCombo
LowCombo
26
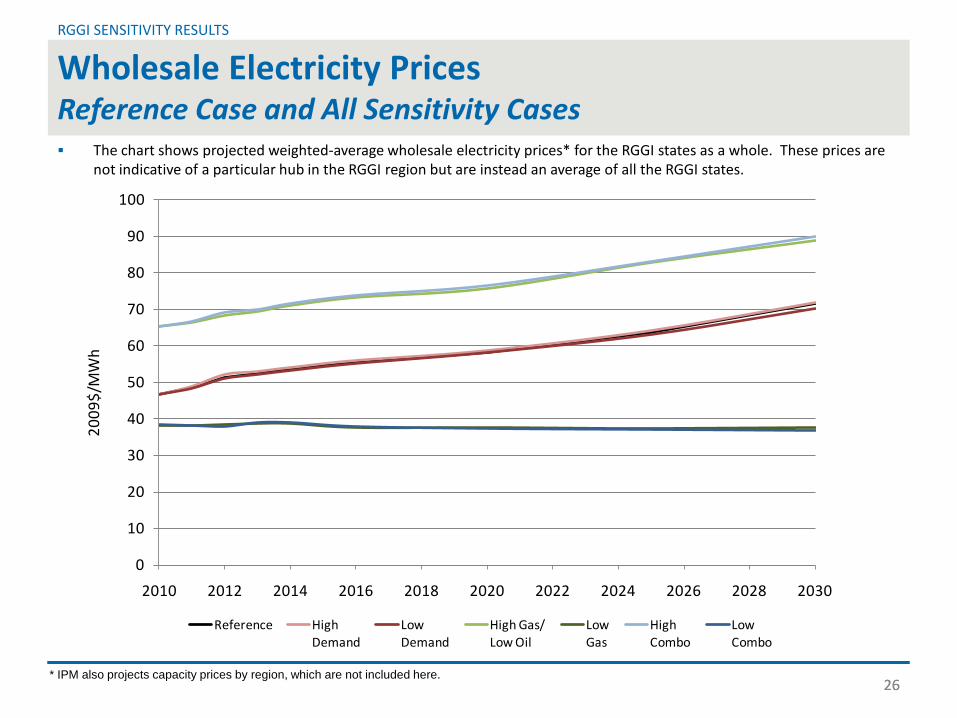
The chart shows projected weighted-average wholesale electricity prices* for the RGGI states as a whole. These prices are not indicative of a particular hub in the RGGI region but are instead an average of all the RGGI states.
RGGI SENSITIVITY RESULTS
26
Wholesale Electricity PricesReference Case and All Sensitivity Cases
* IPM also projects capacity prices by region, which are not included here.
0
10
20
30
40
50
60
70
80
90
100
2010 2012 2014 2016 2018 2020 2022 2024 2026 2028 2030
2009
$/M
Wh
Reference HighDemand
LowDemand
High Gas/Low Oil
LowGas
HighCombo
LowCombo
PROPOSED REGULATORY SENSITIVITY
28
RGGI SENSITIVITY RESULTS
28
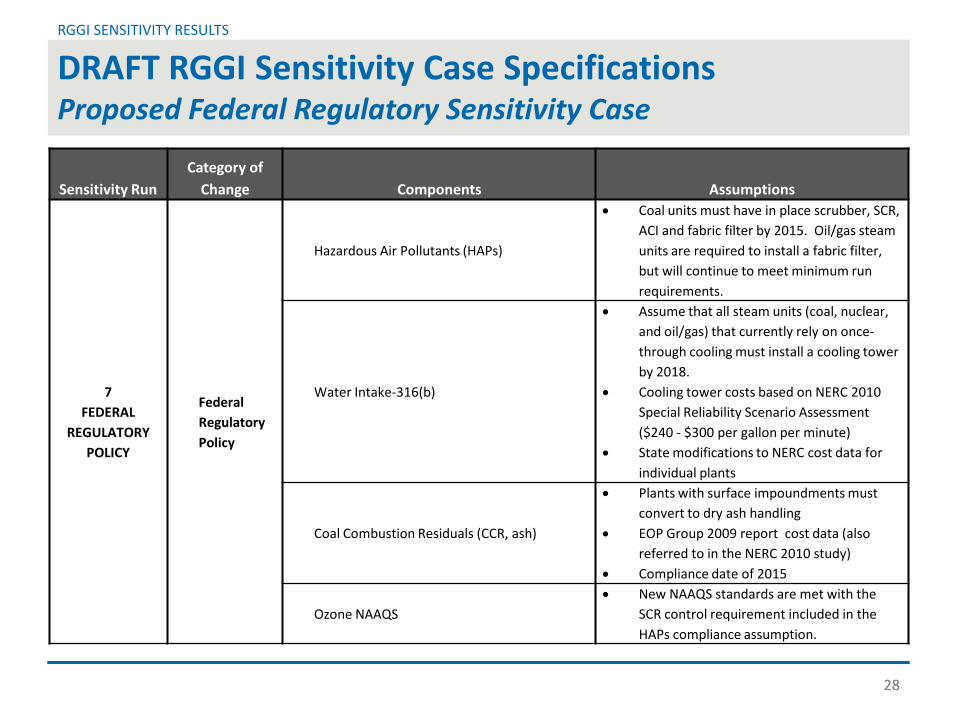
DRAFT RGGI Sensitivity Case SpecificationsProposed Federal Regulatory Sensitivity Case
Sensitivity RunCategory of
Change Components Assumptions
7 FEDERAL
REGULATORY POLICY
Federal Regulatory Policy
Hazardous Air Pollutants (HAPs)
• Coal units must have in place scrubber, SCR, ACI and fabric filter by 2015. Oil/gas steam units are required to install a fabric filter, but will continue to meet minimum run requirements.
Water Intake-316(b)
• Assume that all steam units (coal, nuclear, and oil/gas) that currently rely on once-through cooling must install a cooling tower by 2018.
• Cooling tower costs based on NERC 2010 Special Reliability Scenario Assessment ($240 - $300 per gallon per minute)
• State modifications to NERC cost data for individual plants
Coal Combustion Residuals (CCR, ash)
• Plants with surface impoundments must convert to dry ash handling
• EOP Group 2009 report cost data (also referred to in the NERC 2010 study)
• Compliance date of 2015
Ozone NAAQS• New NAAQS standards are met with the
SCR control requirement included in the HAPs compliance assumption.