draft multi-modal mobility fee study
TRANSCRIPT
000000
W .E. OLIVER, P.E., LLC TRAFFIC ENG I NEER! G
TRA SPORTATION P LANNING • SEMINOLE CbUNTY
FLORIDA' N ATURAL Ct 10 1 E
DRAFTSeminole County, Florida
2020 Multi-Modal MobilityFee Study
April 21, 2020 Lynx

DRAFT
Seminole County, Florida 2020 Multi‐Modal Mobility Fee Study
Prepared for: Seminole County, Florida
Prepared by:
W.E. Oliver, P.E., LLC Kittelson and Associates, Inc.
April 21, 2020

DRAFTSEMINOLE COUNTY, FLORIDA
2020 MULTI‐MODAL MOBILITY FEE STUDY
Table of Contents
Executive Summary .................................................................................................................. ES‐1
Table of Contents ........................................................................................................................... i
1.0 Introduction............................................................................................................................ 1
2.0 Outlook for Growth and Infrastructure Needs........................................................................ 2
3.0 2040 Transportation Plan ....................................................................................................... 4
4.0 Impact Fee Guiding Principles................................................................................................. 7
5.0 General Fee Equation ............................................................................................................. 9
6.0 Fee Parameters ..................................................................................................................... 11
6.a. District Strategy ............................................................................................................. 11
6.b. Land Uses in Fee Schedule............................................................................................. 11
6.c. Travel Demand Variables ............................................................................................... 11
6.d. Facility Costs .................................................................................................................. 11
6.e. Revenue Credits............................................................................................................. 13
6.f. Other Fee Parameters .................................................................................................... 16
7.0 Example Fee Calculation....................................................................................................... 17
8.0 Fee Schedule......................................................................................................................... 19
9.0 Conclusion ............................................................................................................................ 23
List of Figures
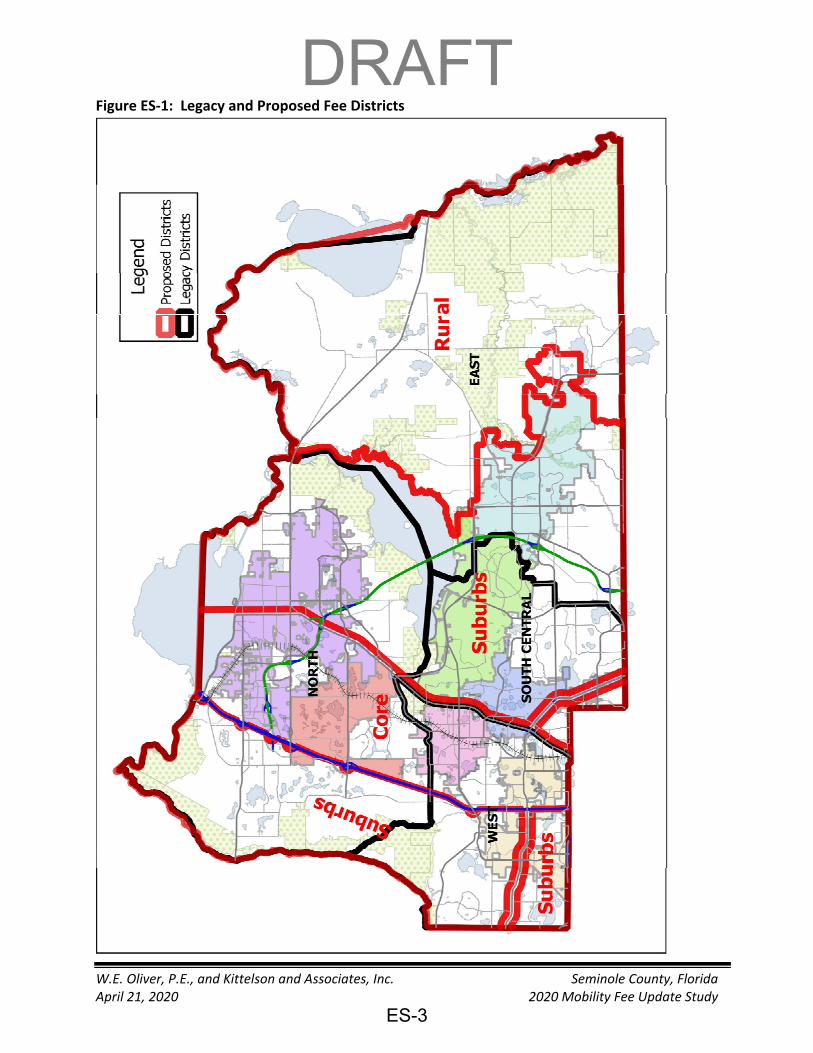
Figure ES‐1: Legacy and Proposed Fee Districts....................................................................... ES‐3
Figure 2‐1: Seminole County Travel Growth Indicators ................................................................ 2
Figure 3‐1: Proposed Mobility Fee Districts .................................................................................. 5
Figure 8‐1: Mobility Fee Program Summary ................................................................................ 20
-i-

DRAFTList of Tables
ES‐1: Adopted Mobility Fee Schedule ...................................................................................... ES‐4
3‐1: 2044 Forecast Simple Mobility Measures .............................................................................. 5
4‐1: Cross‐District Travel Estimates .............................................................................................. 7
6‐1: Estimated Cost per Lane‐Mile for Roadway Expansion ....................................................... 12
6‐2: Computation of Mixed‐Mode Cost per Person‐Mile of Capacity .........................................14
6‐3: Equivalent Pennies of Motor Fuel Tax Credit ...................................................................... 15
8‐1: Adopted Fee Schedule ........................................................................................................ 21
8‐1: Mobility Fees of Nearby Communities ................................................................................ 22
Appendices
Appendix A: Travel Characteristics Analysis .............................................................................. A‐1
Appendix B: Cost Component Analysis ..................................................................................... B‐1
Appendix C: Revenue Credit Analysis ....................................................................................... C‐1
Appendix D: Other Fee Parameters .......................................................................................... D‐1
Appendix E: Alternative Fee Programs for Discussion .............................................................. E‐1
Appendix F: Full Fee Schedules.................................................................................................. F‐1
Appendix G: Condensed Fee Schedule for Publication ............................................................. G‐1
-ii-

DRAFTSeminole County, Florida
2020 MULTI‐MODAL MOBILITY FEE STUDY
EXECUTIVE SUMMARY
This report documents a study to replace Seminole County’s Road Impact Fee with a Mobility Fee. Seminole County most recently reviewed its road impact fee in 1995, when it re‐endorsed a 1990 fee schedule. This 2020 update study was undertaken by Kittelson and Associates, Inc. and W.E. Oliver, P.E., LLC.
The County has had a road impact fee program in place since 1985. A four‐district fee schedule was adopted, with fees ranging from $705 to $1,251 per single‐family dwelling (Figure ES‐1). The fee was composed of two components, an arterial component of $705 which was consistent throughout the county, and a collector component which varied by district. The collector component of the fee in three of the four districts have ended, and all remaining road impact fees will expire in 2021. To maintain a continuing flow of funds for needed mobility improvements, this study was undertaken to consider adoption of a modern mobility fee.
Impact fee methodologies have advanced since 1995. State laws have been passed requiring use of current information, and encouraging creative approaches to support local economic development and land development programs. The 1995 methodology did not incorporate any such features, and this update provided an opportunity for the County to review it’s goals for improving the transportation system to accommodate growth that is occurring, review and update assumptions used in previous impact fee studies, and to incorporate several changes into the calculation of the impact fees.
Changes in calculation methodologies and data inputs from the 1990 impact fee study include:
Higher unit cost to build roadway capacity: The 1990 fee calculations estimated the cost of constructing new roads in the range of $169 to $253 per vehicle‐mile of capacity. Recent Florida DOT and County road construction experience and anticipated future improvements have led to values on the order of $900 per vehicle‐mile of capacity.
Use of Trip Length in the Fee Calculations: The 1990 fee calculations did not incorporate trip length as a consideration in the fee calculations. Thus, fees for land uses with high trip generation, but shorter trip lengths (generally retail uses), were charged disproportionately high fees compared to land uses with lower trip generation but longer trip lengths. This update incorporates trip lengths as a part of the calculation to more equitably assess land uses based on the amount of mobility system capacity consumed by a development.
Revised Fee Districts: With the advent of the SunRail system, Seminole County is seeking to encourage higher density development in the surrounding “Core” areas and provide for a more transit‐oriented mobility strategy to accommodate growth. The revised districts are illustrated in Figure ES‐1. Less dense suburban districts flank the Core district, where transit is less efficient
W.E. Oliver, P.E., and Kittelson and Associates, Inc. Seminole County, Florida April 21, 2020 2020 Mobility Fee Update Study
ES-1
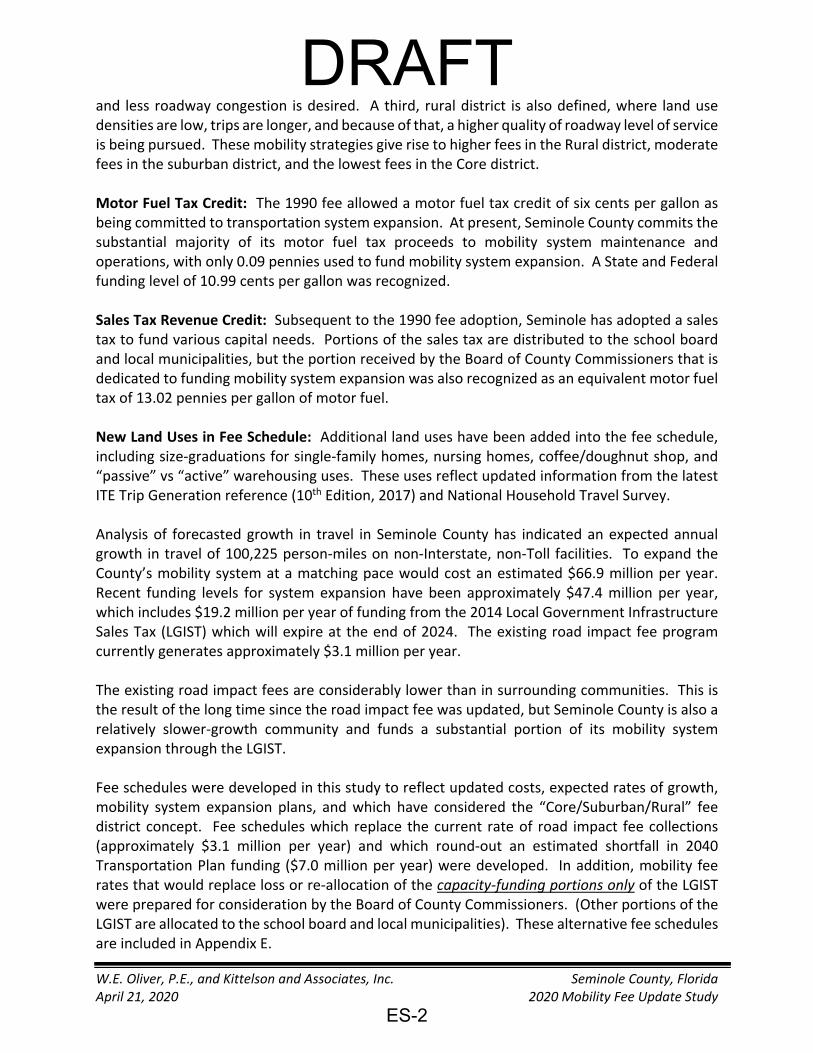
DRAFTand less roadway congestion is desired. A third, rural district is also defined, where land use densities are low, trips are longer, and because of that, a higher quality of roadway level of service is being pursued. These mobility strategies give rise to higher fees in the Rural district, moderate fees in the suburban district, and the lowest fees in the Core district.
Motor Fuel Tax Credit: The 1990 fee allowed a motor fuel tax credit of six cents per gallon as being committed to transportation system expansion. At present, Seminole County commits the substantial majority of its motor fuel tax proceeds to mobility system maintenance and operations, with only 0.09 pennies used to fund mobility system expansion. A State and Federal funding level of 10.99 cents per gallon was recognized.
Sales Tax Revenue Credit: Subsequent to the 1990 fee adoption, Seminole has adopted a sales tax to fund various capital needs. Portions of the sales tax are distributed to the school board and local municipalities, but the portion received by the Board of County Commissioners that is dedicated to funding mobility system expansion was also recognized as an equivalent motor fuel tax of 13.02 pennies per gallon of motor fuel.
New Land Uses in Fee Schedule: Additional land uses have been added into the fee schedule, including size‐graduations for single‐family homes, nursing homes, coffee/doughnut shop, and “passive” vs “active” warehousing uses. These uses reflect updated information from the latest ITE Trip Generation reference (10th Edition, 2017) and National Household Travel Survey.
Analysis of forecasted growth in travel in Seminole County has indicated an expected annual growth in travel of 100,225 person‐miles on non‐Interstate, non‐Toll facilities. To expand the County’s mobility system at a matching pace would cost an estimated $66.9 million per year. Recent funding levels for system expansion have been approximately $47.4 million per year, which includes $19.2 million per year of funding from the 2014 Local Government Infrastructure Sales Tax (LGIST) which will expire at the end of 2024. The existing road impact fee program currently generates approximately $3.1 million per year.
The existing road impact fees are considerably lower than in surrounding communities. This is the result of the long time since the road impact fee was updated, but Seminole County is also a relatively slower‐growth community and funds a substantial portion of its mobility system expansion through the LGIST.
Fee schedules were developed in this study to reflect updated costs, expected rates of growth, mobility system expansion plans, and which have considered the “Core/Suburban/Rural” fee district concept. Fee schedules which replace the current rate of road impact fee collections (approximately $3.1 million per year) and which round‐out an estimated shortfall in 2040 Transportation Plan funding ($7.0 million per year) were developed. In addition, mobility fee rates that would replace loss or re‐allocation of the capacity‐funding portions only of the LGIST were prepared for consideration by the Board of County Commissioners. (Other portions of the LGIST are allocated to the school board and local municipalities). These alternative fee schedules are included in Appendix E.
W.E. Oliver, P.E., and Kittelson and Associates, Inc. Seminole County, Florida April 21, 2020 2020 Mobility Fee Update Study
ES-2
V)
u V) :s u V) ·;:: ·- ...., 0 V)
"O 0 ~ ~ 8. ro 0 C\ ... <1J a... _J
DRAFTFigure ES‐1: Legacy and Proposed Fee Districts
W.E. Oliver, P.E., and Kittelson and Associates, Inc. Seminole County, Florida April 21, 2020 2020 Mobility Fee Update Study
ES-3

DRAFTThe fee program adopted by the Board of County Commissioners implements the “Core/Suburban/Rural” fee district program and fee rates which fund the projected 2040 Transportation Plan funding shortfall, generating an estimated $7.01 million per year. Table ES‐1 presents the adopted fee schedule. Fee schedules that include intermediate calculations are provided in Appendix F.
Table ES‐1: Adopted Mobility Fee Schedule Fee District
ITE Land
Use Code Land Use Unit Rural Suburb Core
210 Single Family (<=1,500 s.f.) D.U. $6,710 $2,234 $1,477 210 Single Family (1,501 to 2,500 s.f.) D.U. $8,284 $2,759 $1,824 210 Single Family (>2,500 s.f.) D.U. $11,101 $3,697 $2,444 n/a Accessory Dwelling Unit D.U. $3,178 $1,000 $614 220 Multi-Family (1-2 Floor) D.U. n/a $1,694 $1,040 221 Multi-Family (3+ Floor)(1) D.U. n/a $1,259 $773 240 Mobile Home D.U. $2,891 $890 $529 310 Hotel Room $5,063 $1,671 $1,093 320 Motel Room $1,956 $629 $399 420 Marina Berth $1,411 $628 $483 430 Golf Course Holes $12,815 $5,565 $3,989
492/493 Fitness Center 1,000 sf $9,928 $4,219 $2,932 610 Hospital 1,000 sf $4,841 $2,119 $1,725
251/252 Independent Senior Living D.U. $2,932 $922 $566 620 Nursing Home bed $738 $298 $206 560 Church (Non-Sanctuary Space Only) 1,000 sf $2,164 $894 $638
520/522/530 Private School student $556 $229 $161 565 Day Care (Child or Adult) student $506 $207 $128 710 Office 1,000 sf $4,366 $1,873 $1,470 720 Medical Office 1,000 sf $16,144 $6,979 $5,647 820 Retail < 20K Sq. Ft. 1,000 sf $6,813 $2,748 $1,699 820 Retail (large >=20 ksf, Shop Ctr.) 1,000 sf $9,124 $3,809 $2,467
Various Convenience Retail 1,000 sf $30,200 $12,169 $7,517 936/937 Coffee/Donut Shop 1,000 sf $11,599 $4,559 $2,646 931/932 Restaurant - Sit Down 1,000 sf $24,194 $10,092 $6,666 933/934 Restaurant - Fast Food 1,000 sf $22,561 $8,867 $5,146 944 Gasoline Station Fuel Pos. $15,849 $6,260 $4,130 850 Supermarket 1,000 sf $11,471 $4,676 $2,956 848 Garage / Auto Repair 1,000 sf $5,464 $2,230 $1,567 912 Bank/Savings/Credit Union 1,000 sf $9,040 $3,616 $2,428
110/140 Manufacturing 1,000 sf $2,424 $1,042 $766 150/154/157 Passive Warehouse (Storage warehouse) 1,000 sf $949 $408 $300 155/156 Active Warehouse (Parcel hub/fulfilment center) 1,000 sf $4,346 $1,868 $1,373 151 Mini-Warehouses 1,000 sf $553 $235 $163
Note: 1. This rate is applicable to all dwelling units in buildings of three or more floors, including units on floors 1 and 2.
W.E. Oliver, P.E., and Kittelson and Associates, Inc. Seminole County, Florida April 21, 2020 2020 Mobility Fee Update Study
ES-4

DRAFTSeminole County, Florida
2020 Multi‐Modal Mobility Fee Study
1. Introduction
Impact and mobility fees are a way for local governments to involve new developments in
funding a portion of the mobility infrastructure needs they create in a community.(1) In
contrast to historical “proportionate share” methods associated with concurrency of addressing
the transportation impacts of developments, impact and mobility fees are viewed as
predictable, equitable, and fair, creating a level playing field for developers(2). If developed in
concert with community mobility goals, they are an indication that a community takes seriously
the delivery of a mobility system that is responsive to community needs.
Mobi l i ty fees are one‐time, up‐front charges for a portion of a development’s transportation
impacts. Payment is usually made at the time of building permit or certificate of occupancy
issuance. Essentially, impact fees require that new development that adds travel to the
mobility system pay an appropriate share of the capital facilities required to serve that
development.
This 2020 Mobility Fee Study was undertaken by W.E. Oliver, P.E., and Kittelson and Associates,
Inc. in response to requirements of Florida Statutes that such fees be developed using the
“most recent and localized data”. Seminole County’s impact fees ordinance requires review
and endorsement of its fees every four years to address statutory requirements.
Mobility strategies in Central Florida are shifting to orient towards the implementation of
SunRail and associated enhancements to transit, bike, and walking modes of travel as well as
upcoming major investments in the Interstate 4 corridor. These major investments, however,
do not serve the entire county equally, so Seminole County is seeking to guide the form and
location of future development through the fee program by more clearly defining and
reinforcing differences in mobility strategies in their Core, Suburban, and Rural areas. In
addition, they desire to better position themselves to address routine mobility system
operational and maintenance needs and to respond to forecasted growth. Thus, this study
considered the current transportation revenue program, and developed fee schedules for
Board of County Commissioner consideration in light of these goals.
(1) Florida Statutes 163.3180 (2)
(2) “Impact Fees and Housing Affordability: A Practitioners Guide”, Bowles, L.K., and Nelson, A.C., 2008.
W.E. Oliver, P.E., and Kittelson and Associates, Inc. Seminole County, Florida April 21, 2020 2020 Mobility Fee Update Study
-1-

--- EJ
------· -· -----I I
DRAFT2. Outlook for Growth and Infrastructure Needs
Growth in Seminole County slowed during the “Great Recession” of 2007 to 2012 but has
returned in recent years. Since 2012, growth has returned due to the Orlando metropolitan
area continuing to expand into south Seminole County. Growth in central Seminole County is
encouraged by the Central Florida Regional Growth Vision and is anticipated in response to
advancement of SunRail and Interstate 4 construction plans. Growth in the northwestern
County and in proximity to Interstate 4 is expected to accelerate, fueled by construction of the
Wekiva Parkway and Interstate 4 improvements.
Indicators of growth include motor fuel sales in the County, historic traffic counts, tracking and
forecasts of population growth from the University of Florida Bureau of Economic and Business
Research (BEBR), and forecasts of growth in travel demand of Seminole County’s 2040
Transportation Plan. Graphics illustrating the growth trends of these sources are provided in
Figure 2‐1.
There is a clear indication of increasing fuel consumption in Seminole County. The motor fuel
sales graph indicates steady growth from 2000 to 2007, shows a contraction during the
Figure 2‐1: Seminole County Travel Growth Indicators
Gallons per Y
ear
Millions
Certified Annual Total Fuel Sales Seminole County
240 17
220 16 200
15 180
14 160 Seminole
13140 Recent
120 12Daily VMT
100 11 2000 2002 2004 2006 2008 2010 2012 2014 2016 2018 2020
Year
Daily
VMT
Millions
AADT
Historic Traffic Counts 160,000
140,000
120,000
100,000
80,000
60,000
40,000 I‐4
SR 436 SW 20,000
Int'l Pkwy 0 2002 2004 2006 2008 2010 2012 2014 2016 2018
Year
Population
Thousands
BEBR Medium Population Forecast Seminole County
600
550
500
450
400 Future
350 Past
300
250 2010 2020 2030 2040
Year 2050
Estimated
Person‐M
iles o
f Travel
Seminole County 2040 LRTP PMT Growth
17,000,000
16,000,000
15,000,000
14,000,000
13,000,000
12,000,000
11,000,000
10,000,000
9,000,000
8,000,000 2015 2020 2025 2030 2035 2040 2045 2050
Year
W.E. Oliver, P.E., and Kittelson and Associates, Inc. Seminole County, Florida April 21, 2020 2020 Mobility Fee Update Study
-2-

DRAFTrecession years of 2008‐2012, but a return to growth from 2012 to 2018. Review of three
traffic count stations (one on I‐4, one in southwest, and one in northwest indicate growth in the
I‐4 corridor, but relatively stable traffic volumes at the other stations.
BEBR forecasts a future annual growth rate in population of 0.85 percent per year, with
population increasing by 24 percent from 2019 to 2040. The forecast of Seminole County’s
2040 Transportation Plan shows a higher 1.23 percent per year rate of travel growth. The
faster rate of increase in travel than in population indicates an encouraged higher rate of
employment growth in Seminole County, and is also partially due to the development of the
Wekiva Parkway – an element of a beltway around the Orlando metropolitan area. The
encouragement of employment growth is mirrored in the County’s Comprehensive Plan, which
has established Urban Centers and Corridors Overlay areas and High Intensity Planned
development (HIP) areas to encourage more intense and high‐value job creation and housing.
This impact fee update focuses on travel growth on County and State “surface” arterial roads,
as opposed to toll roads and Interstate 4. Toll roads and Interstate highways are financed by
user‐paid tolls or federal funds that are allocated on a national level, and are not addressed
through County‐levied impact fees. Therefore, travel on these types of roads is excluded from
consideration in this study.
For the 25‐year (2019 to 2044) planning horizon, annual growth in travel on surface arterials is
estimated to average 115,802 person‐miles per year. (Person‐miles of travel are used in this
multi‐modal analysis to allow mixing of transit and vehicle‐travel, costs, and capacity. A person‐
mile of travel is one person traveling one mile be it on a bus or other motorized vehicle.) In
early years, an annual growth of 106,100 person‐miles per year is expected. To keep pace with
this growth rate, the County would need to add the equivalent of 9.2 lane‐miles of roadway per
year at an annual cost of approximately $64.3 million. The 2040 Transportation Plan proposes
to fund capacity at a slower rate, a rate of $48.2 million per year. An additional $4.4 million
annually of bicycle, sidewalk, ITS, and safety needs have been identified in Seminole County’s
2040 Transportation Plan, for a total annual need of $52.6 million. The funding rate in recent
years has been approximately $47.4 million between State and Federal “surface arterial”
funding, County sales tax, County gasoline tax, and roads impact fee funding.
W.E. Oliver, P.E., and Kittelson and Associates, Inc. Seminole County, Florida April 21, 2020 2020 Mobility Fee Update Study
-3-

DRAFT3. 2040 Long‐Range Transportation Plan
To address mobility needs, Seminole County and local municipalities have developed a 2040
Transportation Plan. The Plan proposes the addition of 59.9 lane‐miles of State and County
“surface arterial” roadway over the roughly 22‐year horizon of the Plan, or at a rate of 2.7 lane‐
miles per year.
The County’s portion of this plan proposes the County participate in delivering 37.3 lane‐miles
of roadway additions, 50 miles of bike and pedestrian trails, and 46 miles of complete‐streets
projects. The Plan develops the walking, biking, and roadway travel network in three funding
“Tiers”. Tier 1 includes projects that are fundable with the current revenue program, including
the LGIST that expires at the end of 2024. Tier 2 includes additional projects that could be
funded if the LGIST is extended from 2025 through 2030, and Tier 3 includes additional projects
that could be funded if the LGIST is extended from 2031 through 2040. The costs of County
projects in these Tiers are $240 million, $150 million, and $250 million in 2017 dollars.
The County share of roadway lane‐addition was estimated to cost $161.5 million, of which
$151.5 million depends on Tier 2 and Tier 3 LGIST funding. Thus, the majority of County lane
addition (94 percent) is dependent on extension of the LGIST. If fully funded, the Plan would
add an estimated 0.77 person‐miles of capacity per person‐mile of growth in travel.
While action to renew the LGIST is not necessary now, to allow the County to consider
alternative funding strategies to address unfunded portions of the Plan and SunRail needs,
alternative mobility fee schedules are developed and discussed in Appendix E of this report,
following discussion of other aspects of fee schedule development.
Reviewing the 2040 Transportation Plan by geographic subarea sheds additional light relevant
to mobility fee development. Three geographic subareas of Seminole County, illustrated in
Figure 3‐1, have been proposed where varying development densities have emerged and
different mobility strategies are planned in the 2040 Transportation Plan. The three geographic
areas are characterized as Rural, Suburban, and Core – and each has very different
development densities, needs, and ability to be served by alternate forms of mobility. Mobility
strategies means the degree to which different modes of travel (e.g. car, rail and bus transit,
bicycling, and walking) are relied upon and the quality of service to be provided by each mode.
Table 3‐1 summarizes some simple measures contrasting the differences in district character
that suggest different mobility strategies by 2044. (Note that the values in these tables exclude
Toll and Interstate highway values and exclude the SunRail system.) The values in this table
W.E. Oliver, P.E., and Kittelson and Associates, Inc. Seminole County, Florida April 21, 2020 2020 Mobility Fee Update Study
-4-

I I I I I
I I I I I
I I I I I
DRAFTFigure 3‐1: Proposed Mobility Fee Districts
Table 3‐1: 2044 Forecast Simple Mobility Measures
Measure District
Rural Suburban Core Total Upland Area (sq mi): 94.7 176.6 49.3 320.6
2044 Population: 21,584 386,947 164,681 573,212 2044 Employment: 4,325 212,605 168,029 384,959
Population/Square Mile: 228 2,191 3,340 1,788 Employment/Square Mile: 46 1,204 3,408 1,201
Person Trip-ends: 60,845 2,262,438 1,453,495 3,776,778 Trip-ends/Square Mile: 642 12,812 29,483 42,937
Productions:Attraction Ratio: 2.33 0.90 0.67 0.82
Lane-Miles of Major Road: 93.6 642.1 474.7 1,210 Lane-Miles of Major Road per Square Mile: 1.0 3.6 9.6 3.8
Person-Miles of Arterial Road Capacity: 932,716 7,778,120 5,706,602 14,417,438 PTE/PM C: 0.065 0.291 0.255 0.262
Lynx Route-Miles: 0.0 57.4 70.9 128.3 Percent Major Roads Covered: 0% 27% 62% 40%
Lynx Bus-Miles/Day: 0 4,041 8,196 12,237 Bus-Miles/Person: 0.000 0.010 0.050 0.021
Person-Miles of Lynx Bus System Capacity: 0 121,221 245,877 367,098
Estimated Person-Miles of Travel: 739,654 5,327,717 4,799,359 10,866,729 Estimated Person-Miles of Mobilty System Capacity: 932,716 7,899,341 5,952,478 14,784,536
Proportion of Capacity by Bus: 0.0% 1.5% 4.1% 2.5% PM T:PM C Ratio: 0.793 0.674 0.806 0.735
Notes: 1. Excludes Interstate and Toll roads, and SunRail.
2. Sources include Seminole County GIS Department, Seminole County 2040 LRTP. 3. 2044 values extrapolated by W.E. Oliver, P.E., LLC
W.E. Oliver, P.E., and Kittelson and Associates, Inc. Seminole County, Florida April 21, 2020 2020 Mobility Fee Update Study
-5-
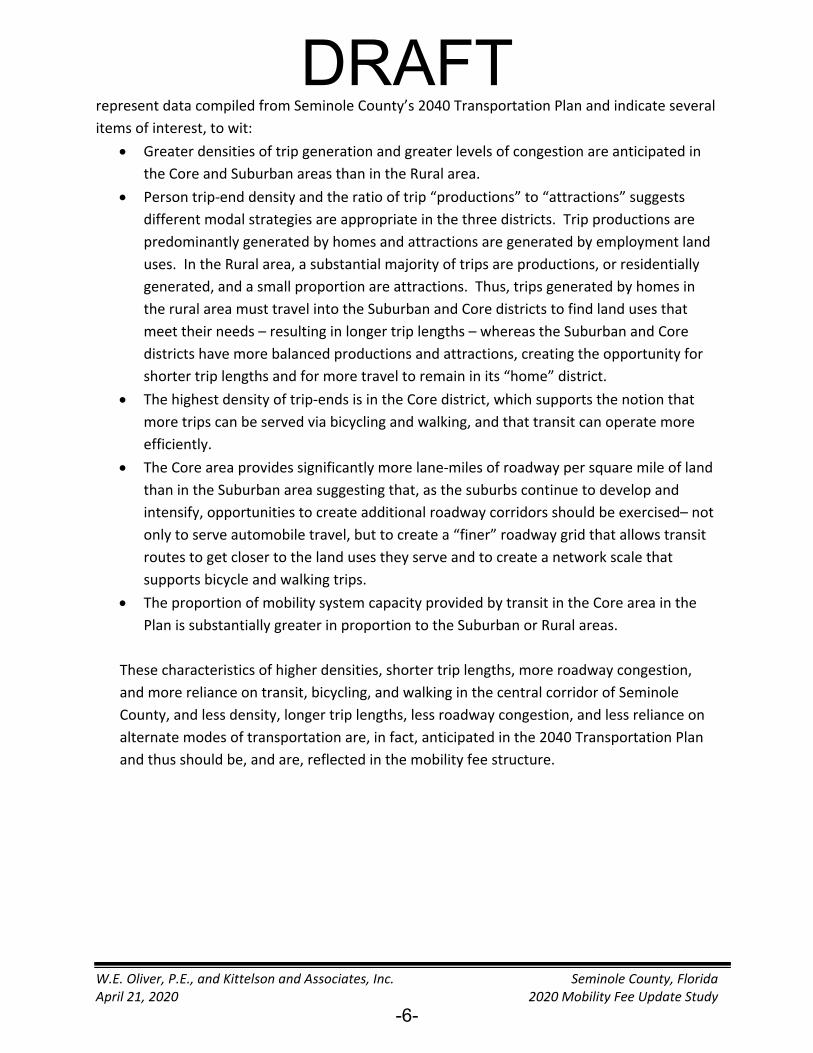
DRAFTrepresent data compiled from Seminole County’s 2040 Transportation Plan and indicate several
items of interest, to wit:
Greater densities of trip generation and greater levels of congestion are anticipated in
the Core and Suburban areas than in the Rural area.
Person trip‐end density and the ratio of trip “productions” to “attractions” suggests
different modal strategies are appropriate in the three districts. Trip productions are
predominantly generated by homes and attractions are generated by employment land
uses. In the Rural area, a substantial majority of trips are productions, or residentially
generated, and a small proportion are attractions. Thus, trips generated by homes in
the rural area must travel into the Suburban and Core districts to find land uses that
meet their needs – resulting in longer trip lengths – whereas the Suburban and Core
districts have more balanced productions and attractions, creating the opportunity for
shorter trip lengths and for more travel to remain in its “home” district.
The highest density of trip‐ends is in the Core district, which supports the notion that
more trips can be served via bicycling and walking, and that transit can operate more
efficiently.
The Core area provides significantly more lane‐miles of roadway per square mile of land
than in the Suburban area suggesting that, as the suburbs continue to develop and
intensify, opportunities to create additional roadway corridors should be exercised– not
only to serve automobile travel, but to create a “finer” roadway grid that allows transit
routes to get closer to the land uses they serve and to create a network scale that
supports bicycle and walking trips.
The proportion of mobility system capacity provided by transit in the Core area in the
Plan is substantially greater in proportion to the Suburban or Rural areas.
These characteristics of higher densities, shorter trip lengths, more roadway congestion,
and more reliance on transit, bicycling, and walking in the central corridor of Seminole
County, and less density, longer trip lengths, less roadway congestion, and less reliance on
alternate modes of transportation are, in fact, anticipated in the 2040 Transportation Plan
and thus should be, and are, reflected in the mobility fee structure.
W.E. Oliver, P.E., and Kittelson and Associates, Inc. Seminole County, Florida April 21, 2020 2020 Mobility Fee Update Study
-6-
DRAFT4. Impact Fee Guiding Principles
Several legal requirements and principles are either directly identified, or are implied, through
case law or in State law that govern the development and assessment of impact fees.
Impact fees must meet principles described as the “dual rational nexus” test. That is, the fees
assessed must be in proportion to the needs created by the development, and fees collected
must be applied to render a benefit to the payer. Seminole County’s mobility fee meets the
first condition by basing the fee on the quantity of transportation system capacity consumed by
the development and recognizing credits for transportation revenues generated by the
development.
The second condition is achieved by establishing districts within which fees collected must be
expended. Changes to the existing districts are proposed in this study, and the County’s Impact
Fee ordinance currently requires that fees collected in a given district be expended within that
district. However, a concept common in many impact fee programs recognizes that travel
generated within any district, to some extent, extends into adjacent districts. Some
communities allow a degree of flexibility to allow some of the funds collected in one district to
be expended in adjacent districts, provided the expenditures benefit the travel from the
originating district. This flexibility is attractive when fees are relatively low, enabling collected
fees to be spent and the benefits of improvements to be realized, more quickly.
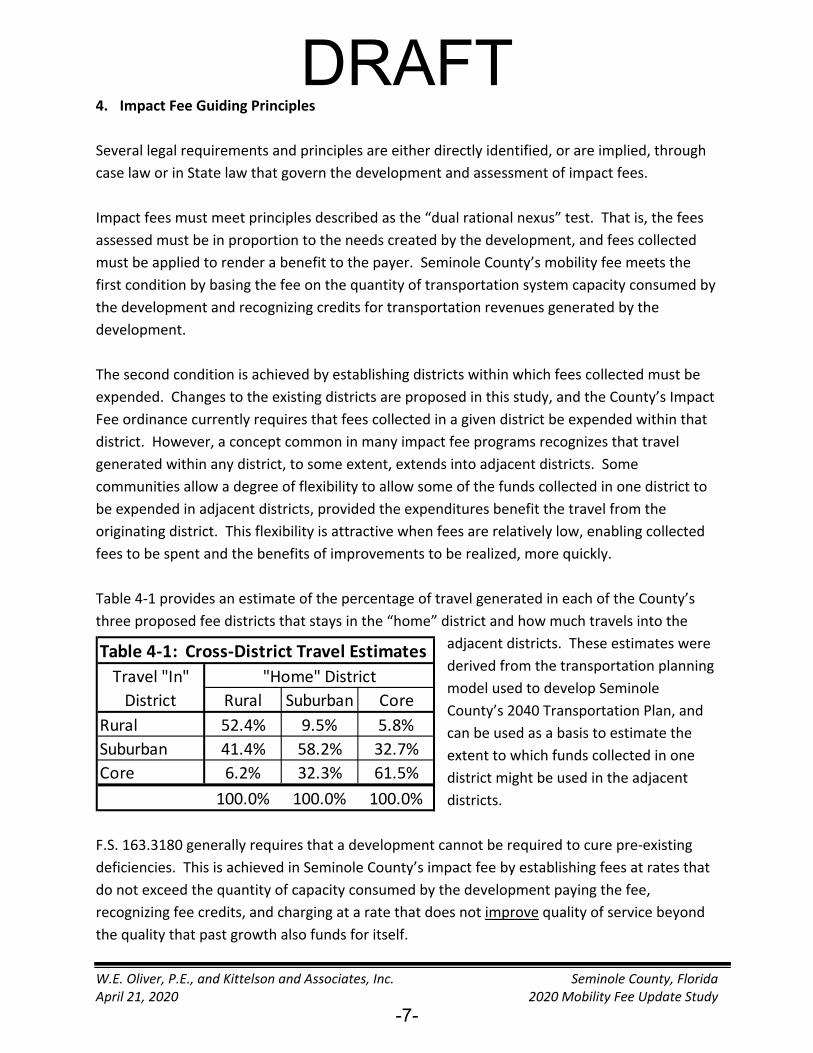
Table 4‐1 provides an estimate of the percentage of travel generated in each of the County’s
three proposed fee districts that stays in the “home” district and how much travels into the
Table 4‐1: Cross‐District Travel Estimates Travel "In" District
"Home" District Rural Suburban Core
Rural 52.4% 9.5% 5.8% Suburban 41.4% 58.2% 32.7% Core 6.2% 32.3% 61.5%
100.0% 100.0% 100.0%
adjacent districts. These estimates were
derived from the transportation planning
model used to develop Seminole
County’s 2040 Transportation Plan, and
can be used as a basis to estimate the
extent to which funds collected in one
district might be used in the adjacent
districts.
F.S. 163.3180 generally requires that a development cannot be required to cure pre‐existing
deficiencies. This is achieved in Seminole County’s impact fee by establishing fees at rates that
do not exceed the quantity of capacity consumed by the development paying the fee,
recognizing fee credits, and charging at a rate that does not improve quality of service beyond
the quality that past growth also funds for itself.
W.E. Oliver, P.E., and Kittelson and Associates, Inc. Seminole County, Florida April 21, 2020 2020 Mobility Fee Update Study
-7-

DRAFTF.S. 163.3180 also requires that fees be expended in accordance with a local government’s
plan. An adopted, cost‐affordable Comprehensive Plan Transportation Element or
Metropolitan Planning Organization’s (in this case MetroPlan Orlando MPO’s) transportation
plan can serve this purpose. While Seminole County’s current 2040 Transportation Plan
depends upon yet‐to‐be‐approved renewals of the infrastructure sales tax, it does represent a
goal that the County is currently working toward funding, in conjunction with SunRail funding
needs. This mobility fee study is one of the pieces of the future funding puzzle. It is
recommended that as the revenue picture for transportation changes, the County and MPO
update the adopted 2040 Transportation Plan and the mobility fee to reflect the revenue plan.
F.S. 163.31801 requires that fees be based on most recent data. This fee update study
considers data from regional transportation planning programs, a local transportation plan
study completed in 2018, and actual recent construction costs encountered in the region. The
most currently available information regarding interest rates, fleet fuel efficiency, and other fee
parameters were compiled, as discussed in subsequent sections of this report. Travel demand
characteristics (trip generation rates, trip lengths, and percent new trips) of various land uses
were accepted from prior and nearby studies, as these parameters were expected to be similar
in Seminole County.
F.S. 163.31801 also requires that if new fees or increases in fees are adopted, that a 90‐day or
greater notice be provided.
W.E. Oliver, P.E., and Kittelson and Associates, Inc. Seminole County, Florida April 21, 2020 2020 Mobility Fee Update Study
-8-

DRAFT5. General Fee Equation
The general impact fee equation is:
Fee = Capacity Needed x Cost of Capacity ‐ Credits
For a multi‐modal mobility fee, the capacity needed is the product of person‐trip rate x trip
length x percent new trips x capacity addition ratio / 2. This calculation yields the quantity of
mobility system capacity that is needed to address the capacity consumed by a development in
units of person‐miles of capacity. Person‐trips are used to integrate transit and other modes
into the mobility system costs and modal strategy. The trip rate indicates the number of
person‐trips generated on a daily basis, the trip length is the average length of person‐trips
from the site. Percent new trips is the proportion of trips that represent additional, new travel
that is generated by the land use. For example, some retail land uses (e.g. a convenience store,
fast food, or gasoline station) “capture” traffic from the adjacent street. The “captured” trips
are not additional travel added to the system. The percent new trips factor adjusts the
computation to acknowledge this characteristic.
The capacity addition ratio is a quality of service indicator, representing the long‐term quality of
service desired for the travel. This factor varies by fee district and the modal strategy (e.g. the
mix of roads and transit) for each fee district. This factor is “capped” by the quality of service
funded by the existing population to prevent setting fee rates that improve quality of service.
Finally, the factor of two in the denominator recognizes that the demand for travel arises from
the need to travel between two land uses, and allocates the responsibility for the travel equally
between the two uses.
The cost of capacity is what it costs to deliver mobility system capacity, expressed as a cost per
person‐mile of capacity. The cost to deliver a unit of capacity will vary by geographic subarea,
as it is typically more costly to provide facilities in the urban areas because of impacts to
surrounding land uses. The cost is also affected by modal strategy – Seminole County’s 2040
Transportation Plan proposes that in the rural area, mobility system capacity will primarily be
added through road construction. In the suburban and core districts, however, greater
emphasis will be placed on transit, bicycling and walking systems. When person‐miles of travel
is multiplied by the cost per person‐mile of capacity, the result is the cost to provide the
infrastructure capacity needed to serve the development at the desired quality of service and
adopted modal strategy. In this study, the costs of SunRail are not considered, as it is the
subject of other studies with funding decisions yet to be made.
W.E. Oliver, P.E., and Kittelson and Associates, Inc. Seminole County, Florida April 21, 2020 2020 Mobility Fee Update Study
-9-

DRAFTCredits are issued to land uses in recognition that their travel generates revenues that are used
to provide capacity in the transportation system. For example, when a vehicle drives to a
development, it burns gasoline, and some motor fuel taxes are often used to construct
transportation system capacity. Or, citizens that travel also generate sales tax revenues, a
portion of which are used to fund mobility system infrastructure. Funds that Seminole County
relies upon for expansion of the mobility system come from the County’s “9th‐cent” motor fuel
tax, a portion of the Local Government Infrastructure Sales Tax, and impact fees.
Seminole County levies ten of the allowed 15 pennies of motor fuel taxes per gallon, and
allocates revenues from 14.91 of these 15 pennies to maintain and operate their transportation
system. A small portion of the 9th Cent tax on gasoline provides $218,764 per year to fund Lynx
capital needs.
The Federal government and State levy motor fuel taxes as well, and allocates a portion of
them to expanding Federal and State highways. Federal and State expenditures for
transportation system expansion are administered by the Florida Department of Transportation
(FDOT). FDOT’s Work Program for the past six years (2013 to 2019) and planned for the coming
five years (2020‐2024) was reviewed and an annual funding level of $25.7 million was derived,
which is the equivalent of 10.68 pennies per gallon of motor fuel tax. An additional 0.31
pennies of equivalent motor fuel tax revenue is provided based on typical Federal capital
funding rates for Lynx bus system expansion capital costs.
The Board of County Commissioners receives 55.6 percent of the LGIST (the other 44.4 percent
is directed to the School Board or shared with municipalities). 44.1 percent of the County’s
55.6 percent of LGIST is committed to developing the County’s mobility system. For purposes
of establishing a credit to each land use, it was assumed that the sales tax credit would be
allocated to various developments in equal proportion to the needs created. For example, if
one development creates the need for $1 million of capacity, and another creates the need for
$2 million, the sales tax would be allocated to help each in that 1:2 proportion – thus creating
the ability to credit the sales tax as if it were a motor fuel tax, allocating it based on the
quantity of travel generated. The share of LGIST committed to mobility system expansion is
$18.5 million in 2018, and over the 25‐year horizon of this mobility fee study is the equivalent
of 13.02 pennies per gallon of gasoline tax.
W.E. Oliver, P.E., and Kittelson and Associates, Inc. Seminole County, Florida April 21, 2020 2020 Mobility Fee Update Study
-10-

DRAFT6. Fee Parameters
a. District Strategies
Changes to the existing fee district boundaries to reflect a “Rural”, “Suburban”, and “Core” area
strategy is adopted in this update study, as is discussed in Section 3. Based on both technical
and policy merits, fees are highest in the Rural district, and step down in the Suburban district,
and are lowest in the Core district. This strategy supports Seminole County’s Comprehensive
Plan Land Use and Transportation Element issues and policies encouraging infill and higher‐
density development in the urbanized areas of the County, and protection of rural character in
rural areas.
b. Land Uses in Fee Schedule
Seminole County’s historical fee schedule included 36 land use categories. Two land uses,
“Utility Substation” and “Racquet Club” were eliminated from the fee schedule. Replacing
“Racquet Club” is “Fitness Center”. In addition, single‐family residential uses were stratified
into three size ranges to reflect differences in travel generation. The size ranges are 0‐1,500
s.f., 1,501 to 2,500 s.f., and greater than 2,500 s.f. A new land use, Coffee/Donut Shop, was
added, and retail land uses were re‐organized to provide for Convenience Retail (e.g.
convenience stores), small retail (<20,000 s.f.), and large retail (>=20,000 s.f.).
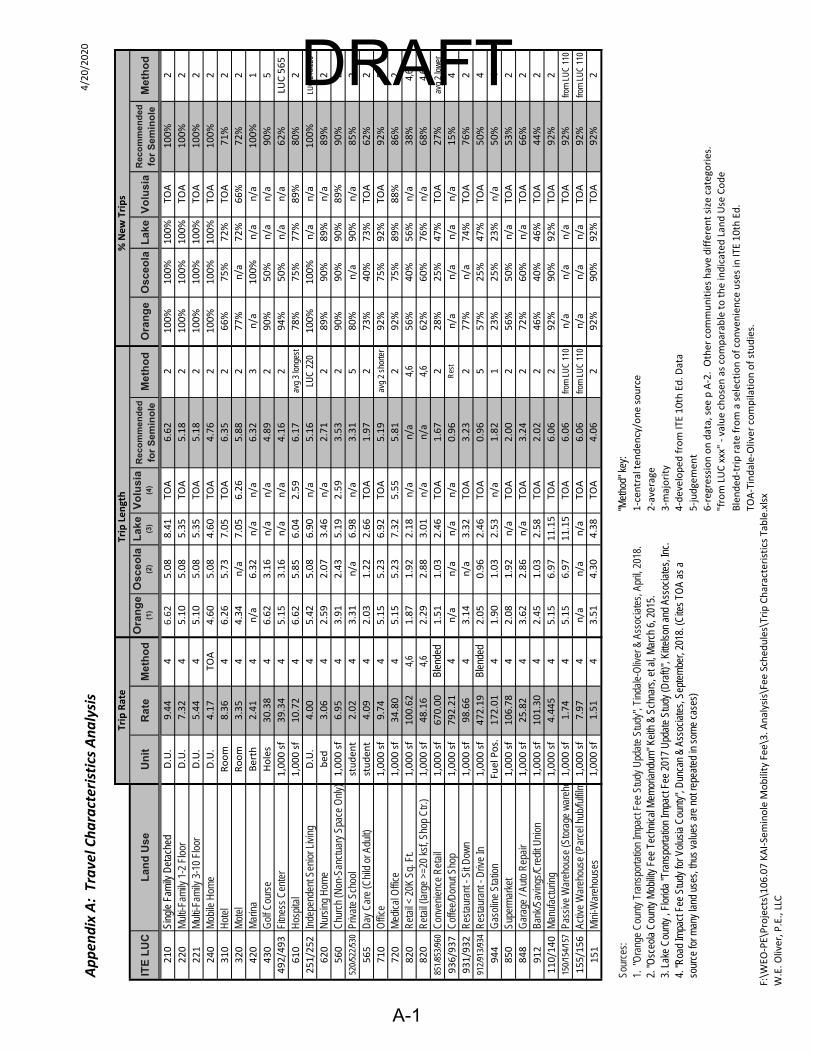
c.Travel Demand Variables
Three travel demand parameters are multiplied to calculate the amount of transportation
system capacity that is used by a land development activity: (1) number of trips generated, (2)
length of the trips, and (3) percent of the trips that are newly generated rather than captured
from existing travel on the roadway system. Trip generation rates and percent new trips
information was compiled from the Institute of Transportation Engineers’ (ITE) Trip Generation
10th Edition (2017) reference. This data, and trip length data, was then compared to similar
data from fee schedules of nearby communities (Volusia, Orange, and Osceola Counties) and
information from literature available on the internet to ensure consistency and reasonableness.
Trip lengths were adjusted by district, estimates of the extent to which travel generated in each
district relies on Toll roads or Interstate 4, and estimates of the extent to which travel
generated in each district travels into adjacent districts were developed using information
extracted from the 2040 Transportation Plan model. Data and analyses supporting these
variables are provided in Appendix A.
W.E. Oliver, P.E., and Kittelson and Associates, Inc. Seminole County, Florida April 21, 2020 2020 Mobility Fee Update Study
-11-

DRAFTd. Facility Costs
Actual costs of recent State road construction projects were obtained from FDOT involving 23.7
lane‐miles of roadway construction in the Suburban and Core districts. FDOT Cost per Mile
tables were consulted to estimate a State rural construction cost as well, since there was no
actual rural area construction recently in Seminole County. Seminole County’s recent road
construction experience is also limited, so costs from Orange County’s Capital program were
consulted as a basis to develop County roadway costs. Using this central Florida information,
County road construction costs were estimated at approximately 76 percent of the State
construction costs.
This information, summarized in Table 6‐1, indicates costs per lane‐mile of $4.3 million, $8.6
million, and $10.5 million per lane‐mile for the FDOT to add lanes to an existing road in the
rural, suburban, and core areas, respectively. These costs include design, right‐of‐way,
drainage, environmental mitigation, construction, and construction inspection cost elements.
Supporting data is provided in Appendix B.
Table 6‐1: Estimated Cost per Lane‐Mile for Roadway Expansion
Location
Design/CEI Cost/ Lane‐
Mile
Design/CEI as
% of Construction
Right‐of‐
Way Cost/ Lane‐Mile
Right‐of‐Way as % of
Construction
Construction Cost/ Lane‐
Mile Total Cost/ Lane‐Mile
Capacity per Lane
Cost per Vehicle‐
Mile of Capacity
Core $946,757 15% $3,155,856 49% $6,416,907 $10,519,520 10,047 $1,047 Suburb $899,870 15% $1,799,740 31% $5,870,582 $8,570,192 10,848 $790 Rural $521,243 17% $694,991 22% $3,091,099 $4,307,333 9,650 $446
76%
Core $719,535 15% $2,398,450 49% $4,876,849 $7,994,835 9,545 $838 Suburb $683,901 15% $1,367,803 31% $4,461,642 $6,513,346 10,306 $632 Rural $396,145 17% $528,193 22% $2,349,235 $3,273,573 9,168 $357
State
County
To develop a weighted mix of State and non‐State road improvements, the County’s 2040
Transportation Plan was consulted, which indicates a 44:46 lane‐mile relationship between
State road and County road widening.
Plans for transit service in Seminole County’s 2040 Transportation Plan include the expansion
of Lynx transit service in the Core and Suburban areas to provide increased access to the SunRail
system, as well as improve commuter services. Lynx’s current Transit Development Program
(2018) indicates service expansion at a rate of 3.3 percent per year over the ten‐year horizon of
the plan. This rate of expansion was extrapolated through 25 years, with service increases
focused on the Core and Suburban areas for this fee study. This rate of service expansion
increases daily bus‐miles of service from 4,421 in 2019 to 9,948 by 2044. This service expansion
would come from added routes, increased frequency of buses, and lengthening the hours
W.E. Oliver, P.E., and Kittelson and Associates, Inc. Seminole County, Florida April 21, 2020 2020 Mobility Fee Update Study
-12-

DRAFTof service. A capital cost per mile computation is provided in Appendix C, indicating costs of
approximately $465 per person‐mile of capacity.
Bicycle and pedestrian travel demands are small relative to the personal vehicle. Nonetheless,
bike and pedestrian facilities are important on a road for safety and mobility reasons, and they
are a standard part of the urban street and rural roadway scene. Bicycle and pedestrian facility
costs are included in standard roadway cross‐sections for which costs are estimated, and their
costs are thereby included in the mobility fee. Their costs have been estimated at from 1.7 to
5.0 percent of roadway costs, depending on the setting. Bike and pedestrian facilities on or off
of the major road network could be funded with mobility fees provided the County is reasonably
sure they will help to serve the travel demands for which developments are being assessed.
Table 6‐2 summarizes the combination of roadway and transit person‐trip cost per person‐mile
of capacity to a system person‐trip capacity by district, based on the mix of State vs non‐
State and estimated type of road section for roads (see Appendix B) and transit capacity
added in each fee district. The combination mixes road and transit capacity based
on the proportions of transit system and road system expansion planned, using person‐
miles of capacity. As indicated in Section 3, transit system expansion is relatively small
compared to the road system expansion plans, but is largest in the Core district.
Using these relationships, mixed‐mode costs per person‐mile of capacity of $367.30, $638.68,
and $601.81 per person‐mile of capacity for the Rural, Suburban, and Core districts were
developed. These costs are, not surprisingly, substantially greater than the $121 to $188 per
person‐mile of capacity developed in Seminole County’s 1995 Impact Fee Update study. (Note,
the 1995 costs per vehicle‐mile of capacity have been converted here to dollars per person‐mile
of capacity using a factor of 1.4 person‐miles per vehicle‐mile to allow comparison.) As modal
strategies (e.g. mix of transit vs roadway capacity) are modified in a district, these unit costs will
also vary.
Data and analyses supporting mobility system costs are provided in Appendix B.
e. Revenue Credits
As discussed previously, Seminole County levies ten of the allowed 15 pennies of motor fuel
taxes per gallon, and allocates the majority of the revenues from these ten pennies to maintain
and operate their transportation system. The only current County‐level motor fuel tax
commitment to capital facilities is a $218,764 annual commitment (in 2019) to fund Lynx capital
needs. This annual commitment was determined to be an equivalent of 0.09 penny of County
motor fuel tax credit against the mobility fee.
W.E. Oliver, P.E., and Kittelson and Associates, Inc. Seminole County, Florida April 21, 2020 2020 Mobility Fee Update Study
-13-

DRAFTTable 6‐2: Computation of Mixed‐Mode Cost per Person‐Mile of Capacity
District Rural Suburb Core Total
2010 Person‐Miles of Capacity: Road 591,557 6,908,514 5,114,446 12,614,518 Bus 0 40,400 92,240 132,640
Sub‐Total: 591,557
2040 Person‐Miles of Capacity:
6,948,914 5,206,687 12,747,158
Road 932,716 7,778,120 5,706,602 14,417,438 Bus 0 52,563 245,877 298,440
Sub‐Total: 932,716
Change in PMC:
7,830,683 5,952,478 14,715,878
Road 341,159 869,606 592,155 1,802,920 Bus 0 12,163 153,636 165,800
Sub‐Total: 341,159
Capital Cost/PMC:
881,769 745,792 1,968,720
Road $457.20 $641.09 $637.45 $605.10 Bus $0.00
Capital Cost:
$466.67 $464.45 $464.62
Road $155,979,123 $557,492,067 $377,468,137 1,090,939,327 Bus $0
Combined:
$5,676,355 $71,357,168 77,033,523
PMC Added: 341,159 881,769 745,792 1,968,720 Total Cost: $155,979,123 $563,168,422 $448,825,305 $1,167,972,850
Weighted Cost/PMC: $457.20 $638.68 $601.81 $593.27 Notes:
1. PMC=Person‐Miles of Capacity 2. Quantities of capacity added by mode are based on Seminole County 2040
Transportation Plan and Lynx 2018 Transit Development Plan, as discussed in text.
The Federal government and State of Florida levy motor fuel taxes as well, and allocate a
portion of them to expanding Federal and State highways. Federal and State expenditures for
transportation system expansion are administered by the Florida Department of Transportation
(FDOT). FDOT’s Work Program for the past six years (2013 to 2019) and planned for the coming
five years (2020‐2024) was reviewed and an annual funding level of $25.7 million was derived,
W.E. Oliver, P.E., and Kittelson and Associates, Inc. Seminole County, Florida April 21, 2020 2020 Mobility Fee Update Study
-14-
DRAFTwhich is the equivalent of 10.68 pennies per gallon of motor fuel tax. In addition, an effective
State and Federal motor fuel tax rate of 0.31 pennies per gallon results from the transit system
expansion assumptions incorporated into this analysis (see transit plan assumptions worksheet
in Appendix C), which is also added to the credit.
An equivalent LGIST credit was incorporated by comparing the potential annual sales tax
revenues that might be shifted into transportation system expansion to the annual revenues
generated by a one penny motor fuel tax. If extended through 2044, the sales tax commitment
would be equivalent to 13.02 pennies per gallon of motor fuel tax. In the alternative fee
schedules in Section 8, various termination dates of the sales tax are considered, which affects
the number of equivalent pennies of motor fuel tax associated with this revenue source. The
calculation of the sales tax to motor fuel tax equivalency, extended through 2044, is also
provided in Appendix C. When the sales tax lapses earlier than 2044, then a smaller number of
equivalent pennies are recognized.
For purposes of computing the revenue credits, the Interstate and toll roads portions of the trip
length and a 0.5‐mile local trip length add‐on are included, because motor fuel tax revenues are
generated without regard to which road system a vehicle is driven upon – on a toll road, on a
state road, or on a local street. Thus, in this calculation, the equivalent gasoline tax is estimated
assuming a longer trip length than used in the travel demand equation. Since the taxes are a
recurring revenue, the present value of 25 years of this source is recognized as the credit.
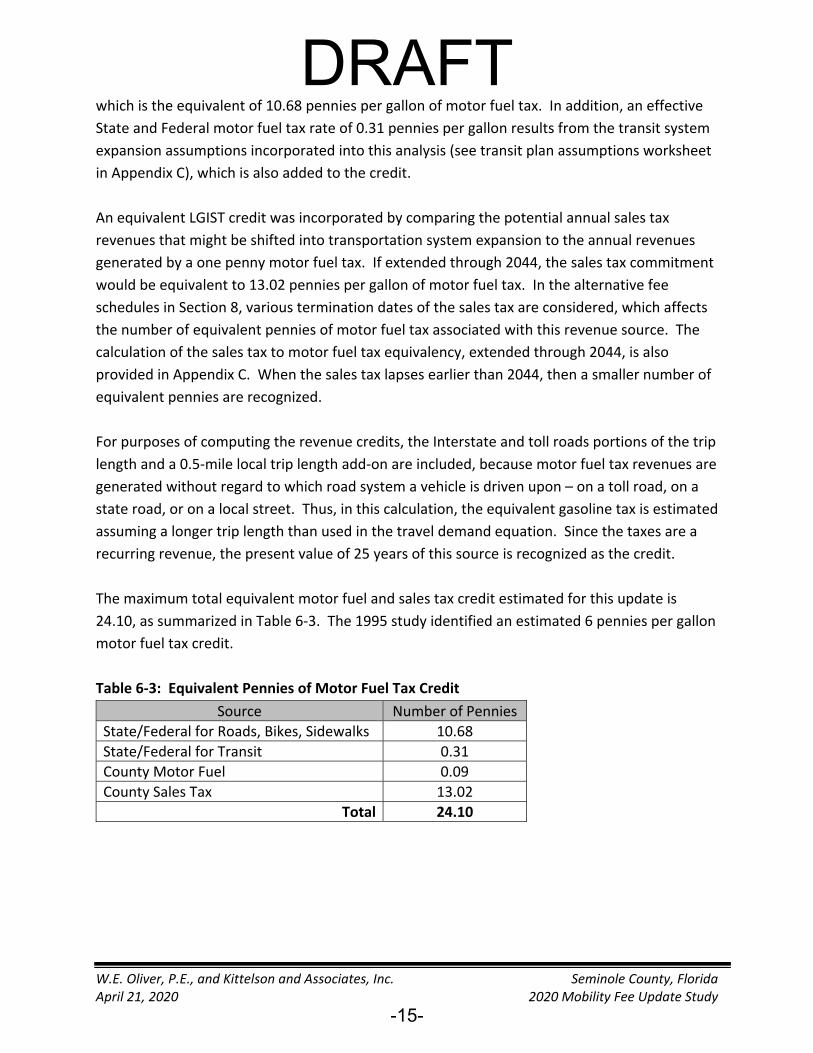
The maximum total equivalent motor fuel and sales tax credit estimated for this update is
24.10, as summarized in Table 6‐3. The 1995 study identified an estimated 6 pennies per gallon
motor fuel tax credit.
Table 6‐3: Equivalent Pennies of Motor Fuel Tax Credit
Source Number of Pennies
State/Federal for Roads, Bikes, Sidewalks 10.68
State/Federal for Transit 0.31
County Motor Fuel 0.09 County Sales Tax 13.02
Total 24.10
W.E. Oliver, P.E., and Kittelson and Associates, Inc. Seminole County, Florida April 21, 2020 2020 Mobility Fee Update Study
-15-

DRAFTf. Other Fee Parameters
Other parameters that are used to calculate the fees are discussed in this section.
Interest rate – the present value factor for the capacity‐expanding revenue credits is
based on 25 years at a 3.3% discount rate. The discount rate is based on FDOT’s guidance on
construction cost inf lat ion for transportation planning purposes. A copy of this data source
is provided in Appendix D.
Finance Period – The 25‐year finance period is commonly used in transportation impact fee
analyses, and represents the typically assumed life of transportation capital investments.
Equivalent days/year – for estimating revenue credits, 326.9 (= 365*6.27/7) days per year were
used. 6.27 days per week is used to reflect that the amount of travel on Saturdays and Sundays
are less than on a typical weekday. A worksheet summarizing the value calculated is also
provided in Appendix D.
Fuel Efficiency – 22.0 mpg for light vehicles, from FHWA Table VM‐1, provided in Appendix D.
Toll/Interstate Travel Discount – the proportion of travel generated in each fee district that uses
the toll or Interstate highway system was estimated by executing three select‐zone (all traffic
analysis zones in each of the three fee districts) traffic assignment using the model and highway
network from Seminole County’s 2040 Transportation Plan, and tracking the proportion of
travel on the toll and Interstate highways. This analysis indicated that 8.3, 30.2 and 38.5
percent of the travel generated by the Rural, Suburban, and Core fee districts, respectively, will
be served by Interstate 4 and the Greeneway and Wekiva Parkway toll roads.
W.E. Oliver, P.E., and Kittelson and Associates, Inc. Seminole County, Florida April 21, 2020 2020 Mobility Fee Update Study
-16-

DRAFT7. Example Fee Calculation
An example fee calculation is provided in this section for a 1,501 to 2,500 s.f. single‐family
detached home in the Suburban fee district. The general fee equation, is as presented
previously but here it also recognizes the potential for an across‐the‐board discount decision by
the Board of County Commissioners:
Fee = (Capacity Needed x Cost of Capacity – Credits) x Discount Percentage
Each of these components is described below, with the example calculation. Note that the
calculations here use rounded values and results are slightly different from the “un‐rounded”
actual fee schedule calculations of Appendices F and G, which apply additional decimals.
Capacity Needed is the capacity needed to address the quantity of new travel generated by the
land use that makes use of the mobility system for which the fee is calculated. It is the product
of trips generated, the length of trips on the non‐local road system, the percentage of trips that
are added (as opposed to captured from traffic already passing by the site). This quantity is
divided by two to reflect division of the demand arising between the two land uses at the origin
and destination ends of the trip. This quantity is further reduced in Seminole County’s fee to
deduct the portion of travel that makes use of State and toll roads.
For the single‐family home, this calculation is:
Trip rate x Conversion to Person‐Trips x Standard Trip length x District Trip Length Factor
x Percent new trips X (1‐Interstate and toll proportion) / 2
9.44 x 1.4 x 6.62 x 1.08 x 100% x (1‐0.302) / 2 = 32.98 person‐miles of travel
The weighted unit cost per person‐mile of capacity applied to a land use depends upon the fee
district in which the land use is located, the proportion of travel the land use generates in each
fee district (which is a function of trip length – shorter trips have higher proportions of travel in
the “home” district), the unit cost of capacity for each district (which considers modal strategy),
and the quality of service to be delivered in each district as expressed by the capacity addition
ratio (CAR), as follows:
(% travel in Rural x Rural cost per pmc x Rural CAR + % travel in Suburb x Suburb cost per
pmc x Suburb CAR + % travel in Core x Core cost per pmc x Core CAR)
(0.09 x $457.20 x 1.69 + 0.53 x $638.68 x 0.75 + 0.38 x $601.81 x 0.59) = $459.49
($460.22 in “un‐rounded” calculation)
Total Impact Cost is:
W.E. Oliver, P.E., and Kittelson and Associates, Inc. Seminole County, Florida April 21, 2020 2020 Mobility Fee Update Study
-17-

DRAFTAssessable person‐miles of travel x weighted unit cost
32.98 x $460.22 = $15,178 ($15,173 in “un‐rounded” calculation)
The credit is calculated as:
Present value of (Trip rate x Trip length for revenue x Percent new trips x equivalent
days per year x number of equivalent dollars of gas tax/ (vehicle miles per gallon x 2), at
3.3% APR for 25 years.
[(9.44 x 7.65 x 100% x 326.9 x 0.2410/ (22.0 x 2)] x 16.8451
= $2,178.14
Thus, the resulting gross potential fee is:
$15,173 – $2,178 = $12,995
Recognizing that development that is already in Seminole County (e.g. prior growth) also
generates gasoline and sales tax revenues that fund infrastructure needs allows the County to
not assess the full potential fee amount. It is common in communities to recognize these
additional revenues and to provide an “across‐the‐board” reduction in the fees charged. The
extent to which fees can be reduced depends on the capability of revenues generated by prior
growth to address needs, and are related to community goals for mobility services and quality
of service. Seminole County’s goals and overall mobility infrastructure funding capability is
addressed in the next section of this report.
W.E. Oliver, P.E., and Kittelson and Associates, Inc. Seminole County, Florida April 21, 2020 2020 Mobility Fee Update Study
-18-

8. Fee Schedule
DRAFTThe magnitude of an impact fee should be considered in the context of community goals and
other sources of revenue that are available for transportation purposes.
As discussed in Section 3, Seminole County’s 2040 Transportation Plan provides for adding 0.77
person‐miles of capacity per person‐mile of growth in travel, under the assumption that the
LGIST will continue through the 25‐year “horizon” of this study. In the Rural district the
capacity addition ratio is 1.69 person‐miles of travel per person‐mile of travel growth, in the
Suburban district the ratio is 0.75, and in the Core district the ratio is 0.59. These “goals” affect
the rate at which mobility system capacity needs to be built, and in this case results in a 2019
annual financial need of $52.6 million. The current revenue program (motor fuel taxes, sales
tax, and impact fees) generates an estimated $47.4 million per year, leaving a $5.2 million per
year shortfall. In this revenue program, the legacy road impact fees are assessed at a rate that
is discounted by about 89 percent and they generate approximately $3.1 million of the $47.4
million per year.
Consistent with Comprehensive Plan policies, the Board of County Commissioners elected to
adopt a fee schedule that makes up the estimated 2040 Transportation Plan funding shortfall.
The County’s mobility system needs and revenues, in the context of this fee program, is
summarized in Figure 8‐1. A full fee schedule summary is provided in Table 8‐1, and fee
schedules with interim calculations for the Rural, Suburb, and Core fee districts are provided in
Appendix F.. The fee rates increase compared to the legacy fee rates, but remain lower than
fees in neighboring jurisdictions. The fee rates are 21.2 percent of the maximum fee rates that
could be assessed. In this revenue program, growth pays for 20 percent of the capital costs.
During the public engagement phase of this study, the City of Altamonte Springs communicated
that it wished to implement it’s own mobility fee program. In the process of reaching
agreement on this, the City committed to funding, when needed, the portions of 2040
Transportation Plan projects that were estimated to be funded by the equivalent County
Mobility Fee revenues expected to be collected from development within the City. Thus, the
County mobility fee will not be collected within the City, and the City’s equivalent annual
commitment is reflected as one of the “Potential Revenue Sources” in Figure 8‐1 to partially
fund the 2040 Transportation Plan.
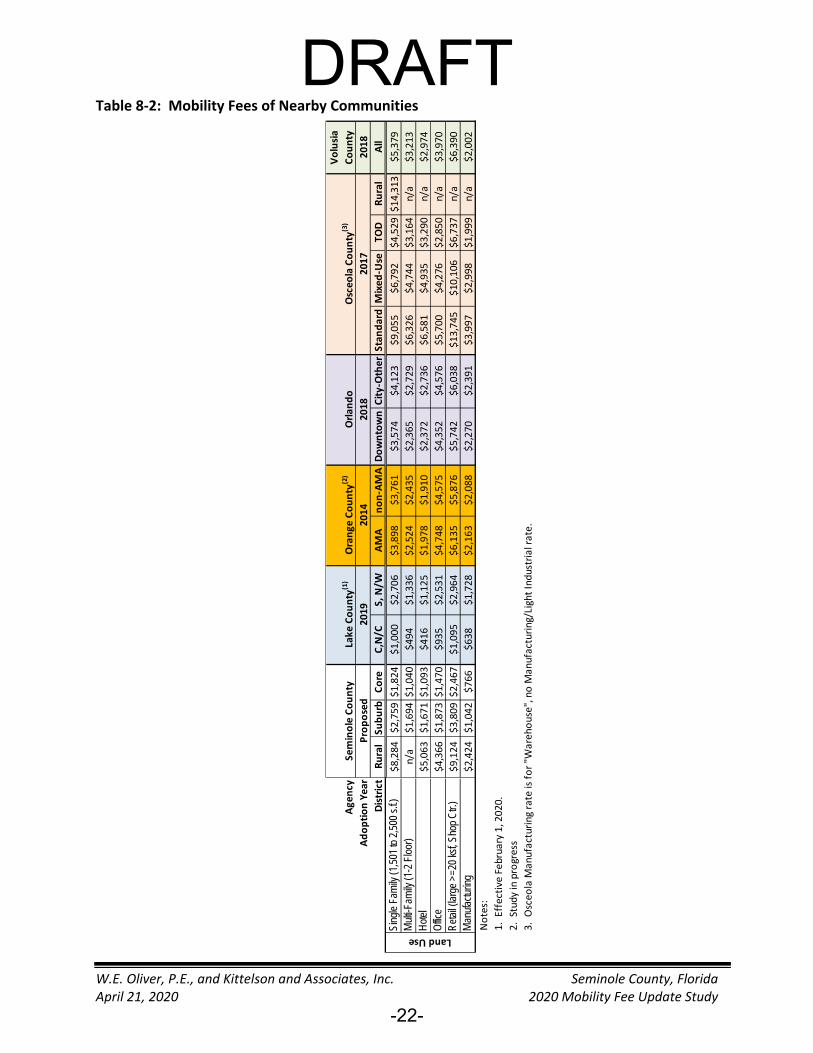
It is always of interest for communities to be aware of how their fees compare to the fees of
nearby communities. Table 8‐2 provides such a summary of the current fees levied by nearby
communities.
W.E. Oliver, P.E., and Kittelson and Associates, Inc. Seminole County, Florida April 21, 2020 2020 Mobility Fee Update Study
-19-

I I I I I I I I I
I I I I I I I I I I I I I I I I I I I I I
DRAFT
W.E. Oliver, P.E., and Kittelson and Associates, Inc. Seminole County, Florida April 21, 2020 2020 Mobility Fee Update Study
Figure 8‐1: Mobility Fee Program Summary
Goals and Nee
ded
Reven
ues
Potential R
even
ue So
urces
"Nee
ds"
To
tal
Ru
ral
Suburban
Core
Growth
Base
To
tal
% of
Need
20
18 A
rt R
N P
MT:
8,45
8,314
43
7,329
3,91
1,87
5 3,57
7,59
8 2n
d LO
GT:
# P
enni
es/%
to C
apita
l>
0 63
.6%
0%
G
row
th R
ate:
1.31%
2.18%
1.30
%
1.24
%
Cou
nty
Gas
Tax
es:
# Pe
nnie
s>>
0.08
6 $3
,633
$1
90,3
12
$193
,945
0%
PM
T G
row
th p
er y
ear:
106,06
6 9,745
51
,484
44,838
Stat
e/Fe
dera
l Gas
Tax
: #
Penn
ies/
Gal
>>
10.9
89
$2,5
19,3
89
$22,
390,
087
$24,
909,
477
47%
Cap
acity
Add
ition
Rat
io:
0.771
1.69
0.75
0.59
In
frastr
uctu
re S
ales
Tax
: End/
BCC
Sha
re to
Cap
>:
2045
32
.5%
$7
44,3
20
$18,
463,
200
$19,
207,
520
37%
Cap
acity
Add
ition
Goa
l: 81,75
5 16
,508
38
,724
26,523
Alta
mon
te S
prin
gs:
Com
mitm
ent
$1,2
89,4
69
2%
Cos
t per
PM
C:
$64
3 $4
57.20
$638
.68
$601
.81
Mob
ility
Fees
: %
of fu
ll fee
: 21
.2%
$7
,003
,195
$0
$7
,003
,195
13
%
Bike
/Ped
and
Oth
er N
eeds
: $4
,361
,785
$0
$2,240
,985
$2
,120
,800
To
tals
: $1
0,27
0,53
7 $4
1,04
3,59
9 $5
2,60
3,60
5 10
0%
% B
ike/P
ed &
Oth
er F
unde
d:
100.0%
10
0.0%
10
0.0%
10
0.0%
Sh
are
of R
even
ues:
20
.0%
80
.0%
$$ N
eede
d/Ye
ar: $52,603,605
$7,547,564
$26,973,539
$18,082,501
G
oal S
urpl
us/S
hort
fall:
$0
La
ne-M
i/Yea
r: 17.40
5.14
7.00
5.27
Network
Perform
ance
Mobility Fee
sR
ura
l Su
burban
Core
Single‐Family (1,501
to
2,500
s.f.)/d
u:
$8,284
$2
,759
$1
,824
Multi‐Family (1‐2 Floor)/du:
n/a
$1,694
$1,040
Office/ksf:
$4,366
$1
,873
$1,470
Retail (>2
0,000
sf)/ksf:
$9,124
$3
,809
$2,467
Indu
strial/ksf:
$2
,424
$1
,042
$766
Notes:
1. T
his an
alysis is
based on estimates
of no
n‐Toll an
d no
n‐Interstate
(e.g. "surface"
arterial
and
collector)
travel and
costs. It include
s the capital portion of tran
sit co
sts for a 277
percent growth in service, focused
in the
Core
and Subu
rban
areas.
2. T
his scen
ario
app
roximates
Sem
inole
Coun
ty's
204
0 Transpo
rtation Plan including its Tiers 1‐3
fun
ding,
with some differences. The co
sts of tran
sportation im
provemen
ts are greater
than
those of the
LRTP
because they are based on
actua
l recen
t experience,
whe
reas the
2040
Transportation Plan
costs are based
on FD
OT "cost
per
mile" estimates
which tend
to und
erestimate freq
uently
enco
untered
add
itional
costs.
The LR
TP rate of capa
city add
ition is represented
by the CAR values
of 1.69,
0.75,
and
0.59 in
the rural,
subu
rban
, and
core
areas, respe
ctively.
3. Mobility fee rates are ba
sed
on the propo
sed
"Core/Sub
urbs/Rural"
fee
district structure, backsolved
toresult in
balan
cing
adjusted nee
ded
reven
ues.
4. The
LGIST is
assum
ed to
continue inde
finitely, at it's
curren
t allocation percentage to expan
sion of the
0.40
0.45
0.50
0.55
0.60
0.65
0.70
0.75
2016
20
18 20
20 20
22 20
24 20
26 20
28 20
30 20
32 20
34 20
36 20
38 20
40 20
42 20
44
VMT:V MC Rati o
Year
VMT:VMC Ratio
by Year
Arterial R
oads
Florida Tren
dline
mobility system
.
-20-
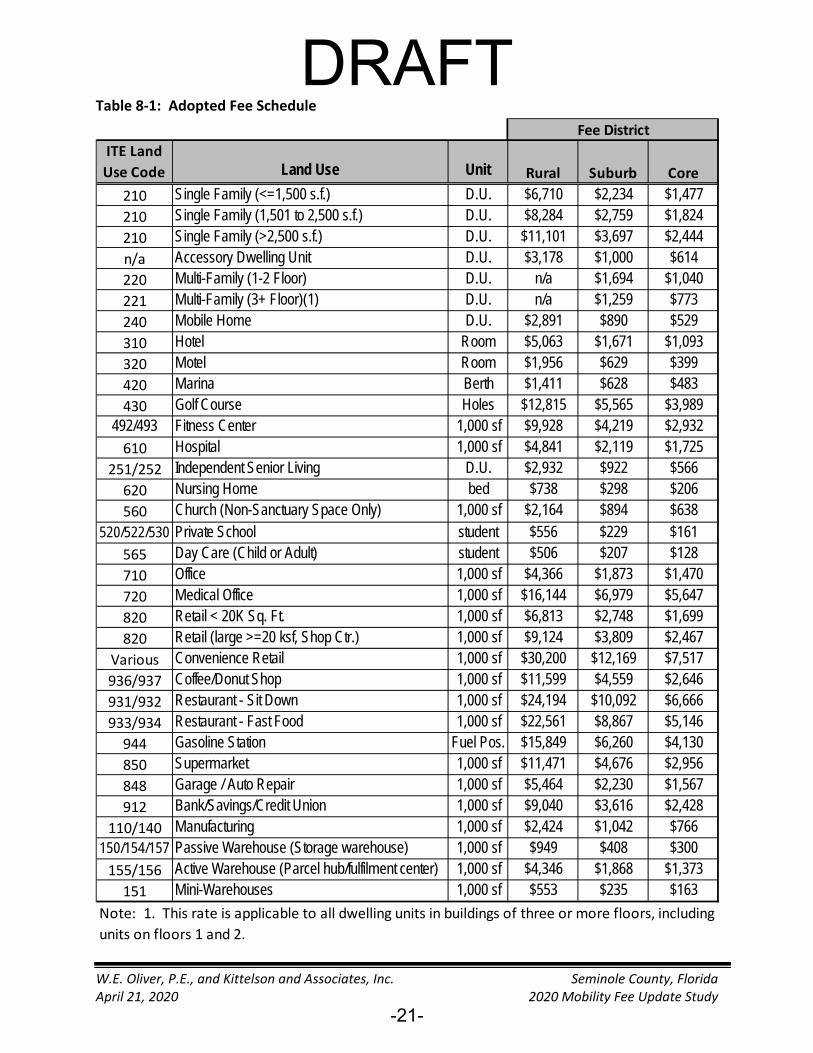
Table 8‐1: Adopted Fee Schedule
DRAFTFee District
ITE Land Use Code Land Use Unit Rural Suburb Core
210 Single Family (<=1,500 s.f.) D.U. $6,710 $2,234 $1,477 210 Single Family (1,501 to 2,500 s.f.) D.U. $8,284 $2,759 $1,824 210 Single Family (>2,500 s.f.) D.U. $11,101 $3,697 $2,444 n/a Accessory Dwelling Unit D.U. $3,178 $1,000 $614 220 Multi-Family (1-2 Floor) D.U. n/a $1,694 $1,040 221 Multi-Family (3+ Floor)(1) D.U. n/a $1,259 $773 240 Mobile Home D.U. $2,891 $890 $529 310 Hotel Room $5,063 $1,671 $1,093 320 Motel Room $1,956 $629 $399 420 Marina Berth $1,411 $628 $483 430 Golf Course Holes $12,815 $5,565 $3,989
492/493 Fitness Center 1,000 sf $9,928 $4,219 $2,932 610 Hospital 1,000 sf $4,841 $2,119 $1,725
251/252 Independent Senior Living D.U. $2,932 $922 $566 620 Nursing Home bed $738 $298 $206 560 Church (Non-Sanctuary Space Only) 1,000 sf $2,164 $894 $638
520/522/530 Private School student $556 $229 $161 565 Day Care (Child or Adult) student $506 $207 $128 710 Office 1,000 sf $4,366 $1,873 $1,470 720 Medical Office 1,000 sf $16,144 $6,979 $5,647 820 Retail < 20K Sq. Ft. 1,000 sf $6,813 $2,748 $1,699 820 Retail (large >=20 ksf, Shop Ctr.) 1,000 sf $9,124 $3,809 $2,467
Various Convenience Retail 1,000 sf $30,200 $12,169 $7,517 936/937 Coffee/Donut Shop 1,000 sf $11,599 $4,559 $2,646 931/932 Restaurant - Sit Down 1,000 sf $24,194 $10,092 $6,666 933/934 Restaurant - Fast Food 1,000 sf $22,561 $8,867 $5,146 944 Gasoline Station Fuel Pos. $15,849 $6,260 $4,130 850 Supermarket 1,000 sf $11,471 $4,676 $2,956 848 Garage / Auto Repair 1,000 sf $5,464 $2,230 $1,567 912 Bank/Savings/Credit Union 1,000 sf $9,040 $3,616 $2,428
110/140 Manufacturing 1,000 sf $2,424 $1,042 $766 150/154/157 Passive Warehouse (Storage warehouse) 1,000 sf $949 $408 $300 155/156 Active Warehouse (Parcel hub/fulfilment center) 1,000 sf $4,346 $1,868 $1,373 151 Mini-Warehouses 1,000 sf $553 $235 $163
Note: 1. This rate is applicable to all dwelling units in buildings of three or more floors, including units on floors 1 and 2.
W.E. Oliver, P.E., and Kittelson and Associates, Inc. Seminole County, Florida April 21, 2020 2020 Mobility Fee Update Study
-21-
DRAFTTable 8‐2: Mobility Fees of Nearby Communities
Volusia
County
201
8
All
$5,379
$3
,213
$2
,974
$3
,970
$6
,390
$2
,002
Osceo
la County
(3)
201
7
Rural
$14
,313
n/a
n/a
n/a
n/a
n/a
TOD
$4,529
$3,16
4
$3,290
$2,850
$6,737
$1
,999
Mixed
‐Use
$6,792
$4,744
$4,935
$4,276
$10
,106
$2,998
Standard
$9,055
$6,326
$6,581
$5,700
$13,745
$3,997
Orlando
20
18
City‐Other
$4,123
$2,729
$2,736
$4,576
$6,038
$2,391
Downtown
$3,574
$2
,365
$2
,372
$4
,352
$5
,742
$2
,270
Orange County
(2)
2014
non‐AMA
$3,761
$2
,435
$1
,910
$4
,575
$5
,876
$2
,088
AMA
$3,898
$2
,524
$1
,978
$4
,748
$6
,135
$2,163
Lake
County
(1)
2019
S, N
/W
$2,706
$1
,336
$1
,125
$2
,531
$2
,964
$1,728
C,N/C
$1,000
$49
4
$41
6
$93
5
$1,095
$63
8
Seminole
County
Proposed
Core
$1,824
$1,040
$1,093
$1,470
$2,467
$766
Suburb
$2,759
$1,694
$1,671
$1,873
$3,809
$1,042
Rural
$8,284
n/a
$5,063
$4,366
$9,124
$2,424
Agency
Adoption Yea
r District
Sing
le F
amily
(1,5
01 to
2,5
00 s
.f.)
Mul
ti-Fa
mily
(1-2
Flo
or)
Hot
el
Offic
e R
etai
l (la
rge
>=20
ksf,
Sho
p C
tr.)
Man
ufac
turin
g
L a nd Use
Notes:
1. Effective Februa
ry 1, 2020
. 2. Stud
y in
progress
3. Osceola M
anufacturing rate is for "Warehouse",
no M
anufacturing/Light Industrial rate.
W.E. Oliver, P.E., and Kittelson and Associates, Inc. Seminole County, Florida April 21, 2020 2020 Mobility Fee Update Study
-22-
DRAFT9. Conclusion
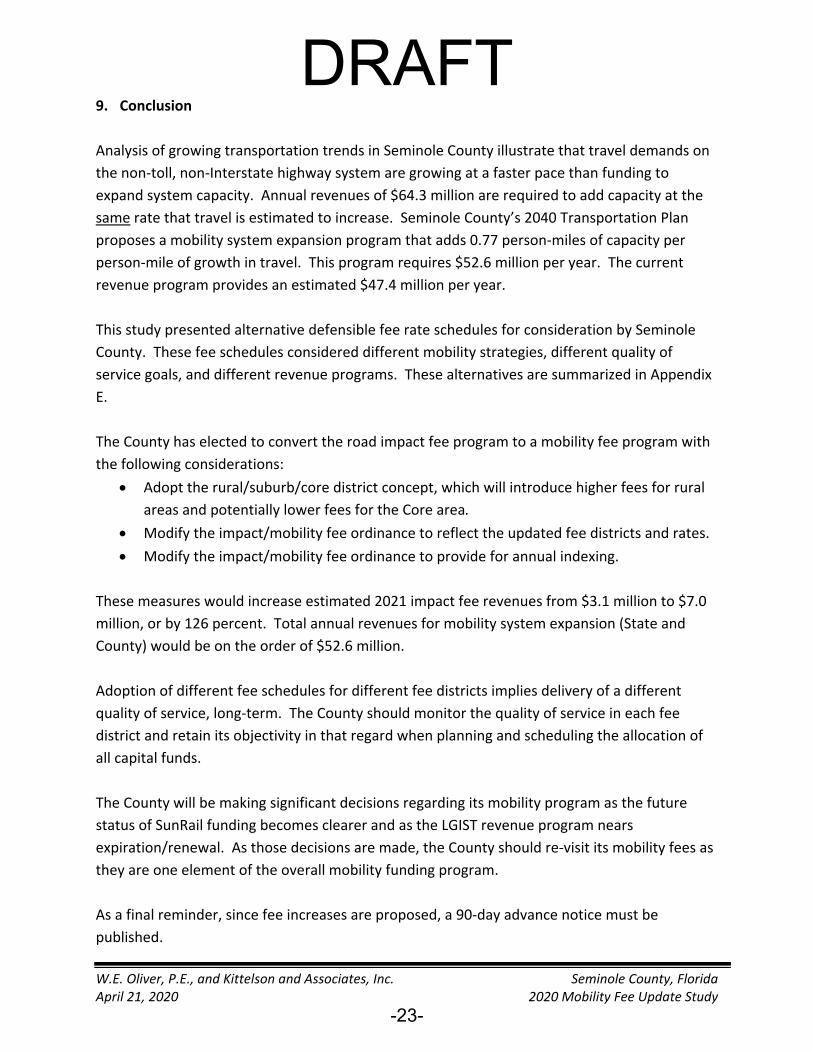
Analysis of growing transportation trends in Seminole County illustrate that travel demands on
the non‐toll, non‐Interstate highway system are growing at a faster pace than funding to
expand system capacity. Annual revenues of $64.3 million are required to add capacity at the
same rate that travel is estimated to increase. Seminole County’s 2040 Transportation Plan
proposes a mobility system expansion program that adds 0.77 person‐miles of capacity per
person‐mile of growth in travel. This program requires $52.6 million per year. The current
revenue program provides an estimated $47.4 million per year.
This study presented alternative defensible fee rate schedules for consideration by Seminole
County. These fee schedules considered different mobility strategies, different quality of
service goals, and different revenue programs. These alternatives are summarized in Appendix
E.
The County has elected to convert the road impact fee program to a mobility fee program with
the following considerations:
Adopt the rural/suburb/core district concept, which will introduce higher fees for rural
areas and potentially lower fees for the Core area.
Modify the impact/mobility fee ordinance to reflect the updated fee districts and rates.
Modify the impact/mobility fee ordinance to provide for annual indexing.
These measures would increase estimated 2021 impact fee revenues from $3.1 million to $7.0
million, or by 126 percent. Total annual revenues for mobility system expansion (State and
County) would be on the order of $52.6 million.
Adoption of different fee schedules for different fee districts implies delivery of a different
quality of service, long‐term. The County should monitor the quality of service in each fee
district and retain its objectivity in that regard when planning and scheduling the allocation of
all capital funds.
The County will be making significant decisions regarding its mobility program as the future
status of SunRail funding becomes clearer and as the LGIST revenue program nears
expiration/renewal. As those decisions are made, the County should re‐visit its mobility fees as
they are one element of the overall mobility funding program.
As a final reminder, since fee increases are proposed, a 90‐day advance notice must be
published.
W.E. Oliver, P.E., and Kittelson and Associates, Inc. Seminole County, Florida April 21, 2020 2020 Mobility Fee Update Study
-23-

DRAFT
Appendix A
Travel Characteristics Analysis
4/20/2020
Appen
dix A: Travel C
haracteristics Analysis
Trip Rate
Trip Length
% New Trips
ITE
LU
C
Lan
d U
se
Un
it
Rat
e M
eth
od
O
ran
ge
(1)
Osc
eola
(2
)
Lak
e (3
)
Vo
lusi
a (4
) R
eco
mm
end
ed
for
Sem
ino
le
Met
ho
d
Ora
ng
e O
sceo
la
Lak
e V
olu
sia
Rec
om
men
ded
for
Sem
ino
le
Met
ho
d
210
Si
ngle
Fam
ily D
etac
hed
D.U.
9.44
4
6.62
5.08
8.41
TO
A
6.62
2
100%
100%
100%
TO
A
100%
2
220
M
ulti-
Fam
ily 1
-2 F
loor
D.U.
7.32
4
5.10
5.08
5.35
TO
A
5.18
2
100%
100%
100%
TO
A
100%
2
221
M
ulti-
Fam
ily 3
-10
Floo
r D.U.
5.44
4
5.10
5.08
5.35
TO
A
5.18
2
100%
100%
100%
TO
A
100%
2
240
M
obile
Hom
e D.U.
4.17
TO
A
4.60
5.08
4.60
TO
A
4.76
2
100%
100%
100%
TO
A
100%
2
310
H
otel
Room
8.36
4
6.26
5.73
7.05
TO
A
6.35
2
66%
75%
72%
TO
A
71%
2
320
M
otel
Room
3.35
4
4.34
n/a
7.05
6.26
5.88
2
77%
n/a
72%
66%
72%
2
420
M
arin
a Berth
2.41
4
n/a
6.32
n/a
n/a
6.32
3
n/a
100%
n/a
n/a
100%
1
430
G
olf C
ours
e Holes
30.38
4
6.62
3.16
n/a
n/a
4.89
2
90%
50%
n/a
n/a
90%
5
492/493
Fi
tnes
s C
ente
r 1,000 sf
39.34
4
5.15
3.16
n/a
n/a
4.16
2
94%
50%
n/a
n/a
62%
LU
C 565
610
H
ospi
tal
1,000 sf
10.72
4
6.62
5.85
6.04
2.59
6.17
av
g 3
long
est
78%
75%
77%
89%
80%
2
251/252
In
depe
nden
t Sen
ior L
ivin
g D.U.
4.00
4
5.42
5.08
6.90
n/a
5.16
LU
C 2
20
100%
100%
n/a
n/a
100%
LU
C 2
10/2
20
620
N
ursi
ng H
ome
bed
3.06
4
2.59
2.07
3.46
n/a
2.71
2
89%
90%
89%
n/a
89%
2
560
C
hurc
h (N
on-S
anct
uary
Spa
ce O
nly)
1,000 sf
6.95
4
3.91
2.43
5.19
2.59
3.53
2
90%
90%
90%
89%
90%
2
52
0/52
2/53
0 Pr
ivat
e Sc
hool
studen
t 2.02
4
3.31
n/a
6.98
n/a
3.31
5
80%
n/a
90%
n/a
85%
2
565
D
ay C
are
(Chi
ld o
r Adu
lt)
studen
t 4.09
4
2.03
1.22
2.66
TO
A
1.97
2
73%
40%
73%
TO
A
62%
2
710
O
ffice
1,000 sf
9.74
4
5.15
5.23
6.92
TO
A
5.19
av
g 2
shor
ter
92%
75%
92%
TO
A
92%
5
720
M
edic
al O
ffice
1,000 sf
34.80
4
5.15
5.23
7.32
5.55
5.81
2
92%
75%
89%
88%
86%
2
820
R
etai
l < 2
0K S
q. F
t. 1,000 sf
100.62
4,
6 1.87
1.92
2.18
n/a
n/a
4,
6 56%
40%
56%
n/a
38%
4,
6
820
R
etai
l (la
rge
>=20
ksf
, Sho
p C
tr.)
1,000 sf
48.16
4,
6 2.29
2.88
3.01
n/a
n/a
4,
6 62%
60%
76%
n/a
68%
4,
6 85
1/85
3/96
0 C
onve
nien
ce R
etai
l 1,000 sf
670.00
Bl
ende
d 1.51
1.03
2.46
TO
A
1.67
2
28%
25%
47%
TO
A
27%
av
g 2
low
er
936/937
C
offe
e/D
onut
Sho
p 1,000 sf
792.21
4
n/a
n/a
n/a
n/a
0.96
R
est
n/a
n/a
n/a
n/a
15%
4
931/932
R
esta
uran
t - S
it D
own
1,000 sf
98.66
4
3.14
n/a
3.32
TO
A
3.23
2
77%
n/a
74%
TO
A
76%
2
91
2/91
3/93
4 R
esta
uran
t - D
rive
In
1,000 sf
472.19
Bl
ende
d 2.05
0.96
2.46
TO
A
0.96
5
57%
25%
47%
TO
A
50%
4
944
G
asol
ine
Stat
ion
Fuel Pos.
172.01
4
1.90
1.03
2.53
n/a
1.82
1
23%
25%
23%
n/a
50%
4
850
Su
perm
arke
t 1,000 sf
106.78
4
2.08
1.92
n/a
TO
A
2.00
2
56%
50%
n/a
TO
A
53%
2
848
G
arag
e / A
uto
Rep
air
1,000 sf
25.82
4
3.62
2.86
n/a
TO
A
3.24
2
72%
60%
n/a
TO
A
66%
2
912
Ba
nk/S
avin
gs/C
redi
t Uni
on
1,000 sf
101.30
4
2.45
1.03
2.58
TO
A
2.02
2
46%
40%
46%
TO
A
44%
2
110/140
M
anuf
actu
ring
1,000 sf
4.445
4
5.15
6.97
11.15
TO
A
6.06
2
92%
90%
92%
TO
A
92%
2
15
0/15
4/15
7 Pa
ssiv
e W
areh
ouse
(Sto
rage
war
eho 1,000 sf
1.74
4
5.15
6.97
11.15
TO
A
6.06
fro
m L
UC
110
n/a
n/a
n/a
TO
A
92%
fro
m L
UC
110
155/156
Ac
tive
War
ehou
se (P
arce
l hub
/fulfi
lm 1,000 sf
7.97
4
n/a
n/a
n/a
TO
A
6.06
fro
m L
UC
110
n/a
n/a
n/a
TO
A
92%
fro
m L
UC
110
151
M
ini-W
areh
ouse
s 1,000 sf
1.51
4
3.51
4.30
4.38
TO
A
4.06
2
92%
90%
92%
TO
A
92%
2
A-1
Sour
ces:
"M
etho
d" k
ey:
1. "
Ora
nge
Cou
nty
Tran
spor
tatio
n Im
pact
Fee
Stu
dy U
pdat
e St
udy"
, Tin
dale
-Oliv
er &
Ass
ocia
tes,
Apr
il, 2
018.
1‐central tendency/one source
"Osc
eola
Cou
nty
Mob
ility
Fee
Tech
nica
l Mem
oria
ndum
" Kei
th &
Sch
nars
, et a
l, M
arch
6, 2
015.
2.2‐average
L
ake
Cou
nty
, Flo
rida
"Tra
nspo
rtatio
n Im
pact
Fee
201
7 U
pdat
e St
udy
(Dra
ft)",
Kitte
lson
and
Ass
ocia
tes,
Inc.
3.
3‐m
ajority
"R
oad
Impa
ct F
ee S
tudy
for V
olus
ia C
ount
y", D
unca
n &
Asso
ciat
es, S
epte
mbe
r, 20
18. (
Cite
s TO
A as
a
4.4‐developed from
ITE 10th Ed. D
ata
sour
ce fo
r man
y la
nd u
ses,
thus
val
ues
are
not r
epea
ted
in s
ome
case
s)
5‐judgement
6‐regression on data, see
p A‐2. Other communities have different size categories.
"from LUC xxx" ‐ value chosen as comparab
le to the indicated
Lan
d Use
Code
Blended‐trip rate from a selection of convenience uses in ITE 10th Ed.
TOA‐Tindale‐Oliver compilation of studies.
F:\W
EO‐PE\Projects\106.07 KAI‐Seminole M
obility Fee
\3. A
nalysis\Fee Schedules\Trip Characteristics Table.xlsx
W.E. O
liver, P.E., LLC
DRAFT

·= • =•
•= : . : . ; .
l?e • •
• • •
:•
l•
•
. \• . . ·~ ... • • • •.tt
• ••
5/9/2019
Summary of LU
C 820: Sh
opping Cen
ter Travel G
eneration
Daily Trip‐Ends = e^(0.68 x ln
(ksf) + 5.57)
By‐Pass %
So
urce: ITE Trip Gen
eration, 1
0th Edition, Lan
d Use Code 820
DRAFT90
ByP
ass % = 146.44*k
sf^‐0.289
80
By‐Pass data from ITE 10th Edition, regression curve to right.
70
Trip Length = 0.9282 x ksf^0
.2073
60
Trip Len
gth data compiled by Tindale‐Oliver & Assoc., regression
curve to below right.
50
40
30
20
10 0
0
200
400
600
800
1000
1200
1400
By‐Pass %
Power (By‐Pass %)
y = 146.44x‐0.289
R² = 0.377
Shop Ctr
Size (ksf)
Trip
Gen/ksf
Trip
Length
(mi)
% New
Trips
Veh‐M
i/
ksf
300
42.3
3.03
71.8
92.0
200
48.2
2.78
68.3
91.6
20
100.6
1.73
38.4
66.7
Trip
Len
gth
A-2
Average Trip Length (mi) 9 8 7 6 5 4 3 2 1 0
y = 0.9282x0
.2073
R² = 0.1077
0
200
400
600
800
1000
1200
1400
Square feet of Retail (1,000's)
F:\W
EO‐PE\Projects\106.07 KAI‐Seminole M
obility Fee
\3. A
nalysis\Fee
Sched
ules\Trip Characteristics Table.xlsx
Source: W
.E. O
liver, P
.E., LLC

DRAFT 4/20/2020
Percent of Trip Length in District Travel originating in:
% TL in >>> Rural Suburb Core
Rural Suburb Core Rural Suburb Core Rural Suburb Core
Assessab
le trip length (mile
s)
0.0 100.0% 0.0% 0.0% 0.0% 100.0% 0.0% 0.0% 0.0% 100.0% 0.5 97.6% 2.4% 0.0% 1.0% 95.8% 3.2% 0.0% 3.5% 96.5% 1.0 95.2% 4.8% 0.0% 1.9% 91.6% 6.5% 0.0% 7.0% 93.0% 1.5 92.9% 7.1% 0.0% 2.9% 87.5% 9.7% 0.0% 10.5% 89.5% 2.0 90.5% 9.5% 0.0% 3.8% 83.3% 12.9% 0.0% 14.0% 86.0% 2.5 88.1% 11.9% 0.0% 4.8% 79.1% 16.2% 0.0% 17.5% 82.5% 3.0 85.7% 14.3% 0.0% 5.7% 74.9% 19.4% 0.0% 21.0% 79.0% 3.5 83.3% 16.7% 0.0% 6.7% 70.7% 22.6% 0.0% 24.5% 75.5% 4.0 81.0% 18.6% 0.5% 7.6% 66.6% 25.8% 1.5% 26.6% 72.0% 4.5 78.6% 20.5% 1.0% 8.6% 62.4% 29.1% 2.9% 28.6% 68.5% 5.0 76.2% 22.4% 1.4% 9.5% 58.2% 32.3% 4.4% 30.7% 65.0% 5.5 73.8% 24.3% 1.9% 9.4% 57.0% 33.6% 5.8% 32.7% 61.5% 6.0 71.4% 26.2% 2.4% 9.3% 55.7% 35.0% 6.0% 33.6% 60.4% 6.5 69.1% 28.1% 2.9% 9.2% 54.5% 36.3% 6.2% 34.5% 59.3% 7.0 66.7% 30.0% 3.3% 9.0% 53.3% 37.7% 6.4% 35.4% 58.2% 7.5 64.3% 31.9% 3.8% 8.9% 52.0% 39.0% 6.7% 36.2% 57.1% 8.0 61.9% 33.8% 4.3% 8.8% 50.8% 40.4% 6.9% 37.1% 56.0% 8.5 59.5% 35.7% 4.8% 8.7% 49.6% 41.7% 7.1% 38.0% 54.9% 9.0 57.2% 37.6% 5.2% 8.6% 48.3% 43.1% 7.3% 38.9% 53.8% 9.5 54.8% 39.5% 5.7% 8.5% 47.1% 44.4% 7.5% 39.8% 52.7% 10.0 52.4% 41.4% 6.2% 8.4% 45.9% 45.8% 7.7% 40.7% 51.6% 10.5 49.9% 42.4% 7.7% 8.3% 44.6% 47.1% 7.9% 41.6% 50.5% 11.0 47.6% 43.3% 9.1% 8.1% 43.4% 48.5% 8.1% 42.5% 49.4% 11.5 45.6% 44.3% 10.2% 8.0% 42.2% 49.8% 8.4% 43.3% 48.3% 12.0 43.7% 45.2% 11.1% 7.9% 40.9% 51.2% 8.6% 44.2% 47.2% 12.5 41.9% 46.2% 11.9% 7.8% 39.7% 52.5% 8.8% 45.1% 46.1% 13.0 40.3% 47.1% 12.6% 7.7% 38.5% 53.8% 9.0% 46.0% 45.0%
F:\WEO‐PE\Projects\106.07 KAI‐Seminole Mobility Fee\3. Analysis\Strategic Planning\Strategic Planning v7.xlsm Source: Seminole LRTP OUATS 2040 model, W.E. Oliver, P.E., LLC
A-3

•.. >~··•···;·········· ··············~
t··· !' •
DRAFTDevelopment of travel quantity by household size
The National Household Transportation Survey (NHTS) provides information relative to the amount of
travel generated by households of various incomes. The 2017 NHTS data was accessed to produce the following distribution of travel by household income for homeowners:
Derived total HH income
Travel Day Vehicle Miles
90.0
80.0
70.0
60.0
50.0
40.0
30.0
20.0
10.0
0.0
Daily VMT per D.U.
VMT per Dwelling Unit
y = 16.904ln(x) - 135.34 R² = 0.9611
Household Income Thousands
Trips/Day Trip
Length VMT/DU
Central Range Value
(for Plot)
Less than $10,000 2.58 5.22 13.4 $8,000 $10,000 to $14,999 2.97 7.25 21.5 $12,500 $15,000 to $24,999 3.81 9.32 35.5 $20,000 $25,000 to $34,999 4.46 8.56 38.1 $30,000 $35,000 to $49,999 5.36 8.81 47.2 $42,500 $50,000 to $74,999 5.72 10.29 58.8 $62,500 $75,000 to $99,999 6.34 9.04 57.3 $87,500 $100,000 to $124,999 6.38 10.05 64.1 $112,500 $125,000 to $149,999 6.65 8.69 57.8 $137,500 $150,000 to $199,999 6.57 9.93 65.2 $175,000 $200,000 or more 6.63 12.21 80.9 $350,000
The next step was to relate size of dwelling unit to income. Using data from Seminole County property appraiser’s files, a relationship between household size and property value was established. Then, using rules of thumb regarding mortgage amounts and advice on the proportion of income that should be allocated to housing costs for qualifying purposes, the household income was related to household size. Using these relationships, the relative travel generated by household size (e.g. 1,500 s.f.and 2,500 s.f.) was estimated by considering the lifecycle income levels. The lifecycle income levels recognize that
income levels increase beyond the minimum qualifying levels as one remains in the home. These
relationships led to the household income ranges for the up to 1,500 s.f., 1,500 to 2,500 s.f., and over 2,500 s.f. size ranges. This analysis is summarized on the following page.
Finally, the amount of travel generated by household size range travel relationships of 0.81, 1.00, and 1.31, respectively, that are applied in the mobility fee schedules was established, as summarized in the
following table:
Travel Day Vehicle Miles Owners
Derived total HH income Trips/Day
Trip Length
VMT/DU #DU
(Weighted) % by HHInc
Contrib to
VMT/DU Group
%
Group Contrib to VMT
Less than $10,000 2.58 5.22 13.4 1,782 2.1% 0.28 18.9% 2.54 $10,000 to $14,999 2.97 7.25 21.5 1,471 2.6% 0.56 23.4% 5.04 $15,000 to $24,999 3.81 9.32 35.5 2,382 6.4% 2.29 57.7% 20.47 $25,000 to $34,999 4.46 8.56 38.1 2,181 8.1% 3.08 35.1% 13.38 $35,000 to $49,999 5.36 8.81 47.2 2,881 12.1% 5.70 64.9% 30.63 $50,000 to $74,999 5.72 10.29 58.8 3,682 19.9% 11.71 32.0% 18.83 $75,000 to $99,999 6.34 9.04 57.3 2,791 16.1% 9.24 25.9% 14.87 $100,000 to $124,999 6.38 10.05 64.1 2,111 12.8% 8.19 20.5% 13.17 $125,000 to $149,999 6.65 8.69 57.8 1,195 6.7% 3.87 10.8% 6.23 $150,000 to $199,999 6.57 9.93 65.2 1,131 6.7% 4.35 50.7% 33.09 $200,000 or more 6.63 12.21 80.9 1,115 6.5% 5.25 49.3% 39.87
57 99 Wtd Average VMT/DU: 54.53 < 1,500 s.f., $25,000 to $49,999: 44.01
80.7% 1500-2499 s.f., $50,000 to $150,000: 53.10
97.4% >2,500 s.f., over $150,000: 72.96
133.8%
A-4

••
• • ••• • • • • •
• • •
4500 -4000
•_ 3500 u.: ~ (lJ 3000 E 0 I
2SOO0 l!: ,Ji 2000
1500
1000
DRAFTHome Size vs Just Value
-..,....·•· . -·'.
.......... . !.: •
•
..,..; ... • • y =0005905 l x + 663. 1SY31 4
R' = 0. 7690634 .. ., .. ,. -. •
Just Valu e
Source: NAL69F20 Seminole County Property Appra iser, 2018
4.00% 90% 30 yr 12.00% 32% 80.00%
Qualifying
Qualifying Gross
Home Monthly Annual lifecycle
Just Monthly Take-home Household Annual
Size Value Mortgage P&I Taxes, Ins Payment Paycheck Income Income
1,000 $57,043 $51,339 $245 $29 $275 $858 $12,868 $19,302
1,500 $141,717 $127,545 $609 $73 $682 $2,131 $31,968 $47,953
2,500 $311,065 $279,959 $1,337 $160 $1,497 $4,678 $70,170 $140,339
5,000 $734,435 $660,992 $3,156 $379 $3,534 $11,045 $165,673 $248,509
Notes:
1. Size to value relationship : Size=0.005905 x Value+ 663
2. Mortgage assumed at 90% of Just Value.
3. P&I assumed at 4%, 30-yr mortgage.
4. Taxes and Insurance at 12% of P&I
5. Qual ifying Monthly Take-h ome paycheck= Monthly payment/0.32
6. Annual Gross Household Income= Monthly Gross Paycheck *12/0.80
7. Lifecycle Annual Income is household income over lifecycle of occupancy.
A-5

DRAFT
Appendix B
Cost Component Analysis
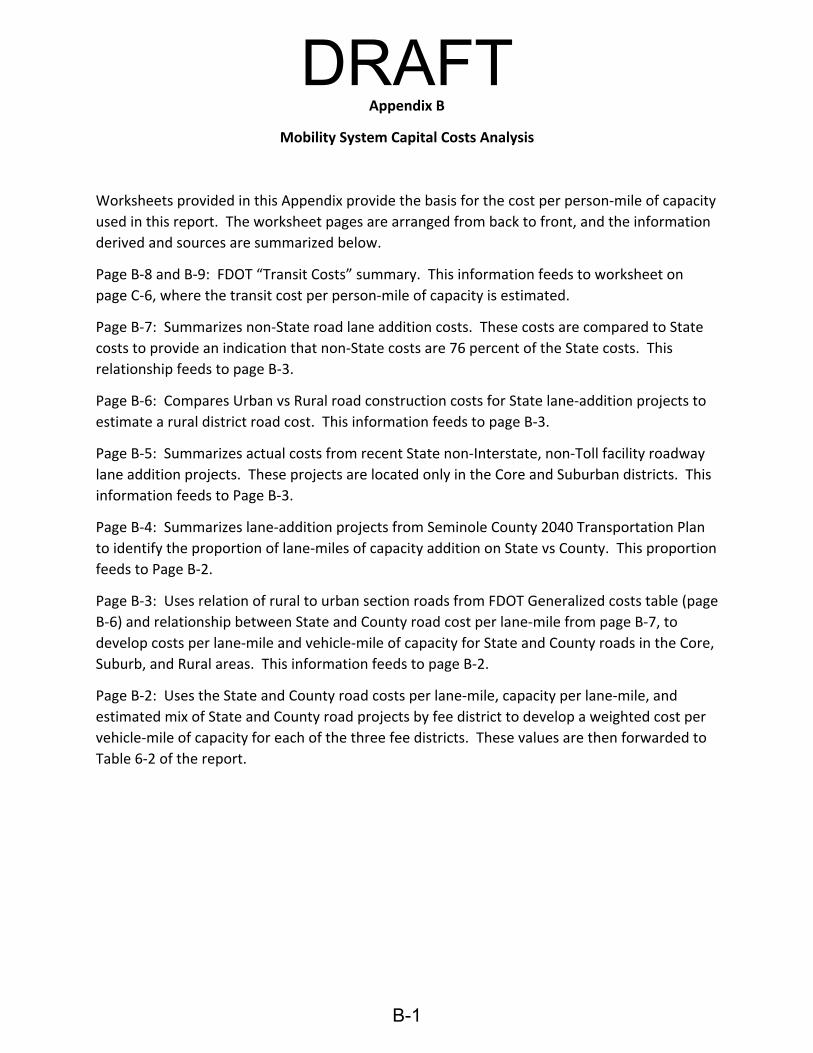
DRAFTAppendix B
Mobility System Capital Costs Analysis
Worksheets provided in this Appendix provide the basis for the cost per person‐mile of capacity
used in this report. The worksheet pages are arranged from back to front, and the information
derived and sources are summarized below.
Page B‐8 and B‐9: FDOT “Transit Costs” summary. This information feeds to worksheet on
page C‐6, where the transit cost per person‐mile of capacity is estimated.
Page B‐7: Summarizes non‐State road lane addition costs. These costs are compared to State
costs to provide an indication that non‐State costs are 76 percent of the State costs. This
relationship feeds to page B‐3.
Page B‐6: Compares Urban vs Rural road construction costs for State lane‐addition projects to
estimate a rural district road cost. This information feeds to page B‐3.
Page B‐5: Summarizes actual costs from recent State non‐Interstate, non‐Toll facility roadway
lane addition projects. These projects are located only in the Core and Suburban districts. This
information feeds to Page B‐3.
Page B‐4: Summarizes lane‐addition projects from Seminole County 2040 Transportation Plan
to identify the proportion of lane‐miles of capacity addition on State vs County. This proportion
feeds to Page B‐2.
Page B‐3: Uses relation of rural to urban section roads from FDOT Generalized costs table (page
B‐6) and relationship between State and County road cost per lane‐mile from page B‐7, to
develop costs per lane‐mile and vehicle‐mile of capacity for State and County roads in the Core,
Suburb, and Rural areas. This information feeds to page B‐2.
Page B‐2: Uses the State and County road costs per lane‐mile, capacity per lane‐mile, and
estimated mix of State and County road projects by fee district to develop a weighted cost per
vehicle‐mile of capacity for each of the three fee districts. These values are then forwarded to
Table 6‐2 of the report.
B-1

4/21/2020
Road Unit Cost by District:
State: Core District Suburb Rural
DRAFTPDE,Des, CEI %: 15% 15% 17%
ROW %: 49% 31% 22%
Const/Ln‐Mi: $6,416,907 $5,870,582 $3,091,099
Total: $10,523,727 $8,571,050 $4,296,628
Cap/Ln 10,047 10,848 9,650 $/vmc $1,047 $790 $445
County:
PDE,Des, CEI 15% 15% 17% ROW 49% 31% 22% Const $4,876,849 $4,461,642 $2,349,235 Tot $7,998,033 $6,513,998 $3,265,437
Cap/Ln 9,545 10,306 9,168 $/vmc $838 $632 $356
0.76
0.95
Mix of section by District (%): State Rural Suburb Core
Urban: 0% 33% 26% Suburban: 61% 20% 0%
Rural: 21% 0% 0% Non‐State
Urban: 0% 47% 74% Suburban: 0% 0% 0%
Rural: 18% 0% 0%
100% 100% 100%
Mixed Road Cost in District: Rural Suburb Core
$$/vmc:
$$/pmc:
$640.08 $897.52 $892.43
$457.20 $641.09 $637.45
F:\WEO‐PE\Projects\106.07 KAI‐Seminole Mobility Fee\3. Analysis\Strategic Planning\Strategic Planning v8.xlsm W.E. Oliver, P.E., LLC B-2

5/10/2019
Develop Road Componen
t of Cost per Lane‐Mile
and Cost per Veh
icle‐M
ile and Person‐M
ile
DRAFTCost per
Person‐
Mile
of
Cap
acity
$74
8
$564
$319
$598
$451
$255
Cost per
Vehicle‐
Mile
of
Cap
acity
$1,047
$790
$446
$838
$632
$357
Cap
acity
per Lane
10,047
10,848
9,650
9,545
10,306
9,168
Total C
ost/
Lane‐M
ile
$10,519,520
$8,570,192
$4,307,333
$7,994,835
$6,513,346
$3,273,573
Construction
Cost/ Lane‐
Mile
$6,416,907
$5,870,582
$3,091,099
$4,876,849
$4,461,642
$2,349,235
Right‐of‐Way
as % of
Construction
49%
31%
22%
76%
49%
31%
22%
Right‐of‐
Way Cost/
Lane‐M
ile
$3,155,856
$1,799,740
$694,991
$2,398,450
$1,367,803
$528,193
Design
/CEI as
% of
Construction
15%
15%
17%
15%
15%
17%
Design
/CEI
Cost/ Lane‐
Mile
$946,757
$899,870
$521,243
$719,535
$683,901
$396,145
Location
Core
Suburb
Rural
Core
Suburb
Rural
State County
B-3
F:\W
EO‐PE\Projects\106.07 KAI‐Seminole M
obility Fee
\3. A
nalysis\Costs\Cost Summary.xlsx
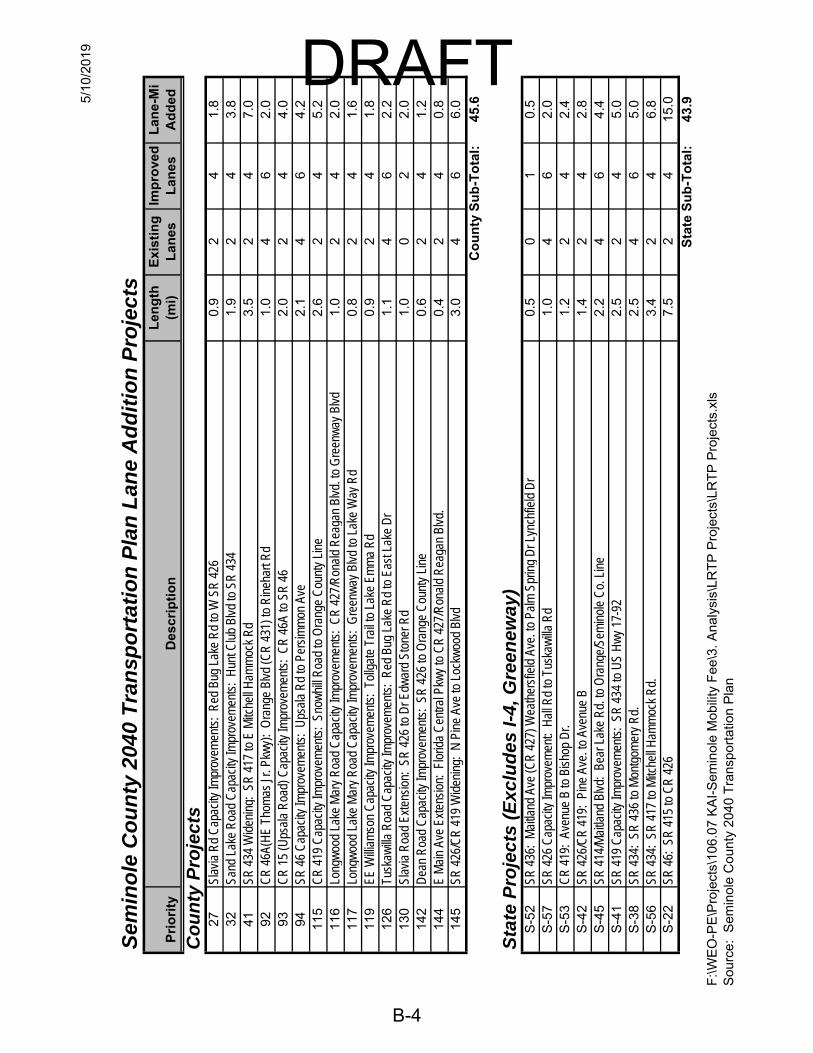
5/10
/201
9
Sem
inol
e C
ount
y 20
40 T
rans
port
atio
n Pl
an L
ane
Add
ition
Pro
ject
s
Pri
ori
ty
Des
crip
tio
n
Len
gth
(m
i)
Exi
stin
g
Lan
es
Imp
rove
d
Lan
es
Lan
e-M
i A
dd
ed
Cou
nty
Proj
ects
B-4
27
Slav
ia R
d C
apac
ity Im
prov
emen
ts:
Red
Bug
Lak
e R
d to
W S
R 4
26
0.9
2 4
1.8
32
Sand
Lak
e R
oad
Cap
acit y
Impr
ovem
ents
: H
unt C
lub
Blvd
to S
R 4
34
1.9
2 4
3.8
41
SR 4
34 W
iden
ing:
SR
417
to E
Mitc
hell
Ham
moc
k R
d 3.
5 2
4 7.
0 92
C
R 4
6A(H
E Th
omas
Jr.
Pkw
y):
Ora
nge
Blvd
(CR
431
) to
Rin
ehar
t Rd
1.0
4 6
2.0
93
CR
15
(Ups
ala
Roa
d) C
apac
ity Im
prov
emen
ts:
CR
46A
to S
R 4
6 2.
0 2
4 4.
0 94
SR
46
Cap
acit y
Impr
ovem
ents
: U
psal
a R
d to
Per
sim
mon
Ave
2.
1 4
6 4.
2 11
5 C
R 4
19 C
apac
it y Im
prov
emen
ts:
Snow
hill
Roa
d to
Ora
nge
Cou
nty
Line
2.
6 2
4 5.
2 11
6 Lo
n gw
ood
Lake
Mar
y R
oad
Cap
acity
Impr
ovem
ents
: C
R 4
27/R
onal
d R
eaga
n Bl
vd. t
o G
reen
way
Blv
d 1.
0 2
4 2.
0 11
7 Lo
n gw
ood
Lake
Mar
y R
oad
Cap
acity
Impr
ovem
ents
: G
reen
way
Blv
d to
Lak
e W
ay R
d 0.
8 2
4 1.
6 11
9 EE
Willi
amso
n C
apac
it y Im
prov
emen
ts:
Tollg
ate
Trai
l to
Lake
Em
ma
Rd
0.9
2 4
1.8
126
Tusk
awilla
Roa
d C
apac
it y Im
prov
emen
ts:
Red
Bug
Lak
e R
d to
Eas
t Lak
e D
r 1.
1 4
6 2.
2 13
0 Sl
avia
Roa
d Ex
tens
ion:
SR
426
to D
r Edw
ard
Ston
er R
d 1.
0 0
2 2.
0 14
2 D
ean
Roa
d C
apac
it y Im
prov
emen
ts:
SR 4
26 to
Ora
nge
Cou
nty
Line
0.
6 2
4 1.
2 14
4 E
Mai
n Av
e Ex
tens
ion:
Flo
rida
Cen
tral P
kwy
to C
R 4
27/R
onal
d R
eaga
n Bl
vd.
0.4
2 4
0.8
145
SR 4
26/C
R 4
19 W
iden
ing:
N P
ine
Ave
to L
ockw
ood
Blvd
3.
0 4
6 6.
0
Co
un
ty S
ub
-To
tal:
45
.6
Stat
e Pr
ojec
ts (E
xclu
des
I-4, G
reen
eway
) S
-52
SR 4
36:
Mai
tland
Ave
(CR
427
) Wea
ther
sfie
ld A
ve. t
o Pa
lm S
prin
g D
r Lyn
chfie
ld D
r 0.
5 0
1 0.
5 S
-57
SR 4
26 C
apac
it y Im
prov
emen
t: H
all R
d to
Tus
kaw
illa R
d 1.
0 4
6 2.
0 S
-53
CR
419
: Av
enue
B to
Bis
hop
Dr.
1.2
2 4
2.4
S-4
2 SR
426
/CR
419
: Pi
ne A
ve. t
o Av
enue
B
1.4
2 4
2.8
S-4
5 SR
414
/Mai
tland
Blv
d: B
ear L
ake
Rd.
to O
ran g
e/Se
min
ole
Co.
Lin
e 2.
2 4
6 4.
4 S
-41
SR 4
19 C
apac
it y Im
prov
emen
ts:
SR 4
34 to
US
Hw
y 17
-92
2.5
2 4
5.0
S-3
8 SR
434
: SR
436
to M
ont g
omer
y R
d.
2.5
4 6
5.0
S-5
6 SR
434
: SR
417
to M
itche
ll H
amm
ock
Rd.
3.
4 2
4 6.
8 S
-22
SR 4
6: S
R 4
15 to
CR
426
7.
5 2
4 15
.0
Sta
te S
ub
-To
tal:
43
.9
F:\W
EO
-PE
\Pro
ject
s\10
6.07
KA
I-S
emin
ole
Mob
ility
Fee
\3. A
naly
sis\
LRT
P P
roje
cts\
LRT
P P
roje
cts.
xls
Sou
rce:
Sem
inol
e C
ount
y 20
40 T
rans
port
atio
n P
lan
DRAFT
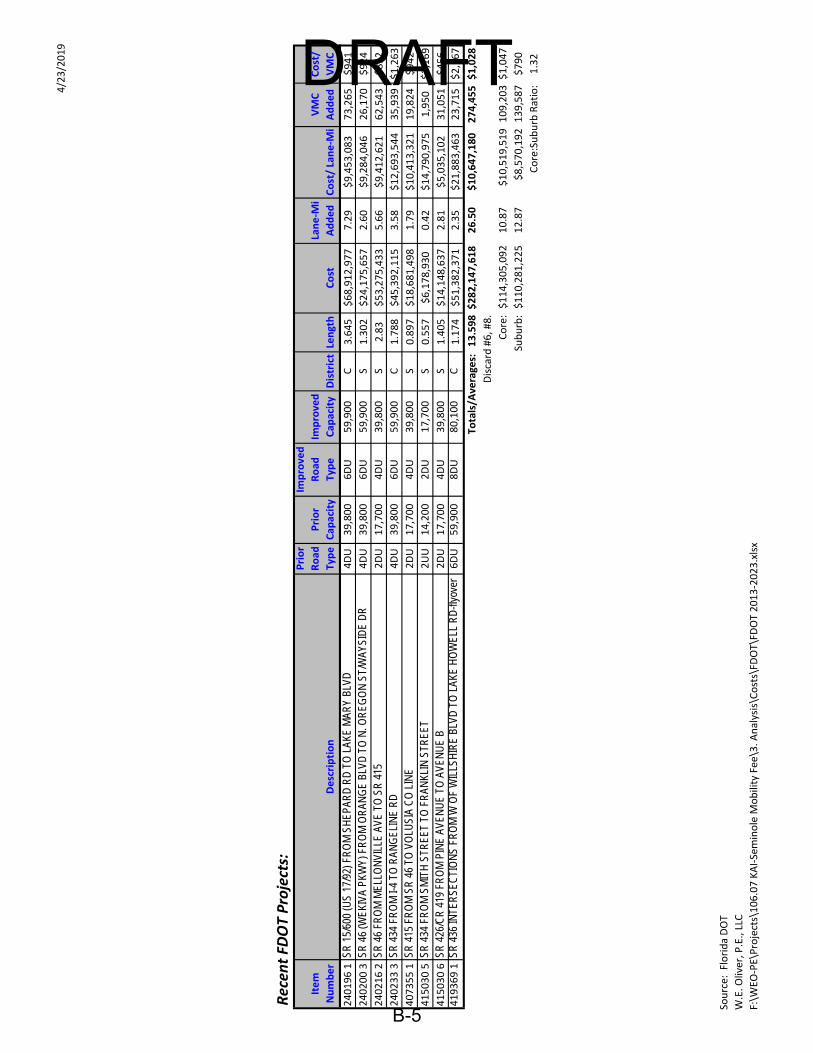
B-5
4/23/2019
DRAFT
Recen
t FD
OT Projects:
Item
Number
Description
Prior
Road
Type
Prior
Cap
acity
Improve
d
Road
Type
Im
prove
d
Cap
acity
District Length
Cost
Lane‐M
i
Added
Cost/ Lane‐M
i VMC
Added
Cost/
VMC
240196 1
SR
15/
600
(US
17/9
2) F
RO
M S
HEP
ARD
RD
TO
LAK
E M
ARY
BLVD
4DU
39,800
6DU
59,900
C
3.645
$68,912,977
7.29
$9,453,083
73,265
$941
240200 3
SR
46
(WEK
IVA
PKW
Y) F
RO
M O
RAN
GE
BLVD
TO
N. O
REG
ON
ST/
WAY
SID
E D
R
4DU
39,800
6DU
59,900
S
1.302
$24,175,657
2.60
$9,284,046
26,170
$924
240216 2
SR
46
FRO
M M
ELLO
NVI
LLE
AVE
TO S
R 4
15
2DU
17,700
4DU
39,800
S
2.83
$53,275,433
5.66
$9,412,621
62,543
$852
240233 3
SR
434
FR
OM
I-4
TO R
ANG
ELIN
E R
D
4DU
39,800
6DU
59,900
C
1.788
$45,392,115
3.58
$12,693,544
35,939
$1,263
407355 1
SR
415
FR
OM
SR
46
TO V
OLU
SIA
CO
LIN
E 2DU
17,700
4DU
39,800
S
0.897
$18,681,498
1.79
$10,413,321
19,824
$942
415030 5
SR
434
FR
OM
SM
ITH
STR
EET
TO F
RAN
KLIN
STR
EET
2UU
14,200
2DU
17,700
S
0.557
$6,178,930
0.42
$14,790,975
1,950
$3,169
415030 6
SR
426
/CR
419
FR
OM
PIN
E AV
ENU
E TO
AVE
NU
E B
2DU
17,700
4DU
39,800
S
1.405
$14,148,637
2.81
$5,035,102
31,051
$456
419369 1
SR
436
INTE
RSE
CTI
ON
S FR
OM
W O
F W
ILLS
HIR
E BL
VD T
O L
AKE
HO
WEL
L R
D-fl
yove
r 6DU
59,900
8DU
80,100
C
1.174
$51,382,371
2.35
$21,883,463
23,715
$2,167
Totals/A
verages:
13.598
$282,147,618
26.50
$10,647,180
274,455
$1,028
Discard #6, #8.
Core: $114,305,092
10.87
$10,519,519
109,203
$1,047
Su
burb: $110,281,225
12.87
$8,570,192
139,587
$790
Core:Suburb Ratio:
1.32
Source: Florida DOT
W.E. O
liver, P
.E., LLC
F:\W
EO‐PE\Projects\106.07 KAI‐Seminole M
obility Fee
\3. A
nalysis\Costs\FD
OT\FD
OT 2013‐2023.xlsx
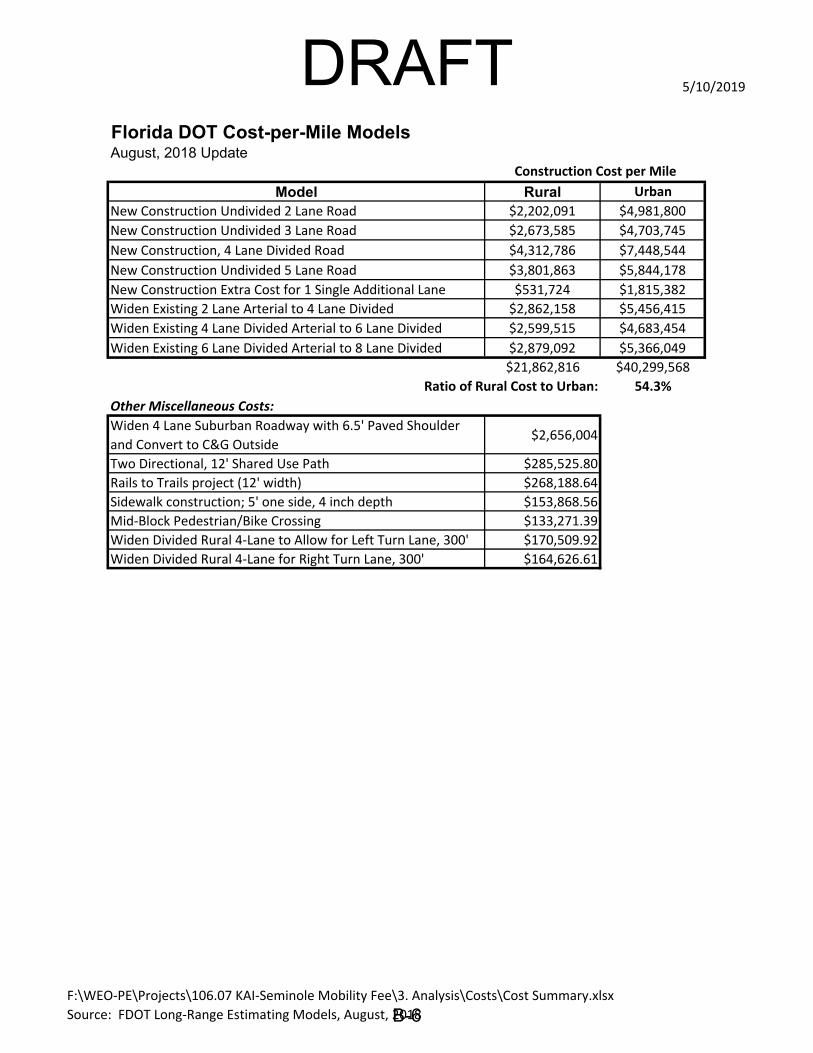
DRAFT 5/10/2019
Florida DOT Cost-per-Mile Models August, 2018 Update
Construction Cost per Mile
Model Rural Urban New Construction Undivided 2 Lane Road $2,202,091 $4,981,800 New Construction Undivided 3 Lane Road $2,673,585 $4,703,745 New Construction, 4 Lane Divided Road $4,312,786 $7,448,544 New Construction Undivided 5 Lane Road $3,801,863 $5,844,178 New Construction Extra Cost for 1 Single Additional Lane $531,724 $1,815,382 Widen Existing 2 Lane Arterial to 4 Lane Divided $2,862,158 $5,456,415 Widen Existing 4 Lane Divided Arterial to 6 Lane Divided $2,599,515 $4,683,454 Widen Existing 6 Lane Divided Arterial to 8 Lane Divided $2,879,092 $5,366,049
$21,862,816 $40,299,568 Ratio of Rural Cost to Urban: 54.3%
Other Miscellaneous Costs: Widen 4 Lane Suburban Roadway with 6.5' Paved Shoulder
and Convert to C&G Outside $2,656,004
Two Directional, 12' Shared Use Path $285,525.80
Rails to Trails project (12' width) $268,188.64
Sidewalk construction; 5' one side, 4 inch depth $153,868.56
Mid‐Block Pedestrian/Bike Crossing $133,271.39
Widen Divided Rural 4‐Lane to Allow for Left Turn Lane, 300' $170,509.92
Widen Divided Rural 4‐Lane for Right Turn Lane, 300' $164,626.61
F:\WEO‐PE\Projects\106.07 KAI‐Seminole Mobility Fee\3. Analysis\Costs\Cost Summary.xlsx Source: FDOT Long‐Range Estimating Models, August, 2018 B-6
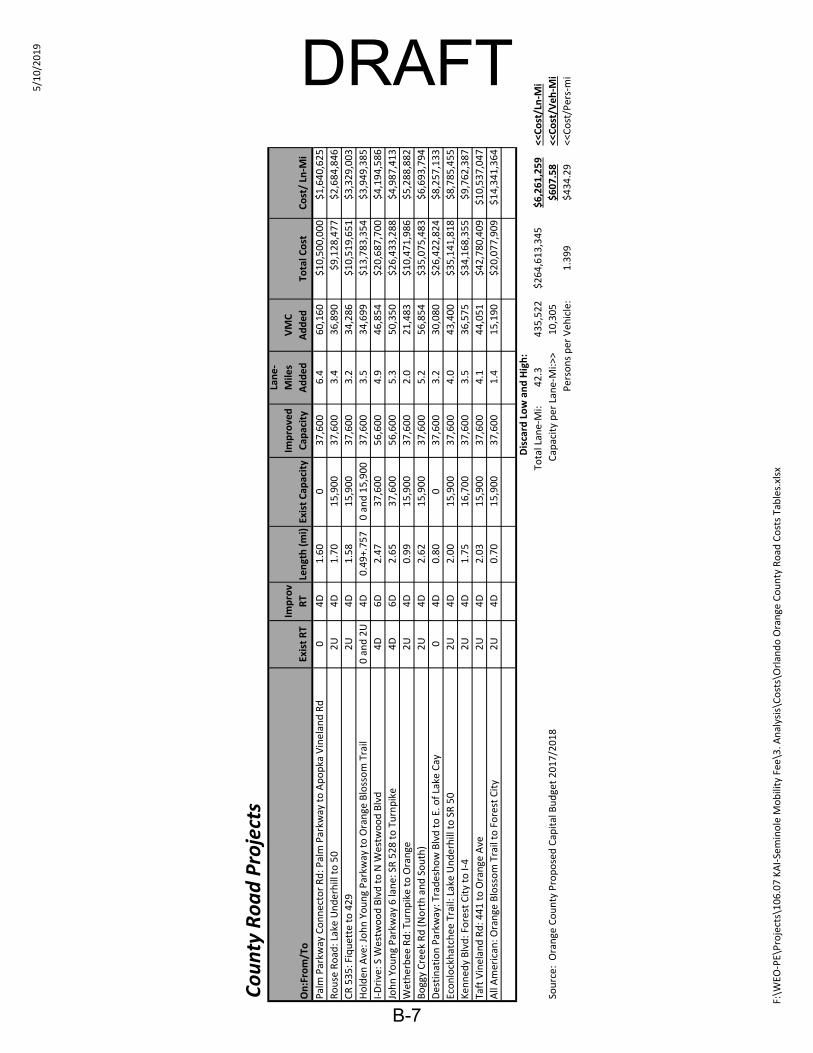
5/10/2019
County Road Projects
B-7
On:From/To
Exist RT
Improv
RT
Length (mi)
Exist Cap
acity
Improve
d
Cap
acity
Lane‐
Mile
s
Added
VMC
Added
To
tal C
ost
Cost/ Ln‐M
i
Palm Parkw
ay Connector Rd: P
alm Parkw
ay to Apopka Vinelan
d Rd
0
4D
1.60
0
37,600
6.4
60,160
$10,500,000
$1,640,625
Rouse Road
: Lake Underhill to 50
2U
4D
1.70
15,900
37,600
3.4
36,890
$9,128,477
$2,684,846
CR 535: Fiquette to 429
2U
4D
1.58
15,900
37,600
3.2
34,286
$10,519,651
$3,329,003
Holden
Ave: John Young Parkw
ay to Orange Blossom Trail
0 and 2U
4D
0.49+.757
0 and 15,900
37,600
3.5
34,699
$13,783,354
$3,949,385
I‐Drive: S W
estw
ood Blvd to N W
estw
ood Blvd
4D
6D
2.47
37,600
56,600
4.9
46,854
$20,687,700
$4,194,586
John Young Parkw
ay 6 lane: SR 528 to Turnpike
4D
6D
2.65
37,600
56,600
5.3
50,350
$26,433,288
$4,987,413
Wetherbee
Rd: T
urnpike to Orange
2U
4D
0.99
15,900
37,600
2.0
21,483
$10,471,986
$5,288,882
Boggy Creek Rd (North and South)
2U
4D
2.62
15,900
37,600
5.2
56,854
$35,075,483
$6,693,794
Destination Parkw
ay: T
radeshow Blvd to E. o
f Lake Cay
0
4D
0.80
0
37,600
3.2
30,080
$26,422,824
$8,257,133
Econlockhatchee
Trail: Lake Underhill to SR 50
2U
4D
2.00
15,900
37,600
4.0
43,400
$35,141,818
$8,785,455
Ken
ned
y Blvd: Forest City to I‐4
2U
4D
1.75
16,700
37,600
3.5
36,575
$34,168,355
$9,762,387
Taft Vinelan
d Rd: 4
41 to Orange Ave
2U
4D
2.03
15,900
37,600
4.1
44,051
$42,780,409
$10,537,047
All American
: Orange Blossom Trail to Forest City
2U
4D
0.70
15,900
37,600
1.4
15,190
$20,077,909
$14,341,364
Discard Low and High:
Total Lan
e‐Mi:
42.3
435,522
$264,613,345
$6,261,259
<<
Cost/Ln‐M
i So
urce: O
range County Proposed Cap
ital Budget 2017/2018
Cap
acity per Lan
e‐Mi:>
> 10,305
$607.58
<<
Cost/V
eh‐M
i Persons per Veh
icle:
1.399
$434.29
<<
Cost/Pers‐mi
F:\W
EO‐PE\Projects\106.07 KAI‐Seminole M
obility Fee
\3. A
nalysis\Costs\Orlan
do Orange County Road
Costs Tables.xlsx
DRAFT

_________________________________________________________________________________________________________________________________________________
DRAFTFLORIDA DEPARTMENT OF TRANSPORTATION
TRANSPORTATION COSTS REPORTS
Transit Costs
Public transportation provides a cost-effective means to maximize the passenger carrying capacity of surface transportation facilities statewide. Transit ridership and new services in Florida continue to grow with 30 urban fixed-route systems, comprised of bus and traditional fixed guideway rail service, as well as vanpools. Currently, Florida’s premium transit services include 2 commuter rail systems, 1 heavy rail system, 1 light rail trolley, 2 people movers and several Bus Rapid Transit (BRT) systems. Demand-response and deviated-route services are also included in non-urbanized areas.
This report offers recent Florida-specific estimates of transit system, operating, fixed guideway construction, new vehicle, and bus stop amenity costs. By providing these cost estimates, FDOT can assist transit agencies and local governments in determining various components and financial requirements of transit service operations. Note that this report only covers urban systems and is provided for planning purposes only. For general information on statewide transit programs, please visit http://www.dot.state.fl.us/transit/.
Transit System CostsActual 2013 Florida Costs
Itemized Expenses Total Expenditures
($ 000,000) Percent
(%) Wages and Salaries 472 39 Fringes 188 16 Purchased Transportation Vehicles 164 14 Materials and Supplies 211 17 Utilities 14 1 Services 127 10 Casualty and Liability 23 2 Other 11 1
General Expenses Total Expenditures ($ 000,000)
Percent (%)
Vehicle Operations Expenses 738 61 Vehicle Maintenance Expenses 217 18 Non-Vehicle Maintenance Expenses 70 6 General Administrative Expenses 192 16
This report is one in a series on transportation costs. The latest version of this and other reports are available at http://www.dot.state.fl.us/planning/policy/costs/default.asp
March 18, 2015 Page 1 of 2
B-8
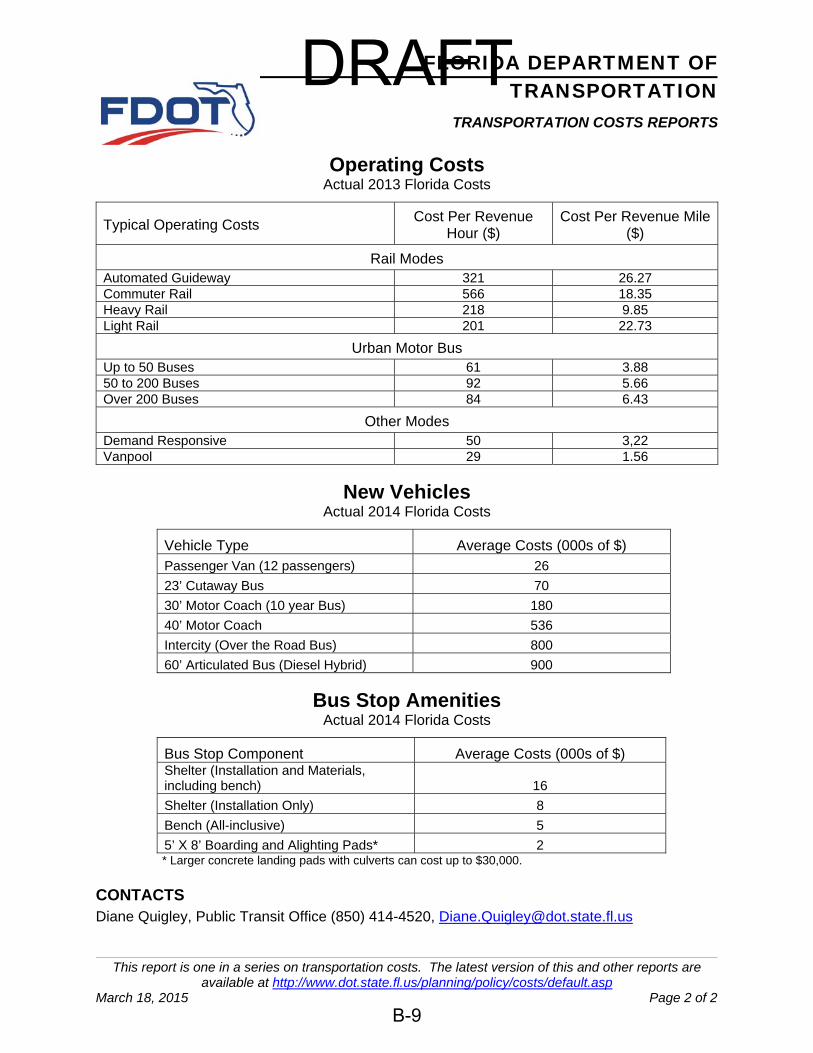
DRAFTFLORIDA DEPARTMENT OF TRANSPORTATION
TRANSPORTATION COSTS REPORTS
Operating CostsActual 2013 Florida Costs
Typical Operating Costs Cost Per Revenue Hour ($)
Cost Per Revenue Mile ($)
Rail Modes Automated Guideway 321 26.27 Commuter Rail 566 18.35 Heavy Rail 218 9.85 Light Rail 201 22.73
Urban Motor Bus Up to 50 Buses 61 3.88 50 to 200 Buses 92 5.66 Over 200 Buses 84 6.43
Other Modes Demand Responsive 50 3,22 Vanpool 29 1.56
New Vehicles Actual 2014 Florida Costs
Vehicle Type Average Costs (000s of $) Passenger Van (12 passengers) 26 23’ Cutaway Bus 70 30’ Motor Coach (10 year Bus) 180 40’ Motor Coach 536 Intercity (Over the Road Bus) 800 60’ Articulated Bus (Diesel Hybrid) 900
Bus Stop AmenitiesActual 2014 Florida Costs
Bus Stop Component Average Costs (000s of $) Shelter (Installation and Materials, including bench) 16 Shelter (Installation Only) 8 Bench (All-inclusive) 5 5’ X 8’ Boarding and Alighting Pads* 2 * Larger concrete landing pads with culverts can cost up to $30,000.
CONTACTS Diane Quigley, Public Transit Office (850) 414-4520, [email protected]
This report is one in a series on transportation costs. The latest version of this and other reports are available at http://www.dot.state.fl.us/planning/policy/costs/default.asp
March 18, 2015 Page 2 of 2
B-9

DRAFT
Appendix C
Revenue Credit Analysis
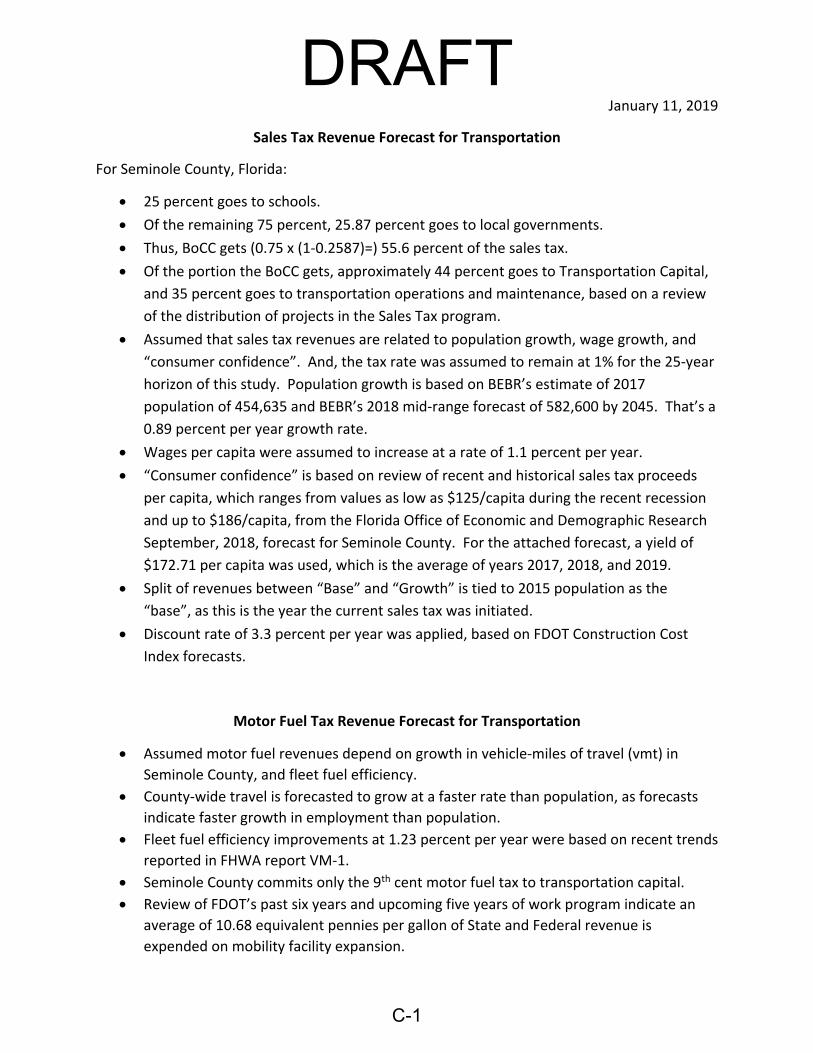
DRAFTJanuary 11, 2019
Sales Tax Revenue Forecast for Transportation
For Seminole County, Florida:
25 percent goes to schools.
Of the remaining 75 percent, 25.87 percent goes to local governments.
Thus, BoCC gets (0.75 x (1‐0.2587)=) 55.6 percent of the sales tax.
Of the portion the BoCC gets, approximately 44 percent goes to Transportation Capital,
and 35 percent goes to transportation operations and maintenance, based on a review
of the distribution of projects in the Sales Tax program.
Assumed that sales tax revenues are related to population growth, wage growth, and
“consumer confidence”. And, the tax rate was assumed to remain at 1% for the 25‐year
horizon of this study. Population growth is based on BEBR’s estimate of 2017
population of 454,635 and BEBR’s 2018 mid‐range forecast of 582,600 by 2045. That’s a
0.89 percent per year growth rate.
Wages per capita were assumed to increase at a rate of 1.1 percent per year.
“Consumer confidence” is based on review of recent and historical sales tax proceeds
per capita, which ranges from values as low as $125/capita during the recent recession
and up to $186/capita, from the Florida Office of Economic and Demographic Research
September, 2018, forecast for Seminole County. For the attached forecast, a yield of
$172.71 per capita was used, which is the average of years 2017, 2018, and 2019.
Split of revenues between “Base” and “Growth” is tied to 2015 population as the
“base”, as this is the year the current sales tax was initiated.
Discount rate of 3.3 percent per year was applied, based on FDOT Construction Cost
Index forecasts.
Motor Fuel Tax Revenue Forecast for Transportation
Assumed motor fuel revenues depend on growth in vehicle‐miles of travel (vmt) in
Seminole County, and fleet fuel efficiency. County‐wide travel is forecasted to grow at a faster rate than population, as forecasts
indicate faster growth in employment than population.
Fleet fuel efficiency improvements at 1.23 percent per year were based on recent trends
reported in FHWA report VM‐1.
Seminole County commits only the 9th cent motor fuel tax to transportation capital.
Review of FDOT’s past six years and upcoming five years of work program indicate an
average of 10.68 equivalent pennies per gallon of State and Federal revenue is
expended on mobility facility expansion.
C-1

I
7/1/2019
Sales Ta
x Reven
ue:
2019 Reven
ue Estimate 1 %:
Share to Schools:
Share to BoCC:
$$ to BoCC:
$ 86
,087
,709 25%
74%
LGFI, 2
0So
urce:
18
$64,565,782
$47,864,766
2045 2.95%
1.00%
Proportion to transportation Cap
ital:
44%
$20,975,970
Proportion to transportation O&M:
35%
$16,729,301
Ye
ar Sales Tax Ends (9/30 of):
Income Inflation Rate:
Sales tax rate:
Tota
l to
Cap
ital To
tal to O&M
Sale
s ta
x 1%
equ
ival
ent g
as ta
x pe
nnie
s:
13.15
pen
nies
$496,805,457
$396,225,206
55.63%
85.1%
14.9%
Year 2020 to 2044 totals :
$3,224,830,873
$668,864,115
$533,449,901
$116,892,138
$93,226,857
$429,192,622
$342,300,859
$67,612,836
$53,924,347
DRAFT
C-2
Year
Population
Annual Sales
Tax/capita @
1%
Sales Ta
x
Proceeds (YOC)
YOC Reve
nue
from Base for
Tran
sportation
Cap
ital
YOC Reve
nue
from Base for
O&M
YOC Reve
nue
from Growth
for
Tran
sportation
Cap
ital
YOC Reve
nue
from Growth
for O&M
YOC Total for
Tran
sportation
Cap
ital
Discount
Factor
PV Reve
nue
from Base for
Cap
ital
PV Reve
nue
from Base for
O&M
PV Reve
nue
from Growth
for Cap
ital
PV Reve
nue
from Growth
for O&M
2019
462,760
$164.00
$75,894,795
$17,933,922
$14,303,128
$558,461
$445,399
$18,492,384
1.000
$17,933,922
$14,303,128
$558,461
$445,399
2020
466,878
$169
$78,829,793
$18,463,200
$14,725,251
$744,320
$593,629
$19,207,520
1.033
$17,873,379
$14,254,842
$720,542
$574,665
2021
471,031
$174
$81,878,293
$19,008,098
$15,159,833
$942,213
$751,458
$19,950,312
1.067
$17,813,039
$14,206,718
$882,975
$704,213
2022
475,222
$179
$85,044,685
$19,569,078
$15,607,240
$1,152,751
$919,372
$20,721,829
1.102
$17,752,904
$14,158,757
$1,045,766
$834,046
2023
479,450
$184
$88,333,527
$20,146,614
$16,067,851
$1,376,568
$1,097
,876
$21,523,182
1.139
$17,692,971
$14,110,959
$1,208,917
$964,167
2024
483,715
$190
$91,749,555
$20,741,194
$16,542,056
$1,614,331
$1,287
,503
$22,355,525
1.176
$17,633,241
$14,063,321
$1,372,432
$1,094,578
2025
488,019
$195
$95,297,687
$21,353,322
$17,030,256
$1,866,734
$1,488
,806
$23,220,056
1.215
$17,573,712
$14,015,844
$1,536,316
$1,225,283
2026
492,360
$201
$98,983,032
$21,983,515
$17,532,865
$2,134,505
$1,702
,366
$24,118,020
1.255
$17,514,385
$13,968,528
$1,700,572
$1,356,284
2027
496,741
$207
$102,810,897
$22,632,307
$18,050,306
$2,418,403
$1,928,788
$25,050,711
1.297
$17,455,258
$13,921,371
$1,865,203
$1,487,585
2028
501,160
$213
$106,786,792
$23,300,247
$18,583,019
$2,719,223
$2,168,705
$26,019,470
1.339
$17,396,330
$13,874,373
$2,030,214
$1,619,189
2029
505,619
$219
$110,916,443
$23,987,899
$19,131,453
$3,037,793
$2,422,780
$27,025,693
1.384
$17,337,601
$13,827,534
$2,195,609
$1,751,099
2030
510,117
$226
$115,205,796
$24,695,846
$19,696,073
$3,374,982
$2,691,704
$28,070,829
1.429
$17,279,071
$13,780,854
$2,361,391
$1,883,318
2031
514,656
$233
$119,661,026
$25,424,687
$20,277,357
$3,731,695
$2,976,198
$29,156,382
1.476
$17,220,738
$13,734,330
$2,527,565
$2,015,849
2032
519,234
$239
$124,288,549
$26,175,037
$20,875,796
$4,108,878
$3,277,019
$30,283,915
1.525
$17,162,602
$13,687,964
$2,694,133
$2,148,695
2033
523,854
$246
$129,095,026
$26,947,532
$21,491,896
$4,507,521
$3,594,955
$31,455,052
1.575
$17,104,662
$13,641,755
$2,861,101
$2,281,860
2034
528,514
$254
$134,087,380
$27,742,825
$22,126,179
$4,928,655
$3,930,829
$32,671,480
1.627
$17,046,918
$13,595,701
$3,028,472
$2,415,346
2035
533,216
$261
$139,272,797
$28,561,590
$22,779,182
$5,373,359
$4,285,501
$33,934,949
1.681
$16,989,369
$13,549,803
$3,196,250
$2,549,156
2036
537,960
$269
$144,658,745
$29,404,519
$23,451,456
$5,842,760
$4,659,870
$35,247,279
1.737
$16,932,014
$13,504,060
$3,364,439
$2,683,295
2037
542,746
$277
$150,252,977
$30,272,324
$24,143,571
$6,338,035
$5,054,874
$36,610,359
1.794
$16,874,852
$13,458,471
$3,533,042
$2,817,764
2038
547,575
$285
$156,063,549
$31,165,741
$24,856,112
$6,860,411
$5,471,493
$38,026,152
1.853
$16,817,884
$13,413,036
$3,702,065
$2,952,567
2039
552,447
$293
$162,098,828
$32,085,525
$25,589,682
$7,411,172
$5,910,750
$39,496,697
1.914
$16,761,108
$13,367,755
$3,871,510
$3,087,708
2040
557,362
$302
$168,367,502
$33,032,455
$26,344,902
$7,991,656
$6,373,713
$41,024,110
1.977
$16,704,524
$13,322,626
$4,041,383
$3,223,189
2041
562,320
$311
$174,878,598
$34,007,330
$27,122,410
$8,603,261
$6,861,497
$42,610,592
2.043
$16,648,130
$13,277,650
$4,211,686
$3,359,014
2042
567,323
$320
$181,641,490
$35,010,977
$27,922,865
$9,247,448
$7,375,265
$44,258,425
2.110
$16,591,927
$13,232,825
$4,382,425
$3,495,186
2043
572,370
$330
$188,665,917
$36,044,245
$28,746,943
$9,925,739
$7,916,234
$45,969,984
2.180
$16,535,914
$13,188,152
$4,553,603
$3,631,708
2044
577,462
$339
$195,961,991
$37,108,006
$29,595,342
$10,639,726
$8,485,671
$47,747,732
2.252
$16,480,090
$13,143,630
$4,725,224
$3,768,583
F:\W
EO‐PE\Projects\106.07 KAI‐Seminole M
obility Fee
\3. A
nalysis\Strategic Planning\Strategic Planning v2.xlsm
So
urce: W
.E. O
liver, P
.E., LLC

DRAFT 6/14/2019
Summary of Sales Tax Program (Resolution 2014‐R‐67) Seminole County Portion Only
Capital/ Stormwater/
System Subdivison
O&M Expansion Rehab Total Roads Capacity $32,000,000 $121,350,000 $153,350,000 Resurfacing $68,000,000 $68,000,000 Bridges $12,000,000 $12,000,000 Minor roadway $5,000,000 $5,000,000 Safety $5,000,000 $5,000,000 New Signals $3,500,000 $3,500,000 Signals/SignsUpgrades $6,500,000 $6,500,000 Trails $10,000,000 $10,000,000 Sidewalks $15,000,000 $15,000,000 Stormwater $40,000,000 $40,000,000 Subdiv Rehab $35,000,000 $35,000,000
Totals: $123,500,000 $154,850,000 $75,000,000 $353,350,000 34.95% 43.82% 21.23%
Source: W.E. Oliver, P.E., LLC F:\WEO‐PE\Projects\106.07 KAI‐Seminole Mobility Fee\3. Analysis\Strategic Planning\Strategic Planning 1.xlsm
C-3
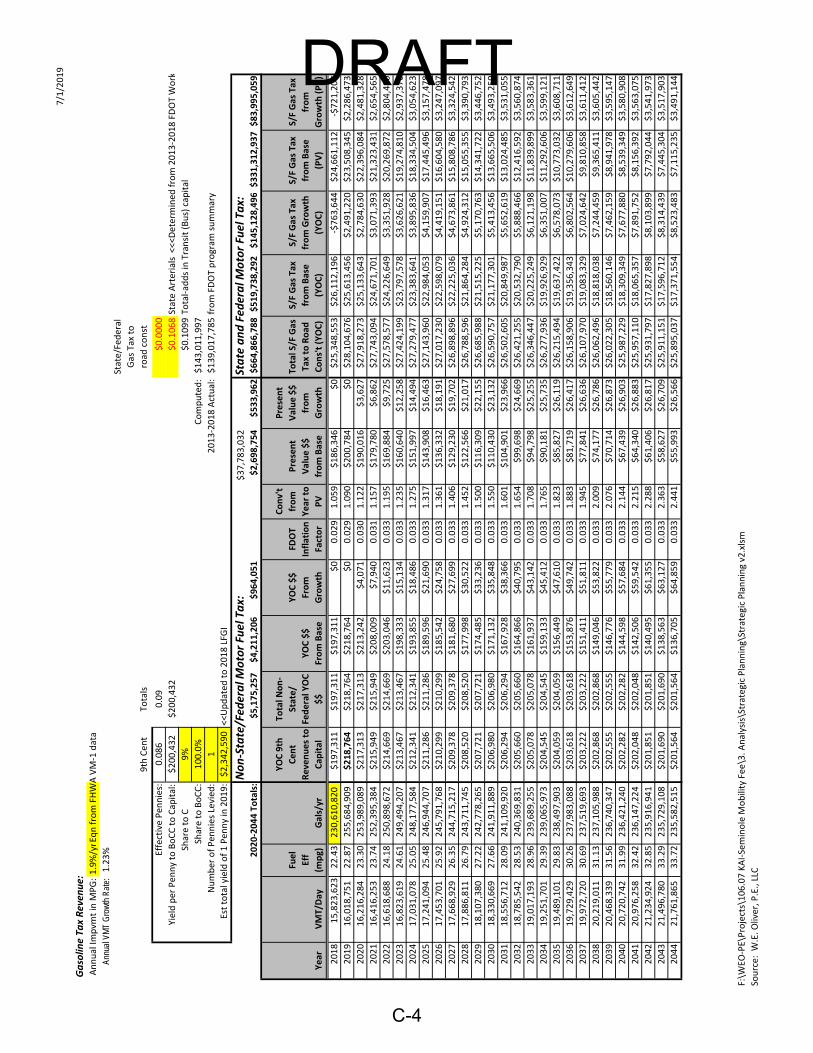
7/1/2019
Gasolin
e Ta
x Reven
ue:
Annual Im
pvm
t in M
PG: 1.9%/yrEqn from FHWA VM‐1 data
Annu
al V
MT
Gro
wth
Rat
e: 1.23%
State/Federal
Gas Tax to
9th Cen
t To
tals
road
const
Effective Pen
nies:
0.086
0.09
$0.0000
Yield per Pen
ny to BoCC to Cap
ital:
$200,432
$200,432
$0.1068
State Arterials
<<<
Determined
from 2013‐2018 FDOT Work
Sh
are to Cap
ital:
9%
$0.1099
Total‐ad
ds in Transit (Bus) cap
ital
Sh
are to BoCC:
100.0%
Computed: $143,011,997
Number of Pen
nies Levied
: 1
2013‐2018 Actual: $139,017,785
from FDOT program
summary
Est total yield of 1 Pen
ny in 2019: $2,342,590
<<
Updated
to 2018 LFG
I
Non‐State/Fed
eral M
otor Fu
el Tax:
$37,783,032
State and Fed
eral M
otor Fu
el Tax:
2020‐2044 Totals:
$5,175,257
$4,211,206
$964,051
$2,698,754
$533,962
$664,866,788
$519,738,292
$145,128,496
$331,312,937
$83,995,059
Year
VMT/Day
Fuel
Eff
(mpg)
Gals/yr
YOC 9th
Cent
Reve
nues to
Cap
ital
Total N
on‐
State/
Federal Y
OC
$$
YOC $$
From Base
YOC $$
From
Growth
FDOT
Inflation
Factor
Conv't
from
Year to
PV
Present
Value $$
from Base
Present
Value $$
from
Growth
Total S/F Gas
Tax to Road
Cons't (YOC)
S/F Gas Tax
from Base
(YOC)
S/F Gas Tax
from Growth
(YOC)
S/F Gas Tax
from Base
(PV)
S/F Gas Tax
from
Growth (PV)
2018
15,823,623
22.43
230,610,820
$197,311
$197,311
$197,311
$0
0.029
1.059
$186,346
$0
$25,348,553
$26,112,196
‐$763,644
$24,661,112
‐$721,207
2019
16,018,751
22.87
255,684,909
$218,764
$218,764
$218,764
$0
0.029
1.090
$200,784
$0
$28,104,676
$25,613,456
$2,491,220
$23,508,345
$2,286,473
2020
16,216,284
23.30
253,989,089
$217,313
$217,313
$213,242
$4,071
0.030
1.122
$190,016
$3,627
$27,918,273
$25,133,643
$2,784,630
$22,396,084
$2,481,328
2021
16,416,253
23.74
252,395,384
$215,949
$215,949
$208,009
$7,940
0.031
1.157
$179,780
$6,862
$27,743,094
$24,671,701
$3,071,393
$21,323,431
$2,654,565
2022
16,618,688
24.18
250,898,672
$214,669
$214,669
$203,046
$11,623
0.033
1.195
$169,884
$9,725
$27,578
,577
$24,226,649
$3,351,928
$20,269,872
$2,804,480
2023
16,823,619
24.61
249,494,207
$213,467
$213,467
$198,333
$15,134
0.033
1.235
$160,640
$12,258
$27,424,199
$23,797,578
$3,626,621
$19,274,810
$2,937,376
2024
17,031,078
25.05
248,177,584
$212,341
$212,341
$193,855
$18,486
0.033
1.275
$151,997
$14,494
$27,279,477
$23,383,641
$3,895,836
$18,334,504
$3,054,623
2025
17,241,094
25.48
246,944,707
$211,286
$211,286
$189,596
$21,690
0.033
1.317
$143,908
$16,463
$27,143,960
$22,984,053
$4,159,907
$17,445,496
$3,157,478
2026
17,453,701
25.92
245,791,768
$210,299
$210,299
$185,542
$24,758
0.033
1.361
$136,332
$18,191
$27,017,230
$22,598,079
$4,419,151
$16,604,580
$3,247,097
2027
17,668,929
26.35
244,715,217
$209,378
$209,378
$181,680
$27,699
0.033
1.406
$129,230
$19,702
$26,898,896
$22,225,036
$4,673,861
$15,808,786
$3,324,542
2028
17,886,811
26.79
243,711,745
$208,520
$208,520
$177,998
$30,522
0.033
1.452
$122,566
$21,017
$26,788,596
$21,864,284
$4,924,312
$15,055,355
$3,390,793
2029
18,107,380
27.22
242,778,265
$207,721
$207,721
$174,485
$33,236
0.033
1.500
$116,309
$22,155
$26,685,988
$21,515,225
$5,170,763
$14,341,722
$3,446,752
2030
18,330,669
27.66
241,911,889
$206,980
$206,980
$171,132
$35,848
0.033
1.550
$110,430
$23,132
$26,590,757
$21,177,301
$5,413,456
$13,665,506
$3,493,250
2031
18,556,712
28.09
241,109,920
$206,294
$206,294
$167,928
$38,366
0.033
1.601
$104,901
$23,966
$26,502,605
$20,849,987
$5,652,619
$13,024,485
$3,531,055
2032
18,785,542
28.53
240,369,831
$205,660
$205,660
$164,866
$40,795
0.033
1.654
$99,698
$24,669
$26,421
,255
$20,532,790
$5,888,466
$12,416,592
$3,560,874
2033
19,017,193
28.96
239,689,255
$205,078
$205,078
$161,937
$43,142
0.033
1.708
$94,798
$25,255
$26,346
,447
$20,225,249
$6,121,198
$11,839,899
$3,583,361
2034
19,251,701
29.39
239,065,973
$204,545
$204,545
$159,133
$45,412
0.033
1.765
$90,181
$25,735
$26,277
,936
$19,926,929
$6,351,007
$11,292,606
$3,599,121
2035
19,489,101
29.83
238,497,903
$204,059
$204,059
$156,449
$47,610
0.033
1.823
$85,827
$26,119
$26,215
,494
$19,637,422
$6,578,073
$10,773,032
$3,608,711
2036
19,729,429
30.26
237,983,088
$203,618
$203,618
$153,876
$49,742
0.033
1.883
$81,719
$26,417
$26,158
,906
$19,356,343
$6,802,564
$10,279,606
$3,612,649
2037
19,972,720
30.69
237,519,693
$203,222
$203,222
$151,411
$51,811
0.033
1.945
$77,841
$26,636
$26,107
,970
$19,083,329
$7,024,642
$9,810,858
$3,611,412
2038
20,219,011
31.13
237,105,988
$202,868
$202,868
$149,046
$53,822
0.033
2.009
$74,177
$26,786
$26,062
,496
$18,818,038
$7,244,459
$9,365,411
$3,605,442
2039
20,468,339
31.56
236,740,347
$202,555
$202,555
$146,776
$55,779
0.033
2.076
$70,714
$26,873
$26,022
,305
$18,560,146
$7,462,159
$8,941,978
$3,595,147
2040
20,720,742
31.99
236,421,240
$202,282
$202,282
$144,598
$57,684
0.033
2.144
$67,439
$26,903
$25,987
,229
$18,309,349
$7,677,880
$8,539,349
$3,580,908
2041
20,976,258
32.42
236,147,224
$202,048
$202,048
$142,506
$59,542
0.033
2.215
$64,340
$26,883
$25,957
,110
$18,065,357
$7,891,752
$8,156,392
$3,563,075
2042
21,234,924
32.85
235,916,941
$201,851
$201,851
$140,495
$61,355
0.033
2.288
$61,406
$26,817
$25,931
,797
$17,827,898
$8,103,899
$7,792,044
$3,541,973
2043
21,496,780
33.29
235,729,108
$201,690
$201,690
$138,563
$63,127
0.033
2.363
$58,627
$26,709
$25,911
,151
$17,596,712
$8,314,439
$7,445,304
$3,517,903
2044
21,761,865
33.72
235,582,515
$201,564
$201,564
$136,705
$64,859
0.033
2.441
$55,993
$26,566
$25,895
,037
$17,371,554
$8,523,483
$7,115,235
$3,491,144
C-4
F:\W
EO‐PE\Projects\106.07 KAI‐Seminole M
obility Fee
\3. A
nalysis\Strategic Planning\Strategic Planning v2.xlsm
So
urce: W
.E. O
liver, P
.E., LLC
DRAFT

5/10/2019
Florida DOT Work Program ‐‐ Construction
Type of Work
2013
2014
2015
2016
2017
2018
2019
2020
2021
2022
2023
ADD
LANES &
REC
ONSTRUCT
$16,973,600
$554,720
$6,968,434
$88,224,234
$2,433,647
$2,236,293
$25,669,554
$0
$14,148,637
$0
$0
ADD LANES & REH
ABILITATE PVMNT
$204,216
$1,461,635
$259,493
$19,496
$60,340
$305
$9,970,923
$0
$0
$0
$0
NEW
ROAD CONSTRUCTION
$0
$0
$0
$0
$0
$0
$4,175,118
$0
$0
$0
$0
ADD
RIGHT TU
RN LANE(S)
$0
$0
$0
$0
$0
$0
$371,312
$6,804,850
$1,550,267
$5
9,455
$0
ADD
TURN LANE(S)
$824,943
$576,721
$1,722,436
$6,045
$294
$0
$0
$419,273
$0 $0
$0
INTE
RSECTION IM
PROVEM
ENT
$0
$0
$0
$0
$2,561,234
$1,375
$742,762
$0
$0
$0
$0
BIKE PATH
/TRAIL
$7,170,955
$8,996
$1,100,322
$51,703
$414
$0
$366,897
$0
$0 $0
$0
PED
ESTR
IAN SAFETY IM
PROVEM
ENT
$0
$0
$0
$0
$0
$1,561,332
$55,778
$0
$0
$0
$0
SIDEW
ALK
$2,799,707
$1,464,962
$480,688
$581,168
$266,518
$2,811
$14,905
$0
$0
$0
$0
LIGHTING
$937,199
$163,261
$955
$0
$0
$0
$0
$350,000
$0
$0
$0
SA
FETY PROJECT
$51,411
$941
$683,675
$5,177
$1,481,284
$75,350
$0
$0
$0
$0
$0
OTH
ER ITS
$0
$0
$0
$0
$0
$0
$692,128
$0
$0
$0
$0
TR
AFFIC
OPS IM
PROVEM
ENT
$960,000
$80,786
$808,852
$10,558
$10
$0
$54
$1,441,321
$0
$0
$0
TR
AFFIC
SIGNALS
$0
$0
$327,130
$8,974
$1,456,699
$72,826
$0
$0
$0
$0
$0
LA
NDSC
APING
$400,295
$0
$20,180
$1,422,021
$44,626
$140,447
$71,421
$0
$0
$4,266,758
$4,066,878
MISCELLA
NEO
US CONSTRUCTION
$0
$0
$0
$0
$0
$0
$0
$0
$0
$0
$0
BRIDGE REP
LACEM
ENT
$0
$0
$0
$0
$0
$0
$10,205,986
$0
$0
$0
$0
BRIDGE‐REP
AIR/REH
ABILITATION
$0
$0
$0
$0
$0
$0
$0
$0
$0
$0
$0
DRAINAGE IM
PROVEM
ENTS
$7,242,596
$81,025
$0
$400
$126
$856
$0
$0
$0
$0
$0
EM
ERGEN
CY OPER
ATIONS
$0
$0
$0
$1,362
$58,090
$0
$0
$0
$0
$0
$0
PAVE SH
OULD
ERS
$4,299,040
$333
$1,143
$2,685
$413
$0
$0
$0
$0
$0
$0
RELOCATE UTILITY SYSTEMS
$0
$0
$0
$0
$0
$2,600,122
$0
$0
$0
$0
$0
RESURFA
CING
$4,844,706
$678,430
$2,706,662
$1,234,720
$74,090
$4,872,048
$9,814,282
$1,807,709
$8,538,905
$0
$0
C-5
Program
Totals: $46,708,668
$5,071,810
$15,079,970
$91,568,543
$8,437,785
$11,563,765
$62,151,120
$10,823,153
$24,237,809
$4,326,213
$4,066,878
Accumulative Average: $46,708,668
$25,890,239
$22,286,816
$39,607,248
$33,373,355
$29,738,424
$34,368,809
$31,425,602
$30,626,958
$27,996
,884
$25,821,429
Mobility Capital P
rojects:
"Cap
acity": $18,002,759
$2,593,076
$8,950,363
$88,249,775
$5,055,515
$2,237,973
$40,929,669
$7,224,123
$15,698,904
$59,455
$0
Bikes:
$7,170,955
$8,996
$1,100,322
$51,703
$414
$0
$366,897
$0
$0
$0
$0
Sidewalks:
$2,799,707
$1,464,962
$480,688
$581,168
$266,518
$2,811
$14,905
$0
$0
$0
$0
Totals: $27,973,421
$4,067,034
$10,531,373
$88,882,646
$5,322,447
$2,240,784
$41,311,471
$7,224,123
$15,698,904
$59,455
$0
Accumulative Yearly Average: $27,973,421
$16,020,228
$14,190,609
$32
,863,619
$27,355,384
$23,169,618
$25,761,311
$23,444,162
$22,583,578
$20,331,166
$18,482,878
2013‐2018 Acutal total: $139,017,705
2013‐2021 Average: $22,583,578
Annual $$/1 pen
ny:
$2,342,590
Eq
uivalen
t Pen
nies:
9.64
Source: FDOT District 5
W.E. O
liver, P
.E., LLC
F:\W
EO‐PE\Projects\106.07 KAI‐Seminole M
obility Fee
\3. A
nalysis\Costs\FD
OT\FD
OT 2013‐2023.xlsx
DRAFT

-- -
5/10/2019
Bus Service Expansion Assumptions:
Horizon Year:
Basic Stop Cost:
Enhan
ced Stop Cost:
Luxury Stop Cost:
Bus Cost:
25
$2,500
$10,000
$16,000
$536,000
Operating Cost/H
r:
Total H
rs/W
eekd
ay Hrs:
Park n Ride Lot Cost:
Tran
sfer Station Cost:
Mtce Barn
Cost:
$89
1.06
$750,000
$500,000
$4,000,000
Fleet Margin:
Bus Cap
acity:
Bus Cap
acity Utilization:
Stop Spacing (m
i):
Bus Eq
uivalent Cars:
1.2 60
0.5
0.333 7
DRAFT
C-6
Non‐Toll/Int MRN CL Miles
% Covered:
Rural
Suburb
Core
To
tal
Exist
Horizon
Exist
Horizon
Exist
Horizon
Exist
Horizon
45.9
235.2
235.2
138.2
138.2
373.4
0%
0%
14%
12%
34%
62%
30%
31.82
27.37
46.99
85.13
112.5
Overlap
Factor:
0.000
1.000
1.091
1.100
1.087
1.200
Pk Head
way (mins):
60
60
30
20
20
15
Cycles/Day:
0.00
0
38.80
58.2
60.2
80.2
Pk Hr Sp
eed (mph):
Basic Stops:
En
han
ced Stops:
Luxury Stops:
Tran
sfer Stations:
P'n'R Lots:
Mtce Barn:
Route‐M
iles
0.0
20
13.0
13
13.0
13
70%
95%
70%
60%
70%
40%
20%
5%
20%
30%
20%
40%
10%
0%
10%
10%
10%
20%
0
0
4
4
0
0
0
0
4
4
0
0
0
0
0
0
0
0
0.0
0.0
34.7
30.1
51.10
102.2
86
132
Bus‐Miles Travel/day:
0
0
1,347
1,752
3,075
8,196
4,421
9,948
Veh‐Hrs/day:
Buses:
Bus Cost:
Stop Cost:
Tran
sfer Station Cost:
P'n'R
Lot Cost:
Mtce
Barn
Cost:
Road
Consumption Cost:
Cap
ital
Cost:
Annual Ops Cost:
Person‐M
iles Cap
acity:
0.0
0.0
103.6
134.8
236.5
630.5
340
765
0
0
7
9
15
38
22
47
$0
$0
$3,752,000
$4,824,000
$8,040,000
$20,368,000
$0
$0
$511,222
$501,372
$754,996
$2,096,365
$0
$0
$2,000,000
$2,000,000
$0
$0
$0
$0
$3,000,000
$3,000,000
$0
$0
$0
$0
$0 $0
$0 $0
$0
$0
$18,199,111
$23,678,475
$41,187,821
$109,790,631
$0
$0
$27,462,333
$34,003,846
$49,982,817
$132,254,996
$77,445,151
$166,258,843
$0
$0
$2,462,828
$3,204,333
$5,623,145
$14,989,108
$8,085,974
$18,193,441
0
0
40,400
52,563
92,240
245,877
132,640
298,440
Plan Cap
ital Cost:
% n
on-R
oad
Cap
Cos
t to
Co:
Rural
Suburb
Core
N/A
To
tal
$0
$6,541,513
$82,272,179
$0
$88,813,692
20%
20%
20%
20%
$0
$5,691,793
$71,336,684
$0
$77,028,477
0
741,505
9,365,962
0
10,107,467
‐
$7.68
$7.62
‐
$7.62
$0
$70,839,519
$257,653,164
$0
$328,492,682
1.20
<<Source: Lynx TD
P 2018 Sec 8.3
$11,785,215
Fed/State share of capital
Plan Cap
ital Cost
to Co:
0.3119
<<<Eq
Pennies Fed/State
PMC Added:
$$/PMC Cap
ital Cost:
PV 25 yrs
O&M Cost:
Paratransit Multiplier:
F:\W
EO‐PE\Projects\106.07 KAI‐Seminole M
obility Fee\3. A
nalysis\Strategic Planning\Strategic Planning v2.xlsm

DRAFT
Appendix D
Other Fee Parameters

1/31
/201
7
Dow
nloa
d Pa
ge
H.1
5 Se
lect
ed In
tere
st R
ates
for N
ov 0
2, 2
016
Serie
s D
escr
iptio
n BO
ND
BU
YER
GO
20-
BON
D M
UN
ICIP
AL B
ON
D IN
DEX
U
nit:
Perc
ent:_
Per_
Year
M
ultip
lier:
1 So
urce
: ht
tp://
ww
w.fe
dera
lrese
rve.
gov/
rele
ases
/h15
/ dat
a/m
onth
ly.
D-1
Tim
e Pe
riod
Inte
rest
R
ate
Tim
e Pe
riod
Inte
rest
R
ate
Tim
e Pe
riod
Inte
rest
R
ate
Tim
e Pe
riod
Inte
rest
R
ate
Tim
e Pe
riod
Inte
rest
R
ate
2006
-10
2006
-11
2006
-12
2007
-01
2007
-02
2007
-03
2007
-04
2007
-05
2007
-06
2007
-07
2007
-08
2007
-09
4.3
4.14
4.
11
4.23
4.
22
4.15
4.
26
4.31
4.
6 4.
56
4.64
4.
51
2007
-10
2007
-11
2007
-12
2008
-01
2008
-02
2008
-03
2008
-04
2008
-05
2008
-06
2008
-07
2008
-08
2008
-09
4.39
4.
46
4.42
4.
27
4.64
4.
93
4.7
4.58
4.
69
4.68
4.
69
4.86
2008
-10
2008
-11
2008
-12
2009
-01
2009
-02
2009
-03
2009
-04
2009
-05
2009
-06
2009
-07
2009
-08
2009
-09
5.5
5.23
5.
56
5.07
4.
9 4.
99
4.78
4.
56
4.81
4.
72
4.6
4.24
2009
-10
2009
-11
2009
-12
2010
-01
2010
-02
2010
-03
2010
-04
2010
-05
2010
-06
2010
-07
2010
-08
2010
-09
4.2
4.37
4.
21
4.33
4.
36
4.36
4.
41
4.29
4.
36
4.32
4.
03
3.87
2010
-10
2010
-11
2010
-12
2011
-01
2011
-02
2011
-03
2011
-04
2011
-05
2011
-06
2011
-07
2011
-08
2011
-09
3.87
4.
4 4.
92
5.28
5.
15
4.92
4.
99
4.59
4.
51
4.52
4.
02
4.01
12
-Mon
th A
vg:
4.34
4.
61
4.91
4.
26
4.60
Pr
ior F
ive-
Year
Ave
rage
: 4.
54 %
2011
-10
2011
-11
2011
-12
2012
-01
2012
-02
2012
-03
2012
-04
2012
-05
2012
-06
2012
-07
2012
-08
2012
-09
4.13
4.
05
3.95
3.
68
3.66
3.
91
3.95
3.
77
3.94
3.
78
3.74
3.
73
2012
-10
2012
-11
2012
-12
2013
-01
2013
-02
2013
-03
2013
-04
2013
-05
2013
-06
2013
-07
2013
-08
2013
-09
3.65
3.
46
3.48
3.
6 3.
72
3.96
3.
92
3.72
4.
27
4.56
4.
82
4.79
2013
-10
2013
-11
2013
-12
2014
-01
2014
-02
2014
-03
2014
-04
2014
-05
2014
-06
2014
-07
2014
-08
2014
-09
4.56
4.
6 4.
73
4.59
4.
44
4.46
4.
35
4.29
4.
35
4.33
4.
23
4.13
2014
-10
2014
-11
2014
-12
2015
-01
2015
-02
2015
-03
2015
-04
2015
-05
2015
-06
2015
-07
2015
-08
2015
-09
3.96
3.
96
3.7
3.4
3.58
3.
59
3.51
3.
76
3.82
3.
79
3.74
3.
78
2015
-10
2015
-11
2015
-12
2016
-01
2016
-02
2016
-03
2016
-04
2016
-05
2016
-06
2016
-07
2016
-08
2016
-09
3.67
3.
68
3.57
3.
41
3.3
3.38
3.
3 3.
29
3.01
2.
83
2.85
2.
93
12-M
onth
Avg
: 3.
86
4.00
4.
42
3.72
3.
27
Rec
ent F
ive-
Year
Ave
rage
: 3.
85 %
Av
erag
e w
eigh
ted
as 1
*Prio
r fiv
e-Ye
ar A
vera
ge +
2*R
ecen
t Fiv
e-Ye
ar A
vera
ge:
4.08
%
H:\p
rojfi
le\1
9851
- La
ke C
o Im
pact
Fee
\2. D
ata\
Loca
l Bon
d R
ates
\Sta
te a
nd L
ocal
Bon
d In
tere
st R
ates
His
tory
.xls
x
DRAFT
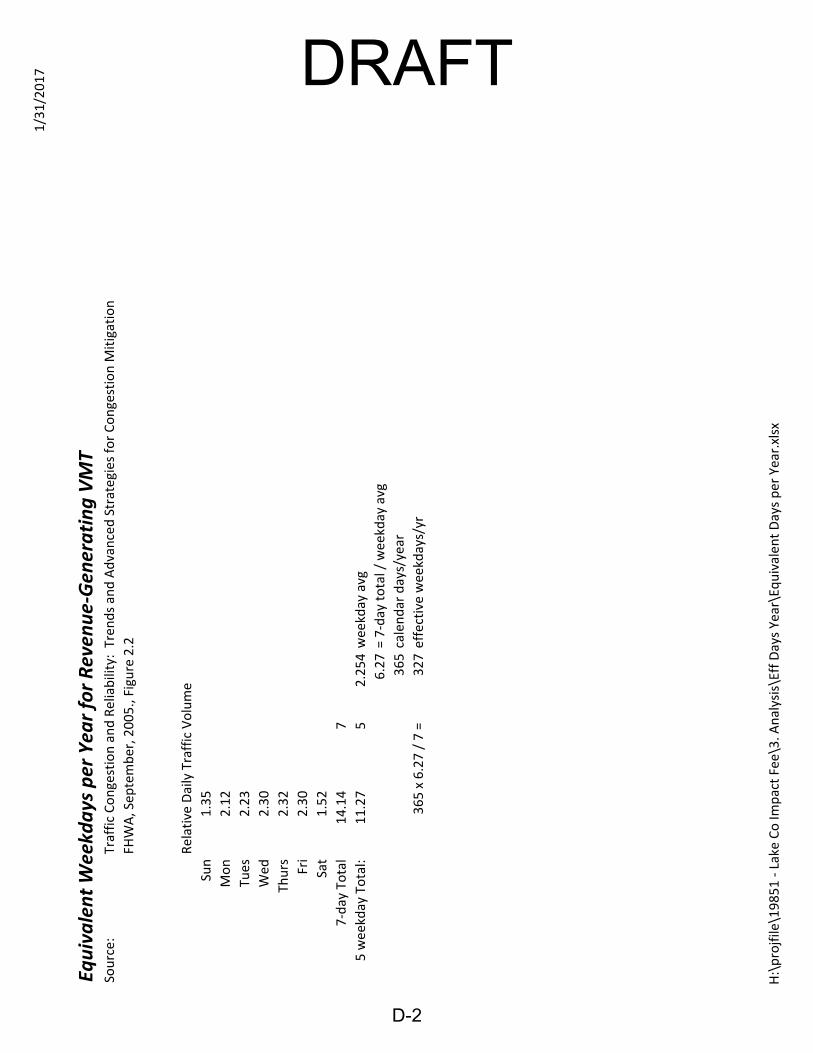
1/31/2017
D-2
Equivalent
Weekdays p
er Yea
r for
Reven
ue‐Gen
erating VM
T Source:
Traffic Congestion
and
Reliability: Tren
ds and
Advanced
Strategies for Congestion
Mitigation
FH
WA, Sep
tember, 2005.,
Figure
2.2
Relative Daily
Traffic
Volume
Sun
1.35
Mon
2.12
Tues
2.23
Wed
2.30
Thurs
2.32
Fri
2.30
Sat
1.52
7‐day
Total
14.14
7
5
weekday
Total:
11.27
5
2.254
weekday
avg
6.27
=7‐day
total /
weekday
avg
365
calen
dar
days/year
365
x 6.27
/ 7
=
327
effective
weekdays/yr
H:\projfile\19851 ‐Lake
Co
Impact Fee\3. A
nalysis\Eff
Days Year\Equivalen
t Days per
Year.xlsx
DRAFT
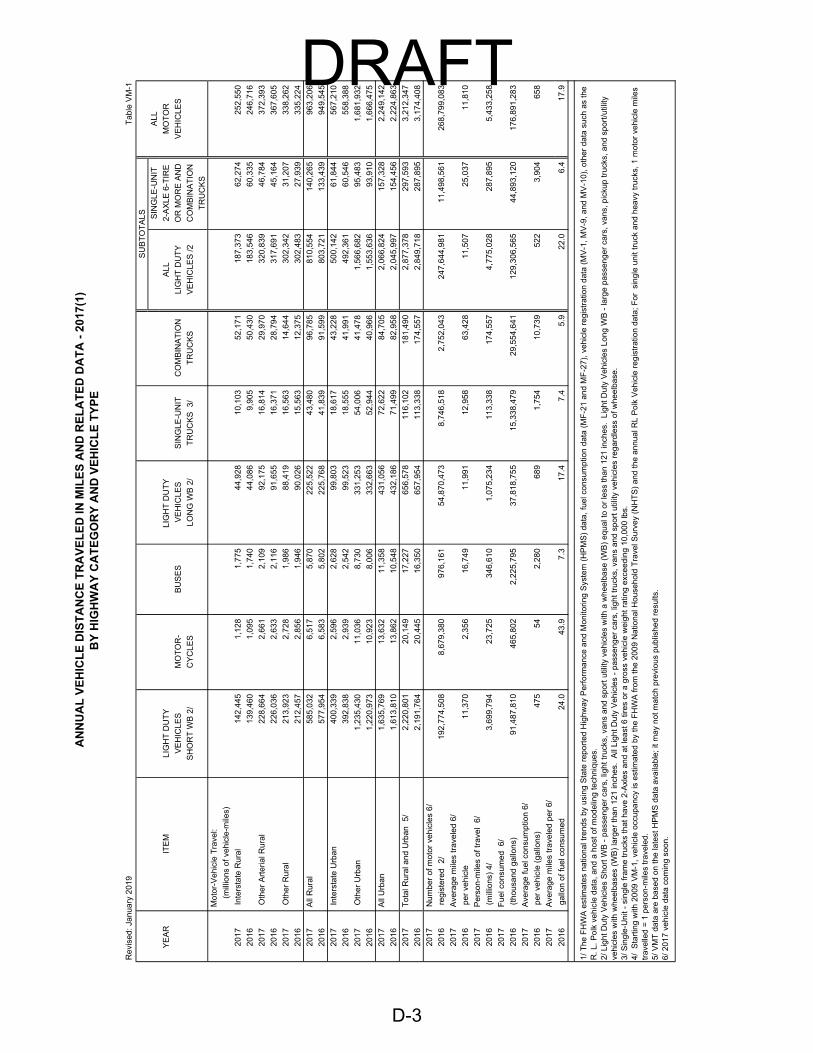
AN
NU
AL
VE
HIC
LE
DIS
TA
NC
E T
RA
VE
LE
D IN
MIL
ES
AN
D R
EL
AT
ED
DA
TA
- 2
017(
1)
BY
HIG
HW
AY
CA
TE
GO
RY
AN
D V
EH
ICL
E T
YP
E
Rev
ised
: Jan
uary
201
9 T
able
VM
-1
D-3
YE
AR
IT
EM
LI
GH
T D
UT
Y
VE
HIC
LES
SH
OR
T W
B 2
/
MO
TO
R-
CY
CLE
S
BU
SE
S
LIG
HT
DU
TY
VE
HIC
LES
LON
G W
B 2
/
SIN
GLE
-UN
IT
TR
UC
KS
3/
CO
MB
INA
TIO
N
TR
UC
KS
SU
BT
OT
ALS
ALL
MO
TO
R
VE
HIC
LES
ALL
LIG
HT
DU
TY
VE
HIC
LES
/2
SIN
GLE
-UN
IT
2-A
XLE
6-T
IRE
OR
MO
RE
AN
D
CO
MB
INA
TIO
N
TR
UC
KS
2017
2016
2017
2016
2017
2016
Mot
or-V
ehic
le T
rave
l:
(m
illio
ns o
f veh
icle
-mile
s)
Inte
rsta
te R
ural
Oth
er A
rter
ial R
ural
Oth
er R
ural
142,
445
139,
460
228,
664
226,
036
213,
923
212,
457
1,12
8
1,09
5
2,66
1
2,63
3
2,72
8
2,85
6
1,77
5
1,74
0
2,10
9
2,11
6
1,98
6
1,94
6
44,9
28
44,0
86
92,1
75
91,6
55
88,4
19
90,0
26
10,1
03
9,90
5
16,8
14
16,3
71
16,5
63
15,5
63
52,1
71
50,4
30
29,9
70
28,7
94
14,6
44
12,3
75
187,
373
183,
546
320,
839
317,
691
302,
342
302,
483
62,2
74
60,3
35
46,7
84
45,1
64
31,2
07
27,9
39
252,
550
246,
716
372,
393
367,
605
338,
262
335,
224
2017
2016
All
Rur
al
585,
032
577,
954
6,51
7
6,58
3
5,87
0
5,80
2
225,
522
225,
768
43,4
80
41,8
39
96,7
85
91,5
99
810,
554
803,
721
140,
265
133,
439
963,
206
949,
545
2017
2016
2017
2016
Inte
rsta
te U
rban
Oth
er U
rban
400,
339
392,
838
1,23
5,43
0
1,22
0,97
3
2,59
6
2,93
9
11,0
36
10,9
23
2,62
8
2,54
2
8,73
0
8,00
6
99,8
03
99,5
23
331,
253
332,
663
18,6
17
18,5
55
54,0
06
52,9
44
43,2
28
41,9
91
41,4
78
40,9
66
500,
142
492,
361
1,56
6,68
2
1,55
3,63
6
61,8
44
60,5
46
95,4
83
93,9
10
567,
210
558,
388
1,68
1,93
2
1,66
6,47
5
2017
2016
All
Urb
an
1,63
5,76
9
1,61
3,81
0
13,6
32
13,8
62
11,3
58
10,5
48
431,
056
432,
186
72,6
22
71,4
99
84,7
05
82,9
58
2,06
6,82
4
2,04
5,99
7
157,
328
154,
456
2,24
9,14
2
2,22
4,86
3
2017
2016
Tot
al R
ural
and
Urb
an
5/
2,22
0,80
1
2,19
1,76
4
20,1
49
20,4
45
17,2
27
16,3
50
656,
578
657,
954
116,
102
113,
338
181,
490
174,
557
2,87
7,37
8
2,84
9,71
8
297,
593
287,
895
3,21
2,34
7
3,17
4,40
8
2017
2016
2017
2016
2017
2016
2017
2016
2017
2016
2017
2016
Num
ber
of m
otor
veh
icle
s 6/
regi
ster
ed
2/
Ave
rage
mile
s tr
avel
ed 6
/
per
vehi
cle
Per
son-
mile
s of
trav
el
6/
(mill
ions
) 4/
Fue
l con
sum
ed
6/
(tho
usan
d ga
llons
)
Ave
rage
fuel
con
sum
ptio
n 6/
per
vehi
cle
(gal
lons
)
Ave
rage
mile
s tr
avel
ed p
er 6
/
gallo
n of
fuel
con
sum
ed
192,
774,
508
11,3
70
3,69
9,79
4
91,4
87,8
10
475
24.0
8,67
9,38
0
2,35
6
23,7
25
465,
802
54
43.9
976,
161
16,7
49
346,
610
2,22
5,79
5
2,28
0
7.3
54,8
70,4
73
11,9
91
1,07
5,23
4
37,8
18,7
55
689
17.4
8,74
6,51
8
12,9
58
113,
338
15,3
38,4
79
1,75
4
7.4
2,75
2,04
3
63,4
28
174,
557
29,5
54,6
41
10,7
39
5.9
247,
644,
981
11,5
07
4,77
5,02
8
129,
306,
565
522
22.0
11,4
98,5
61
25,0
37
287,
895
44,8
93,1
20
3,90
4
6.4
268,
799,
083
11,8
10
5,43
3,25
8
176,
891,
283
658
17.9
1/ T
he F
HW
A e
stim
ates
nat
iona
l tre
nds
by u
sing
Sta
te r
epor
ted
Hig
hway
Per
form
ance
and
Mon
itorin
g S
yste
m (
HP
MS
) da
ta, f
uel c
onsu
mpt
ion
data
(M
F-2
1 an
d M
F-2
7), v
ehic
le r
egis
trat
ion
data
(M
V-1
, MV
-9, a
nd M
V-1
0), o
ther
dat
a su
ch a
s th
e R
. L. P
olk
vehi
cle
data
, and
a h
ost o
f mod
elin
g te
chni
ques
. 2/
Lig
ht D
uty
Veh
icle
s S
hort
WB
- p
asse
nger
car
s, li
ght t
ruck
s, v
ans
and
spor
t util
ity v
ehic
les
with
a w
heel
base
(W
B)
equa
l to
or
less
than
121
inch
es.
Ligh
t Dut
y V
ehic
les
Long
WB
- la
rge
pass
enge
r ca
rs, v
ans,
pic
kup
truc
ks, a
nd s
port
/util
ity
vehi
cles
with
whe
elba
ses
(WB
) la
rger
than
121
inch
es.
All
Ligh
t Dut
y V
ehic
les
- pa
ssen
ger
cars
, lig
ht tr
ucks
, van
s an
d sp
ort u
tility
veh
icle
s re
gard
less
of w
heel
base
. 3/
Sin
gle-
Uni
t - s
ingl
e fr
ame
truc
ks th
at h
ave
2-A
xles
and
at l
east
6 ti
res
or a
gro
ss v
ehic
le w
eigh
t rat
ing
exce
edin
g 10
,000
lbs.
4/
Sta
rtin
g w
ith 2
009
VM
-1, v
ehic
le o
ccup
ancy
is e
stim
ated
by
the
FH
WA
from
the
2009
Nat
iona
l Hou
seho
ld T
rave
l Sur
vey
(NH
TS
) an
d th
e an
nual
RL
Pol
k V
ehic
le r
egis
trat
ion
data
; For
sin
gle
uni
t tru
ck a
nd h
eavy
truc
ks, 1
mot
or v
ehic
le m
iles
trav
elle
d =
1 p
erso
n-m
iles
trav
eled
. 5/
VM
T d
ata
are
base
d on
the
late
st H
PM
S d
ata
avai
labl
e; it
may
not
mat
ch p
revi
ous
publ
ishe
d re
sults
. 6/
201
7 ve
hicl
e da
ta c
omin
g so
on.
DRAFT

DRAFT
Appendix E
Alternative Fee Programs for
Discussion

DRAFTAppendix E
Alternate Fee Schedules
For discussion purposes, mobility fee schedules were developed to reflect replacing the current
rate of road impact fee collections (approximately $3.1 million per year) and which round‐out
an estimated shortfall in 2040 Transportation Plan funding ($7.0 million per year). In addition,
mobility fee rates that would replace loss or re‐allocation of the capacity‐funding portions only
of the LGIST were prepared for consideration by the Board of County Commissioners.
Five alternative “condensed” fee schedules (with potential fees for five representative land
uses only) were provided ‐‐ two for possible adoption and three for informational purposes.
The rural/suburban/core fee district structure, the trip length data, the updated construction
costs, and the current revenue program are incorporated into all of these condensed schedules.
The five schedules are:
1. A fee schedule that is estimated to replace the $3.1 million per year generated by the
current road impact fee. This fee schedule leaves a $6.4 million per year funding
shortfall to accomplish the County’s 2040 Transportation Plan.
2. A fee schedule with higher rates that generates additional revenues to make up the
above shortfall, assuming the LGIST continues to be renewed and its current level of its
commitment to mobility improvements continues.
3. To possibly inform the 2045 long‐range transportation plan update in progress at
MetroPlan Orlando at the time of this study, a fee schedule that funds a reduced rate of
mobility system expansion in the rural district and greater rates of mobility system
expansion in the suburban and core districts, and assume continuance of the LGIST.
4. A fee schedule that replaces the loss of LGIST transportation capital funding portion,
assuming the LGIST expires at the end of 2024.
5. A similar fee schedule that replaces the loss of LGIST transportation capital portion,
assuming the LGIST expires at the end of 2034.
These five condensed fee schedule alternatives are summarized in Table E‐1, which also
includes a summary of the current road impact fee rates for comparative purposes. Following
the Table are five figures that provide additional insight into issues such as the quality of service
provided, the cost per capita, and what proportion of the cost for infrastructure is borne by
growth as opposed to development existing in Seminole County, and how Seminole County’s
road network compares with what could be characterized as “typical” for other similarly‐sized
Florida Counties. Aspects of each fee alternative are discussed in the paragraphs following
Table E‐1.
W.E. Oliver, P.E., and Kittelson and Associates, Inc. Seminole County, Florida April 3, 2020 2020 Mobility Fee Update Study
E-1

DRAFTTable 8‐1: Alternative Mobility Fee Strategies for Consideration
Current Road Impact Fee
North East South/ Central
West
$705 $940 $1,185 $1,271 $471 $628 $792 $849 $1,547 $1,716 $2,164 $2,320 $1,821 $2,429 $3,062 $3,282 $524 $699 $881 $944
Alternative 1
Rural Suburb Core
$4,235 $1,410 $932 $2,754 $866 $532 $2,232 $958 $751 $4,665 $1,947 $1,261 $1,239 $533 $391 10.9% Per LRTP 2044+ Replace current fee
Alternative 2
Rural Suburb Core
$9,492 $3,161 $2,090 $6,172 $1,941 $1,192 $5,003 $2,146 $1,684 $10,454 $4,364 $2,827 $2,777 $1,194 $877 24.3% Per LRTP 2044+ Meet LRTP goal
Single-Family/du: Multi-Family/du:
Office (100-200ksf): Retail (>20,000 sf)/ksf:
Manufacturing/ksf:
% of potential "full fee" Charged: LRTP Performance:
Sales Tax Expiration: Mobility Fee Goal:
Single-Family/du: Multi-Family/du:
Office: Retail (>20,000 sf)/ksf:
Manufacturing/ksf:
% of potential "full fee" Charged: LRTP Performance:
Sales Tax Expiration: Mobility Fee Goal:
Alternative 3 Rural Suburb Core
$16,082 $6,841 $4,663 $9,814 $4,194 $2,744 $7,285 $4,634 $3,819 $14,332 $9,819 $6,754 $4,144 $2,581 $1,962 43.3% Improved 2044+ Meet improved goal
Alternative 4 Rural Suburb Core
$24,318 $8,368 $5,647 $15,781 $5,141 $3,245 $12,768 $5,686 $4,568 $26,696 $11,619 $7,827 $7,089 $3,161 $2,372 60.0% Per LRTP 2024
Meet LRTP goal
Alternative 5 Rural Suburb Core
$16,940 $5,739 $3,836 $11,004 $3,526 $2,197 $8,910 $3,898 $3,098 $18,625 $7,948 $5,258 $4,946 $2,168 $1,611 42.6% Per LRTP 2034
Meet LRTP goal
Alternative 1: “Replace current road fees”
This alternative, summarized in Figure E‐1, provides fee rates associated with a mobility fee
program that is estimated to provide an annual revenue program of $3.1 million per year,
similar to the currently implemented fee program. These rates assume that the LGIST will
continue to be renewed through the 25‐year planning horizon of this study, allowing the fee
collected to be 10.9 percent of the maximum potential fee rate. This assumption is made
because it is not known if the LGIST will lapse, if it would be renewed in its existing allocations,
or if it would be renewed with different funding allocations. The key differences in fee rates
compared to the current fee schedules are the development of the “Rural/Suburban/Core” fee
districts and the incorporation of trip length into the fee rates. The land uses with the most
significantly increased fee rates are those in the rural/east district, where some fees would
increase by factors ranging from 2 to 4.5; however, fees in the Suburb and Core districts would
remain comparable or even be reduced. (Reader may note that the current road impact fee
charges lower rates for what was in 1990 the less densely developed and “outlying” east and
north districts and higher rates for the south/central and west districts, which could be viewed
W.E. Oliver, P.E., and Kittelson and Associates, Inc. Seminole County, Florida April 3, 2020 2020 Mobility Fee Update Study
E-2

Alternative 1: Replace Current Road Fees (assumes Sa
les Tax continues indefinitely)
2018
Art
RN
PM
T:
8,458,314
437,329
3,911,875
3,577,598
G
row
th R
ate:
1.31%
2.18%
1.30%
1.24%
PM
T G
row
th p
er y
ear:
106,066
9,745
51,484
44,838
Cap
acity
Add
ition
Rat
io:
0.771
1.69
0.75
0.59
C
apac
ity A
dditio
n G
oal:
81,755
16,508
38,724
26,523
C
ost p
er P
MC
: $658
$457.20
$638.68
$601.81
Bi
ke/P
ed a
nd O
ther
Nee
ds:
$5,570,500
$0
$3,144,500
$2,426,000
%
Bike
/Ped
& O
ther
Fun
ded:
100.0%
100.0%
100.0%
100.0%
$$ N
eede
d/Ye
ar: $53,812,320
$7,547,564
$27,877,054
$18,387,701
Lane
-Mi/Y
ear:
17.40
5.14
7.00
5.27
Goals and
Nee
ded
Reven
ues
"Needs"
Total
Rural
Suburban
Core
Tota
ls:
$6,3
67,3
42
$41,
043,
599
$47,
410,
941
100%
$95.75
Sh
are
of R
even
ues:
13
.4%
86
.6%
G
oal S
urpl
us/S
hort
fall:
-$
6,40
1,37
9
Potential R
even
ue So
urces
Growth
Base
Total
$$/C
apita
/Yr
2nd
LOG
T:
#/%
to C
apita
l>
0 63
.6%
0%
$0.00
C
ount
y G
as T
axes
: #
Penn
ies>
> 0.
086
$3,6
33
$190
,312
$1
93,9
45
0%
$0.42
St
ate/
Fede
ral G
as T
ax:
# Pe
nnie
s/G
al>>
10
.989
$2
,519
,389
$2
2,39
0,08
7 $2
4,90
9,47
7 53
%
$53.83
In
frast
ruct
ure
Sale
s Ta
x:
End/
BCC
Sha
re to
Cap
>:
2045
32
.5%
$7
44,3
20
$18,
463,
200
$19,
207,
520
41%
$41.51
Mob
ility
Fees
: %
of f
ull f
ee:
10.9
%
$3,1
00,0
00
$0
$3,1
00,0
00
7%
Ince
ntiv
es B
udge
t Che
ck:
Nee
d:
$0
Met
DRAFT
Mobility Fee
s
Rural
Suburban
Core
Single‐Family/d
u:
$4,23
5 $1
,410
$932
Multi‐Family/du:
$2,754
$866
$532
Office/ksf:
$2,232
$958
$751
Retail (>20,000 sf)/ksf:
$4,665
$1,947
$1,261
Industrial/ksf:
$1,239
$533
$391
Notes:
1. This
analysis is
based on estim
ates of n
on‐Toll and non‐Interstate
(e.g. "surface" arterial and
collector)
travel and costs.
It includes the capital portion of transit c
osts for a 277 percent growth
in service, focused
in
the Core
and Suburban
areas.
2. This scenario approximates Seminole County's 2040 LRTP including its Tiers
1‐3
funding,
with some
differences.
The costs of transportation
improvements
are greater than those of the LR
TP because
they are
based on actual recent experience, w
hereas the LR
TP co
sts are
based on
FDOT "co
st per mile" estim
ates which
underestim
ate
frequently enco
untered additional costs.
The LR
TP rate
of c
apacity
add
ition is
represented by
the CAR
values of 1.69, 0.75, and
0.59 in the rural, suburban, and
core
areas,
respectively.
3. Mobility
fee rates are
based on the proposed "Core/Suburbs/Rural"
fee district structure, w
ith
fees adjusted
to replace
the current a
nnual road im
pact
fee co
llection rate
of $3
.1 m
illion per year.
4. The LGIST is assumed to continue indefinitely, at it's current a
llocation percentage
to
expansion of the
mobility system.
Netw
ork Perform
ance
0.40
0.45
0.50
0.55
0.60
0.65
0.70
0.75
2016
20
18
2020
20
22
2024
20
26
2028
20
30
2032
20
34
2036
20
38
2040
20
42
2044
VMT:VMC Rat i o
Year
VMT:VMC Ratio
by Year
Arterial R
oads
Florida Tren
dline
' I I I
'
'
I I I I I I I I I I I
l I I I I I I I I I I I I I I I I I I I I I I I I I I I
Figure 8‐1: Alternative 1 Mobility Fee
W.E. Oliver, P.E., and Kittelson and Associates, Inc. Seminole County, Florida April 3, 2020 2020 Mobility Fee Update Study
E-3

DRAFTas “encouraging urban sprawl”. This proposed mobility fee strategy recognizes and promotes a
more dense development pattern and greater reliance on non‐auto modes of travel by providing
its lowest fees in the Core district.)
In this fee alternative, revenues fall $6.4 million per year short of 2040 Transportation Plan
goals, due to increased costs. In this scenario, growth would pay for 13.4 percent of the capital
costs, and the cost per capita would be approximately $95.75/year.
Alternative 2: Make up 2040 Transportation Plan Funding Shortfall Since the Alternative 1 fee schedule falls $6.4 million annually short of the funding needed to implement
the 2040 LRTP, this second fee alternative, illustrated in Figure E‐2, makes up that difference –
essentially increasing mobility fee revenues from $3.1 million to $9.5 million annually. The fee rates for
residential development increase 2.2‐fold compared to Alternative 1, but remain slightly lower to
comparable to fees in neighboring jurisdictions. The fee rates are 24.3 percent of the maximum fee
rates that could be assessed. Since revenues for mobility system expansion are increased, the
projection of the VMT:VMC ratio by 2044 improves slightly, from 0.73 in Alternative 1 to 0.71 in
Alternative 2. In this scenario, growth would pay for 23.7 percent of the capital costs.
Alternative 3: Modify 2040 Plan Performance, Renew Sales Tax through 2044
This study provided an opportunity to reconsider the long‐term mobility strategies and quality
of service goals for Seminole County. This fee schedule alternative is not recommended for
adoption at this time because the County’s adopted transportation plan does not provide for
the quality of service improvements that would be associated with the increased funding level
of this scenario. However, MetroPlan Orlando is initiating an update to its transportation plan,
and if the County wishes to consider improvements to quality of service, this fee alternative
provides some insights into the increased mobility fees that might fund such a decision and the
MetroPlan Orlando planning process could explore specific improvements to deliver the
improved quality of service.
In this example, illustrated in Figure E‐3, the County may decide that adding capacity in the
rural district at a rate of 1.69 times the anticipated growth in travel is excessive or that a better
quality of service is desired in the suburban and core districts than is provided by the respective
CAR’s of 0.75 and 0.59. It may decide that a more aggressive bus transit program is desired in
the Core district than is provided by the current financial program. If a financial strategy that
provides for a better quality of service than is provided by the current 2040 Transportation Plan
is desired then, before that revenue program is adopted, the on‐going transportation planning
process should investigate and develop more specific infrastructure elements of such a plan.
W.E. Oliver, P.E., and Kittelson and Associates, Inc. Seminole County, Florida April 3, 2020 2020 Mobility Fee Update Study
E-4
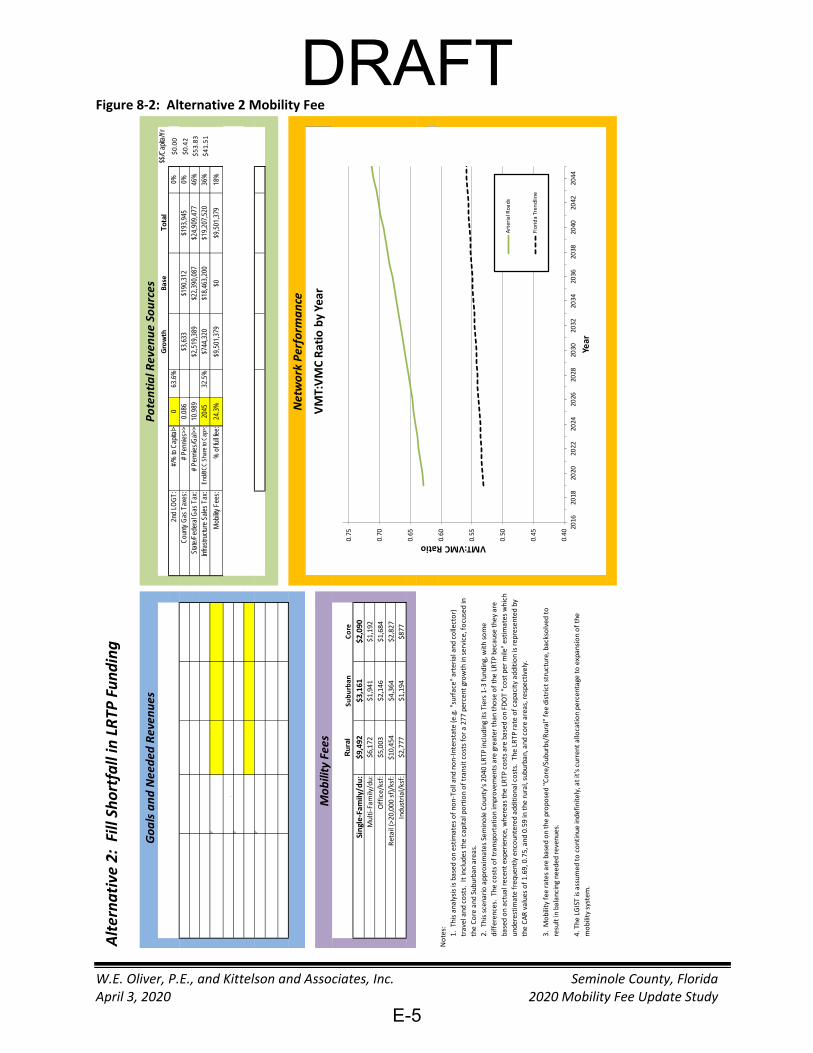
Alternative
2: Fill Shortfall in LRTP
Funding
DRAFTFigure 8‐2: Alternative 2 Mobility Fee
W.E. Oliver, P.E., and Kittelson and Associates, Inc. Seminole County, Florida April 3, 2020 2020 Mobility Fee Update Study
2018
Art
RN
PM
T:
8,458,314
437,329
3,911,875
3,577,598
G
row
th R
ate:
1.31%
2.18%
1.30%
1.24%
PM
T G
row
th p
er y
ear:
106,066
9,745
51,484
44,838
Cap
acity
Add
ition
Rat
io:
0.771
1.69
0.75
0.59
C
apac
ity A
dditio
n G
oal:
81,755
16,508
38,724
26,523
C
ost p
er P
MC
: $658
$457.20
$638.68
$601.81
Bi
ke/P
ed a
nd O
ther
Nee
ds:
$5,570,500
$0
$3,144,500
$2,426,000
%
Bike
/Ped
& O
ther
Fun
ded:
100.0%
100.0%
100.0%
100.0%
$$ N
eede
d/Ye
ar: $53,812,320
$7,547,564
$27,877,054
$18,387,701
Lane
-Mi/Y
ear:
17.40
5.14
7.00
5.27
Goals and
Nee
ded
Reven
ues
"Needs"
Total
Rural
Suburban
Core
Tota
ls:
$12,
768,
721
$41,
043,
599
$53,
812,
320
100%
$95.75
Sh
are
of R
even
ues:
23
.7%
76
.3%
G
oal S
urpl
us/S
hort
fall:
$0
Potential R
even
ue So
urces
Growth
Base
Total
$$/C
apita
/Yr
2nd
LOG
T:
#/%
to C
apita
l>
0 63
.6%
0%
$0.00
C
ount
y G
as T
axes
: #
Penn
ies>
> 0.
086
$3,6
33
$190
,312
$1
93,9
45
0%
$0.42
St
ate/
Fede
ral G
as T
ax:
# Pe
nnie
s/G
al>>
10
.989
$2
,519
,389
$2
2,39
0,08
7 $2
4,90
9,47
7 46
%
$53.83
In
frast
ruct
ure
Sale
s Ta
x:
End/
BCC
Sha
re to
Cap
>:
2045
32
.5%
$7
44,3
20
$18,
463,
200
$19,
207,
520
36%
$41.51
Mob
ility
Fees
: %
of f
ull f
ee:
24.3
%
$9,5
01,3
79
$0
$9,5
01,3
79
18%
Ince
ntiv
es B
udge
t Che
ck:
Nee
d:
$0
Met
Mobility
Fees
Rural
Suburban
Core
Single‐Family/d
u:
$9,492
$3
,161
$2
,090
Multi‐Family/du:
$6,172
$1,941
$1,192
Office/ksf:
$5,003
$2,146
$1,684
Retail (>20,000 sf)/ksf:
$10,454
$4,364
$2,827
Industrial/ksf:
$2,777
$1,194
$877
Notes:
1.
This
analysis is based on
estim
ates of non‐Toll and
non‐Interstate
(e.g. "surface" arterial and
collector)
travel and costs.
It includes the capital portion of tran
sit c
osts for a 277
percent growth in
service, focused in
the Core
and Suburban areas.
2. This scenario
approximates Seminole
County's 2040 LRTP including its Tiers
1‐3
funding,
with some
differences.
The co
sts of transportation im
provements
are
greater than those of the LR
TP because they are
based on actual recent e
xperience, w
hereas the LR
TP co
sts are
based
on
FDOT "co
st per mile" estim
ates which
underestim
ate
frequently enco
untered additional costs.
The LR
TP rate
of c
apacity
addition is
represented by
the CAR
values of 1
.69, 0.75, and 0.59 in
the rural, suburban, and
core
areas,
respectively.
3. Mobility
fee rates are
based on
the proposed "Core/Suburbs/Rural" fee district structure, backsolved
to
result
in balancing needed
revenues.
4. T
he LGIST is assumed
to continue indefinitely,
at it's current a
llocation percentage
to
expansion of the
mobility
system.
Network
Perform
ance
0.40
0.45
0.50
0.55
0.60
0.65
0.70
0.75
2016
20
18
2020
20
22
2024
20
26
2028
20
30
2032
20
34
2036
20
38
2040
20
42
2044
VMT:V MC Rati o
Year
VMT:VMC
Ratio
by Year
Arterial R
oads
Florida Tren
dline
i I I I I I I I I I
I I I I I I I I I I I I I I I I I I I I I I I I I I I I
E-5

Alternative
3: Adjust
network perform
ance
goals, e
xten
d sales tax to 12/31/20
44,
increase m
obility fee to balance
nee
ded
rev
enue
2018
Art
RN
PM
T:
8,458,314
437,329
3,911,875
3,577,598
G
row
th R
ate:
1.31%
2.18%
1.30%
1.24%
PM
T G
row
th p
er y
ear:
106,066
9,745
51,484
44,838
Cap
acity
Add
ition
Rat
io:
0.893
1.25
0.95
0.75
C
apac
ity A
dditio
n G
oal:
94,719
12,181
48,909
33,629
C
ost p
er P
MC
: $661
$457.20
$638.68
$601.81
Bi
ke/P
ed a
nd O
ther
Nee
ds:
$5,570,500
$0
$3,144,500
$2,426,000
%
Bike
/Ped
& O
ther
Fun
ded:
100.0%
100.0%
100.0%
100.0%
$$ N
eede
d/Ye
ar: $62,615,102
$5,569,033
$34,381,996
$22,664,073
Lane
-M i/Y
ear:
19.31
3.79
8.84
6.68
Goals and
Nee
ded
Reven
ues
"Needs"
Total
Rural
Suburban
Core
Tota
ls:
$21,
571,
503
$41,
043,
599
$62,
615,
102
100%
$95.75
Sh
are
of R
even
ues:
34
.5%
65
.5%
G
oal S
urpl
us/S
hort
fall:
$0
Potential R
even
ue So
urces
Growth
Base
Total
$$/C
apita
/Yr
2nd
LOG
T:
#/%
to C
apita
l>
0 63
.6%
0%
$0.00
C
ount
y G
as T
axes
: #
Penn
ies>
> 0.
086
$3,6
33
$190
,312
$1
93,9
45
0%
$0.42
St
ate/
Fede
ral G
as T
ax:
# Pe
nnie
s/G
al>>
10
.989
$2
,519
,389
$2
2,39
0,08
7 $2
4,90
9,47
7 40
%
$53.83
In
frast
ruct
ure
Sale
s Ta
x:
End/
BCC
Sha
re to
Cap
>:
2045
32
.5%
$7
44,3
20
$18,
463,
200
$19,
207,
520
31%
$41.51
Mob
ility
Fees
: %
of f
ull f
ee:
43.3
%
$18,
304,
161
$0
$18,
304,
161
29%
Ince
ntiv
es B
udge
t Che
ck:
Nee
d:
$0
Met
DRAFT
Mobility
Fees
Rural
Suburban
Core
Single‐Family/d
u:
$16,082
$6
,841
$4
,663
Multi‐Family/du:
$9,814
$4,194
$2,744
Office/ksf:
$7,285
$4,634
$3,819
Retail (>20,000 sf)/ksf:
$14,332
$9,819
$6,754
Industrial/ksf:
$4,144
$2,581
$1,962
Notes:
1. This
analysis is
based on estim
ates of n
on‐Toll and non‐Interstate
(e.g. "surface" arterial and
collector)
travel and
costs.
It includes the capital portion
of transit co
sts for a 277 percent growth
in service, focused
in
the Core
and Suburban areas.
2. This scenario alters Seminole
County's 204
0 County LRTP and its Tiers
1‐3
revenue program. In addition to
the co
sts of roadway being greater than those
of the LR
TP, the 2040 LRTP rate
of capacity
addtion
has reduced
in the rural, and increased in the suburban and core
areas,
resulting in better levels
of service. Since
quality of
service delivered
is better,
and because m
ore growth in
travel is forecasted in the suburban and core
areas,
the
total revenue nee
ds are greater than
in previous scenarios.
3. Mobility
fee rates are
based on the proposed "Core/Suburbs/Rural"
fee district structure, backsolved
to
result in
balancing needed
revenues.
4. The LGIST is assumed
to continue indefinitely, at it's current a
llocation percentage
to
expansion of the
mobility system.
Netw
ork Perform
ance
0.40
0.45
0.50
0.55
0.60
0.65
0.70
0.75
2016
20
18
2020
20
22
2024
20
26
2028
20
30
2032
20
34
2036
20
38
2040
20
42
2044
VMT:V MC Rati o
Year
VMT:VMC Ratio
by Year
Arterial R
oads
Florida Tren
dline
~
I
-
-
J
i I I I I I I I I I
I I I I I I I I I I I I I I I I I I I I I I I I I I I
Figure 8‐3: Alternative 3 Mobility Fee
W.E. Oliver, P.E., and Kittelson and Associates, Inc. Seminole County, Florida April 3, 2020 2020 Mobility Fee Update Study
E-6
DRAFTThis example alternative fee schedule adjusts the quality of service goals in the rural, suburban,
and core fee districts. As discussed in Section 3 of this report, the adopted 2040 Transportation
Plan adds, on a county‐wide average basis, 0.77 person‐miles of capacity per person‐mile of
growth in travel. Over the long‐term, this rate of funding indicates that the mobility system, on
average, will be (1/0.77 – 1 =) 30 percent overloaded. Since this is an average, some locations
will be less than 30 percent overloaded while other locations will be more than 30 percent
overloaded. Considering that the current average level of system loading is estimated to be
0.64 county‐wide, this represents a substantially more congested system than exists today –
and a level of congestion for which there is no precedent in Florida. (Note, however, that
Seminole County is not alone in this condition—most other Florida urban areas are in a similar
situation.)
This alternative 3:
lowers the capacity addition ratio of the rural district from 1.69 to 1.25, allowing
congestion levels to increase but still maintains a good level of service,
increases the capacity addition ratios for the suburban and core districts from 0.75 to
0.95 and from 0.59 to 0.75, respectively. These changes provide funding for additional
road corridors to be developed (serving transit and bicycles as well as cars) and arterials
to be widened. The long‐term goal of roads in the suburban and core fee districts would
be on average 105 percent full and 133% full (most roads will still be congested, but
overall better quality of service will be provided than the current funding program
provides),
on a county‐wide average basis (e.g. including rural, suburb, and core) results in a long‐
term condition of (1/0.893 – 1 =) 12 percent overloaded, and
assumes the LGIST will continue to be renewed through 2044.
These higher capacity addition ratios result in the need for an increase in needed annual
revenue rate from $53.8 to $62.6 million per year (an increase of $8.8 million per year in 2020),
continuing through 2044. Mobility fee rates would be charged at 43.3 percent of the potential
maximum fee. Growth would pay an estimated 34.5 percent of the capital costs, and since
revenues for mobility system expansion are increased, the projection of the VMT:VMC ratio by
2044 improves from 0.73 in Alternative 1 to 0.69 in Alternative 3. Note, also, that by accepting
greater congestion in the rural district, and pursuing less congestion in the suburban and core
districts reduces the differential between the rural, suburban, and core fee rates.
Alternative 4: Lapse of LGIST in 2024
This alternative, illustrated in Figure E‐4, was developed for informational purposes, to provide
insight to the mobility fee rates which might be needed to replace capital revenues lost if the
W.E. Oliver, P.E., and Kittelson and Associates, Inc. Seminole County, Florida April 3, 2020 2020 Mobility Fee Update Study
E-7

Alternative 4: Sa
les Ta
x ends 12/31/2024, increase
mobility fee to balance needed
revenue (replaces capital
portion of LG
IST only)
Goals and
Nee
ded
Reven
ues
"Needs"
Total
Rural
Suburban
Core
20
18 A
rt R
N P
MT:
8,458,314
437,329
3,911,875
3,577,598
G
row
th R
ate:
1.31%
2.18%
1.30%
1.24%
PM
T G
row
th p
er y
ear:
106,066
9,745
51,484
44,838
Cap
acity
Add
ition
Rat
io:
0.771
1.69
0.75
0.59
C
apac
ity A
dditio
n G
oal:
81,755
16,508
38,724
26,523
C
ost p
er P
MC
: $658
$457.20
$638
.68
$601.81
Bi
ke/P
ed a
nd O
ther
Nee
ds:
$5,570,500
$0
$3,144
,500
$2,426,000
%
Bike
/Ped
& O
ther
Fun
ded:
100.0%
100.0%
100.0%
100.0%
$$ N
eede
d/Ye
ar: $53,812,320
$7,547,564
$27,877,054
$18,387,701
Lane
-Mi/Y
ear:
17.40
5.14
7.00
5.27
DRAFT
Mobility
Fees
Rural
Suburban
Core
Single‐Fam
ily/d
u:
$24
,318
$8,368
$5,64
7 Multi‐Family/du:
$15,78
1 $5
,141
$3
,245
Office/ksf:
$12,768
$5,686
$4,568
Retail (>20,000 sf)/ksf:
$26,696
$11,619
$7,827
Industrial/ksf:
$7,089
$3,161
$2,372
Notes:
1. This
analysis is
based on estim
ates of n
on‐Toll and non‐Interstate
(e.g. "surface" arterial and
collector)
travel and costs. It
includes the capital portion of transit co
sts for a 27
7 percent growth in service, focused in
the Core
and Suburban areas.
2.
This scenario
approximates Seminole County's 20
40 LRTP
including its Tiers
1‐3
funding, with
some
differences.
The co
sts of transportation im
provements are greater
than
those
of the LR
TP
because they are
based on actual recent experience, w
hereas the LRTP
costs are based on
FDOT "co
st per m
ile" estim
ates which
underestim
ate
frequently enco
untered additional costs.
The LR
TP
rate of capacity addition
is represented by
the CAR
values of 1
.69, 0.75, and 0.59 in
the rural, suburban, and
core
areas,
respectively.
3. Mobility
fee rates are
based on the proposed "Core/Suburbs/Rural"
fee district structure, backsolved
to
result in
balancing needed revenues.
4. The sales tax revenue program
is assumed
to expire at the end
of 2024. Th
e actual fee collections in
2020
, 2021, 2022, 2023, and
2024 will be slightly grea
ter than the amount reported above, since
the above
number
represents
the sales tax revenues co
llected in 202
0‐202
4, distributed/annualized from
2020 to
2044.
Potential R
even
ue So
urces
Growth
Base
Total
$$/C
apita
/Yr
2nd
LOG
T:
#/%
to C
apita
l>
0 63
.6%
0%
$0.00
C
ount
y G
as T
axes
: #
Penn
ies>
> 0.
086
$3,6
33
$190
,312
$1
93,9
45
0%
$0.42
St
ate/
Fede
ral G
as T
ax:
# Pe
nnie
s/G
al>>
10
.989
$2
,519
,389
$2
2,39
0,08
7 $2
4,90
9,47
7 46
%
$53.83
In
frast
ruct
ure
Sale
s Ta
x:
End/
BCC
Sha
re to
Cap
>:
2024
32
.5%
$5
7,58
2 $3
,818
,555
$3
,876
,137
7%
$8.38
Mob
ility
Fees
: %
of f
ull f
ee:
60.0
%
$24,
832,
761
$0
$24,
832,
761
46%
Tota
ls:
$27,
413,
365
$26,
398,
954
$53,
812,
320
100%
$62.62
Sh
are
of R
even
ues:
50
.9%
49
.1%
G
oal S
urpl
us/S
hort
fall:
$0
Ince
ntiv
es B
udge
t Che
ck:
Nee
d:
$0
Met
Netw
ork
Perform
ance
0.40
0.45
0.50
0.55
0.60
0.65
0.70
0.75
2016
20
18
2020
20
22
2024
20
26
2028
20
30
2032
20
34
2036
20
38
2040
20
42
2044
VMT:VMC Ratio
Year
VMT:VMC
Ratio
by Year
Arterial R
oad
s
Florida Trendlin
e
I I
I I I I
i I
' l I I I I I I I
' I
I
Figure 8‐4: Alternative 4 Mobility Fee
W.E. Oliver, P.E., and Kittelson and Associates, Inc. Seminole County, Florida April 3, 2020 2020 Mobility Fee Update Study
E-8
DRAFTLGIST, scheduled to expire in 2024, is not renewed, or if the capital portion of LGIST revenues
are allocated to non‐capital activities. The quality of service provisions of this alternative are
those of the current adopted 2040 transportation plan and associated annual funding level of
$53.8 million. In this alternative, fees are assessed at 60.0 percent of the maximum potential
fee rate. While this fee alternative is a substantial increase from current fee levels, the rates in
the suburban and core districts remain comparable to rates charged in Osceola County, but the
rural district rate is higher. All rates are higher than Orange County is currently assessing.
(Note that a fee study is in progress in Orange County.). In this alternative, the proportion of
capital costs funded by new development would increase to 50.9 percent.
Alternative 5: Assumes LGIST expires in 2034
This alternative, illustrated in Figure E‐5, is effectively an intermediate alternative between
Alternative 2 and Alternative 4. It assumes the LGIST is renewed for only one ten‐year
extension, expiring in 2034, with the same 44 percent allocation of the County portion to
mobility system expansion. To match adopted 2040 Transportation Plan revenue needs, fees
are assessed at 42.6 percent of the maximum potential fee rate – almost four times the
Alternative 1 fee rates. The fee rates in the core and suburban districts would remain lower
(Osceola) or on a par with (Orange) fees charged in neighboring counties, but the rural fees
would still be greater than even Osceola County’s. Growth would pay an estimated 37.1
percent of the capital costs.
W.E. Oliver, P.E., and Kittelson and Associates, Inc. Seminole County, Florida April 3, 2020 2020 Mobility Fee Update Study
E-9

Alternative 5: Sales Tax ends 12
/31/2034, in
crea
se m
obility fee to balance need
ed revenue (replaces capital
portion of LG
IST only).
Goals and
Nee
ded
Reven
ues
"Needs"
Total
Rural
Suburban
Core
20
18 A
rt R
N P
MT:
8,458,314
437,329
3,911,875
3,577,598
G
row
th R
ate:
1.31%
2.18%
1.30%
1.24%
PM
T G
row
th p
er y
ear:
106,066
9,745
51,484
44,838
Cap
acity
Add
ition
Rat
io:
0.771
1.69
0.75
0.59
C
apac
ity A
dditio
n G
oal:
81,755
16,508
38,724
26,523
C
ost p
er P
MC
: $658
$457.20
$638.68
$601.81
Bi
ke/P
ed a
nd O
ther
Nee
ds:
$5,570,500
$0
$3,144,500
$2,426,000
%
Bike
/Ped
& O
ther
Fun
ded:
100.0%
100.0%
100.0%
100.0%
$$ N
eede
d/Ye
ar: $53,812,320
$7,547,564
$27,877,054
$18,387,701
Lane
-Mi/Y
ear:
17.40
5.14
7.00
5.27
DRAFT
Mobility Fee
s
Rural
Suburban
Core
Single‐Family/d
u:
$16,940
$5
,739
$3,836
Multi‐Family/du:
$11,004
$3,526
$2,197
Office/ksf:
$8,910
$3,898
$3,098
Retail (>20,000 sf)/ksf:
$18,625
$7,948
$5,258
Industrial/ksf:
$4,946
$2,168
$1,611
Notes:
1. This
analysis is
based on estim
ates of n
on‐Toll and non‐Interstate
(e.g. "surface" arterial and
collector)
travel and costs.
It includes the capital portion of transit c
osts for a 277 percent growth in
service, focused
in
the Core
and
Suburban
areas.
2. This scenario approximates Seminole County's 2040 LRTP including its Tiers
1‐3 funding,
with
some
differences.
The costs of transportation
improvements
are greater than those of the LR
TP
because
they are
based on actual recent experien
ce, w
hereas the LR
TP co
sts are
based on
FDOT "co
st per mile" estim
ates which
underestim
ate
frequently enco
untered additional costs.
The LR
TP rate
of c
apacity
addition is
represented by
the CAR
values of 1.69, 0.75, and
0.59 in the rural, suburban, and
core
areas,
respectively.
3. Mobility
fee rates are
based on the proposed "Core/Suburbs/Rural"
fee district structure, backsolved
to
result
in balancing needed
revenues.
4. The sales tax revenue program
is set to expire at the end of 20
34. The actual collections in
202
0, 202
1,
2022, 2023, and
2024 will actually
be greater than the amount
reported above, since
the above
number
represents the sales tax revenues co
llected in 2020‐2024, distributed/annualized from
2020 to 2044.
Potential R
even
ue So
urces
Growth
Base
Total
$$/C
apita
/Yr
2nd
LOG
T:
#/%
to C
apita
l>
0 63
.6%
0%
$0.00
C
ount
y G
as T
axes
: #
Penn
ies>
> 0.
086
$3,6
33
$190
,312
$1
93,9
45
0%
$0.42
St
ate/
Fede
ral G
as T
ax:
# Pe
nnie
s/G
al>>
10
.989
$2
,519
,389
$2
2,39
0,08
7 $2
4,90
9,47
7 46
%
$53.83
In
frast
ruct
ure
Sale
s Ta
x:
End/
BCC
Sha
re to
Cap
>:
2034
32
.5%
$3
08,5
83
$11,
264,
673
$11,
573,
256
22%
$25.01
Mob
ility
Fees
: %
of f
ull f
ee:
42.6
%
$17,
135,
642
$0
$17,
135,
642
32%
Tota
ls:
$19,
967,
248
$33,
845,
072
$53,
812,
320
100%
$79.26
Sh
are
of R
even
ues:
37
.1%
62
.9%
G
oal S
urpl
us/S
hort
fall:
$0
Ince
ntiv
es B
udge
t Che
ck:
Nee
d:
$0
Met
Netw
ork Perform
ance
0.40
0.45
0.50
0.55
0.60
0.65
0.70
0.75
2016
20
18
2020
20
22
2024
20
26
2028
20
30
2032
20
34
2036
20
38
2040
20
42
2044
VMT:V MC Rati o
Year
VMT:VMC
Ratio
by Year
Arterial R
oads
Florida Tren
dline
~
-
I I
-
-
I J
i I I I I I I I I I
I I I I I I I I I I I I I I I I I I I I I I I I I I I
Figure 8‐5: Alternative 5 Mobility Fee
W.E. Oliver, P.E., and Kittelson and Associates, Inc. Seminole County, Florida April 3, 2020 2020 Mobility Fee Update Study
E-10
DRAFT
Appendix F
Full Fee Schedules
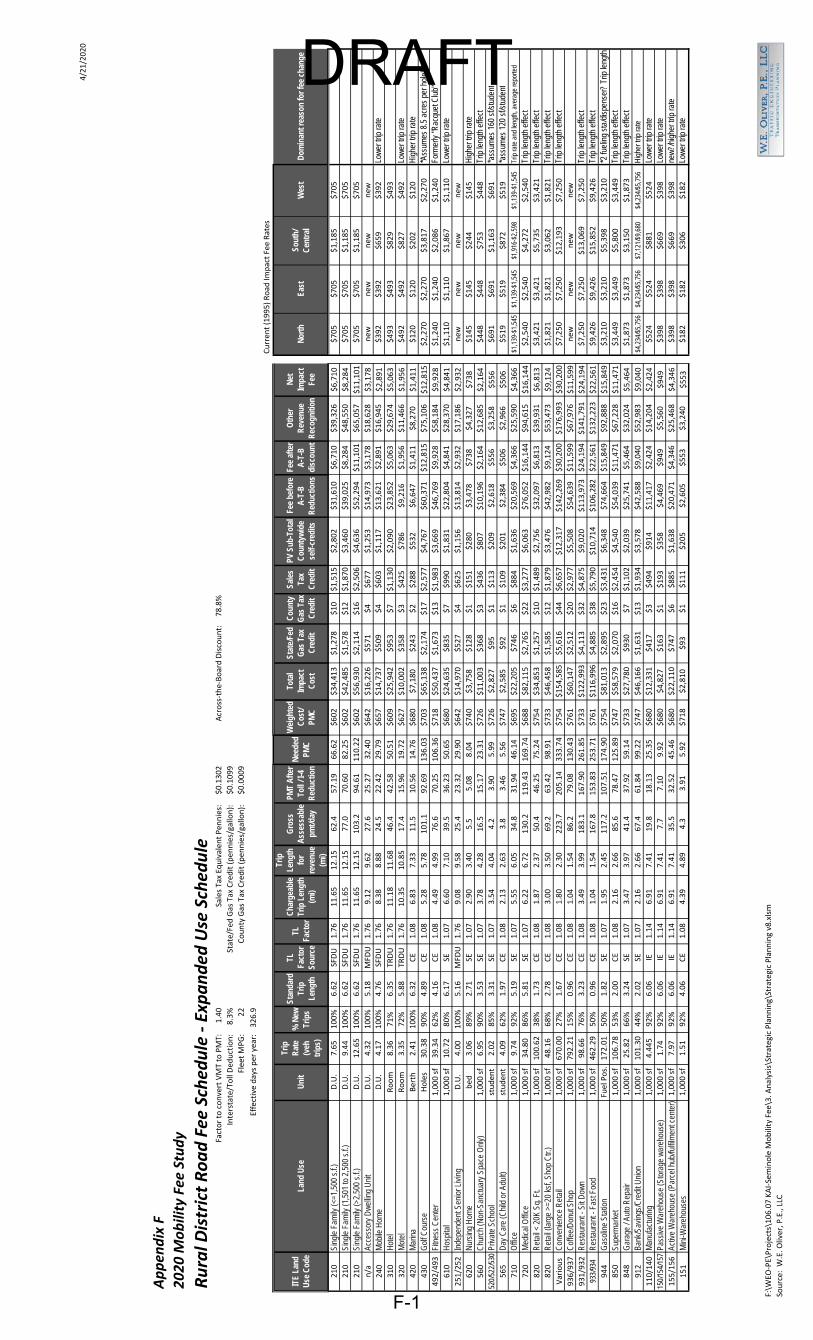
4/21/2020
Appen
dix F
2020 M
obility Fee
Study
Rural D
istrict Road Fee
Sched
ule ‐ Exp
anded
Use Sched
ule
Factor to convert VMT to PMT:
1.40
Sales Tax Eq
uivalen
t Pen
nies:
$0.1302
Across‐the‐Board Discount:
78.8%
Interstate/Toll Ded
uction:
8.3%
State/Fed Gas Tax Credit (pen
nies/gallo
n):
$0.1099
Flee
t MPG:
22
County Gas Tax Credit (pen
nies/gallo
n):
$0.0009
Effective days per yea
r: 326.9
Curren
t (1995) Road
Impact Fee Rates
F-1
ITE
Land
U
se C
ode
Land
Use
U
nit
Trip
R
ate
(veh
tr
ips)
% N
ew
Trip
s
Stan
dard
Tr
ip
Leng
th
TL
Fact
or
Sour
ce
TL
Fact
or C
harg
eabl
e Tr
ip L
engt
h (m
i)
Trip
Le
ngth
fo
r re
venu
e (m
i)
Gro
ss
Ass
essa
ble
pmt/d
ay
PMT
Afte
r To
ll / I
-4
Red
uctio
n
Nee
ded
PMC
Wei
ghte
d C
ost/
PMC
Tota
l Im
pact
C
ost
Stat
e/Fe
d G
as T
ax
Cre
dit
Cou
nty
Gas
Tax
C
redi
t
Sale
s Ta
x C
redi
t
PV S
ub-T
otal
C
ount
ywid
e se
lf-cr
edits
Fee
befo
re
A-T
-B
Red
uctio
ns Fe
e af
ter
A-T
-B
disc
ount
Oth
er
Rev
enue
R
ecog
nitio
n
Net
Im
pact
Fe
e
210
Si
ngle
Fam
ily (<
=1,5
00 s
.f.)
D.U.
7.65
100%
6.62
SFDU
1.76
11.65
12.15
62.4
57.19
66.62
$602
$34,413
$1,278
$10
$1,515
$2,802
$31,610
$6,710
$39,326
$6,710
210
Si
ngle
Fam
ily (1
,501
to 2
,500
s.f.
) D.U.
9.44
100%
6.62
SFDU
1.76
11.65
12.15
77.0
70.60
82.25
$602
$42,485
$1,578
$12
$1,870
$3,460
$39,025
$8,284
$48,550
$8,284
210
Si
ngle
Fam
ily (>
2,50
0 s.
f.)
D.U.
12.65
100%
6.62
SFDU
1.76
11.65
12.15
103.2
94.61
110.22
$602
$56,930
$2,114
$16
$2,506
$4,636
$52,294
$11,101
$65,057
$11,101
n/a
Ac
cess
ory
Dw
ellin
g U
nit
D.U.
4.32
100%
5.18
MFD
U 1.76
9.12
9.62
27.6
25.27
32.40
$642
$16,226
$571
$4
$677
$1,253
$14,973
$3,178
$18,628
$3,178
240
M
obile
Hom
e D.U.
4.17
100%
4.76
SFDU
1.76
8.38
8.88
24.5
22.42
29.79
$657
$14,737
$509
$4
$603
$1,117
$13,621
$2,891
$16,945
$2,891
310
H
otel
Room
8.36
71%
6.35
TR
DU
1.76
11.18
11.68
46.4
42.58
50.51
$609
$25,942
$953
$7
$1,130
$2,090
$23,852
$5,063
$29,674
$5,063
320
M
otel
Room
3.35
72%
5.88
TR
DU
1.76
10.35
10.85
17.4
15.96
19.72
$627
$10,002
$358
$3
$425
$786
$9,216
$1,956
$11,466
$1,956
420
M
arin
a Berth
2.41
100%
6.32
CE
1.08
6.83
7.33
11.5
10.56
14.76
$680
$7,180
$243
$2
$288
$532
$6,647
$1,411
$8,270
$1,411
430
G
olf C
ours
e Holes
30.38
90%
4.89
CE
1.08
5.28
5.78
101.1
92.69
136.03
$703
$65,138
$2,174
$17
$2,577
$4,767
$60,371
$12,815
$75,106
$12,815
492/493
Fi
tnes
s C
ente
r 1,000 sf
39.34
62%
4.16
CE
1.08
4.49
4.99
76.6
70.25
106.36
$718
$50,437
$1,673
$13
$1,983
$3,669
$46,769
$9,928
$58,184
$9,928
610
H
ospi
tal
1,000 sf
10.72
80%
6.17
SE
1.07
6.60
7.10
39.5
36.23
50.65
$680
$24,635
$835
$7
$990
$1,831
$22,804
$4,841
$28,370
$4,841
251/252
In
depe
nden
t Sen
ior L
ivin
g D.U.
4.00
100%
5.16
MFD
U 1.76
9.08
9.58
25.4
23.32
29.90
$642
$14,970
$527
$4
$625
$1,156
$13,814
$2,932
$17,186
$2,932
620
N
ursi
ng H
ome
bed
3.06
89%
2.71
SE
1.07
2.90
3.40
5.5
5.08
8.04
$740
$3,758
$128
$1
$151
$280
$3,478
$738
$4,327
$738
560
C
hurc
h (N
on-S
anct
uary
Spa
ce O
nly)
1,000 sf
6.95
90%
3.53
SE
1.07
3.78
4.28
16.5
15.17
23.31
$726
$11,003
$368
$3
$436
$807
$10,196
$2,164
$12,685
$2,164
52
0/52
2/53
0 Pr
ivat
e Sc
hool
studen
t 2.02
85%
3.31
SE
1.07
3.54
4.04
4.2
3.90
5.99
$726
$2,827
$95
$1
$113
$209
$2,618
$556
$3,258
$556
565
D
ay C
are
(Chi
ld o
r Adu
lt)
studen
t 4.09
62%
1.97
CE
1.08
2.13
2.63
3.8
3.46
5.56
$747
$2,585
$92
$1
$109
$201
$2,384
$506
$2,966
$506
710
O
ffice
1,000 sf
9.74
92%
5.19
SE
1.07
5.55
6.05
34.8
31.94
46.14
$695
$22,205
$746
$6
$884
$1,636
$20,569
$4,366
$25,590
$4,366
720
M
edic
al O
ffice
1,000 sf
34.80
86%
5.81
SE
1.07
6.22
6.72
130.2
119.43
169.74
$688
$82,115
$2,765
$22
$3,277
$6,063
$76,052
$16,144
$94,615
$16,144
820
R
etai
l < 2
0K S
q. F
t. 1,000 sf
100.62
38%
1.73
CE
1.08
1.87
2.37
50.4
46.25
75.24
$754
$34,853
$1,257
$10
$1,489
$2,756
$32,097
$6,813
$39,931
$6,813
820
R
etai
l (la
rge
>=20
ksf
, Sho
p C
tr.)
1,000 sf
48.16
68%
2.78
CE
1.08
3.00
3.50
69.2
63.42
98.91
$733
$46,458
$1,585
$12
$1,879
$3,476
$42,982
$9,124
$53,473
$9,124
Various
Con
veni
ence
Ret
ail
1,000 sf
670.00
27%
1.67
CE
1.08
1.80
2.30
223.7
205.14
333.74
$754
$154,585
$5,616
$44
$6,657
$12,317
$142,269
$30,200
$176,993
$30,200
936/937
C
offe
e/D
onut
Sho
p 1,000 sf
792.21
15%
0.96
CE
1.08
1.04
1.54
86.2
79.08
130.43
$761
$60,147
$2,512
$20
$2,977
$5,508
$54,639
$11,599
$67,976
$11,599
931/932
R
esta
uran
t - S
it D
own
1,000 sf
98.66
76%
3.23
CE
1.08
3.49
3.99
183.1
167.90
261.85
$733
$122,993
$4,113
$32
$4,875
$9,020
$113,973
$24,194
$141,791
$24,194
93
3/93
4 R
esta
uran
t - F
ast F
ood
1,000 sf
462.29
50%
0.96
CE
1.08
1.04
1.54
167.8
153.83
253.71
$761
$116,996
$4,885
$38
$5,790
$10,714
$106,282
$22,561
$132,223
$22,561
944
G
asol
ine
Stat
ion
Fuel Pos.
172.01
50%
1.82
SE
1.07
1.95
2.45
117.2
107.51
174.90
$754
$81,013
$2,895
$23
$3,431
$6,348
$74,664
$15,849
$92,888
$15,849
850
Su
perm
arke
t 1,000 sf
106.78
53%
2.00
CE
1.08
2.16
2.66
85.6
78.47
125.89
$747
$58,579
$2,070
$16
$2,454
$4,540
$54,039
$11,471
$67,228
$11,471
848
G
arag
e / A
uto
Rep
air
1,000 sf
25.82
66%
3.24
SE
1.07
3.47
3.97
41.4
37.92
59.14
$733
$27,780
$930
$7
$1,102
$2,039
$25,741
$5,464
$32,024
$5,464
912
Ba
nk/S
avin
gs/C
redi
t Uni
on
1,000 sf
101.30
44%
2.02
SE
1.07
2.16
2.66
67.4
61.84
99.22
$747
$46,166
$1,631
$13
$1,934
$3,578
$42,588
$9,040
$52,983
$9,040
110/140
M
anuf
actu
ring
1,000 sf
4.445
92%
6.06
IE
1.14
6.91
7.41
19.8
18.13
25.35
$680
$12,331
$417
$3
$494
$914
$11,417
$2,424
$14,204
$2,424
15
0/15
4/15
7 Pa
ssiv
e W
areh
ouse
(Sto
rage
war
ehou
se)
1,000 sf
1.74
92%
6.06
IE
1.14
6.91
7.41
7.7
7.10
9.92
$680
$4,827
$163
$1
$193
$358
$4,469
$949
$5,560
$949
155/156
Ac
tive
War
ehou
se (P
arce
l hub
/fulfi
lmen
t cen
ter)
1,000 sf
7.97
92%
6.06
IE
1.14
6.91
7.41
35.5
32.52
45.46
$680
$22,110
$747
$6
$885
$1,638
$20,471
$4,346
$25,468
$4,346
151
M
ini-W
areh
ouse
s 1,000 sf
1.51
92%
4.06
CE
1.08
4.39
4.89
4.3
3.91
5.92
$718
$2,810
$93
$1
$111
$205
$2,605
$553
$3,240
$553
Nor
th
East
So
uth/
C
entr
al
Wes
t D
omin
ant r
easo
n fo
r fee
cha
nge
$705
$705
$1,185
$705
$705
$705
$1,185
$705
$705
$705
$1,185
$705
new
new
new
new
$392
$392
$659
$392
Lo
wer
trip
rate
$493
$493
$829
$493
$492
$492
$827
$492
Lo
wer
trip
rate
$120
$120
$202
$120
H
ighe
r trip
rate
$2,270
$2,270
$3,817
$2,270
*A
ssum
es 8
.5 a
cres
per
hol
e!
$1,240
$1,240
$2,086
$1,240
Fo
rmer
ly "R
acqu
et C
lub"
$1,110
$1,110
$1,867
$1,110
Lo
wer
trip
rate
new
new
new
new
$145
$145
$244
$145
H
ighe
r trip
rate
$448
$448
$753
$448
Tr
ip le
ngth
effe
ct
$691
$691
$1,163
$691
*a
ssum
es 1
60 s
f/stu
dent
$519
$519
$872
$519
*a
ssum
es 1
20 s
f/stu
dent
$1
,139
-$1,
545
$1,1
39-$
1,54
5 $1
,916
-$2,
598
$1,1
39-$
1,54
5 Tr
ip ra
te a
nd le
ngth
, ave
rage
repo
rted
$2,540
$2,540
$4,272
$2,540
Tr
ip le
ngth
effe
ct
$3,421
$3,421
$5,735
$3,421
Tr
ip le
ngth
effe
ct
$1,821
$1,821
$3,062
$1,821
Tr
ip le
ngth
effe
ct
$7,250
$7,250
$12,193
$7,250
Tr
ip le
ngth
effe
ct
new
new
new
new
$7,250
$7,250
$13,069
$7,250
Tr
ip le
ngth
effe
ct
$9,426
$9,426
$15,852
$9,426
Tr
ip le
ngth
effe
ct
$3,210
$3,210
$5,398
$3,210
*2
fuel
ing
sta/
disp
ense
r? T
rip le
ngth
$3,449
$3,449
$5,800
$3,449
Tr
ip le
ngth
effe
ct
$1,873
$1,873
$3,150
$1,873
Tr
ip le
ngth
effe
ct
$4,2
34/$
5,75
6 $4
,234
/$5,
756
$7,1
21/$
9,68
0 $4
,234
/$5,
756
Hig
her t
rip ra
te
$524
$524
$881
$524
Lo
wer
trip
rate
$398
$398
$669
$398
Lo
wer
trip
rate
$398
$398
$669
$398
ne
w?/
high
er tr
ip ra
te
$182
$182
$306
$182
Lo
wer
trip
rate
F:\W
EO‐PE\Projects\106.07 KAI‐Seminole M
obility Fee
\3. A
nalysis\Strategic Planning\Strategic Planning v8.xlsm
So
urce: W
.E. O
liver, P
.E., LLC
DRAFT
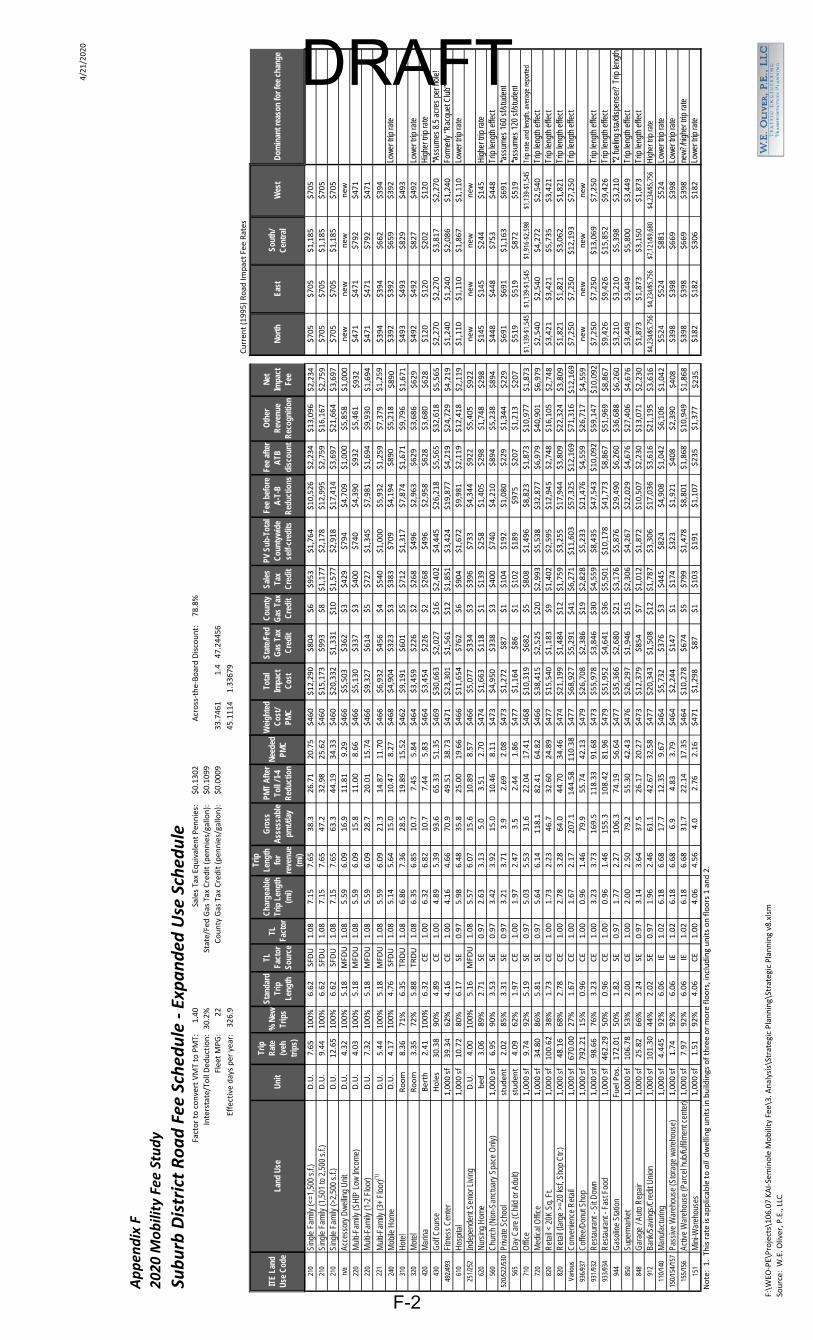
4/21/2020
Appen
dix F
2020 M
obility Fee
Study
Suburb District Road Fee
Sched
ule ‐ Exp
anded
Use Sched
ule
Factor to convert VMT to PMT:
1.40
Sales Tax Eq
uivalen
t Pen
nies:
$0.1302
Across‐the‐Board Discount:
78.8%
Interstate/Toll Ded
uction: 30.2%
State/Fed Gas Tax Credit (pen
nies/gallo
n):
$0.1099
Flee
t MPG:
22
County Gas Tax Credit (pen
nies/gallo
n):
$0.0009
33.7461
1.4
47.24456
Effective days per yea
r: 326.9
45.1114
1.33679
Curren
t (1995) Road
Impact Fee Rates
F-2
ITE
Land
U
se C
ode
Land
Use
U
nit
Trip
R
ate
(veh
tr
ips)
% N
ew
Trip
s
Stan
dard
Tr
ip
Leng
th
TL
Fact
or
Sour
ce
TL
Fact
or C
harg
eabl
e Tr
ip L
engt
h (m
i)
Trip
Le
ngth
fo
r re
venu
e (m
i)
Gro
ss
Ass
essa
ble
pmt/d
ay
PMT
Afte
r To
ll / I
-4
Red
uctio
n
Nee
ded
PMC
Wei
ghte
d C
ost/
PMC
Tota
l Im
pact
C
ost
Stat
e/Fe
d G
as T
ax
Cre
dit
Cou
nty
Gas
Tax
C
redi
t
Sale
s Ta
x C
redi
t
PV S
ub-T
otal
C
ount
ywid
e se
lf-cr
edits
Fee
befo
re
A-T
-B
Red
uctio
ns Fe
e af
ter
ATB
di
scou
nt
Oth
er
Rev
enue
R
ecog
nitio
n
Net
Im
pact
Fe
e
210
Sing
le F
amily
(<=1
,500
s.f.
) D.U.
7.65
100%
6.62
SFDU
1.08
7.15
7.65
38.3
26.71
20.75
$460
$12,290
$804
$6
$953
$1,764
$10,526
$2,234
$13,096
$2,234
21
0 Si
ngle
Fam
ily (1
,501
to 2
,500
s.f.
) D.U.
9.44
100%
6.62
SFDU
1.08
7.15
7.65
47.2
32.98
25.62
$460
$15,173
$993
$8
$1,177
$2,178
$12,995
$2,759
$16,167
$2,759
21
0 Si
ngle
Fam
ily (>
2,50
0 s.
f.)
D.U.
12.65
100%
6.62
SFDU
1.08
7.15
7.65
63.3
44.19
34.33
$460
$20,332
$1,331
$10
$1,577
$2,918
$17,414
$3,697
$21,664
$3,697
n/
a Ac
cess
ory
Dw
ellin
g U
nit
D.U.
4.32
100%
5.18
MFD
U 1.08
5.59
6.09
16.9
11.81
9.29
$466
$5,503
$362
$3
$429
$794
$4,709
$1,000
$5,858
$1,000
22
0 M
ulti-
Fam
ily (S
HIP
Low
Inco
me)
D.U.
4.03
100%
5.18
MFD
U 1.08
5.59
6.09
15.8
11.00
8.66
$466
$5,130
$337
$3
$400
$740
$4,390
$932
$5,461
$932
22
0 M
ulti-
Fam
ily (1
-2 F
loor
) D.U.
7.32
100%
5.18
MFD
U 1.08
5.59
6.09
28.7
20.01
15.74
$466
$9,327
$614
$5
$727
$1,345
$7,981
$1,694
$9,930
$1,694
22
1 M
ulti-
Fam
ily (3
+ Fl
oor)(1
) D.U.
5.44
100%
5.18
MFD
U 1.08
5.59
6.09
21.3
14.87
11.70
$466
$6,932
$456
$4
$540
$1,000
$5,932
$1,259
$7,379
$1,259
24
0 M
obile
Hom
e D.U.
4.17
100%
4.76
SFDU
1.08
5.14
5.64
15.0
10.47
8.27
$468
$4,904
$323
$3
$383
$709
$4,194
$890
$5,218
$890
31
0 H
otel
Room
8.36
71%
6.35
TR
DU
1.08
6.86
7.36
28.5
19.89
15.52
$462
$9,191
$601
$5
$712
$1,317
$7,874
$1,671
$9,796
$1,671
32
0 M
otel
Room
3.35
72%
5.88
TR
DU
1.08
6.35
6.85
10.7
7.45
5.84
$464
$3,459
$226
$2
$268
$496
$2,963
$629
$3,686
$629
42
0 M
arin
a Berth
2.41
100%
6.32
CE
1.00
6.32
6.82
10.7
7.44
5.83
$464
$3,454
$226
$2
$268
$496
$2,958
$628
$3,680
$628
43
0 G
olf C
ours
e Holes
30.38
90%
4.89
CE
1.00
4.89
5.39
93.6
65.33
51.35
$469
$30,663
$2,027
$16
$2,402
$4,445
$26,218
$5,565
$32,618
$5,565
49
2/49
3 Fi
tnes
s C
ente
r 1,000 sf
39.34
62%
4.16
CE
1.00
4.16
4.66
70.9
49.51
38.73
$471
$23,301
$1,561
$12
$1,851
$3,424
$19,877
$4,219
$24,729
$4,219
61
0 H
ospi
tal
1,000 sf
10.72
80%
6.17
SE
0.97
5.98
6.48
35.8
25.00
19.66
$466
$11,654
$762
$6
$904
$1,672
$9,981
$2,119
$12,418
$2,119
25
1/25
2 In
depe
nden
t Sen
ior L
ivin
g D.U.
4.00
100%
5.16
MFD
U 1.08
5.57
6.07
15.6
10.89
8.57
$466
$5,077
$334
$3
$396
$733
$4,344
$922
$5,405
$922
62
0 N
ursi
ng H
ome
bed
3.06
89%
2.71
SE
0.97
2.63
3.13
5.0
3.51
2.70
$474
$1,663
$118
$1
$139
$258
$1,405
$298
$1,748
$298
56
0 C
hurc
h (N
on-S
anct
uary
Spa
ce O
nly)
1,000 sf
6.95
90%
3.53
SE
0.97
3.42
3.92
15.0
10.46
8.11
$473
$4,950
$338
$3
$400
$740
$4,210
$894
$5,238
$894
52
0/52
2/53
0 Pr
ivat
e Sc
hool
studen
t 2.02
85%
3.31
SE
0.97
3.21
3.71
3.9
2.69
2.08
$473
$1,272
$87
$1
$104
$192
$1,080
$229
$1,344
$229
56
5 D
ay C
are
(Chi
ld o
r Adu
lt)
studen
t 4.09
62%
1.97
CE
1.00
1.97
2.47
3.5
2.44
1.86
$477
$1,164
$86
$1
$102
$189
$975
$207
$1,213
$207
71
0 O
ffice
1,000 sf
9.74
92%
5.19
SE
0.97
5.03
5.53
31.6
22.04
17.41
$468
$10,319
$682
$5
$808
$1,496
$8,823
$1,873
$10,977
$1,873
72
0 M
edic
al O
ffice
1,000 sf
34.80
86%
5.81
SE
0.97
5.64
6.14
118.1
82.41
64.82
$466
$38,415
$2,525
$20
$2,993
$5,538
$32,877
$6,979
$40,901
$6,979
82
0 R
etai
l < 2
0K S
q. F
t. 1,000 sf
100.62
38%
1.73
CE
1.00
1.73
2.23
46.7
32.60
24.89
$477
$15,540
$1,183
$9
$1,402
$2,595
$12,945
$2,748
$16,105
$2,748
82
0 R
etai
l (la
rge
>=20
ksf
, Sho
p C
tr.)
1,000 sf
48.16
68%
2.78
CE
1.00
2.78
3.28
64.0
44.70
34.46
$474
$21,199
$1,484
$12
$1,759
$3,255
$17,944
$3,809
$22,324
$3,809
Va
rious
C
onve
nien
ce R
etai
l 1,000 sf
670.00
27%
1.67
CE
1.00
1.67
2.17
207.1
144.58
110.38
$477
$68,927
$5,291
$41
$6,271
$11,603
$57,325
$12,169
$71,316
$12,169
93
6/93
7 C
offe
e/D
onut
Sho
p 1,000 sf
792.21
15%
0.96
CE
1.00
0.96
1.46
79.9
55.74
42.13
$479
$26,708
$2,386
$19
$2,828
$5,233
$21,476
$4,559
$26,717
$4,559
93
1/93
2 R
esta
uran
t - S
it D
own
1,000 sf
98.66
76%
3.23
CE
1.00
3.23
3.73
169.5
118.33
91.68
$473
$55,978
$3,846
$30
$4,559
$8,435
$47,543
$10,092
$59,147
$10,092
93
3/93
4 R
esta
uran
t - F
ast F
ood
1,000 sf
462.29
50%
0.96
CE
1.00
0.96
1.46
155.3
108.42
81.96
$479
$51,952
$4,641
$36
$5,501
$10,178
$41,773
$8,867
$51,969
$8,867
94
4 G
asol
ine
Stat
ion
Fuel Pos.
172.01
50%
1.82
SE
0.97
1.77
2.27
106.3
74.19
56.64
$477
$35,366
$2,680
$21
$3,176
$5,876
$29,490
$6,260
$36,688
$6,260
85
0 Su
perm
arke
t 1,000 sf
106.78
53%
2.00
CE
1.00
2.00
2.50
79.2
55.30
42.43
$476
$26,297
$1,946
$15
$2,306
$4,267
$22,029
$4,676
$27,406
$4,676
84
8 G
arag
e / A
uto
Rep
air
1,000 sf
25.82
66%
3.24
SE
0.97
3.14
3.64
37.5
26.17
20.27
$473
$12,379
$854
$7
$1,012
$1,872
$10,507
$2,230
$13,071
$2,230
91
2 Ba
nk/S
avin
gs/C
redi
t Uni
on
1,000 sf
101.30
44%
2.02
SE
0.97
1.96
2.46
61.1
42.67
32.58
$477
$20,343
$1,508
$12
$1,787
$3,306
$17,036
$3,616
$21,195
$3,616
11
0/14
0 M
anuf
actu
ring
1,000 sf
4.445
92%
6.06
IE
1.02
6.18
6.68
17.7
12.35
9.67
$464
$5,732
$376
$3
$445
$824
$4,908
$1,042
$6,106
$1,042
15
0/15
4/15
7 Pa
ssiv
e W
areh
ouse
(Sto
rage
war
ehou
se)
1,000 sf
1.74
92%
6.06
IE
1.02
6.18
6.68
6.9
4.83
3.79
$464
$2,244
$147
$1
$174
$323
$1,921
$408
$2,390
$408
15
5/15
6 Ac
tive
War
ehou
se (P
arce
l hub
/fulfi
lmen
t cen
ter)
1,000 sf
7.97
92%
6.06
IE
1.02
6.18
6.68
31.7
22.14
17.35
$464
$10,278
$674
$5
$799
$1,478
$8,801
$1,868
$10,949
$1,868
15
1 M
ini-W
areh
ouse
s 1,000 sf
1.51
92%
4.06
CE
1.00
4.06
4.56
4.0
2.76
2.16
$471
$1,298
$87
$1
$103
$191
$1,107
$235
$1,377
$235
Nor
th
East
So
uth/
C
entr
al
Wes
t D
omin
ant r
easo
n fo
r fee
cha
nge
$705
$705
$1,185
$705
$705
$705
$1,185
$705
$705
$705
$1,185
$705
new
new
new
new
$471
$471
$792
$471
$471
$471
$792
$471
$394
$394
$662
$394
$392
$392
$659
$392
Lo
wer
trip
rate
$493
$493
$829
$493
$492
$492
$827
$492
Lo
wer
trip
rate
$120
$120
$202
$120
H
ighe
r trip
rate
$2,270
$2,270
$3,817
$2,270
*A
ssum
es 8
.5 a
cres
per
hol
e!
$1,240
$1,240
$2,086
$1,240
Fo
rmer
ly "R
acqu
et C
lub"
$1,110
$1,110
$1,867
$1,110
Lo
wer
trip
rate
new
new
new
new
$145
$145
$244
$145
H
ighe
r trip
rate
$448
$448
$753
$448
Tr
ip le
ngth
effe
ct
$691
$691
$1,163
$691
*a
ssum
es 1
60 s
f/stu
dent
$519
$519
$872
$519
*a
ssum
es 1
20 s
f/stu
dent
$1
,139
-$1,
545
$1,1
39-$
1,54
5 $1
,916
-$2,
598
$1,1
39-$
1,54
5 Tr
ip ra
te a
nd le
ngth
, ave
rage
repo
rted
$2,540
$2,540
$4,272
$2,540
Tr
ip le
ngth
effe
ct
$3,421
$3,421
$5,735
$3,421
Tr
ip le
ngth
effe
ct
$1,821
$1,821
$3,062
$1,821
Tr
ip le
ngth
effe
ct
$7,250
$7,250
$12,193
$7,250
Tr
ip le
ngth
effe
ct
new
new
new
new
$7,250
$7,250
$13,069
$7,250
Tr
ip le
ngth
effe
ct
$9,426
$9,426
$15,852
$9,426
Tr
ip le
ngth
effe
ct
$3,210
$3,210
$5,398
$3,210
*2
fuel
ing
sta/
disp
ense
r? T
rip le
ngth
$3,449
$3,449
$5,800
$3,449
Tr
ip le
ngth
effe
ct
$1,873
$1,873
$3,150
$1,873
Tr
ip le
ngth
effe
ct
$4,2
34/$
5,75
6 $4
,234
/$5,
756
$7,1
21/$
9,68
0 $4
,234
/$5,
756
Hig
her t
rip ra
te
$524
$524
$881
$524
Lo
wer
trip
rate
$398
$398
$669
$398
Lo
wer
trip
rate
$398
$398
$669
$398
ne
w?/
high
er tr
ip ra
te
$182
$182
$306
$182
Lo
wer
trip
rate
Note: 1. Th
is rate is applicab
le to all dwellin
g units in build
ings of three or more floors, including units on floors 1 and 2.
F:\W
EO‐PE\Projects\106.07 KAI‐Seminole M
obility Fee
\3. A
nalysis\Strategic Planning\Strategic Planning v8.xlsm
So
urce: W
.E. O
liver, P
.E., LLC
DRAFT
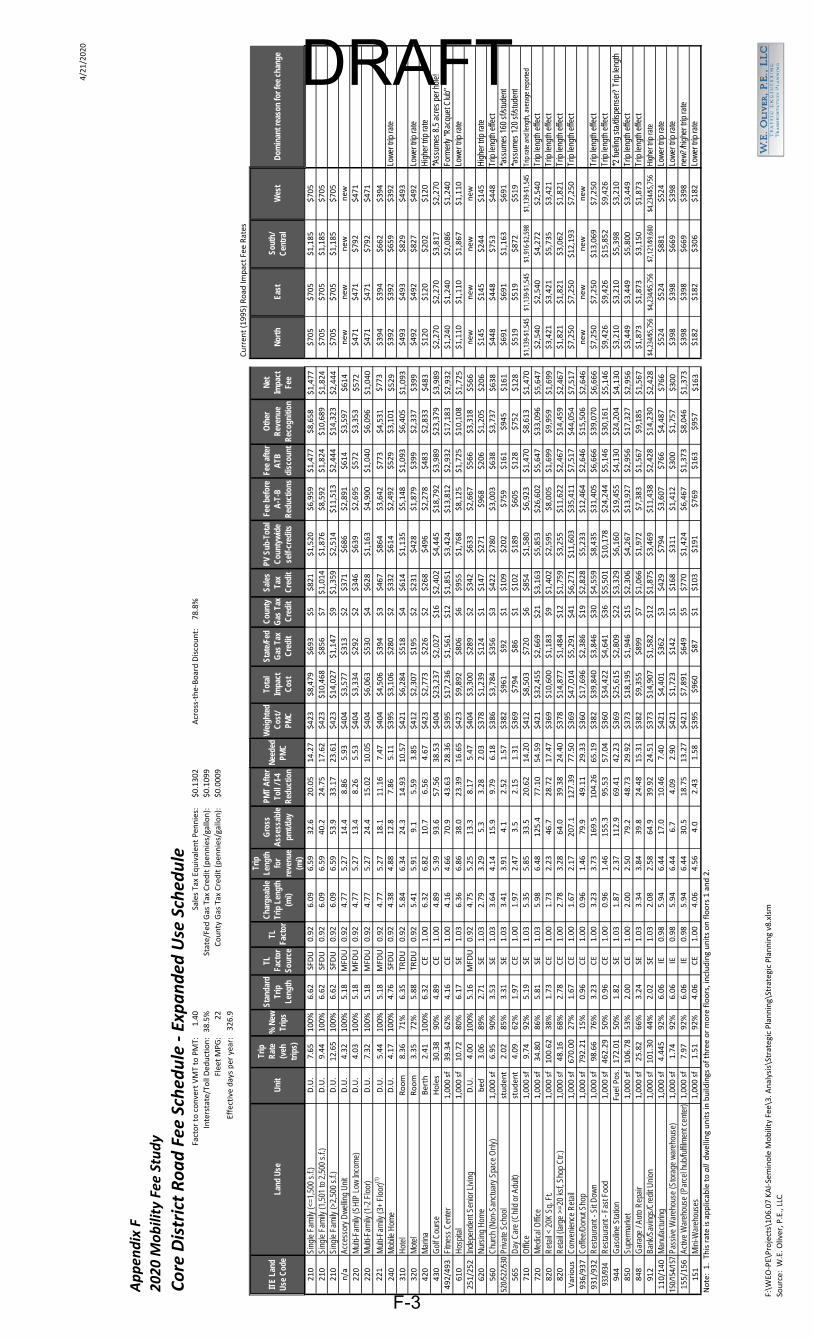
4/21/2020
Appen
dix F
2020 M
obility Fee
Study
Core District Road Fee
Sched
ule ‐ Exp
anded
Use Sched
ule
Factor to convert VMT to PMT:
1.40
Sales Tax Eq
uivalen
t Pen
nies:
$0.1302
Across‐the‐Board Discount:
78.8%
Interstate/Toll Ded
uction: 38.5%
State/Fed Gas Tax Credit (pen
nies/gallo
n):
$0.1099
Flee
t MPG:
22
County Gas Tax Credit (pen
nies/gallo
n):
$0.0009
Effective days per yea
r: 326.9
Curren
t (1995) Road
Impact Fee Rates
F-3
ITE
Land
U
se C
ode
Land
Use
U
nit
Trip
R
ate
(veh
tr
ips)
% N
ew
Trip
s
Stan
dard
Tr
ip
Leng
th
TL
Fact
or
Sour
ce
TL
Fact
or C
harg
eabl
e Tr
ip L
engt
h (m
i)
Trip
Le
ngth
fo
r re
venu
e (m
i)
Gro
ss
Ass
essa
ble
pmt/d
ay
PMT
Afte
r To
ll / I
-4
Red
uctio
n
Nee
ded
PMC
Wei
ghte
d C
ost/
PMC
Tota
l Im
pact
C
ost
Stat
e/Fe
d G
as T
ax
Cre
dit
Cou
nty
Gas
Tax
C
redi
t
Sale
s Ta
x C
redi
t
PV S
ub-T
otal
C
ount
ywid
e se
lf-cr
edits
Fee
befo
re
A-T
-B
Red
uctio
ns Fe
e af
ter
ATB
di
scou
nt
Oth
er
Rev
enue
R
ecog
nitio
n
Net
Im
pact
Fe
e
210
Si
ngle
Fam
ily (<
=1,5
00 s
.f.)
D.U.
7.65
100%
6.62
SFDU
0.92
6.09
6.59
32.6
20.05
14.27
$423
$8,479
$693
$5
$821
$1,520
$6,959
$1,477
$8,658
$1,477
210
Si
ngle
Fam
ily (1
,501
to 2
,500
s.f.
) D.U.
9.44
100%
6.62
SFDU
0.92
6.09
6.59
40.2
24.75
17.62
$423
$10,468
$856
$7
$1,014
$1,876
$8,592
$1,824
$10,689
$1,824
210
Si
ngle
Fam
ily (>
2,50
0 s.
f.)
D.U.
12.65
100%
6.62
SFDU
0.92
6.09
6.59
53.9
33.17
23.61
$423
$14,027
$1,147
$9
$1,359
$2,514
$11,513
$2,444
$14,323
$2,444
n/a
Ac
cess
ory
Dw
ellin
g U
nit
D.U.
4.32
100%
5.18
MFD
U 0.92
4.77
5.27
14.4
8.86
5.93
$404
$3,577
$313
$2
$371
$686
$2,891
$614
$3,597
$614
220
M
ulti-
Fam
ily (S
HIP
Low
Inco
me)
D.U.
4.03
100%
5.18
MFD
U 0.92
4.77
5.27
13.4
8.26
5.53
$404
$3,334
$292
$2
$346
$639
$2,695
$572
$3,353
$572
220
M
ulti-
Fam
ily (1
-2 F
loor
) D.U.
7.32
100%
5.18
MFD
U 0.92
4.77
5.27
24.4
15.02
10.05
$404
$6,063
$530
$4
$628
$1,163
$4,900
$1,040
$6,096
$1,040
221
M
ulti-
Fam
ily (3
+ Fl
oor)(1
) D.U.
5.44
100%
5.18
MFD
U 0.92
4.77
5.27
18.1
11.16
7.47
$404
$4,506
$394
$3
$467
$864
$3,642
$773
$4,531
$773
240
M
obile
Hom
e D.U.
4.17
100%
4.76
SFDU
0.92
4.38
4.88
12.8
7.86
5.11
$395
$3,106
$280
$2
$332
$614
$2,492
$529
$3,101
$529
310
H
otel
Room
8.36
71%
6.35
TR
DU
0.92
5.84
6.34
24.3
14.93
10.57
$421
$6,284
$518
$4
$614
$1,135
$5,148
$1,093
$6,405
$1,093
320
M
otel
Room
3.35
72%
5.88
TR
DU
0.92
5.41
5.91
9.1
5.59
3.85
$412
$2,307
$195
$2
$231
$428
$1,879
$399
$2,337
$399
420
M
arin
a Berth
2.41
100%
6.32
CE
1.00
6.32
6.82
10.7
6.56
4.67
$423
$2,773
$226
$2
$268
$496
$2,278
$483
$2,833
$483
430
G
olf C
ours
e Holes
30.38
90%
4.89
CE
1.00
4.89
5.39
93.6
57.56
38.53
$404
$23,237
$2,027
$16
$2,402
$4,445
$18,792
$3,989
$23,379
$3,989
492/493
Fi
tnes
s C
ente
r 1,000 sf
39.34
62%
4.16
CE
1.00
4.16
4.66
70.9
43.63
28.36
$395
$17,236
$1,561
$12
$1,851
$3,424
$13,812
$2,932
$17,183
$2,932
610
H
ospi
tal
1,000 sf
10.72
80%
6.17
SE
1.03
6.36
6.86
38.0
23.39
16.65
$423
$9,892
$806
$6
$955
$1,768
$8,125
$1,725
$10,108
$1,725
251/252
In
depe
nden
t Sen
ior L
ivin
g D.U.
4.00
100%
5.16
MFD
U 0.92
4.75
5.25
13.3
8.17
5.47
$404
$3,300
$289
$2
$342
$633
$2,667
$566
$3,318
$566
620
N
ursi
ng H
ome
bed
3.06
89%
2.71
SE
1.03
2.79
3.29
5.3
3.28
2.03
$378
$1,239
$124
$1
$147
$271
$968
$206
$1,205
$206
560
C
hurc
h (N
on-S
anct
uary
Spa
ce O
nly)
1,000 sf
6.95
90%
3.53
SE
1.03
3.64
4.14
15.9
9.79
6.18
$386
$3,784
$356
$3
$422
$780
$3,003
$638
$3,737
$638
52
0/52
2/53
0 Pr
ivat
e Sc
hool
studen
t 2.02
85%
3.31
SE
1.03
3.41
3.91
4.1
2.52
1.57
$382
$961
$92
$1
$109
$202
$759
$161
$945
$161
565
D
ay C
are
(Chi
ld o
r Adu
lt)
studen
t 4.09
62%
1.97
CE
1.00
1.97
2.47
3.5
2.15
1.31
$369
$794
$86
$1
$102
$189
$605
$128
$752
$128
710
O
ffice
1,000 sf
9.74
92%
5.19
SE
1.03
5.35
5.85
33.5
20.62
14.20
$412
$8,503
$720
$6
$854
$1,580
$6,923
$1,470
$8,613
$1,470
720
M
edic
al O
ffice
1,000 sf
34.80
86%
5.81
SE
1.03
5.98
6.48
125.4
77.10
54.59
$421
$32,455
$2,669
$21
$3,163
$5,853
$26,602
$5,647
$33,096
$5,647
820
R
etai
l < 2
0K S
q. F
t. 1,000 sf
100.62
38%
1.73
CE
1.00
1.73
2.23
46.7
28.72
17.47
$369
$10,600
$1,183
$9
$1,402
$2,595
$8,005
$1,699
$9,959
$1,699
820
R
etai
l (la
rge
>=20
ksf
, Sho
p C
tr.)
1,000 sf
48.16
68%
2.78
CE
1.00
2.78
3.28
64.0
39.38
24.40
$378
$14,877
$1,484
$12
$1,759
$3,255
$11,622
$2,467
$14,459
$2,467
Various
Con
veni
ence
Ret
ail
1,000 sf
670.00
27%
1.67
CE
1.00
1.67
2.17
207.1
127.39
77.50
$369
$47,014
$5,291
$41
$6,271
$11,603
$35,411
$7,517
$44,054
$7,517
936/937
C
offe
e/D
onut
Sho
p 1,000 sf
792.21
15%
0.96
CE
1.00
0.96
1.46
79.9
49.11
29.33
$360
$17,696
$2,386
$19
$2,828
$5,233
$12,464
$2,646
$15,506
$2,646
931/932
R
esta
uran
t - S
it D
own
1,000 sf
98.66
76%
3.23
CE
1.00
3.23
3.73
169.5
104.26
65.19
$382
$39,840
$3,846
$30
$4,559
$8,435
$31,405
$6,666
$39,070
$6,666
93
3/93
4 R
esta
uran
t - F
ast F
ood
1,000 sf
462.29
50%
0.96
CE
1.00
0.96
1.46
155.3
95.53
57.04
$360
$34,422
$4,641
$36
$5,501
$10,178
$24,244
$5,146
$30,161
$5,146
944
G
asol
ine
Stat
ion
Fuel Pos.
172.01
50%
1.82
SE
1.03
1.87
2.37
112.9
69.41
42.23
$369
$25,615
$2,809
$22
$3,329
$6,160
$19,455
$4,130
$24,204
$4,130
850
Su
perm
arke
t 1,000 sf
106.78
53%
2.00
CE
1.00
2.00
2.50
79.2
48.73
29.92
$373
$18,195
$1,946
$15
$2,306
$4,267
$13,927
$2,956
$17,327
$2,956
848
G
arag
e / A
uto
Rep
air
1,000 sf
25.82
66%
3.24
SE
1.03
3.34
3.84
39.8
24.48
15.31
$382
$9,355
$899
$7
$1,066
$1,972
$7,383
$1,567
$9,185
$1,567
912
Ba
nk/S
avin
gs/C
redi
t Uni
on
1,000 sf
101.30
44%
2.02
SE
1.03
2.08
2.58
64.9
39.92
24.51
$373
$14,907
$1,582
$12
$1,875
$3,469
$11,438
$2,428
$14,230
$2,428
110/140
M
anuf
actu
ring
1,000 sf
4.445
92%
6.06
IE
0.98
5.94
6.44
17.0
10.46
7.40
$421
$4,401
$362
$3
$429
$794
$3,607
$766
$4,487
$766
15
0/15
4/15
7 Pa
ssiv
e W
areh
ouse
(Sto
rage
war
ehou
se)
1,000 sf
1.74
92%
6.06
IE
0.98
5.94
6.44
6.7
4.09
2.90
$421
$1,723
$142
$1
$168
$311
$1,412
$300
$1,757
$300
155/156
Ac
tive
War
ehou
se (P
arce
l hub
/fulfi
lmen
t cen
ter)
1,000 sf
7.97
92%
6.06
IE
0.98
5.94
6.44
30.5
18.75
13.27
$421
$7,891
$649
$5
$770
$1,424
$6,467
$1,373
$8,046
$1,373
151
M
ini-W
areh
ouse
s 1,000 sf
1.51
92%
4.06
CE
1.00
4.06
4.56
4.0
2.43
1.58
$395
$960
$87
$1
$103
$191
$769
$163
$957
$163
Nor
th
East
So
uth/
C
entr
al
Wes
t D
omin
ant r
easo
n fo
r fee
cha
nge
$705
$705
$1,185
$705
$705
$705
$1,185
$705
$705
$705
$1,185
$705
new
new
new
new
$471
$471
$792
$471
$471
$471
$792
$471
$394
$394
$662
$394
$392
$392
$659
$392
Lo
wer
trip
rate
$493
$493
$829
$493
$492
$492
$827
$492
Lo
wer
trip
rate
$120
$120
$202
$120
H
ighe
r trip
rate
$2,270
$2,270
$3,817
$2,270
*A
ssum
es 8
.5 a
cres
per
hol
e!
$1,240
$1,240
$2,086
$1,240
Fo
rmer
ly "R
acqu
et C
lub"
$1,110
$1,110
$1,867
$1,110
Lo
wer
trip
rate
new
new
new
new
$145
$145
$244
$145
H
ighe
r trip
rate
$448
$448
$753
$448
Tr
ip le
ngth
effe
ct
$691
$691
$1,163
$691
*a
ssum
es 1
60 s
f/stu
dent
$519
$519
$872
$519
*a
ssum
es 1
20 s
f/stu
dent
$1
,139
-$1,
545
$1,1
39-$
1,54
5 $1
,916
-$2,
598
$1,1
39-$
1,54
5 Tr
ip ra
te a
nd le
ngth
, ave
rage
repo
rted
$2,540
$2,540
$4,272
$2,540
Tr
ip le
ngth
effe
ct
$3,421
$3,421
$5,735
$3,421
Tr
ip le
ngth
effe
ct
$1,821
$1,821
$3,062
$1,821
Tr
ip le
ngth
effe
ct
$7,250
$7,250
$12,193
$7,250
Tr
ip le
ngth
effe
ct
new
new
new
new
$7,250
$7,250
$13,069
$7,250
Tr
ip le
ngth
effe
ct
$9,426
$9,426
$15,852
$9,426
Tr
ip le
ngth
effe
ct
$3,210
$3,210
$5,398
$3,210
*2
fuel
ing
sta/
disp
ense
r? T
rip le
ngth
$3,449
$3,449
$5,800
$3,449
Tr
ip le
ngth
effe
ct
$1,873
$1,873
$3,150
$1,873
Tr
ip le
ngth
effe
ct
$4,2
34/$
5,75
6 $4
,234
/$5,
756
$7,1
21/$
9,68
0 $4
,234
/$5,
756
Hig
her t
rip ra
te
$524
$524
$881
$524
Lo
wer
trip
rate
$398
$398
$669
$398
Lo
wer
trip
rate
$398
$398
$669
$398
ne
w?/
high
er tr
ip ra
te
$182
$182
$306
$182
Lo
wer
trip
rate
Note: 1. Th
is rate is applicab
le to all dwellin
g units in build
ings of three or more floors, including units on floors 1 and 2.
F:\W
EO‐PE\Projects\106.07 KAI‐Seminole M
obility Fee
\3. A
nalysis\Strategic Planning\Strategic Planning v8.xlsm
So
urce: W
.E. O
liver, P
.E., LLC
DRAFT

DRAFT
Appendix G
Condensed Fee Schedule for
Publication

.E. OLIVER, P.E., LLC TRAFFTC [-,...;GJ"IF.FRTNG
TRANSPORTATTO'l PI.ANNTNC..
DRAFT 4/21/2020
Appendix G Seminole County, Florida
Condensed Mobility Fee Schedule Adopted:
Fee District ITE Land
Use Code Land Use Unit Rural Suburb Core
210 Single Family (<=1,500 s.f.) D.U. $6,710 $2,234 $1,477 210 Single Family (1,501 to 2,500 s.f.) D.U. $8,284 $2,759 $1,824 210 Single Family (>2,500 s.f.) D.U. $11,101 $3,697 $2,444 n/a Accessory Dwelling Unit D.U. $3,178 $1,000 $614 220 Multi-Family (1-2 Floor) D.U. n/a $1,694 $1,040 221 Multi-Family (3+ Floor)(1) D.U. n/a $1,259 $773 240 Mobile Home D.U. $2,891 $890 $529 310 Hotel Room $5,063 $1,671 $1,093 320 Motel Room $1,956 $629 $399 420 Marina Berth $1,411 $628 $483 430 Golf Course Holes $12,815 $5,565 $3,989
492/493 Fitness Center 1,000 sf $9,928 $4,219 $2,932 610 Hospital 1,000 sf $4,841 $2,119 $1,725
251/252 Independent Senior Living D.U. $2,932 $922 $566 620 Nursing Home bed $738 $298 $206 560 Church (Non-Sanctuary Space Only) 1,000 sf $2,164 $894 $638
520/522/530 Private School student $556 $229 $161 565 Day Care (Child or Adult) student $506 $207 $128 710 Office 1,000 sf $4,366 $1,873 $1,470 720 Medical Office 1,000 sf $16,144 $6,979 $5,647 820 Retail < 20K Sq. Ft. 1,000 sf $6,813 $2,748 $1,699 820 Retail (large >=20 ksf, Shop Ctr.) 1,000 sf $9,124 $3,809 $2,467
Various Convenience Retail 1,000 sf $30,200 $12,169 $7,517 936/937 Coffee/Donut Shop 1,000 sf $11,599 $4,559 $2,646 931/932 Restaurant - Sit Down 1,000 sf $24,194 $10,092 $6,666 933/934 Restaurant - Fast Food 1,000 sf $22,561 $8,867 $5,146 944 Gasoline Station Fuel Pos. $15,849 $6,260 $4,130 850 Supermarket 1,000 sf $11,471 $4,676 $2,956 848 Garage / Auto Repair 1,000 sf $5,464 $2,230 $1,567 912 Bank/Savings/Credit Union 1,000 sf $9,040 $3,616 $2,428
110/140 Manufacturing 1,000 sf $2,424 $1,042 $766 150/154/157 Passive Warehouse (Storage warehouse) 1,000 sf $949 $408 $300 155/156 Active Warehouse (Parcel hub/fulfilment center) 1,000 sf $4,346 $1,868 $1,373 151 Mini-Warehouses 1,000 sf $553 $235 $163
F:\WEO‐PE\Projects\106.07 KAI‐Seminole Mobility Fee\3. Analysis\Strategic Planning\Strategic Planning v8.xlsm G-1