draft freight performance measures - seattle
TRANSCRIPT
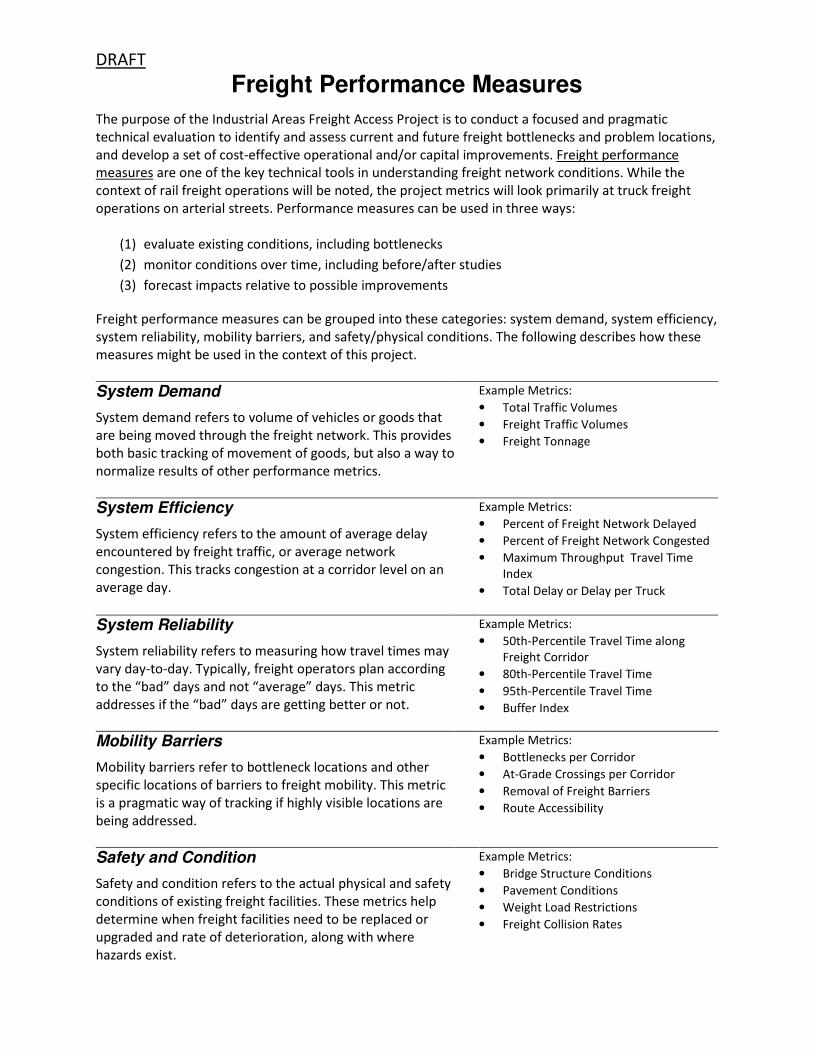
DRAFT
Freight Performance Measures
The purpose of the Industrial Areas Freight Access Project is to conduct a focused and pragmatic
technical evaluation to identify and assess current and future freight bottlenecks and problem locations,
and develop a set of cost-effective operational and/or capital improvements. Freight performance
measures are one of the key technical tools in understanding freight network conditions. While the
context of rail freight operations will be noted, the project metrics will look primarily at truck freight
operations on arterial streets. Performance measures can be used in three ways:
(1) evaluate existing conditions, including bottlenecks
(2) monitor conditions over time, including before/after studies
(3) forecast impacts relative to possible improvements
Freight performance measures can be grouped into these categories: system demand, system efficiency,
system reliability, mobility barriers, and safety/physical conditions. The following describes how these
measures might be used in the context of this project.
System Demand
System demand refers to volume of vehicles or goods that
are being moved through the freight network. This provides
both basic tracking of movement of goods, but also a way to
normalize results of other performance metrics.
Example Metrics:
• Total Traffic Volumes
• Freight Traffic Volumes
• Freight Tonnage
System Efficiency
System efficiency refers to the amount of average delay
encountered by freight traffic, or average network
congestion. This tracks congestion at a corridor level on an
average day.
Example Metrics:
• Percent of Freight Network Delayed
• Percent of Freight Network Congested
• Maximum Throughput Travel Time
Index
• Total Delay or Delay per Truck
System Reliability
System reliability refers to measuring how travel times may
vary day-to-day. Typically, freight operators plan according
to the “bad” days and not “average” days. This metric
addresses if the “bad” days are getting better or not.
Example Metrics:
• 50th-Percentile Travel Time along
Freight Corridor
• 80th-Percentile Travel Time
• 95th-Percentile Travel Time
• Buffer Index
Mobility Barriers
Mobility barriers refer to bottleneck locations and other
specific locations of barriers to freight mobility. This metric
is a pragmatic way of tracking if highly visible locations are
being addressed.
Example Metrics:
• Bottlenecks per Corridor
• At-Grade Crossings per Corridor
• Removal of Freight Barriers
• Route Accessibility
Safety and Condition
Safety and condition refers to the actual physical and safety
conditions of existing freight facilities. These metrics help
determine when freight facilities need to be replaced or
upgraded and rate of deterioration, along with where
hazards exist.
Example Metrics:
• Bridge Structure Conditions
• Pavement Conditions
• Weight Load Restrictions
• Freight Collision Rates

1
Industrial Areas Freight Access
Project (FAP)
Freight Advisory Board
January 21, 2014

2
Key Outcomes from Last Meeting• Identified Challenges/Solutions
• Street Paving/Construction
• Traffic Signals
• Obstructions/Clearances
• Traffic Operations/Congestion
• Other Issues
• Stakeholder Outreach
• Businesses in the MICs
• Shippers/Carriers
• Others

3
PERFORMANCE MEASURES
Purpose in Context of the FAP
• Evaluate System Conditions
• Prioritize Projects
• Communicate Results
Items we have Considered
• WSDOT Freight Plan
• MAP-21 Performance Guidance
• Best Practices
• Data Availability / Resources

4
PERFORMANCE MEASURES
Key Categories
1. System Demand
2. System Efficiency
3. System Reliability
4. Mobility Barriers
5. Safety and Condition
*Performance is based upon a combination of
several measures

5
1. SYSTEM DEMAND
What it Measures
Scale of freight activity along a corridor
Possible Metrics
� Total Traffic Volumes
� Truck Volumes
� Tonnage
per Corridor

6
2. SYSTEM EFFICIENCY
What it Measures
Travel times / delays along
a network for a defined period
Possible Metrics
� Total Delay by Corridor during
Peak Periods*
� Annual Hours of Truck Delay
by Corridor* Prioritized for freight activity

7
3. SYSTEM RELIABILITY
What it Measures
Variability of travel time or delay
Possible Metrics
� 80th Percentile Travel Time by
Corridor
� Buffer Index (95th Percentile)
per MIC95th
Percentile

8
4. MOBILITY BARRIERS
What it Measures
Bottleneck locations or route
constraints
Possible Metrics
� Bottlenecks per Corridor
� At-grade Crossings

9
5. SAFETY AND CONDITION
What it Measures
Collisions and roadway
conditions
Possible Metrics
� Freight Collision Rates
� Pavement Conditions
� Potential Modal Conflicts

10
Questions to Consider
• Do these measures capture how we should be
evaluating the health of the transportation system
for freight?
• Are these measures relevant to routing decisions?
• What are we missing?