draft for discussion do not cite - world...
TRANSCRIPT
DRAFT FOR DISCUSSION – DO NOT CITE
Access to and Equity in Higher Education - Malaysia
Hena Mukherjee
Feb, 2010

2
Contents Page
1. Introduction
a. Background 3
b. Impact of policies on access and equity 5
2. Access
a. Increase in Higher Education Institutions 7
b. Overview of increase in access – 1985-2008 11
3. Equity
a. Race 16
b. Gender 23
c. SES 27
d. Region 30
e. Loans and Scholarships 33
4. Constraints 39
5. Major Findings 40
List of Tables 42
References 43

3
1. INTRODUCTION
a. Background
1. Malaysia is one of the smaller countries in the Asia Pacific region and consists of Peninsula
Malaysia, Sabah and Sarawak with a population of about 28.2 million at the first quarter of
2008. It is a multi racial, multi cultural country consisting of Malays, Chinese, Indians and
other indigenous groups such as the Kadazans in Sabah and the Ibans in Sarawak. Malaysia
obtained her independence from the British in 1957 and thereupon established a constitutional
monarchy with a political system based on the UK’s parliamentary democracy.
2. Politically, Malaysia has enjoyed stability since independence. The Malaysian constitution
provided the basis for the social contract among the various races which gave special privileges
for Malays, while preserving the languages and culture of the other races. Since the racial riot
of 1969, the New Economic Policy (NEP) was designed to create a more equitable society by
the eradication of poverty and restructuring the society by eliminating the identification of race
with economic function.
3. One of the main thrusts of the NEP was to promote social equity through education. In
operational terms this was done through the implementation of an ethnic quota system for
student admissions to ensure that the composition of the student body in Public Higher
Education Institutions (Public HEIs) reflects the ethnic distribution in the general population.
This admission policy aimed at promoting social mobility through higher education, especially
for the Malays who were identified as the poorest, most disadvantaged or economically
marginalized group. This will be elaborated later.
4. The Malaysian education system, inherited from the British, had since Independence been used
as an important strategy in the development process of the nation. It is expected to fulfill the
manpower demands of the economy, provide equality of educational opportunity for all and
promote national unity in the Malaysian plural society.
5. The nation embarked on the implementation of various education and economic development
plans in realization of the need to strengthen economic development. The cumulative effect of

4
these actions is best reflected in the development and growth of the higher education sector,
increasingly recognized as the cornerstone of the continued growth of a country.
6. Primary and secondary education were democratized, resulting in strong upward pressure on
the higher education system. To provide opportunity for higher education, the University of
Malaya was established in 1962, although it took its first batch of 323 students in 1959, as the
Kuala Lumpur Division of the University of Malaya located in Singapore. The enrolment by
ethnicity for that year was 60% Chinese, 20% Malay and 20% Indians and Others. The
enrolment of Malay students was far below their percentage in the population.
7. Since then, the number of higher education institutions (HEIs) has grown and by the year 2007,
there were 606 HEIs of various categories; universities, university colleges, foreign branch
campuses, colleges, polytechnics and community colleges.
8. Correspondingly too, the number of students in higher education had risen drastically and in
2007 there were close to 880 000 students in local HEIs, about 50 000 of which are foreign
students. There are close to 55 000 Malaysian students in foreign HEIs overseas. Given this
data, it is estimated that about 25 % of the total population aged 18-24 are in higher education.
Table 1 provides an overview of the progress in Malaysian higher education.
9. However, intertwined with the growth and development of the nation and higher education are
the issues of access and equity. In a pluralistic society like Malaysia, such issues often create
embarrassing silence, in particular when one ethnic group is seen to be disadvantaged in order
to benefit or in comparison to another. Access and equity issues become ever more pertinent
when seen in the light of the national policy of making Malaysia a regional hub in education.
This is because Malaysia cannot be seen as a regional hub for higher education when her
citizens, albeit of particular social class or ethnicity, seek higher education elsewhere.
10. This study shall first provide an overview of the development of national policies which had
impacted the growth and demographics of Malaysian higher education. In Parts B and C, the
discussions shall focus on access to higher education and equity in higher education
respectively.
5
b. Impact of National Policies on Access and Equity in Higher Education
11. In 1962, a high level planning committee known as the Higher Education Planning Committee
(HEPC) was established to develop and improve the higher education sector. The HEPC
Report in 1967 recommended the establishment of new universities and upgrading of the
existing colleges so as to meet the increasing social demand for higher education and to meet
the manpower demands of the economy. It also recommended more courses in the National
Language, Bahasa Malaysia.
12. Based on the Report three new universities were established and one degree-granting, National
Institute of Technology; three other institutions offering professional diplomas and sub-
professional courses. These universities and institutes were established by 1971.
13. After 1971 and on the wave of the watershed event of the 1969 race riots, the expansion in the
number of tertiary institutions prior to 1971 was to increase access and equity in higher
education.
14. A committee formed by the National Operations Council (NOC) to study student development
at the University of Malaya, after the 1969 racial riots recommended an ethnic quota system in
the proportion of 55:45 percent for Bumiputera and Non-Bumiputera students as the basis for
admission to universities. This ethnic quota system was in place till the meritocracy system
was implemented in 2002.
15. The expansion of higher educational facilities could not fulfil the demand for skilled and
knowledgeable workers for an expanding economy as well as the increasing social demand.
Hence the existing universities were asked to double their intakes. Private HEIs were
encouraged to offer home grown certificates and diplomas, and degrees through twinning
arrangements with foreign HEIs.
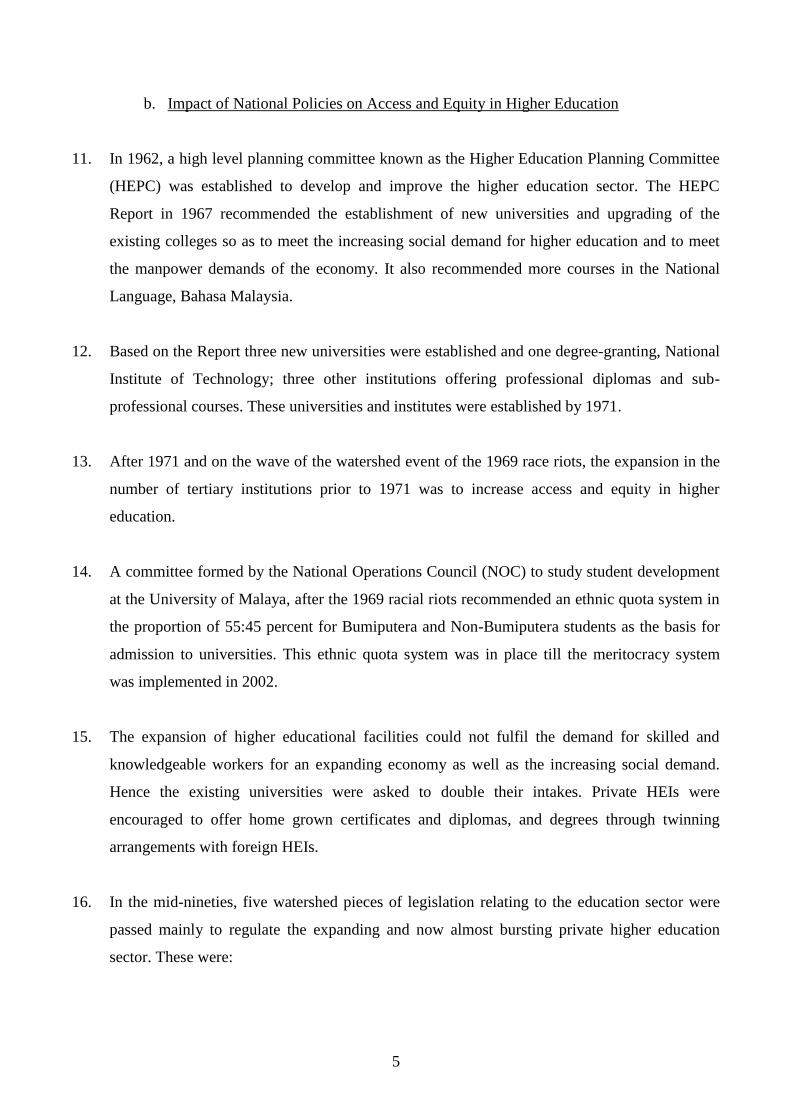
16. In the mid-nineties, five watershed pieces of legislation relating to the education sector were
passed mainly to regulate the expanding and now almost bursting private higher education
sector. These were:

6
i. The National Accreditation Board Act (Lembaga Akreditasi Negara) 1996 – to
establish the National Accreditation Board (or its local acronym, LAN) to accredit
programmes in the private higher education sector;
ii. The National Council on Higher Education Act, 1996 to establish a council which
formulates policy for the Malaysian higher education sector;
iii. The Private Higher Education Institutions Act (PHEI) 1996 – to establish degree
granting private universities and foreign branch campuses;
iv. The University and University Colleges Act 1971 (Amended 1996) – to enable
corporatization of public universities and to modernize the management of the public
universities to meet the needs of the society and the industry.
v. The National Higher Education Funding Board Act, 1997 – to establish a higher
education funding board to provide loans for students in HEIs.
17. For the government, however, the liberalization of higher education not only increased the
opportunities for higher education but also reduced public expenditure and saved on foreign
exchange by reducing the number of students going overseas. In 1995, the enrolment in private
educational institutions was 341, 310 compared with that of public institutions of 390,388.
18. The Higher Education Strategic Plan, 2020 is expected to provide the long term direction for
quality education and greater accessibility. Under the Ninth Malaysia Plan (2006-2010) three
more universities are expected to be completed and more branch campuses of University
Technology MARA will be constructed. Enrolment in institutions of higher education is
expected to increase from 829, 831 in 2007 to 1,349,978 in 2010. This is highly achievable as
in 2008, the total student population in HE are 921 548.

7
Table 1: Overview Malaysian Higher Education 1967:2007
ITEM 1967 2007
Public Universities 1 20
Private Universities and University-Colleges
0 33a
Foreign Branch Campuses 0 4
Private Colleges and HE institutions 2 488b
Polytechnics 0 34
Community Colleges 0 37
Students (postgraduates) 4560 (398) 873 238 (45 888)
Malaysian Students studying abroad n/a 54 915
Population age 18-24 n/a 3 474 200
Note: a. excluding local branch campuses b. including local branch campuses
Source
1997 data: Interim Report to the Higher Education Advisory Council, 1974. 2007 data – Ministry of Higher Education, www.mohe.gov.my.
2. ACCESS TO HIGHER EDUCATION
a. Increase in HEIs
1. The policies adopted in the last five decades of independence such as the NEP mapped the
direction and characteristics of the education system today. The NEP by imposing the ethnic
quota system for student admissions in public HEIs, created its own inequities in the higher
education system. Students who were otherwise eligible for higher education were not given
places. Non-Bumiputera students who were not given placements in the public HEIs had to
look for alternatives, which included going to overseas education destinations such as the UK,
Australia and New Zealand. However, students who could not afford overseas qualifications
looked for local alternatives.
2. This created a demand for locally available higher education opportunities and is seen as the
catalyst for the growth of the private higher education industry. Private Higher Education
Institutions (PHEIs), until the early 1970s, focused on providing correspondence courses for
formal school certification for repeaters and those out of school such as the Higher School
Certificate; professional qualifications such as Pitman’s Secretarial Courses; and coaching for

8
external qualifications leading to Diplomas and Advanced Diplomas mainly from the UK
professional bodies such as CIMA, ABE and ICSA. However, this could not meet the growing
demand for higher education, which was fuelled by the economic growth of the country and
the subsequent rise in demand for a qualified and skilled workforce.
3. The move by the Government to create more public universities and the creation of private
HEIs did not stop the growing number of students studying overseas which increased, for
example from about 73 000 in 1990 (Tan, 2002) to 117 297 in 2000 (See Table 2). Realizing
the rising demand and the need to cap the outflow of currency the Government began
loosening control over private education. Private HEIs were soon offering undergraduate
qualifications either as external programs or as twinning arrangements. This brought about a
reversal in the trend of students studying abroad from 117 297 in 2000 to 54 915 in 2007.
4. The move by the Government to create more public universities and the creation of private
HEIs did not stop the demand for foreign qualifications. Realizing the rising demand and the
need to cap the outflow of currency the Government began loosening control over private
education. Private HEIs were soon offering undergraduate qualifications either as external
programs or as twinning arrangements.
5. The 1986/87 economic downturn etched a permanent mark in the Higher Education industry
with many parents seeking local higher education alternatives as the cost of a foreign education
became unaffordable. This downturn also brought in new players from the now slow and
unstable manufacturing and construction industries into the thriving private education industry.
6. The demand for more places was easily met by the formation of new PHEIs. The 7th
Malaysian
Plan between 1996 and 2000, which promoted growth in capital intensive, high technology
industries requiring an educated, highly skilled workforce and foreign investment, caused
PHEIs to boom to an unprecedented level. In 1992, there were a total of 156 PHEIs offering
certificate, diploma and professional qualification either in collaboration with a university or a
professional body (Lee, 2001). By 2002, there were a total of 706 PHEIs comprising private
universities, university colleges, colleges and foreign university campuses catering for almost
300,000 students (Middlehurst and Woodfield, 2004).

9
7. Selected private HEIs were upgraded to university colleges and private universities, GLCs and
political parties were given licences to establish HEIs. Foreign universities were also invited to
establish branch campuses. The growth of the private education sector increased greater access
to higher education. However, this increase in access did not bring about greater equity in as
those who entered private education had to pay higher fees.
8. Today, this number has consolidated and reduced fallen due to Government actions to enforce
existing policies and regulations (such as those influencing licensing and accreditation. As of
2005, there were 448 PHEIs (MOHE, 2007), most of which operate in the Klang Valley and
large cities.
9. There has also been an increase in public higher education institutions, in line with the vision
to increase access to higher education and at relatively lower cost. Today each of the 14
federated states has at least one university each.
10. The data for 2008 show that there is now a total of 20 public and 20 private universities, 21
private university colleges, 398 private colleges, and five foreign branch campuses. About 50
per cent of these are concentrated in the Klang Valley (Kuala Lumpur and Selangor), details of
which are provided in Table 3 below. This is supported by numerous technical and vocational
training providers, such as polytechnics and community colleges and skills training centers
under the Ministry of Human Resources with a corresponding increase in the number of
students.
11. The growth in both the public and private higher education providers had indeed provided
greater access to Malaysians to pursue higher education in the country. However, access to
higher education cannot be taken out of the context of equity, especially in light of policies
which legitimizes selection. While there is clear evidence that basic access is provided through
various channels, whether such access is equitable will be demonstrated at the other parts of
this report.

10
Table 2: Number of Malaysian Students Overseas, 2000-2007
Country 2000 2001 2002 2003 2004 2005 2006 2007
United States 31,360 28,700 7,395 7,611 5,519 6,411 6,142 5,281
Saudi Arabia - - 127 125 125 132 138 125
Australia 16,491 15,121 15,700 15,448 15,434 15,909 14,918 13,010
Canada 1,194 1,130 231 231 196 230 238 312
Indonesia 1,720 1,616 1,337 1,225 1,607 2,444 3,630 4,565
Jordan 3,350 1,512 361 361 310 444 490 655
Egypt 7,369 7,068 4,664 4,330 5,768 6,256 5,780 6,896
New Zealand 1,407 1,214 995 918 1,011 1,338 1,297 1,574
United Kingdom and Ireland
54,406 47,365 11,970 11,860 11,041 15,189 12,569 11,490
Other countries - - - - 2,268 8,256 8,722 11,007
Total 117,297 103,726 42,780 42,109 43,279 56,609 53,924 54,915
Source: Ministry of Higher Education, www.mohe.gov.my, 2006 and 2008
Table 3: Public and Private Higher Education Institutions According to Location, 2007
State Public HEI Private HEI Total
Universities University-
colleges
Colleges Branch
Campus
Total
1. Kuala Lumpur 2 7 6 96 0 109 111
2. Selangor 4* 8 10 86 2 106 110
3. Sarawak 1 0 0 32 2 34 35
4. Johore 2 0 0 30 1 31 33
5. Penang 1 1 0 29 0 30 31
6. Perak 1 2 0 24 0 26 27
7. Negeri Sembilan 1 0 2 19 0 21 22
8. Melaka 1 0 0 20 0 20 21
9. Sabah 1 0 0 19 0 19 20
10. Pahang 1 0 0 15 0 15 16
11. Terengganu 2 0 1 10 0 11 13
12. Kedah 1 2 1 7 0 10 11
13. Kelantan 1 0 1 9 0 10 11
14. Perlis 1 0 0 2 0 2 3
Total 20 20 21 398 5 444 464
Note: * UiTM, one of the public HEIs in this state which has three satellites, 15 branches and nine city campuses. Source: Ministry of Higher Education, www.mohe.gov.my, 2007

11
b. Overview of increasing access, 1985-2008
1 The period 1985 to 2008 saw great improvement in access to higher education in Malaysia. All
levels of education, primary, secondary and higher, increased their enrolments during this
period but higher education enrolment showed the most dramatic increase. While primary
enrolment increased by 43.9 percent over this period and secondary school enrolment increased
by 84.6 percent, higher education enrolment increased by 1339.4 percent. This represented an
annual increase of 1.9 percent for primary schools, 3.7 percent for secondary schools and 58.2
percent for tertiary education institutions. (Table 4)
2 Increased access to higher education is reflected in the percentage of the population 19-24
enrolled in higher education. In 1970 only 0.6 percent of the age group 19-24 was enrolled in
higher education. By 1990, 2.9 percent of this age group was enrolled in higher education and
by 2000, 8.1 percent of the age group was enrolled in higher education. A huge leap in
enrolments took place after 2000 due to the liberalization of private higher education, the
establishment of the government linked corporations’ (GLC) universities and universities
established by political organizations. By 2008, 24.4 percent of the 19-24 age group were in
higher education institutions.(Table 5)
3 The educational profile of the labor force has also changed revealing a gradually increasing
proportion of employed persons with tertiary education. In 1985, 2.7 percent of the employed
persons had obtained diploma certificates and 2.1 percent had obtained degree qualifications.
By the year 2000, 5.8 percent of the employed were diploma holders while 5.7 percent were
degree holders. In 2008, 7.4 percent of employed persons were diploma holders and 8.2
percent were degree holders. Thus, by 2008, 15.6 percent of all employed persons had some
kind of tertiary education, an increase of 10.8 percent since 1985. (Table 6)
4 Significant improvement in increasing opportunities for higher education took place during the
1980s, 1990s and the first decade of the 21st century. In this respect public universities have
played a major role.(Table 7)
5 Intake increased from 48,004 in 1995 to 175,104 in 2008. Increased intake is most marked in
the diploma and degree courses; intake in diploma courses increased from 13,513 to 52,278
and in the degree courses from 23,901 to 77,356. The increase in students for masters and

12
doctoral degrees is also significant; masters intake increased from 4,568 to 16,158 and doctoral
students intake increased from 212 to 3,644.
6 Enrolment increased from 109,918 in 1987 to 511,224 in 2008. Enrolment in degree courses
showed a sharp uptrend from 43,430 in 1987 to 274,349 in 2008. Masters and doctoral student
enrolment also saw major increases; masters students increased from 3,252 to 36,094 and
doctoral students from 381 to 12,243 between 1987 and 2008.
7 Output of graduates from the public universities has kept in step with improved intake and
enrolment. In 1987 total output from these institutions was 18,529, in 2000, 69,598 and in
2008, 126,317. Output of diploma graduates increased from 6,227 in 1987 to 37,660 in 2008,
of degree graduates from 8,420 to 60,040, of masters graduates from 1,338 to 8,656 and of
doctoral graduates from 25 to 785.
8 Reliable data for enrolment in private HEIs are only available from 2002 to 2008. The story is
once again of rapid increase in enrolment in private institutions. In 2002 there were 294,600
students in private institutions but by 2008 the number had increased to 399,852, recording an
increase of 35.7 percent or an annual increase of 6.0 percent. The trend is for more students to
enroll for diploma and degree courses than certificate courses. In 2002, of the total enrolment
in private institutions, 31.7 percent were enrolled in certificate courses, 44.1 percent in diploma
courses, 22.2 percent in degree courses, 1.3 percent in masters courses and 0.1 percent in
doctoral courses. However, in 2008, 15.2 percent were enrolled in certificate courses, 44.5
percent in diploma courses, 38.0 percent in degree courses, 2.1 percent in masters courses and
0.2 percent in doctoral courses.(Table 8)
9 Opportunities for higher education are also available in publically financed polytechnics and
community colleges, and this is supported by data available for 2002-7. In 2002 52,898
students were enrolled in polytechnics and 3,207 were enrolled in community colleges. By
2007 polytechnics had an enrolment of 84,250 and community colleges an enrolment of
14,438.
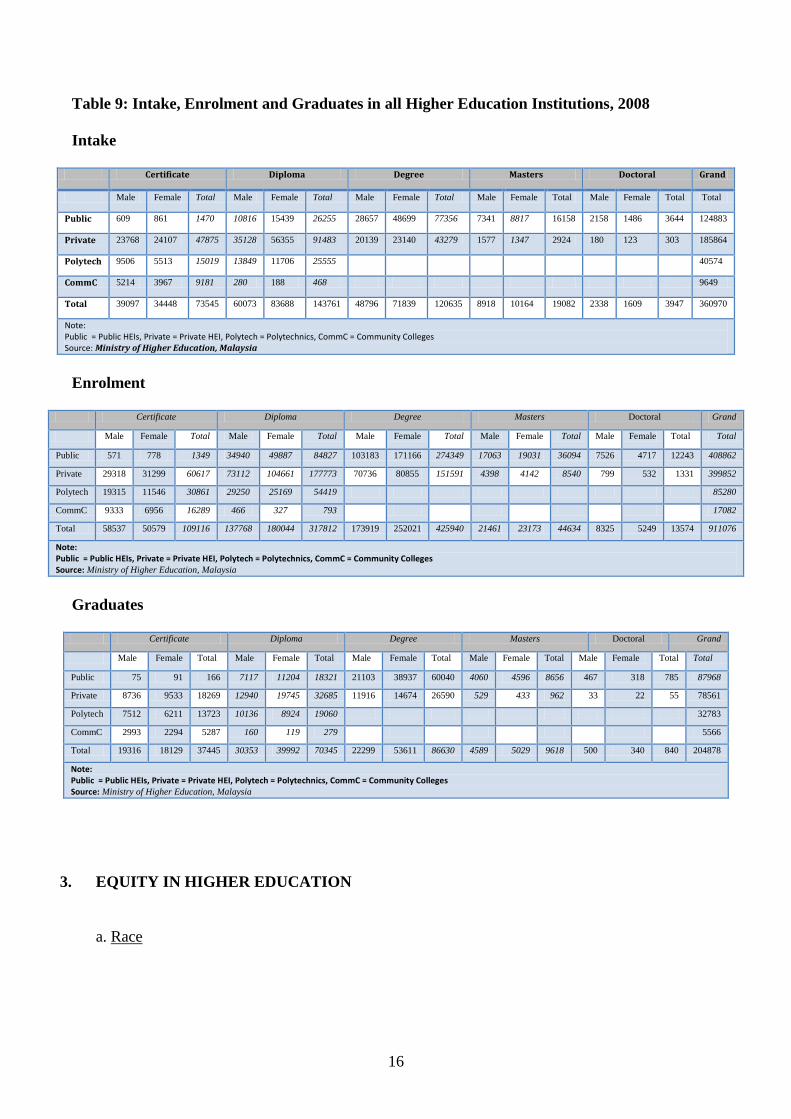
10 The overall status of HE enrolment for 2008 is portrayed in Table 9 where the total intake was
360,970. Intake in public HEIs was 124,883; private HEIs 185,864; polytechnics 40,574;
community colleges 9,649. Enrolment included 408,862 in public universities, 399,852 in

13
private institutions, 86,280 in polytechnics and 17,082 in community colleges, a total of
911,076. Graduate output has kept pace with intake and enrolment.
11 Opportunities for higher education have improved very significantly over the last 25 years.
This is the result of a greatly expanded public higher education system and an equally vibrant
and expanding private higher education system. There would appear to be a place for all
seeking higher education. Large numbers are accommodated in the public sector which is
heavily subsidized, and the rest seek places at a cost in the private sector, or at an even greater
cost in HEIs overseas.
Table 4: Expansion in Enrolment by Educational Level, 1985-2008
1985 1990 1995 2000 2005 2008 % increase
in
enrolment
1985-2008
%
Annual
rate
increase
1985-2008
Primary 2 191
676
2 447
206
2 827
627
- 3 137
280
3 154
090
30.5 1.3
Secondary* 1 251
447
1 366
068
1 589
584
- 2 217
749
2 310
660
45.8 2.0
Tertiary** 64 025 99 687 146 581 - 463 582 921 548 93.1 4.1
Total 3 507
148
3 912
961
4 563
792
- 5 818
611
6 386
298
45.1 2.0
Note:
* Figures include Form Six
** Figures include enrolment in pre-university and matriculation courses in public higher education institutions
Source: Ministry of Education, Malaysia
Table 5: Percentage Population Age 19-24 enrolled in Tertiary Education
Year Population Enrolment %
1970 1,420,687 8,633 0.6
1980 1,624,274 26,410 1.6
1990 2,028,100 58,286 2.9
2000 2,626,900 211,484 8.1
2005* 3,353,600 649,653 19.4
2007* 3,474,200 847,485 24.4
Note: * Age 18-24. Source: Ministry of Education, Pembangunan Pendidikan 2001-2010, Source: Department of Statistics and MOE, Educational Statistics. MOHE Website

14
Table 6: Number of employed persons by highest certificate obtained, 1985, 1990, 2000, 2001,
2005 and 2008 (000)
Year Total Diploma Degree
N % N %
1985 5,653.4 150.8 2.7 120.2 2.1
1990 6,685.0 216.8 3.2 165.8 2.5
2000 9,269.2 535.1 5.8 471.3 5.1
2001 9,357.0 564.5 6.0 533.9 5.7
2005 10,045.4 840.7 8.4 733.5 7.3
2008 10,659.6 786.1 7.4 874.1 8.2
Source: Labor Force Survey, 1985-2008
Table 7: Intake, Enrolment and Graduates of Public Higher Education Institutions, 1987-2008
INTAKE Date Certificate Diploma Degree Masters Doctoral Total
N % N % N % N % N % N %
1995 5810 12.1 13513 28.2 23901 49.8 4568 9.5 212 0.04 48004 100.0
2000 13440 10.9 33403 27.1 60285 48.9 15512 12.6 780 0.6 123420 100.0
2005 13952 10.5 43807 32.9 57863 43.4 14930 11.2 2722 2.0 139274 100.0
2008 25670 14.6 52278 29.9 77356 44.2 16158 9.2 3644 2.1 175104 100.0
Note: Data Includes public universities, teacher training colleges, MARA Institute of Technology, polytechnics, Tunku Abdul Rahman College and Community Colleges. 2008 MOE –excludes teacher training colleges. Source: 1987-2005 Ministry of Education: Educational Statistics of Malaysia
ENROLMENT Date Certificate Diploma Degree Masters Doctoral Total
N % N % N % N % N % N %
1987 8537 7.8 54318 49.4 43430 39.5 3252 3.0 381 0.3 109918 100.0
1990 9907 9.8 32588 32.2 53557 53.0 4499 4.9 539 0.5 101090 100.0
1995 15226 7.7 93506 47.5 79227 40.2 7622 3.9 1255 0.6 196836 100.0
2000 27830 8.8 129177 41.0 137538 43.5 19045 6.0 2813 0.9 316403 100.0
2005 35380 8.3 139562 32.6 210973 49.3 34969 8.1 6733 1.6 427617 100.0
2008 48499 9.5 140039 27.4 274349 53.7 36094 7.1 12243 2.4 511224 100.0
Note: Data Includes public universities, teacher training colleges, MARA Institute of Technology, polytechnics, Tunku Abdul Rahman College and Community Colleges. 2008 MOE –excludes teacher training colleges. Source: 1987-2005 Ministry of Education: Educational Statistics of Malaysia
GRADUATES Date Certificate Diploma Degree Masters Doctoral Total
N % N % N % N % N % N %
1987 2469 13.3 6227 33.6 8420 45.4 1388 7.5 25 0.1 18529 100.0
1990 3154 13.2 8101 33.9 10932 45.7 1710 7.1 27 0.1 23924 100.0
1995 5017 13.8 11678 33.2 16432 45.3 3084 8.5 73 0.2 36284 100.0

15
2000 8792 12.6 23364 33.6 33095 47.6 4199 6.0 148 0.2 69598 100.0
2005 7848 6.7 56010 48.0 45618 39.1 6309 5.4 857 0.7 116642 100.0
2008 19176 15.2 37660 29.8 60040 47.5 8656 6.9 785 0.6 126317 100.0
Note: Data Includes public universities, teacher training colleges, MARA Institute of Technology, polytechnics, Tunku Abdul Rahman College and Community Colleges. 2008 MOE –excludes teacher training colleges. Source: 1987-2005 Ministry of Education: Educational Statistics of Malaysia
Table 8: Enrolment, Intake and Graduates in Private Higher Education, 2002-2008
ENROLMENT Year Certificate Diploma Degree Master's Doctoral Grand total
N % N % N % N % N % N %
2002 93393 31.7 129929 44.1 67062 22.8 4019 1.3 197 0.1 294600 100
2004 84212 26.1 130265 40.3 105325 32.6 2981 0.9 108 0.1 322891 100
2006 68442 21.1 123937 38.3 124071 38.3 6477 2 860 0.3 323787 100
2008 60617 15.2 177773 44.5 151591 38 8540 2.1 1331 0.2 399852 100
Source: Ministry of Higher Education, Malaysia
INTAKE Year Certificate Diploma Degree Master's Doctoral Grand total
N % N % N % N % N % N %
2002 72 344 43.6 62 701 37.8 28 626 17.3 2035 1.2 57 0.1 165763 100
2004 57 961 34.1 69 573 40.9 40 742 23.9 1497 0.9 61 0.2 169834 100
2006 40 860 28.2 56 774 39.2 43 490 30 3301 2.3 350 0.3 144775 100
2008 47 875 25.8 91 483 49.2 43 261 23.3 2924 1.6 303 0.1 185846 100
Source: Ministry of Higher Education, Malaysia
GRADUATES Year Certificate Diploma Degree Master's Doctoral Grand total
N % N % N % N % N % N %
2002 62332 44.8 55988 40.2 20255 14.6 571 0.4 4 0 139150 100
2004 60073 44.5 56060 41.5 18385 13.6 423 0.3 46 0.1 134987 100
2006 18046 21.7 36321 43.7 27176 32.7 1592 1.8 51 0.1 83186 100
2008 18269 23.3 32685 41.6 26590 33.8 962 1.2 55 0.1 78561 100
Source: Ministry of Higher Education, Malaysia
16
Table 9: Intake, Enrolment and Graduates in all Higher Education Institutions, 2008
Intake
Certificate Diploma Degree Masters Doctoral Grand
Male Female Total Male Female Total Male Female Total Male Female Total Male Female Total Total
Public 609 861 1470 10816 15439 26255 28657 48699 77356 7341 8817 16158 2158 1486 3644 124883
Private 23768 24107 47875 35128 56355 91483 20139 23140 43279 1577 1347 2924 180 123 303 185864
Polytech 9506 5513 15019 13849 11706 25555 40574
CommC 5214 3967 9181 280 188 468 9649
Total 39097 34448 73545 60073 83688 143761 48796 71839 120635 8918 10164 19082 2338 1609 3947 360970
Note: Public = Public HEIs, Private = Private HEI, Polytech = Polytechnics, CommC = Community Colleges Source: Ministry of Higher Education, Malaysia
Enrolment
Certificate Diploma Degree Masters Doctoral Grand
Male Female Total Male Female Total Male Female Total Male Female Total Male Female Total Total
Public 571 778 1349 34940 49887 84827 103183 171166 274349 17063 19031 36094 7526 4717 12243 408862
Private 29318 31299 60617 73112 104661 177773 70736 80855 151591 4398 4142 8540 799 532 1331 399852
Polytech 19315 11546 30861 29250 25169 54419 85280
CommC 9333 6956 16289 466 327 793 17082
Total 58537 50579 109116 137768 180044 317812 173919 252021 425940 21461 23173 44634 8325 5249 13574 911076
Note: Public = Public HEIs, Private = Private HEI, Polytech = Polytechnics, CommC = Community Colleges Source: Ministry of Higher Education, Malaysia
Graduates
Certificate Diploma Degree Masters Doctoral Grand
Male Female Total Male Female Total Male Female Total Male Female Total Male Female Total Total
Public 75 91 166 7117 11204 18321 21103 38937 60040 4060 4596 8656 467 318 785 87968
Private 8736 9533 18269 12940 19745 32685 11916 14674 26590 529 433 962 33 22 55 78561
Polytech 7512 6211 13723 10136 8924 19060 32783
CommC 2993 2294 5287 160 119 279 5566
Total 19316 18129 37445 30353 39992 70345 22299 53611 86630 4589 5029 9618 500 340 840 204878
Note: Public = Public HEIs, Private = Private HEI, Polytech = Polytechnics, CommC = Community Colleges Source: Ministry of Higher Education, Malaysia
3. EQUITY IN HIGHER EDUCATION
a. Race
17
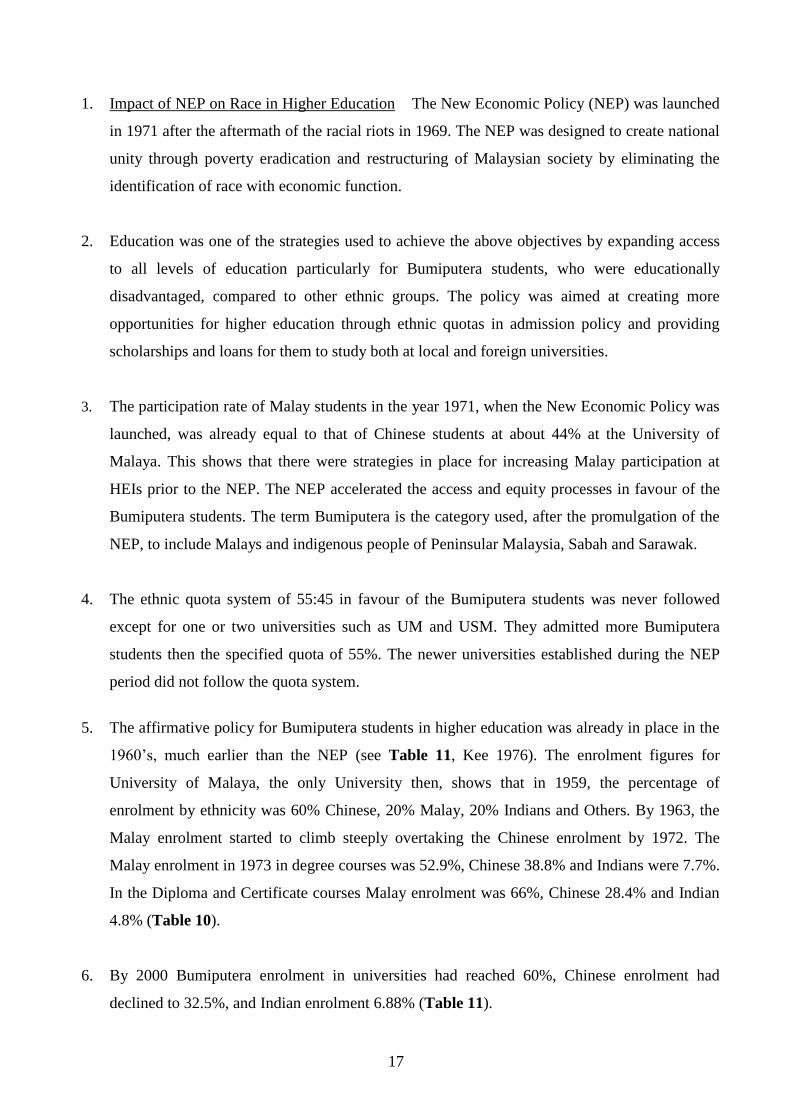
1. Impact of NEP on Race in Higher Education The New Economic Policy (NEP) was launched
in 1971 after the aftermath of the racial riots in 1969. The NEP was designed to create national
unity through poverty eradication and restructuring of Malaysian society by eliminating the
identification of race with economic function.
2. Education was one of the strategies used to achieve the above objectives by expanding access
to all levels of education particularly for Bumiputera students, who were educationally
disadvantaged, compared to other ethnic groups. The policy was aimed at creating more
opportunities for higher education through ethnic quotas in admission policy and providing
scholarships and loans for them to study both at local and foreign universities.
3. The participation rate of Malay students in the year 1971, when the New Economic Policy was
launched, was already equal to that of Chinese students at about 44% at the University of
Malaya. This shows that there were strategies in place for increasing Malay participation at
HEIs prior to the NEP. The NEP accelerated the access and equity processes in favour of the
Bumiputera students. The term Bumiputera is the category used, after the promulgation of the
NEP, to include Malays and indigenous people of Peninsular Malaysia, Sabah and Sarawak.
4. The ethnic quota system of 55:45 in favour of the Bumiputera students was never followed
except for one or two universities such as UM and USM. They admitted more Bumiputera
students then the specified quota of 55%. The newer universities established during the NEP
period did not follow the quota system.
5. The affirmative policy for Bumiputera students in higher education was already in place in the
1960’s, much earlier than the NEP (see Table 11, Kee 1976). The enrolment figures for
University of Malaya, the only University then, shows that in 1959, the percentage of
enrolment by ethnicity was 60% Chinese, 20% Malay, 20% Indians and Others. By 1963, the
Malay enrolment started to climb steeply overtaking the Chinese enrolment by 1972. The
Malay enrolment in 1973 in degree courses was 52.9%, Chinese 38.8% and Indians were 7.7%.
In the Diploma and Certificate courses Malay enrolment was 66%, Chinese 28.4% and Indian
4.8% (Table 10).
6. By 2000 Bumiputera enrolment in universities had reached 60%, Chinese enrolment had
declined to 32.5%, and Indian enrolment 6.88% (Table 11).

18
7. These were degree awarding institutions and there were other non-degree awarding institutions
established prior to NEP in 1971 and they were MARA Institute of Technology (1965), Tunku
Abdul Rahman College (1969) and Ungku Omar Polytechnic (1969).
8. These institutions were established on the recommendations of the Report of the Higher
Education Planning Committee (HEPC) published in 1967. Owing to the democratization of
educational facilities at the primary, secondary and post-secondary levels, pressure was built-
up for places at the tertiary level. For example in 1965, there were only 3,955 sixth form
student in 1973, this figure increased more to than three-fold to 13,727 (Kee, 1976, p14).
9. Higher educational planning over the last decade has already achieved its objectives of
providing more places in tertiary institutions and to increase the Malay student participation in
tertiary education as shown in Table 11 below;
10. The NEP further provided the impetus to recruit more Bumiputera students into higher
education through the establishment of MARA (Indigenous Peoples Trust Council) colleges,
matriculation programs and provision of university scholarships exclusively for Bumiputera
students.
11. The intake of Bumiputera students into public universities after the NEP was accelerated
without abatement, as Table 13 shows. The affirmative policies introduced have increased
access to higher education for Bumiputeras in the public HEIs. It is to be noted that MARA
Institute of Technology only catered for Malay students by a special provision. It was upgraded
to University Technology MARA in 1999 and has about 130,000 Malay students. Non-
Bumiputera students have had greater access to higher education through the private education
route but are disadvantaged by the higher fees. The poor may not be able to pay these fees and
therefore denied an opportunity to obtain higher education.
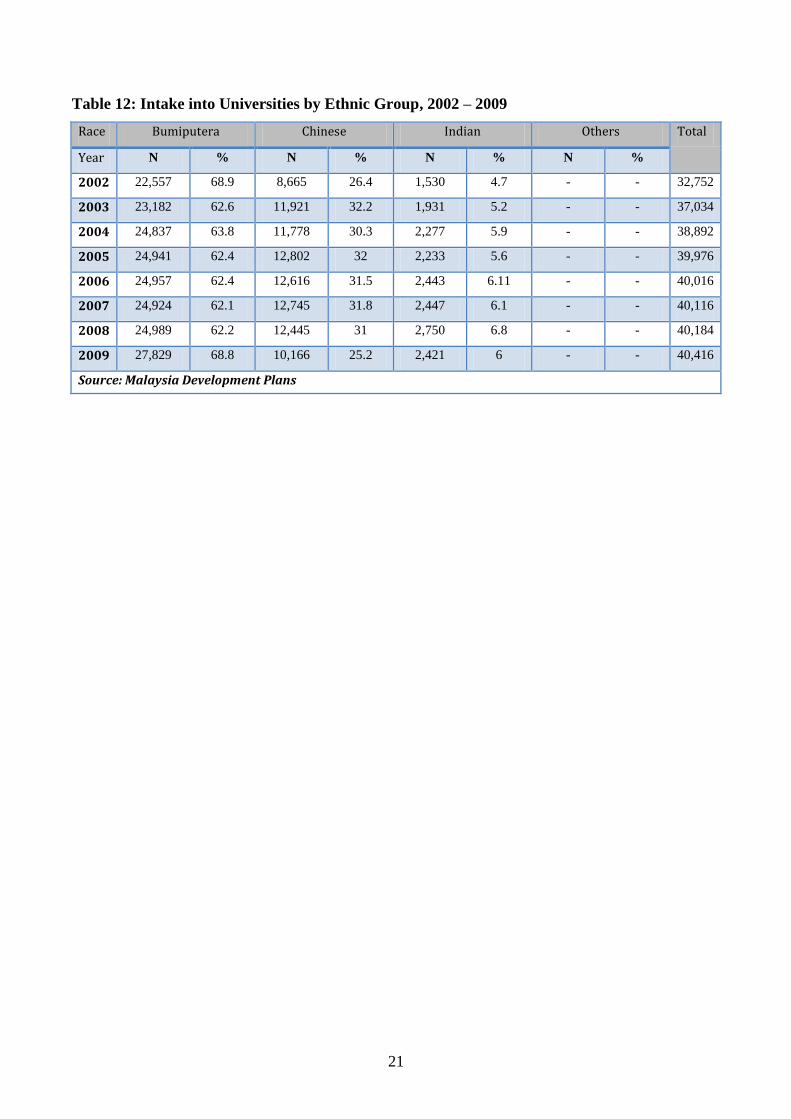
12. In 2002, the admission policy changed from the ethnic quota system to meritocracy. Even
under the meritocracy policy, intake of ethnic groups seems to have normalized, that is,
matched the population distribution. The Bumiputera intake has been maintained since 2002 at
60% with Chinese at 30% and Indians about 6% over the eight year period (Table 12).

19
13. Tables 12 and 13 (below) show the full impact of NEP policy on higher education.
Bumiputera enrolment into Universities, Polytechnics and Community Colleges shows a
significant difference between the intake and enrolment figures. Taking enrolment in the total
higher education system, Bumiputera enrolment for the four-year period between 2005-2008 in
public universities has been over 80%, for the Chinese about 12%, Indians 3% and Others
2.7%. Bumiputera enrolment in Polytechnics and Community Colleges have been maintained
over 90%, whereas the Chinese enrolment has varied between 2% - 4%, the Indians between
3% - 4% and Others between 1% - 2%.
14. As for the total enrolment in public institutions of higher education between 2005 – 2008,
Bumiputera enrolment has been above 84%, Chinese at 10%, Indians at 3% and Others at
2.4%.
15. In the period following the implementation of the NEP, it would appear from the data available
that the affirmative action policy in education has indeed increased enrolments of Bumiputera
students in higher education in Malaysia. This is also true for non-Bumiputera student
participation, but not to the same magnitude.

20
Table 10: Enrolments in tertiary education by ethnic group, 1973/74
Ethnicity Malays Chinese Indians Others Total
Institutions
Degree Courses
University of Malaya 4,000 3,592 755 34 8,381
Science University 511 836 128 28 1,483
National University 1,415 34 9 31 1,489
Agricultural University 75 34 3 2 114
National Institute of Technology 192 46 1 - 239
Sub-Total 6193
(52.9%)
4542
(38.8%)
896
(7.65%)
95
(0.81%)
11,705
Diploma & Certificate Courses
Agricultural University 1,168 177 13 26 1,397
National Institute of Technology 1,082 149 11 4 1,246
MARA Institute of Technology 3,997 - - 24 4,021
Ungku Omar Polytechnic 705 186 27 - 918
Tunku Abdul Rahman College 2 613 - - 615
Total Enrolment at all levels 13,142 5,667 947 149 19,903
Percentage Distribution by Ethnicity 66 28.4 4.8 0.8 100%
Note:
Data do not include some 26,580 Malaysian students enrolled in overseas institutions, a significant portion of who
are tertiary students and Chinese.
Source:
Compiled from data obtained from Mid-Term Review of Second Malaysia Plan, 1971-75, and data obtained from
institution sources.
Table 11: Enrolment in Universities by Ethnic Group, 1980 - 2000
Race Bumiputera Chinese Indian Others Total
Year N % N % N % N %
1980 73,315 49.24 54,664 36.71 12,819 8.61 8,091 5.43 148,889
1990/ 91 317,937 59.65 171,264 32.13 33,410 6.27 10,408 1.95 533,019
2000 827,593 59.92 449,103 32.52 93,973 6.8 10,494 0.76 1,381,163
Source: Malaysia Development Plans
21
Table 12: Intake into Universities by Ethnic Group, 2002 – 2009
Race Bumiputera Chinese Indian Others Total
Year N % N % N % N %
2002 22,557 68.9 8,665 26.4 1,530 4.7 - - 32,752
2003 23,182 62.6 11,921 32.2 1,931 5.2 - - 37,034
2004 24,837 63.8 11,778 30.3 2,277 5.9 - - 38,892
2005 24,941 62.4 12,802 32 2,233 5.6 - - 39,976
2006 24,957 62.4 12,616 31.5 2,443 6.11 - - 40,016
2007 24,924 62.1 12,745 31.8 2,447 6.1 - - 40,116
2008 24,989 62.2 12,445 31 2,750 6.8 - - 40,184
2009 27,829 68.8 10,166 25.2 2,421 6 - - 40,416
Source: Malaysia Development Plans

22
Table 13: Enrolment in Public Higher Education Institutions by Ethnicity, 2005-2008
Year & Race
Universities Polytechnics Community Colleges
Total
N % N % N % N %
2005
Bumiputera 207021
81.8
72.8
68264 92.5
24.0
9205 92.7
3.2
284490 84.4 100.0
Chinese 33484
13.2
92.2
2656 3.6
7.3
172 1.7
0.5
36312 10.8 100.0
Indian 7838 3.1
75.5
2169 2.9
20.9
373 3.8
3.6
10380 3.1 100.0
Other 4675
1.9
83.5
745 1.0
13.3
179 1.8
3.2
5599 1.7 100.0
Total 253018
100.0
75.1
73834 100.0
21.9
9929 100.0
3.0
336781 100.0 100.0
2006
Bumiputera 237886
80.8
73.4
75901 92.1
23.4
10363 91.9
3.2
324150 83.5 100.0
Chinese 38430
13.0
91.6
3307 4.0
7.9
231 2.0
0.5
41968 10.8 100.0
Indian 9073
3.1
76.0
2405 2.9
20.2
457 4.1
3.8
11935 3.1 100.0
Other 9132
3.1
90.0
799 1.0
7.8
222 2.0
2.2
10153 2.6 100.0
Total 294521
100.0
75.9
82412 100.0
21.2
11273 100.0
2.9
388206 100.0 100.0
2007
Bumiputera 304719
82.9
77.1
77542 92.0
19.6
12860 91.8
4.3
395121 84.8 100.0
Chinese 41863
11.5
91.5
3591 4.3
7.9
287 2.0
0.6
45741 9.8 100.0
Indian 10422
2.8
78.1
2357 2.8
17.7
557 4.0
4.2
13336 2.9 100.0
Other 10448
2.8
90.7
760 0.9
6.6
307 2.2
2.7
11515 2.5 100.0
Total 367452
100.0
78.9
84250 100.0
18.1
14011 100.0
3.0
465713 100.0 100.0
2008
Bumiputera 333235
83.1
78.0
78123 91.6
18.3
15706 91.9
3.7
427064 84.8 100.0
Chinese 45062
11.2
91.9
3645 4.3
7.4
323 1.9
0.7
49030 9.7 100.0
Indian 10901
2.7
76.5
2678 3.1
18.8
675 4.0
4.7
14254 2.8 100.0
Other 11975
3.0
90.8
834 1.0
6.3
378 2.2
2.9
13187 2.6 100.0
Total 401173
100.0
79.7
85280 100.0
16.9
17082 100.0
3.4
503535 100.0 100.0
Source: Ministry of Higher Education
23
b. Gender
1 This section demonstrates advances women have made in obtaining access to higher education
since the 1980s and the extent to which different groups of women have achieved equitable
access. The development of higher education policies were not gender specific, however,
policies directed to increasing access to higher education benefited women’s participation.
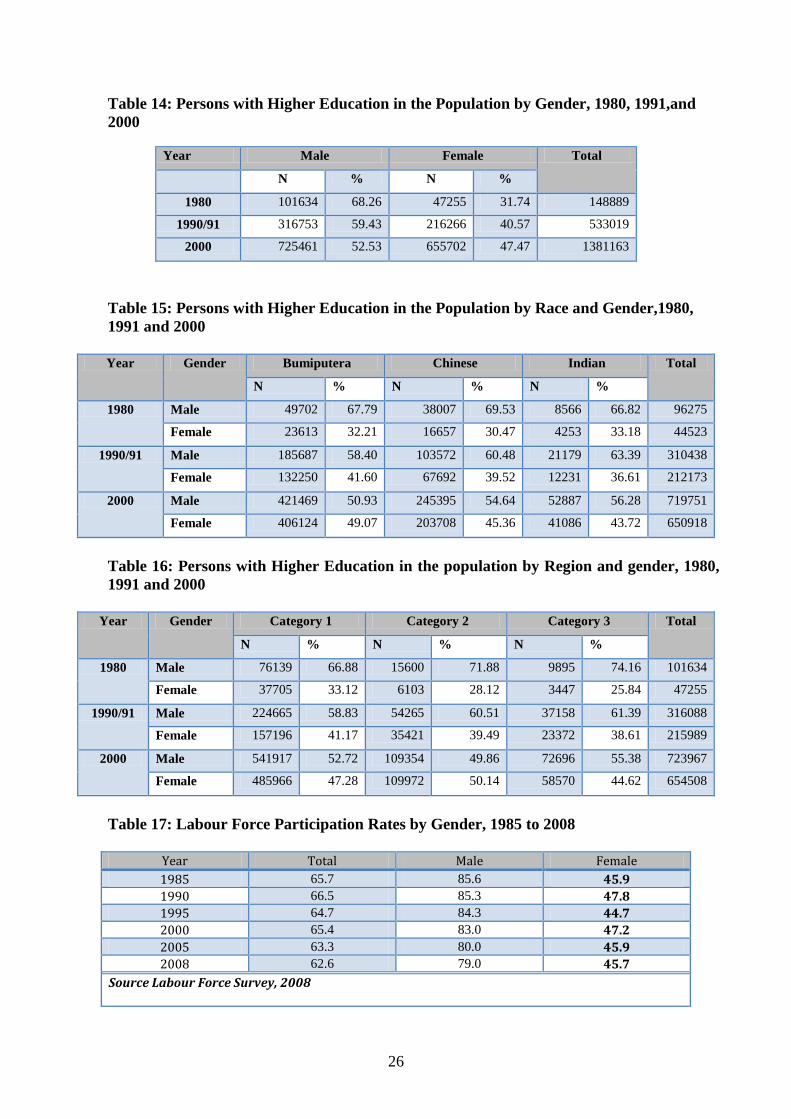
2 The percentage of women with higher education in the total population vis-à-vis men has
gradually increased over time. In 1980 women comprised 31.7 percent of persons with higher
education. This increased to 40.6 percent in 1991 and further increased to 47.5 percent in 2000
(Table 14).
3 The largest increase in the proportion of women in the population with higher education is seen
among Bumiputera women, increasing from 32.2 percent in 1980 to 49.1 percent in 2000, an
increase of 17 percent. Chinese women in the population with higher education increased by 15
percent while Indian women increased by 10 percent (Table 15).
4 In terms of regional differences, women in Sabah and Sarawak had the lowest percentage of
the population with higher education, ranging from 25.8 percent in 1980 to 38.6 in 1991 and
44.6 in 2000, compared with women in the more developed peninsular west coast states,
where of those with higher education women constituted 33.1 percent in 1980, 41.2 percent in
1991and 47.3 percent in 2000. (Table 16)
5 There is very little difference among the races in terms of women’s participation in the labor
force. Between 1985 and 2008 women’s participation rate stood around 45 percent. (Table 17).
However, tertiary education improved chances for all women to participate in the labor force
but opportunities for women from different geographical and ethnic backgrounds were
unequal. In 2008, women with tertiary education in urban areas had a participation rate of 62.0
percent but those in rural areas had a rate of 51.9 percent. Urban women of all ethnic groups
had fairly similar opportunities: 68.3 percent Bumiputera women, 69.3 percent Chinese women
and 66.9 percent Indian women were in the labor force. In the rural areas Bumiputera women
had the lowest participation rate (57.7 percent) compared with Chinese women (64.2 percent)
and Indian women (62.3 percent). (Labour Force Survey, 2008: 77- 89).

24
6 Labor force data from 1985 to 2008 further confirms that women with tertiary education have
greatly increased their participation in the work force. Table 18 demonstrates that of those
employed with diplomas the percentage of women had increased from 40.5% in 1985 to 49.9%
in 2008 while among those employed with degrees the percentage of women had dramatically
increased from 23.8% in 1985 to 46.2% in 2008.
7 Despite the progress made by women, it should be noted that in 2008 more than 70% of the
population outside the labor force were women. Women with tertiary education also lagged
behind their male counterparts in the labor force. In 2008, of those with the highest
qualification, that is degree level, men had 92.8 percent participation rate while women had a
lower participation rate at 84.5 percent. Among diploma holders men had a participation rate of
88.7 percent and women 79.3 percent (Labor Force Survey, 2008: 61).
8 Women have increasingly enjoyed better training and learning opportunities since the 1970s. In
the local higher education institutions enrolment steadily shifted in favor of women. For
instance, at the University of Malaya, in 1970, there were 5512 or 70.8% male students and
2263 or 29.1% female students. This picture had changed dramatically by 1995 when there
were 7047, or 42.9% male students to 9374, or 57.1% female students. By 2008, the balance
had further shifted in favor of women with 16,567 women or 59.0 percent women enrolled at
University of Malaya.
9 Women’s enrolment at all levels of higher education increased significantly between 1985 and
2008. Women have overtaken men at all levels of higher education except at the doctoral level.
Table 19 shows that in the public sector universities, polytechnics, community colleges,
teachers colleges and Tunku Abdul Rahman College women’s enrolment increased from 44.4
percent in 1987 to 56.6 percent in 2008.
10 Reliable data for private higher education institutions is only available for the period 2002-
2008. As shown in Table 6, enrolment in the private sector follows a similar pattern as the
public sector with women by 2008 overtaking their male colleagues. The data for 2008 shows
that in 2008 women made up 55.4 percent of all enrolment in private higher education
institutions.
25
11 Intake figures for the same period further enforce the view that women largely outnumber men
in entering the universities and colleges. In 2008 women’s intake in all tertiary institutions had
increased to 55.2 percent.
12 In 2008 women represented 57.2 percent of all graduates from higher education institutions. In
the public sector institutions 62.7 percent of graduates were women while in private
institutions 56.5 percent, in polytechnics 46.2 percent and in community colleges 43.4 percent
of graduates were women.
13 Women are beginning to represent a significant proportion in nontraditional, professional and
technical programs. In 2008 UTM enrolled 44.2 percent women while UPM enrolled 63.9
percent women. In 2008, women constituted 42.5 percent of enrolments in technical fields,
63.8 percent in information technology and communication studies and 68.4 percent in science
disciplines.
14 In private higher education institutions in 2008, 50.6 percent students enrolled in first degree
science and technological disciplines were women, in technical and vocational courses 24.0
percent students enrolled were women.
15 Women still dominate education, arts and social sciences. For instance in the public institutions
in 2008, 74.5 percent women enrolled for education and 73.5 percent women enrolled for arts
and social science disciplines.
16 Women’s participation in professional, managerial and technical occupations increased
between 2004-2008 and decreased in agricultural occupations.
26
Table 14: Persons with Higher Education in the Population by Gender, 1980, 1991,and
2000
Table 15: Persons with Higher Education in the Population by Race and Gender,1980,
1991 and 2000
Year Gender Bumiputera Chinese Indian Total
N % N % N %
1980 Male 49702 67.79 38007 69.53 8566 66.82 96275
Female 23613 32.21 16657 30.47 4253 33.18 44523
1990/91 Male 185687 58.40 103572 60.48 21179 63.39 310438
Female 132250 41.60 67692 39.52 12231 36.61 212173
2000 Male 421469 50.93 245395 54.64 52887 56.28 719751
Female 406124 49.07 203708 45.36 41086 43.72 650918
Table 16: Persons with Higher Education in the population by Region and gender, 1980,
1991 and 2000
Year Gender Category 1 Category 2 Category 3 Total
N % N % N %
1980 Male 76139 66.88 15600 71.88 9895 74.16 101634
Female 37705 33.12 6103 28.12 3447 25.84 47255
1990/91 Male 224665 58.83 54265 60.51 37158 61.39 316088
Female 157196 41.17 35421 39.49 23372 38.61 215989
2000 Male 541917 52.72 109354 49.86 72696 55.38 723967
Female 485966 47.28 109972 50.14 58570 44.62 654508
Table 17: Labour Force Participation Rates by Gender, 1985 to 2008
Year Total Male Female
1985 65.7 85.6 45.9
1990 66.5 85.3 47.8
1995 64.7 84.3 44.7
2000 65.4 83.0 47.2
2005 63.3 80.0 45.9
2008 62.6 79.0 45.7
Source Labour Force Survey, 2008
Year Male Female Total
N % N %
1980 101634 68.26 47255 31.74 148889
1990/91 316753 59.43 216266 40.57 533019
2000 725461 52.53 655702 47.47 1381163

27
Table 18: Number of Employed Persons by Highest Certificate obtained and Gender
(000)
c. Socio-economic Status
1 A number of research studies in the 1970’s and 80’s attempted to assess the effectiveness of
NEP policies in eradicating social disadvantages. (A sample survey will be carried out to assess
the current SES in HEIs).
2 A study carried out on education and social mobility in Malaysia (Jasbir S Singh, 1973)
confirmed the central role of education in promoting upward social mobility in Malaysia. The
study demonstrated that Malays with low social origins were more likely than other races to
achieve higher education and move into high status jobs. Some evidence in the study points to
the fact that while inter-ethnic gaps were being reduced, the intra-ethnic gaps were increasing.
This seemed to be particularly so among the Bumiputera group.
3 While the NEP has brought some considerable social restructuring it has also extended the
dimensions of discord. Unexpectedly, class divisions appear to be sharper, making the problem
of national unity as, if not more, critical than before the NEP (Singh and Mukherjee, 1993).
Diploma Degree
N % N %
Male 89.7 59.5 91.7 76.2
1985 Female 61.1 40.5 28.5 23.8
Total 150.8 100.0 120.2 100.0
Male 120.6 55.6 114.8 69.2
1990 Female 96.2 44.4 51.0 30.8
Total 216.8 100.0 165.8 100.0
Male 288.3 53.9 300.9 63.8
2000 Female 246.8 46.1 170.4 36.2
Total 535.1 100.0 471.3 100.0
Male 460.2 54.7 421.1 57.4
2005 Female 380.5 45.3 312.4 42,6
Total 840.7 100.0 733.5 100.0
2008 Male 394.5 50.1 470.9 53.8
Female 391.6 49.9 403.2 46.2
Total 786.1 100.0 874.1 100.0
Source: Department of Statistics, Putra Jaya

28
4 A study to assess the role of the University of Malaya in enabling students from low status
families to pursue higher education was carried out in 1981 (Jasbir S Singh). The data
established conclusively that the University of Malaya very effectively promotes youths from
low status social origins to high professional occupations. A significantly high proportion of
students (58.9%) in the final year at the University of Malaya had parents who worked in
skilled, semi-skilled and manual occupations. Many of their parents were among the poor
farmers, rubber tappers, laborers and manual workers. Only a small proportion of the students
(12.4%) had parents in the high status group, that is, the professional, managerial and executive
groups (Table 20).
5 Despite gaining entrance to the university, the children from the low social origins suffered
some disadvantages when competing for places in the traditionally prestigious faculties of
Medicine, Law and Dentistry. Among the future doctors, lawyers and dentists there was high
recruitment from those of high and middle status parentage; only 21.6% of law students
originated in low social status compared with 62% Economics and 68% Education students.
6 The University of Malaya has acted almost equally as a channel of upward social mobility for
Bumiputera and Chinese students but to a lesser extent for Indian students.
7 In the mid 1980s a study on “University Education and Employment in Malaysia” (Unglue
Aziz et.al) surveyed sixth form students, undergraduates and graduates. The survey findings
show that the educational opportunities of the lower SES groups have been enhanced since the
implementation of the NEP. Larger proportions of sixth form students and undergraduates than
past graduates had fathers who were from the manual workers category (Table 21).
8 A study carried out in 1978 (Marimuthu T: 1984) on student development in Malaysian
universities assessed the socio-economic status of final year students in five Malaysian
universities. The study shows that only 2.7 percent of the students come from higher
socioeconomic status homes, and their fathers hold professional, managerial or executive
positions. The data on occupation is well reinforced by the data on income and education. A
similar proportion (2.7 percent) of the fathers earns incomes over $1,500 and 5.6 percent have
either a college or a university education. In fact, those who possess university education are a
minority (only 1 percent). About 20 percent of students come from homes which can be
considered as lower middle class homes where their fathers have a white collar job in a

29
supervisory, lower professional, technical, clerical or sales capacity. About three quarters of
the fathers hold jobs ranging from skilled to unskilled categories, have had primary education
or no education and are more likely to receive incomes below $400 per month (Table 22).
Table 20: Distribution of University of Malaya Students by Race and Social Origin
Race Fathers’ Status
High Middle Low Total Malay
No 34 68 133 235
% 14.4 28.9 56.7 100.0
Chinese
No 38 108 239 385
% 9.9 28.0 62.1 100.0
Indian
No 9 12 14 35
% 25.6 34.3 40.1 100.0
Total
No 81 188 386 655
% 12.4 28.7 58.9 100.0
Source:
Table 21: Distribution of Respondents by Fathers’ Occupation
Occupation of Father Graduates Undergraduates Sixth Form students
N % N % N %
Professional, managerial and
proprietorship
604 51.1 364 16.4 243 15.7
Clerical and sales, small business and
others
272 23.0 746 33.7 604 39.2
Manual 306 25.9 1,105 49.9 695 45.1
Total 1,182 100.0 2,215 100.0 1,542 100.0
Source:

30
Table 22: Occupational Status and Educational Level of Malaysian University Students, 1978
Occupation No
% Education No
% Income
RM No %
Professional/Managerial 19
2.7
University/College 39
5.6
1,500 and above 19 2.7
White collar/clerical 158
19.9
Secondary 14
20.4
700 to
1,499 86
12.4
Skilled 201
29.0
Completed Primary 167
24.1
400 to
699 151 27.8
Semi-skilled 68
9.8
Some Primary 215
31.0
200 to
599 196 28.3
Unskilled 173
25.0
No education 131
18.9
199 and
Below 241 34.8
Housewives/pensioners etc.
28
4.1
No information 66
9.5
Number Percentage
695
100
695
100
695 100
Source:
d. Region
1. Findings to date are based on data on employed persons in the labor force with tertiary
education, 1985-2008. A more comprehensive picture of the current situation will be obtained
from the sample survey currently being undertaken.
2 Between 1995 and 2008 percentage of persons with tertiary education in urban areas increased
from 15.0 percent to 25.0 percent. In rural areas percentage of persons with tertiary education
increased from 6.3 percent to 13.3 percent. The increase in the urban areas may partly be
explained by migration of rural folks with tertiary education into the urban areas in search of
better job opportunities and living conditions (Table 23)
3 Women have taken great strides in achieving higher education (Table 24). Of females in urban
areas percentage of women with higher education increased from 16.7 percent in 1995 to 30.2
percent in 2008, an increase of 13.5 percent. Over the same period, of women in rural areas,
percentage with higher education increased from 7.4 percent to 18.9 percent in 2008, an
increase of 11.5 percent.

31
4 However the gap in achieving higher education between rural and urban women has increased
over time. In 1995, a gap of 9.3 percent existed between urban and rural women; in 2008, a gap
of 11.3 existed between the percentage of women with higher education in urban and rural
areas.
5 Among the ethnic groups (Table 25), Bumiputeras in urban areas have the largest increase
(12.1 percent) in persons with tertiary education between 1995 and 2008. Over the same period
the Chinese have an increase of 10.7 percent and the Indians 8.4 percent. In the rural areas,
Bumiputera percentage of persons with tertiary education increased by 8.5 percent, the Chinese
by 5.0 percent and Indians by 5.2 percent.
6 Among all ethnic groups the gap between urban and rural areas in terms of the percentage of
persons with tertiary education has increased during the period 1995 and 2008 (Table 25). For
the Bumiputera, the gap between urban and rural increased from 10.1 percent to 13.1 percent;
for the Chinese the gap increased from 7.8 percent to 13.5 percent; and for the Indians the gap
increased from 9.0 percent to 12.2 percent.
7 There are significant differences among the three regions identified in terms of persons with
diploma qualifications (Table 26). In 1985, Category 1 states (western peninsular states) had
61.7 percent of all such persons, Category 2 states (eastern peninsular states) 27.6 persons and
Category 3 (Sabah and Sarawak) states 10.7 percent persons. By 2000, Category 1 states had
69.0 percent, Category 2, 17.3 percent and Category 3, 13.7 percent of persons with diploma
qualifications. The situation in 2008 was similar to that of 2005.
8 Among those with degree qualifications the highest number was also in Category 1 states. In
1985, 73.6 percent of degree holders were in Category 1, 13.3 percent in Category 2 and 13.1
percent in Category 3. The situation has not changed much between 1985 and 2008.

32
Table 23: Percentage Distribution of Persons Employed in the Labor Force with Tertiary
Education by Stratum, 1995-2008
Year Urban Rural
1995 15.02 6.32
2000 18.27 8.92
2004 22.92 9.72
2008 25.0 12.9
Source: Labour Force Survey Reports 1995-2008
Table 24: Percentage Distribution of Employed Persons in the Labor Force with Tertiary
Education by Stratum and Gender, 1995-2008
Year Gender Male Female Total
% %
1995 Urban 14.31 16.68 15.02
Rural 5.78 7.44 6.32
2000 Urban 16.98 20.49 18.27
Rural 7.75 11.38 8.92
2004 Urban 20.27 27.35 22.92
Rural 7.98 13.22 9.72
2008 Urban 21.8 30.2 25.0
Rural 10.1 18.9 12.9
Source: Labour Force Survey Reports 1995-2008
Table 25: Percentage Distribution of Employed Persons in Labor Force with Tertiary
Education by Stratum and Ethnic Group, 1995-2008
Year Gender Bumiputera Chinese Indian Others Total
1995 Urban 17.2 13.6 12.4 12.1 15.1
Rural 7.1 5.8 3.4 4 6.5
2000 Urban 21.5 17.9 14.6 8.5 19
Rural 9.9 11.6 7.5 3.4 9.7
2004 Urban 25.1 23.4 19.2 15.5 23.8
Rural 11.3 6.7 6.3 3.7 10.5
2008 Urban 29.3 24.3 20.8 10.5 25
Rural 15.6 10.8 8.6 9.4 13.3
Source: Labour Force Survey Reports 1995-2008

33
Table 26: Number and Percentage of Employed Persons by Highest Certificate Obtained and
Region, 1985-2008
Year Categories Diploma Degree
N % N %
1985 Category 1 92.9 61.73% 88.1 73.60%
Category 2 41.5 27.57% 15.9 13.28%
Category 3 16.1 10.70% 15.7 13.12%
Total 150.5 100.00% 119.7 100.00%
1990 Category 1 141.5 65.42% 123.3 74.68%
Category 2 51.4 23.76% 24.7 14.96%
Category 3 23.4 10.82% 17.1 10.36%
Total 216.3 100.00% 165.1 100.00%
2000 Category 1 368.7 69.03% 361.3 76.71%
Category 2 92.2 17.26% 63.8 13.55%
Category 3 73.2 13.71% 45.9 9.75%
Total 534.1 100.00% 471 100.00%
2005 Category 1 597.7 71.21% 555.6 75.91%
Category 2 138 16.44% 94 12.84%
Category 3 103.7 12.35% 82.3 11.24%
Total 839.4 100.00% 731.9 100.00%
2008 Category 1 541.5 69.03% 628.9 72.10%
Category 2 141.7 18.06% 136.7 15.67%
Category 3 101.2 12.90% 106.7 12.23%
Total 784.4 100.00% 872.3 100.00%
Note:
Category 1 = Western Peninsular States
Category 2 = Eastern Peninsular States
Category 3 =Sabah and Sarawak
Source: Department of Statistics, Putra Jaya
e. Scholarships and Loans
1. Discussions on access and equity issues in higher education cannot be complete without some
discussion of the means by which access and equity is demonstrated. The current system by
which higher education students are financed impacts on both access and equity.
2. Higher education in Malaysia falls under the purview of the Ministry of Higher Education,
which is responsible for the funding of the public higher education sector. As the main
provider of financial support, MOHE supports public sector higher education not only by
heavily subsiding the operations of the institutions, but also as a major source of funding
through scholarships and loans .

34
3. Higher education funding for the purpose of this discussion incorporates all forms of funding,
loans and scholarships/sponsorship. The financing of higher education in Malaysia is thus
fairly straightforward as it follows the trend that is observable in almost all developing
countries of the world. That is, a high proportion of expenditure is from the central government
budget through the Ministry of Higher Education or other departments. The others are local
communities, families and individuals, non-governmental organizations (NGOs), private
enterprises and corporations as well as foreign aid. The other sources of financing education in
can be highlighted as follows and a brief summary of the categories and the distinguishing
features are given in Table 27 below.
i. State or Local authorities - in the form of school construction, land donation, e.g.
Selangor government and UNISEL
ii. Foreign aid - mainly in the form of scholarships and capital investment, e.g. The
Chevening award, Commonwealth and Fulbright Scholarships.
iii. Families, individual and communities - usually in the form of family sponsorship,
grants, donation and contributions.
iv. Enterprises, corporations, and estates – mainly in the form of scholarships, donations
and loans, e.g. The Star Education Fund, The Kuok Foundation, Sime Darby group of
companies.
v. Political Parties – MIED, Kojadi.
vi. Non-governmental organizations and religious bodies – largely providing loans,
scholarships e.g. MAPCU and NAPEI [need to spell these out]
4. There are various organizations that provide financial assistance to students pursuing higher
education by various means such as scholarship, sponsorship and loans. Case studies of two
such organizations are given as illustration. The National Higher Education Fund Corporation
(or its Malaysian acronym PTPTN) and the Public Service Department (or its Malaysian
acronym JPA) provide higher education loans and scholarships respectively.
5. The PTPTN Story: PTPTN was established under the National Higher Education Fund Act
1997 (Act 566). It began its operations on 1st November 1997. The objective of PTPTN is to
ensure efficient loan financing for students who are eligible to pursue studies at institutions of
higher learning. This is in line with the government aspiration that no Malaysian should be
denied access to higher education. This body was set up to manage the disbursement of public

35
funds for the purpose of higher education through low interest student loans. The most recent
development (Budget 2010) saw a further extension of this function where loan holders with a
first class honors degree will now be able to convert their loan retroactively into a scholarship.
6. PTPTN loans are open to students from both public and private sector HEIs and loans are
given out in three categories summarized in Table 28 below:
i. full loan is given to students from families with income below RM. 3000 a month (or
less than approximately USD 900 per month);
ii. partial loan 1 is given to students from families with income between RM3001 and RM
5 000 a month (or USD 1 001 and 1380 per annum), loans are given to fully cover the
tuition fees and a portion for subsistence;
iii. partial loan 2 is given to students from families with monthly income of above RM
5001 (or USD 1381 and above) will only be eligible for loan up to the maximum of
their tuition fee.
7. PTPTN has in the last 10 years provided higher educational loans to the amount of RM 26.2
billion, benefitting about 1.3 million students. In 1997, PTPTN approved 12 000 applications
and in 2008 the number of approvals increased to 97 000. This shows a marked achievement
by the government of Malaysia if seen from the pre-1999 era where loans were not available to
students especially those wishing to pursue higher education in private HEIs. The availability
of study loans has increased enrolment in the private higher education sector, now at 50% of
the total student enrolment in the country.
8. Provision for loans is equitable and as demonstrated in Appendix X, there is no gender bias in
the approval of loans. The number of loans to female applicants exceeds that of male
applicants. In 2008, there were about 60 000 male applicants who had obtained loans whilst in
the same year, the number of approvals for female students were close to 100 000. Comparing
Gender in relation to student intake for Certificate, Diploma and Degree (as loans are only
provided for these levels of qualifications) to total number of students who had obtained loans
in Table 29 below shows no discrimination in terms of gender in accessing loans.
9. However, there are slight variations in relation to ethnic composition of students who had
obtained loans from PTPTN. The data can only be tabulated for the year 2000 as enrolment
36
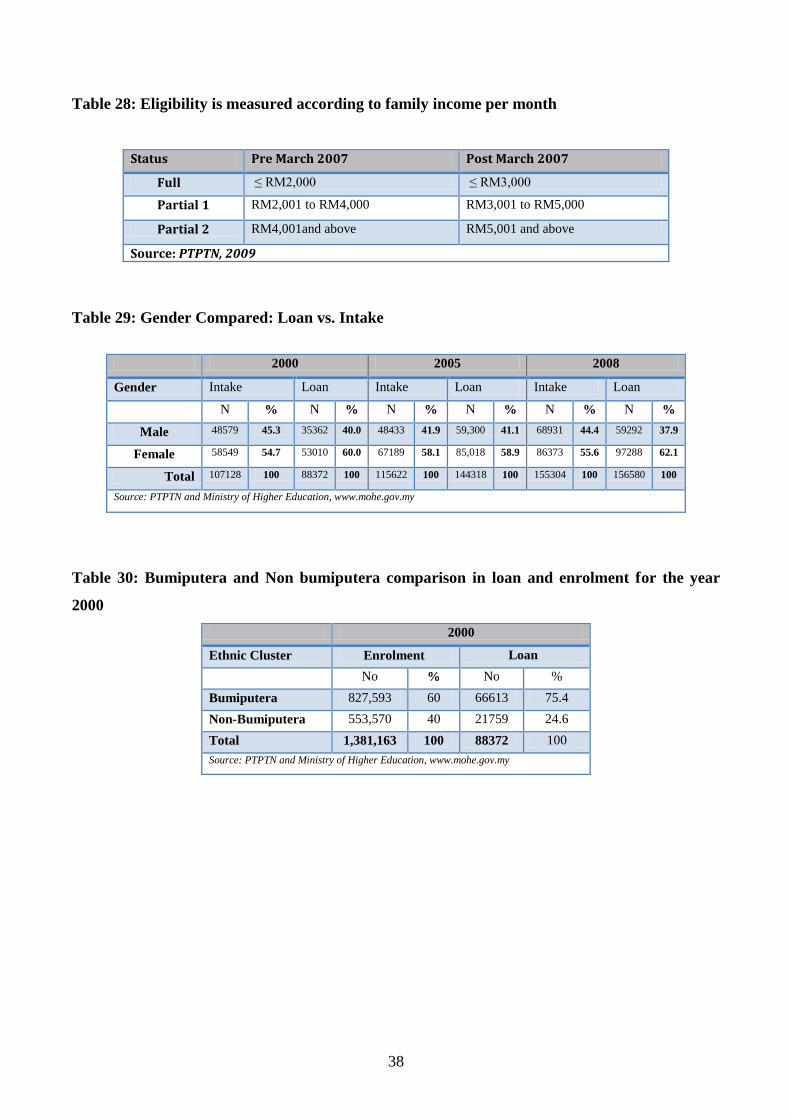
data for other years are not available by ethnic group. Table 30 shows the variation; that whilst
there are 60% bumiputera students in HE for the year 2000, 75.4% had obtained loans from
PTPTN as opposed to non-bumiputera students which was at 24.6% even though the total
enrolment was at 40%. One possible explanation for this is the SES of the student. Note:
PTPTN data based on student enrolment.
10. The Scholarship Story: The government of Malaysia, through the Public Services
Department, provides scholarships to students based on academic merit. These scholarships are
usually provided to students pursuing a course study in local and foreign institutions and a
large percentage of which is allocated for disciplines deemed critical such as medicine and
pharmacy.
11. There has been gradual growth in the number of scholarships provided and the increase is
significant particularly for study in the local HEIs. For example in 2000, a total of 3763 grants
were provided and this increased to 10 000 in 2008. Increases albeit on a smaller scale are
shown in the total number of scholarships to foreign HEIs; from 748 in 2000, to 2000 in 2008.
The smaller increase in foreign scholarship can be attributed to the higher cost of study and the
increase in the local provision of foreign programs through twinning and 3+0 and branch
campuses.
12. The data however show inequity in the division of scholarship according to ethnic lines. For
example, the number of Bumiputera students who had successfully obtained scholarships to
pursue a course of study internationally in 2000 was 598 whilst in the same year only 150 non
Bumiputeras were successful. Similarly in 2008, the Bumiputera recorded 1100 compared to
900 non Bumiputera students. On the domestic front, in 2000, 3444 Bumiputera and 319 were
non bumiputera. In 2008 figures were 7826 and 2174 respectively.
13. When put against the data on student enrolment, there is clear disparity in the number of
students from the non Bumiputera group obtaining scholarships and this is clear from the
figures in Table 31 below.

37
14. The conclusion from the data on loan and scholarship paints a picture of inequality in the
distribution of grants to students according to racial lines. It shows that whilst there is access to
higher education, this access may not be equitable.
15. There is no available data on the socio-economic status of the recipients of scholarships, hence
no conclusion can be made as to disparity if any in the provision for scholarships. Equal access
to education presupposes equity so that a fairness-preserving shift to an efficient allocation
could produce an allocation that is both efficient and fair. This cannot be seen in the way
scholarships are awarded.
16. In relation to loans, one can presuppose that Bumiputeras are in the lower bracket of Malaysian
society and therefore are more eligible than non Bumiputeras. However this was be shown in
the light of new data on student SES categories and is subject to the forthcoming survey.
Table 27: Scholarships and Distinguishing Features of Malaysian Awards
No Category of Scholarship Distinguishing Features
1. Government/State i. On merit
ii. Citizenship
iii. Ethnicity/minority
iv. To local or foreign HEIs
v. Unlimited field of study – though slanted according to national needs
2. Banks i. On merit
ii. Limited field of study
iii. To local institutions only
iv. First degree
v. Coverage RM. 6-10k per annum
3. Corporate i. On merit
ii. Limited field of study
iii. To local institutions only
iv. First degree
v. May include some form of bond
4. Universities/HEIs i. Limited to the field of study at the institutions
ii. Partial scholarship/merit based scholarship
iii. May include bond
5. Others
(foundations, clubs,
associations)
i. On merit
ii. To local or foreign HEIs
iii. Unlimited field of and level of study
38
Table 28: Eligibility is measured according to family income per month
Status Pre March 2007 Post March 2007
Full ≤ RM2,000 ≤ RM3,000
Partial 1 RM2,001 to RM4,000 RM3,001 to RM5,000
Partial 2 RM4,001and above RM5,001 and above
Source: PTPTN, 2009
Table 29: Gender Compared: Loan vs. Intake
2000 2005 2008
Gender Intake Loan Intake Loan Intake Loan
N % N % N % N % N % N %
Male 48579 45.3 35362 40.0 48433 41.9 59,300 41.1 68931 44.4 59292 37.9
Female 58549 54.7 53010 60.0 67189 58.1 85,018 58.9 86373 55.6 97288 62.1
Total 107128 100 88372 100 115622 100 144318 100 155304 100 156580 100
Source: PTPTN and Ministry of Higher Education, www.mohe.gov.my
Table 30: Bumiputera and Non bumiputera comparison in loan and enrolment for the year
2000
2000
Ethnic Cluster Enrolment Loan
No % No %
Bumiputera 827,593 60 66613 75.4
Non-Bumiputera 553,570 40 21759 24.6
Total 1,381,163 100 88372 100
Source: PTPTN and Ministry of Higher Education, www.mohe.gov.my

39
Table 31: Bumiputera and Non bumiputera comparison in scholarship and enrolment for the
year 2000
D. Constraints
1. The access to and collection of relevant and accurate data have posed a continuing challenge
for the study team.
i. The time lag between request for data/information and response from the relevant
authorities has slowed down the progress of the study considerably. Considerable
effort has been required to meet key government officials.
ii. The process of organizing and conducting a sample survey in selected HEIs has turned
out to be more complex than expected with some institutions unable to take decisions
speedily.
iii. Documentation and data not in the public domain have also eluded the research team
to date.
iv. In many cases, breakdown by ethnic category was missing and needed careful pursuit.
v. Datasets have tended to be incomplete with varying definitions and parameters
rendering comparisons across time difficult. The numbers cited in the next section
illustrate this: in Ministry of Education enrollment data the age cohorts change from
19-24 for the years 1970 – 2000 to 18-24 for 2005 onwards.
vi. The situation has been complicated by the fact that in 2002 (???) the Department of
Higher Education within the Ministry of Education became a separate entity as the
Ministry of Higher Education. This change seems to have exacerbated the entire
process of data collection and information gathering for this study.
Ethnic Cluster Enrolment* Scholarship
No % NO %
Bumiputera 827,593 60 3444 92
Non-Bumiputera 553,570 40 319 8
Total 1,381,163 100 3763 100
Note: * intake data will be more accurate representation of the true picture Source: PTPTN and Ministry of Higher Education, www.mohe.gov.my

40
vii. For the private HEIs, the task facing the team was identifying reliable, updated
consolidated data from public sources, resulting in the need to seek, review and
disentangle various data sources.
E. Major Findings
1. The higher education sector in Malaysia has grown remarkably since the first university
campus was established in 1959. In 2008 the nations’ tertiary education landscape may be
described as a multi-level, diversified system which includes public universities, branch
campuses, community colleges, and polytechnics in juxtaposition to a vibrant private higher
education sector with universities, colleges, international universities’ branches with developed
campuses, and a whole array of skills training institutions.
2. The diversified scenario has provided better access to tertiary education with participation rates
increasing from 0.6% of the 19-24 age cohort enrolled in tertiary education in 1970 to 8.1% in
2000. Figures for 2007 for the 18-24 age cohort show that 24.4% of this group were enrolled.
The increased participation is in step with growing demand for a qualified and skilled
workforce as the economy grew. Every group included in the study enjoyed better access over
the last three decades: all the ethnic groups, women, and those from more inaccessible and less
developed regions in the country. The study has not yet completed data collection on
socioeconomic backgrounds of students but earlier social mobility research in Malaysia
appears to indicate that the system has provided satisfactory access to the disadvantaged.
However, a sample survey to be conducted will hopefully yield updated information in this
regard.
3. Increased access however has not come with equitable patterns of participation. The public
system has overwhelmingly supported one ethnic group – the Bumiputeras – through its
affirmative action policies. Bumiputera students have had the winds of the National Economic
Policy blowing them upwards and onwards as the group that has enjoyed advantages in terms
of favorable admission quotas to public universities, scholarships to local overseas institutions,
and loans over the last decade to attend private HEIs and GLC institutions.

41
4. Women from every ethnic and geographical category show increased participation in education
and training in the last four decades, overtaking men at every level except the doctoral.
Bumiputera women participation has increased the most with women from the less developed
regions showing the lowest rate of increase. While there was increased representation of
women in professional and technical areas of study, women tended to predominate in arts,
education and social studies.
5. Data from the study show that the public university admissions quota system worked better for
the Chinese than Indian students. Overall however Chinese and Indian representation were
lower than their proportion in the population. Government scholarships have financed a small
segment of these groups and again not in proportion to their population. Over the last decade,
loans have been of assistance to these two groups, helping to support their studies in private
HEIs. Distribution of overseas student figures shows a large proportion as self-sponsored from
the Chinese and Indian communities, showing acceptance of the fact that the existing
inequitable pattern is hard to change.
6. The implementation of a university admissions policy based on meritocracy has not changed
the picture much. Enrollment figures post-2002 in fact reflect the ethnic distribution in the
population in universities. Taking into account enrollment in Polytechnics and Community
Colleges, enrollment data reiterate the overall post-NEP finding that all groups increased in
higher education enrollment with Bumiputera enrollment the greatest in magnitude.

42
List of Tables Page
Table1 Overview of Malaysian HE 1967-2007 6
Table 2 Public and Private HEIs according to Location, 2007 9
Table 3 Number of Malaysians Overseas, 2000-2007 9
Table 4 Expansion in Enrollment by Education Level, 1985-2008 12
Table 5 Percentage Population Age 19-24 enrolled in Tertiary Education 12
Table 6 Number of employed persons by highest certificate obtained, 1985, 1990, 2000, 2001, 2005 and 2008 (000) 13
Table 7 Intake, Enrolment and Graduates of Public Higher Education Institutions, 1987-2008 13
Table 8 Enrolment, Intake and Graduates in Private Higher Education, 2002-2008 14
Table 9 Intake, Enrolment and Graduates in all HEIs, 2008 15
Table 10 Enrollments in tertiary education by ethnic group, 1973/74 19
Table 11 Enrollment in Universities by Ethnic Group, 1980 – 2000 19
Table 12 Intake into Universities by Ethnic Group, 2002-2009 20
Table 13 Enrolment in Public Higher Education Institutions by Ethnicity, 2005-2008 21
Table 14 Persons with Higher Education in the Population by Gender, 1980, 1991 and 2000 25
Table 15 Persons with Higher Education in the Population by Race and Gender, 1980, 1991 and 2000 25
Table 16 Persons with Higher Education in the Population by Region and Gender, 1980, 1991 and 2000 25
Table 17 Labor Force Participation Rates by Gender, 1985 - 2008 25
Table 18 Number of Employed Persons by highest certificate obtained by Gender (000) 1985-2008 26
Table 19 Intake, Enrollment and Output by Gender, 1987 – 2008 Annex 1
Table 20 Distribution of University of Malaya Students by Race and Social Origin 28
Table 21 Distribution of Respondents by Fathers Occupations 28
Table 22 Occupational Status and Educational Level of Malaysian University Students, 1978 29
Table 23 Percentage Distribution of Persons Employed in the Labor Force with Tertiary Education by Stratum, 1995 –
2008 31
Table 24 Percentage Distribution of Employed Persons in the Labor Force with Tertiary Education by Stratum and
Gender, 1995 – 2008 31
Table 25 Percentage Distribution of Employed Persons in Labor Force with Tertiary Education by Stratum and Ethnic
Group, 1995 – 2008 31
Table 26 Number and Percentage of Employed Persons by Highest Certificate Obtained and Region, 1985 – 2008 32
Table 27 Scholarships and Distinguishing Features of Malaysian Awards 36
Table 28 Eligibility measured according to family income per month 37
Table 29 Gender Compared: Loan vs. Intake 37
Table 30 Bumiputera and Non-bumiputera Comparison Loan and Enrolment, 2000 37
Table 31 Bumiputera and Non bumiputera comparison in scholarship and enrolment, 2000 38

43
References
Altabach, PG and Mcgill Peterson, P (eds) (2007). Higher Education in the New Century: Global
Challenges and Innovative Ideas. Rotterdam: Sense Publications and UNESCO, Center for
International Higher Education, Lynch School of Education, Boston College, Chestnut Hill,
Massachusetts.
Bok, D (2003). Universities in the Market Place: The Commercialisation of Higher Education.
Princeton: Princeton University Press
Chai, HC. (1977). Education and nation-building in plural societies: The West Malaysian experience.
The Australian National University: Development Studies Center, Monograph no. 6
Chew, SB, Lee, KH and Quek, AH (eds) (1995). Education and Work: Aspirations of Malaysian
Secondary School Students. Kuala Lumpur: Faculty of Education, University of Malaya.
INPUMA (2000). Policy Issues in Higher Education in the New Millennium. Proceedings of
International Conference, Kuala Lumpur, University of Malaya
Jasbir, SS (1973). Education and Social Mobility in Malaysia: A case Study of Petaling Jaya.
Kuala Lumpur: Unpublished Ph D Thesis, University of Malaya.
Jasbir SS (1981). “Higher Education and Social Mobility- the Role of the University of Malaya.
South-East Asian Journal of Social Sciences.
Jasbir SS (1982). “Education and Social Equity in Malaysia” in EDC Occasional Papers No 3.
London: Department of Education in Developing Countries, University of London Institute of
Education.
Jasbir SS and Mukherjee, H (1993). Education and National Integration in Malaysia: Stocktaking
thirty years after independence in International Journal of Education, UK, 1993.
Kee, PK (1976). Tertiary Students and Social Development: An Agenda for Action- Student Rural
Service Activities in Malaysia. Singapore: RIHED.
Kementerian Pendidikan Malaysia (2001). Pembangunan Pendidikan Malaysia 2001-2010. Kuala
Lumpur.
Leete, R (2007). Malaysia from Kampong to Twin Towers: 50 years of Economic and Social
Development. Kuala Lumpur: Oxford Fajar.
Lee, FO (2008). “Growth and Development of Private Higher Education in Malaysia” in Ibrahim
Ahmad Bajunid, Malaysia: From Traditional to Smart Schools, The Malaysian Education
Odyssey. Kuala Lumpur: Oxford Fajar Sdn Bhd.
Lee, KH, Quek, AH and Chew, SB (Editors) (2001). Education and Work: The State of Transition.
Kuala Lumpur: Faculty of Education, University of Malaya.

44
Lee, MNN (2001). Private Higher Education in Malaysia: Expansion, Diversification and
Consolidation, Bangkok, Paper presented at the Second Regional Seminar on Private Higher
Education: Its role in Human Resources Development in a Globalised Knowledge Society, UNESCO
PROAP and SEAMEO RIHED, 20-22 June 2001.
Lee, MNN (2002). Education Changes in Malaysia. Penang: Universiti Sains Malaysia.
Malaysia (1967). Report of the Higher Education Planning Committee. Kuala Lumpur:
Government Printers.
Malaysia (1971). Report of the Committee Appointed by the National Operations Council to Study
Campus Life of Students in the University of Malaya (Also known as the Majid Report). Kuala
Lumpur: Government Press.
Malaysia (1980, 1991, 2000). Population Census Reports. Kuala Lumpur: Department of Statistics.
Malaysia (various years). The Second, Third, Fourth, Fifth, Sixth, Seventh and Eighth Malaysia
Plans. Kuala Lumpur: Government Printers Malaysia.
Malaysia (2008). Perangkaan Pengajian Tinggi Malaysia. Kuala Lumpur : Bahagian Perancangan
dan Penyelidikan, Kementerian Pengajian Tinggi, Malaysia.
Malaysia (1998). National Economic Recovery Plan: Agenda for Action. Kuala Lumpur:
Government printers Malaysia.
Malaysia (2005). The Benchmark Report on Higher Education: Towards Academic Excellence.
Kuala Lumpur: Government Printers Malaysia.
Malaysia (2006a). The Ninth Malaysia Plan, 2006-2010. Kuala Lumpur: Percetakan Nasional
Malaysia Berhad.
Malaysia (2006b). Education Guide Malaysia (10th
Edition), Kuala Lumpur: Challenger Concept
Malaysia, (various years). Labour Force Survey Report. Kuala Lumpur/Putra Jaya: Department of
Statistics.
Malaysia, Ministry of Education (various years). Educational Statistics of Malaysia. Kuala Lumpur:
Planning and Research Division, Ministry of Education.
Malaysia (2009). Higher Education Statistics 2008. Putra Jaya: Ministry of Higher Education.
Malaysia (2009). Quick Facts. Seri Kembangan: Department of Polytechnic and Community
College Education, Ministry of Higher Education.
Marimuthu, T (1984). Student Development in Malaysian Universities. Singapore: Regional
Institute of Higher Education and Development, RIHED Occasional Paper Series.
Marimuthu, T (2008). “Tamil Education: Problems and Prospects” in Ibrahim Ahmad Bajunid
(General Editor), Malaysia – from traditional to smart schools – the Malaysian Educational
Odyssey. Kuala Lumpur: Oxford Fajar.

45
Marimuthu, T and Sheela A (1992). Higher Education in Malaysia, unpublished paper.
Marimuthu, T, Jasbir SS, Chew, SB, Noraini, MS, Chang, LH, and Rajendran, NS (1999). Higher
Education: Policies, Practices and Issues. Malaysia. The World Bank.
Middlehurst, R and Woodfield, S (2004). The Role of Transnational, Private and for Profit
Provision in Meeting Global Demand for Tertiary Education: Mapping, Regulation and Impact
(Case Study: Malaysia). Vancouver: UNESCO and Commonwealth of Learning.
Ministry of Higher Education Malaysia Website: www.mohe.gov.my
Shyamala N, Chew, SB, Lee, KH and Rahimah, A (Editors) (2009). Education and Work: The
World of Work. Kuala Lumpur: Faculty of Economics and Administration, University of Malaya.
Tan, AM (2002). Malaysian Private Higher Education: Globalisation, Privatisation,
Transformation and Market Places. London: ASEAN Academic Press.
Ungku Aziz, Chew, SB, Lee, KH, Bikas, S (eds)(1987). University Education and Employment in
Malaysia. Paris: UNECO, International Institute for Educational Planning, IIEP Research Report
No.66.
World Bank and EPU(2007), Malaysia and the Knowledge Economy: Building a World-Class
Higher EducationSystem. Human Development Sector Reports, East Asia and the Pacific Region,
The World Bank

Annex: Table 19: Intake Enrolments and Graduates in Public Higher Education Institutions
Year Gender Certificate Diploma Degree Master's Doctoral Grand Total
Enrol % Total Enrol % Total Enrol % Total Enrol % Total Enrol % Total Enrol % Total
1987 M 6651 78 8537 27079 49.9 54318 24070 55.4 43430 1838 56.5 3252 267 70.1 381 75550 55.6 135985
F 1886 22 27239 50.1 19360 44.6 1414 43.5 114 29.9 60435 44.4
1990 M 7366 74.4 9907 19174 58.8 32588 27940 52.2 53557 2494 55.4 4499 385 71.4 539 57359 56.7 101090
F 2541 25.6 13414 41.2 25617 47.8 2005 44.6 154 28.6 43731 43.3
1995 M 11252 73.9 15226 41105 44 93506 38805 49 79227 4045 53.1 7622 782 62.3 1255 122140 50 244323
F 3974 26.1 52401 56 40422 51 3577 46.9 473 37.7 122183 50
2000 M 18083 65 27830 57861 44.8 129177 57090 41.5 137538 10289 54 19045 1868 66.4 2813 193847 46 421840
F 9747 35 71316 55.2 80448 58.5 8756 46 945 33.6 227993 54
2005 M 21480 60.7 35360 59432 42.6 139562 75713 35.9 210973 17851 51 34969 4192 62.3 6733 229521 42.6 538404
F 13880 39.3 80130 57.4 135260 64.1 17118 49 2541 37.7 308883 57.4
2008 M 29219 60.2 48499 64656 46.2 140039 103183 37.6 274349 17063 47.3 36094 7526 61.5 12243 221647 43.4 511224
F 19280 39.8 75383 53.8 171166 62.4 19031 52.7 4717 38.5 289577 56.6
Year Gender Certificate Diploma Degree Master's Doctoral Grand Total
Grads % Total Grads % Total Grads % Total Grads % Total Grads % Total Grads % Total
1987 M 1838 74.4 2469 3673 59 6227 4842 57.5 8420 574 41.4 1388 15 60 25 10942 59.1 18529
F 631 25.6 2554 41 3578 42.5 814 58.6 10 40 7587 40.9
1990 M 2338 74.1 3154 4759 58.7 8101 5677 51.9 10932 774 45.3 1710 22 81.5 27 13570 56.7 23924
F 816 25.9 3342 41.3 5255 48.1 936 54.7 5 18.5 10354 43.3
1995 M 3574 71.2 5017 6100 52.2 11678 7853 47.8 16432 1246 40.4 3084 43 58.9 73 18816 51.9 36284
F 1443 28.8 5578 47.8 8579 52.2 1838 59.6 30 41.1 17468 48.1
2000 M 5359 61 8792 10830 46.4 23364 13759 41.6 33095 2063 49.1 4199 104 70.3 148 32115 46.1 69598
F 3433 39 12534 53.6 19336 58.4 2136 50.9 44 29.7 37483 53.9
2005 M 4601 58.6 7848 21154 37.8 56010 16789 36.8 45618 3167 50.2 6309 504 58.8 857 46215 39.6 116642
F 3247 41.4 34856 62.2 28829 63.2 3142 49.8 353 41.2 70427 60.4
2008 M 10580 55.2 19176 17413 46.2 37660 21103 35.1 60040 4060 46.9 8656 467 59.5 785 53623 42.5 126317
F 8596 44.8 20247 53.8 38937 64.9 4596 53.1 318 40.5 72694 57.5
Source: 1987-2005 Ministry of Education: Educational Statistics of Malaysia
Year Gender Certificate Diploma Degree Master's Doctoral Grand Total
Intake % Total Intake % Total Intake % Total Intake % Total Intake % Total Intake % Total
1995 M 4143 71.3 5810 7449 55.1 13513 11085 46.4 23901 2124 46.5 4568 157 74.1 212 24958 52 48004
F 1667 28.7 6064 44.9 12816 53.6 2444 53.5 55 25.9 23046 48
2000 M 8772 65.3 13440 15620 46.8 33403 24187 40.1 60285 6668 43 15512 515 66 780 55762 45.2 123420
F 4668 34.7 17783 53.2 36098 59.9 8844 57 265 34 67658 54.8
2005 M 8656 62 13952 19620 44.8 43807 20157 34.8 57863 7182 48.1 14930 1753 64.4 2722 57368 43 133274
F 5296 38 24187 55.2 37706 65.2 7748 51.9 969 35.6 75906 57
2008 M 15329 59.7 25670 24945 47.7 52278 28657 37 77356 7341 45.4 16158 2158 59.2 3644 78430 44.8 175106
F 10341 40.3 27333 52.3 48699 63 8817 54.6 1486 40.8 96676 55.2
EN
RO
LM
EN
TS
G
RA
DU
AT
ES

47
Notes Data includes public unversities, teacher training colleges, MARA
Institute of Technology, polytechnics,Tunku Abdul Rahman College and community colleges
2008: Ministry of Higher Education – excludes teacher training colleges.
Data for degree includes advanced diploma and higher diploma Data for master's includes postgraduate diploma Data for diploma (1990) – teacher training college data not included