draft, april 24 –all data are preliminary, need verification class project report sustainable air...
TRANSCRIPT

DRAFT, April 24 –All data are preliminary, need verification
Class Project ReportSustainable Air Quality, EECE 449/549, Spring 2008
Washington University, St. Louis, MO
The Carbon Footprint of Danforth Campusand its
Causality Drivers
Instructors: Professor Rudolf B. Husar, Erin M. Robinson
For more details see the class wiki
Students:Devki DesaiMartin GroenewegenTyler NadingKate NelsonMatt SculnickAlyssa SmithVarun Yadav

Class Project: Carbon Footprint of Danforth Campus
Specific Objectives:
1. Develop and apply carbon emission estimation model
2. Estimate the carbon footprint of Danforth Campus
3. Establish the key causality drivers for the emissions
4. Compare the WU carbon emissions to other Universities
5. Calculate the Potential Cost at Chicago Climate Exchange

Main Causality Drivers of Carbon Impact: Students, Faculty, Staff and their Expenditures
Between 1990-2005 the WU population has fluctuated between 14-16,000 people
Students accounted for about 80 percent of the WU population
Danforth Campus Population
0
2
4
6
8
10
12
14
16
18
1980
1982
1984
1986
1988
1990
1992
1994
1996
1998
2000
2002
2004
2006
2008
2011
2013
2015
2017
2019
2021
2023
2025
2027
2029
Year
# o
f P
eop
le (
tho
usa
nd
s)
Staff Faculty Students
Population Increased 10%Students
Faculty
Staff
University Expendenditures
0
200
400
600
800
1,000
1,200
1980 1985 1990 1995 2000 2005 2010 2015 2020 2025 2030
Year
$ (
mill
ion
s),
ad
jus
ted
fo
r in
fla
tio
n
Operational Expendenditures ($)
A measure of WU activities is the expenditure:Research, Academic, Stud. Sup., Physical Plant Between 1990-2005, the expenditures increased
by 70%
70% increase

Main Components of WU Carbon Emissions: On Campus Energy Use in Buildings and Transportation
The impact on carbon arises from on-campus energy use and from transportation
On Campus Energy Use Carbon Impact
Students
Heating
Cooling
Appliances
Faculty/Staff
Transportation Carbon Impact
Commuting
Air Travel
University Fleet

Transportation
Devki Desai
Tyler Nading
Varun Yadav

Causality Framework for University Carbon Footprint - Transportation
• Overall the transportation carbon emissions have remained roughly at 1990 level
PopulationPeople
Transportation
Miles
Fuel Cons. Gal./yr
C Emission Ton C/yr
Miles/Person Gal./Mile Carbon/Gal
Washington University Transportation Emission
0.00
0.50
1.00
1.50
2.00
2.50
3.00
1970 1980 1990 2000 2010 2020 2030 2040
Year
Car
bon
(Tho
usan
d To
nnes
)
Commuter Students Carbon (tonnes) - all Faculty/Staff Commuter Carbon (tonnes) - All Transportation - All
Transportation Emission
Faculty/Staff Commuting
Student Commuting

On Campus Energy Use
Kate Nelson
Alyssa Smith
How about the student pics form the WebFac??

Trend (1990-2006) of University Expenditures and Building Area
Danforth Campus Square Footage
0
1
2
3
4
5
6
1980 1985 1990 1995 2000 2005 2010 2015 2020 2025 2030
Year
Sq.
Ft.
(mill
ions
)
Total Square Footage
60% increase
During the 1990-2006 period, the building area (sq ft) has increased by about 60 percent.
On Danforth??
The 2006 Map of Danforth Campus
The new buildings since 1990 are shaded black

Danforth Campus Electric Energy and Fuel Consumption
Purchased electricity increased 90% between 1990-2005.
The total energy for electricity includes losses in the power plant and during transmission.
Danforth Campus Stationary Sources
0
50
100
150
200
250
300
350
400
450
1980 1985 1990 1995 2000 2005 2010 2015 2020 2025 2030
Year
mm
btu
(thou
sand
s)
Tot Fuel Consumed on Campus (mmbtu) Coal Consumed on Campus (mmbtu)
Oil Consumed on Campus (mmbtu) Natural Gas Consumed on Campus (mmbtu)
Total
Natural Gas
Coal
Oil
• Fuel used on campus for heating and hot water: coal, oil and natural gas.
• In 1993, the University made several upgrades:– Switched from coal to natural gas– Switched to electric chillers– Shut off steam plant from May-October hot water
Danforth Campus Electric Energy Consumption
0
200
400
600
800
1000
1200
1400
Year
mm
btu
(tho
usan
ds)
WASTE Energy at Power Plant
Purchased Electricity
Transmission losses
90% Increase in Electricity Usage

Linear Causality Model for Campus Carbon Emissions
• The carbon impact of on-campus energy is due to direct fuel consumption and indirectly from electricity use
• The overall carbon impact for on campus energy consumption has increased 50% from 1990-2007
• Electricity use contributed about 80 percent to the on-campus carbon impact
PopulationStudents
Activities $ Expend./yr
Buildings Sq. Ft
Fuel Cons. BTU/yr
C Emission Ton C/yr
Fuel Cons.BTU/yr
C EmissionTon C/yr
Electr. ConsKw-Hr/yr
$/Student Sq. Ft./$ BTU/Sq.Ft.
Kw-hr/Sq.Ft.
BTU/Kw-hr Carbon/BTU
Carbon/BTU
Carbon Emission due to On Campus Energy Use,Danforth Campus 1990-2007
0
5
10
15
20
25
30
Year
C T
onne
s (t
hous
ands
)
50% Increase
Electricity
Fuel Cons.
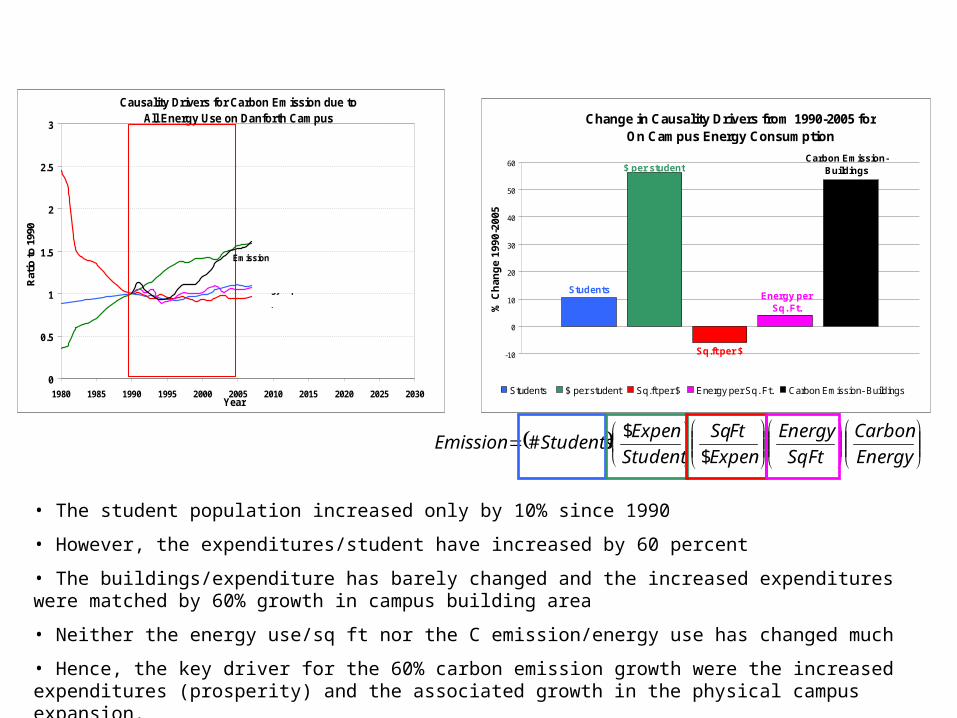
Causality Drivers for Carbon Emission due to All Energy Use on Danforth Campus
0
0.5
1
1.5
2
2.5
3
1980 1985 1990 1995 2000 2005 2010 2015 2020 2025 2030Year
Rat
io to
199
0
Emission
$/Student
# Students
$/Sq.Ft
Energy/Sq.Ft.
Energy
Carbon
SqFt
Energy
Expen
FtSq
Student
ExpenStudentsEmission
$
$#
• The student population increased only by 10% since 1990
• However, the expenditures/student have increased by 60 percent
• The buildings/expenditure has barely changed and the increased expenditures were matched by 60% growth in campus building area
• Neither the energy use/sq ft nor the C emission/energy use has changed much
• Hence, the key driver for the 60% carbon emission growth were the increased expenditures (prosperity) and the associated growth in the physical campus expansion.
Change in Causality Drivers from 1990-2005 for On Campus Energy Consumption
Students
$ per student
Sq.ft per $
Energy per Sq. Ft.
Carbon Emission- Buildings
-10
0
10
20
30
40
50
60
% C
han
ge
1990
-200
5
Students $ per student Sq.ft per $ Energy per Sq. Ft. Carbon Emission- Buildings

Other University Comparison
Martin Groenewegen
Tyler Nading

Total Emission Comparison between Universities
• In the class project, the published carbon emissions of 14 Universities were analyzed • Evidently, the carbon emissions are roughly proportional to the campus building square footage.• This class project data indicate that WU emissions/area are comparable to the other schools
Campus-wide CO2 Emissions as a function of Building AreaU.S. University Campuses
0
50
100
150
200
250
300
350
400
0 2 4 6 8 10 12 14
Building Square Feet, Millions
CO
2 E
mis
sio
n, M
etri
c T
on
nes
/yr,
Th
ou
san
ds
Washington University

Transportation Emission Comparison between Universities
• The transportation portion of carbon emissions indicate rough proportionality to school population
• Evidently, the WU transportation carbon emissions are also in line with other colleges.
• However, the WU estimates are uncertain and given as a range based on two calculation methods
Transportation CO2 Emissions as a function of University PopulationU.S. University Campuses
0
5
10
15
20
25
30
0 5 10 15 20 25 30 35
Total University Population, Thousands
Tra
ns
po
rta
tio
n E
mis
sio
ns
(m
T/y
r), T
ho
us
an
ds
Washington University - All Commute
Washington University - Permits Only

Washington University and the Chicago Climate Exchange
Matt Sculnick

Working Toward a Sustainable Transition
Alyssa Smith