dr. tom stein - benchmark analysis of production and financial measures across nursery, finishing...
TRANSCRIPT

The Power of Organized
Data
Benchmark Analysis of Grow-Finish Production in North America
Dr. Tom SteinMinnesota Pork Producers Annual Meeting
January 14-15, 2014

Average performance for nursery [NUR], finishing [FIN], and single-stock wean-to-finish [W2F (SS)] closeouts for groups closed January 1 through December 31, 2012. Weights are in lbs, costs are $USD.
NUR FIN SS W2F
No. Closeouts 6,295 7,405 1,476
No. Pigs 12,461,844 13,946,859 2,822,284
Start Wt 13 55 13.5
Out Wt 54 270 270
Avg DOF 48 120 163
Lb Feed/Pig 67 612 661
Cost/Lb Gain $0.3508 $0.4106 $0.3652
Mortality % 3.0% 4.1% 5.9%
ADG 0.84 1.80 1.57
FCR 1.64 2.92 2.64
ADFI 1.36 5.25 4.12
Avg Group Size 1,980 1,883 1,915
% Mkt Sales 90.2% 89.0%
% SubStnd Sales 1.84% 2.60%
Feed cost/ton $432.17 $281.13 $294.50
Corn cost/bu $6.44 $6.38 $6.55

NURSERY BENCHMARKING INSIGHTS
Percentile Distributions Across CLOSEOUTS for Line Items Reported on Nursery Closeouts
5 10 20 30 40 50 60 70 80 90 95 Overall
No. Closeouts 6,295
No. Pigs 12,461,844
Start Wt 10.9 11.5 12.0 12.2 12.6 13.0 13.3 13.7 14.1 14.8 15.4 13.0
Out Wt 36.0 36.9 45.0 48.2 51.3 54.4 57.2 60.0 62.9 67.4 71.5 54.1
Avg DOF 33.3 37 42 45.5 47.6 49 50.1 52.5 54 56.8 59.9 48.2
Lb Feed/Pig 33.9 41.3 50.3 56.0 61.2 65.6 70.4 75.2 82.0 93.5 103.1 66.7
Cost/Lb Gain $0.4947 $0.4528 $0.4134 $0.3860 $0.3644 $0.3450 $0.3261 $0.3094 $0.2915 $0.2714 $0.2519 $0.3508
Mortality % 8.9% 6.1% 4.2% 3.3% 2.7% 2.3% 1.9% 1.5% 1.2% 0.8% 0.6% 3.0%
ADG 0.59 0.64 0.71 0.76 0.80 0.84 0.88 0.92 0.96 1.02 1.06 0.84
FCR 2.03 1.92 1.80 1.72 1.67 1.62 1.57 1.52 1.47 1.38 1.31 1.64
ADFI 0.94 1.03 1.14 1.22 1.28 1.35 1.42 1.49 1.57 1.71 1.82 1.36
Avg Group Size 439 517 590 682 1,051 1,249 1,480 2,199 2,802 3,988 5,993 1,980
Feed cost/ton $624.91 $556.09 $507.65 $478.24 $453.60 $430.22 $406.59 $383.49 $361.28 $337.22 $319.65 $432.17
Corn cost/bu $7.95 $7.69 $7.31 $6.74 $6.50 $6.36 $6.17 $6.00 $5.83 $5.42 $5.31 $6.44
read across the rows NOT down the columns
use these to create report cards for individual closeouts or sets of closeouts
DON'T use these numbers for a company report card

Group InformationGroup Name Start Close Started Start Wt Avg Out
Wt w/o
Dead Wt
Lb Feed
Per Hd
Feed
Cost per
Lb Gain
Prod
Mortality
as % of
Pigs In
ADG FC ADFI Avg DOF
111101 01/17/2011 01/01/2012 2,415 11.7 39.5 44.53 0.5459 1.74% 0.73 1.61 1.18 37.7
1181 02/18/2011 02/16/2012 4,669 12.3 48.8 47.96 0.2546 4.30% 1.15 1.34 1.54 31.1
3324056 03/10/2011 01/01/2012 2,100 12.8 57.3 72.51 0.1996 3.95% 0.86 1.65 1.42 51.0
4031103 06/05/2011 01/01/2012 2,000 12.4 86.6 119.45 0.3348 2.40% 1.04 1.62 1.68 71.0
930011101 06/15/2011 01/01/2012 1,208 13.2 43.8 54.66 0.5226 2.24% 0.63 1.80 1.14 48.0
930021101 06/24/2011 01/01/2012 1,191 14.1 39.7 39.13 0.5188 1.43% 0.75 1.54 1.15 34.0
3130N 07/12/2011 01/15/2012 1,158 15.6 50.0 59.11 0.5013 8.46% 0.68 1.88 1.28 48.4
61101 07/15/2011 01/01/2012 1,200 13.0 40.5 50.00 0.5800 2.83% 0.70 1.84 1.28 39.0
801101 07/26/2011 01/01/2012 1,189 12.8 60.0 71.47 0.4188 1.35% 0.98 1.52 1.49 48.0
411101 08/22/2011 03/08/2012 2,501 13.0 50.0 60.23 0.4918 1.44% 0.84 1.64 1.38 43.6
A082911N 08/29/2011 02/14/2012 1,545 11.7 65.0 92.41 0.3237 3.12% 1.00 1.74 1.74 53.5
3138N 09/02/2011 01/01/2012 1,067 12.0 50.0 62.91 0.3194 6.65% 0.73 1.69 1.24 50.9
1138110 09/12/2011 10/13/2012 3,397 14.6 32.2 21.06 0.3749 0.68% 0.72 1.20 0.87 24.2
C4JA 09/21/2011 04/30/2012 1,207 14.4 52.1 62.63 0.2708 1.74% 0.75 1.67 1.25 50.0
----------------------------------------------- Performance Info ----------------------------------------------------------------------------------------- Utilization Info -------------------------------------------
Closeout Percent ile
Start Wt 13.0 50
Out Wt 50.0 36
DOF 43.6 24
Lb Feed/Pig 60.2 37
Cost /Lb Gain $0.4918 6
Mortality % 1.4% 74
ADG 0.84 50
FCR 1.64 46
ADFI 1.38 55
Group Size 2,501 75
0
10
20
30
40
50
60
70
80
90
100
Pe
rce
nti
les
EXAMPLE OF A ‘REPORT CARD’ FOR NURSERY
CLOSEOUTFor each key performance indicator, find the actual result from a Closeout Summary report and refer that result to the Percentile Distribution table. For example, a Start Weight of 13.0 lbis at the 50th percentile across all closeouts and companies. Do this for each of the KPI’s and then create a chart, using a horizontal line to represent the 50th percentile. Bars over the 50th percentile line represent a ‘good’ result, i.e. above average performance. In this example, 1.4% mortality is ranked in the 74th
percentile, meaning that mortality level in this closeout was better (lower) than 74% of the 6,295 closeouts. Or, said the other way around, this closeout’s mortality level was in the Top 25% (OK, Top 26%) of all nursery closeouts in 2012.
I’d assign an overall grade of ‘C’ to this closeout, no better than average (mediocre) performance as a whole. In fact, the low mortality was the only item that stood out as above average.
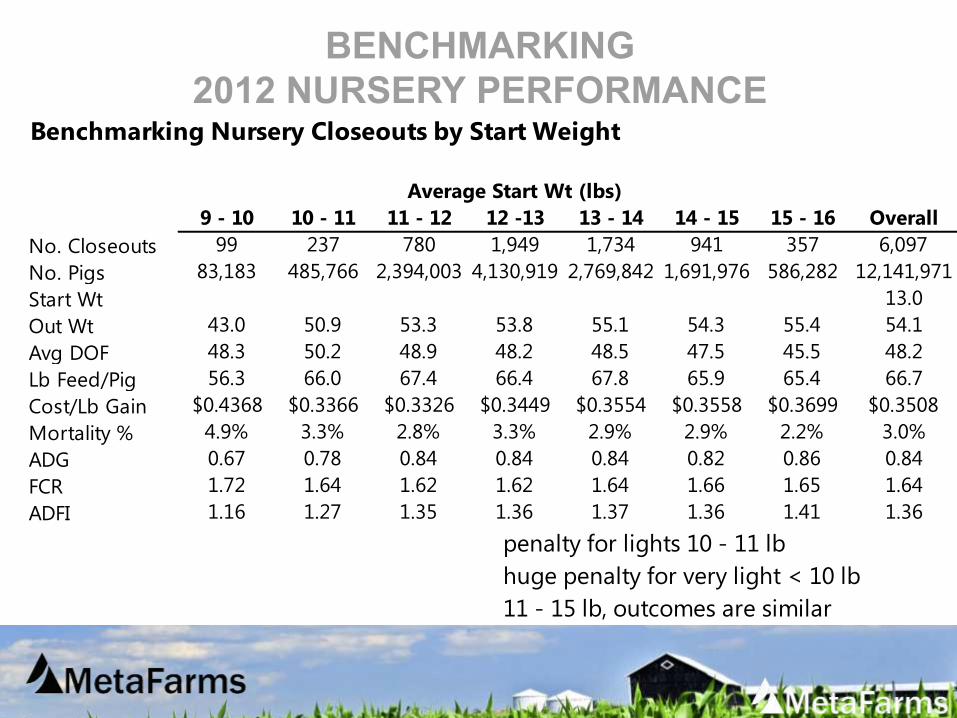
Benchmarking Nursery Closeouts by Start Weight
9 - 10 10 - 11 11 - 12 12 -13 13 - 14 14 - 15 15 - 16 Overall
No. Closeouts 99 237 780 1,949 1,734 941 357 6,097
No. Pigs 83,183 485,766 2,394,003 4,130,919 2,769,842 1,691,976 586,282 12,141,971
Start Wt 13.0
Out Wt 43.0 50.9 53.3 53.8 55.1 54.3 55.4 54.1
Avg DOF 48.3 50.2 48.9 48.2 48.5 47.5 45.5 48.2
Lb Feed/Pig 56.3 66.0 67.4 66.4 67.8 65.9 65.4 66.7
Cost/Lb Gain $0.4368 $0.3366 $0.3326 $0.3449 $0.3554 $0.3558 $0.3699 $0.3508
Mortality % 4.9% 3.3% 2.8% 3.3% 2.9% 2.9% 2.2% 3.0%
ADG 0.67 0.78 0.84 0.84 0.84 0.82 0.86 0.84
FCR 1.72 1.64 1.62 1.62 1.64 1.66 1.65 1.64
ADFI 1.16 1.27 1.35 1.36 1.37 1.36 1.41 1.36
Average Start Wt (lbs)
penalty for lights 10 - 11 lb
huge penalty for very light < 10 lb
11 - 15 lb, outcomes are similar

Benchmarking Nursery Closeouts by Average Days-on-Feed
(excluded 3 @ DOF < 21 and 41 @ DOF >= 70)
21-28 28-35 35-42 42-49 49-56 56-63 63-70 Overall
No. Closeouts 70 361 823 1,892 2,345 634 126 6,251
No. Pigs 91,346 889,091 2,068,858 4,331,874 3,750,139 995,666 245,402 12,372,376
Start Wt 13.4 13.4 13.2 13.0 13.0 12.9 13.2 13.0
Out Wt 29.8 37.3 44.6 51.8 57.9 65.9 73.6 53.9
Avg DOF 48.0
Lb Feed/Pig 24.1 34.9 47.7 61.0 74.1 92.3 105.6 66.3
Cost/Lb Gain $0.4182 $0.3863 $0.3664 $0.3504 $0.3430 $0.3337 $0.3510 $0.3509
Mortality % 1.1% 1.7% 2.7% 3.2% 3.2% 2.8% 4.4% 3.0%
ADG 0.64 0.74 0.80 0.83 0.85 0.90 0.91 0.83
FCR 1.49 1.48 1.54 1.61 1.68 1.76 1.78 1.64
ADFI 0.95 1.09 1.22 1.32 1.42 1.58 1.61 1.36
Average Days on Feed
biggest driver of results
need to control for DOF if indexing closeouts
mortality goes up with more DOF
ADG, FCR, ADFI are growth curve effects

Benchmarking Nursery Closeouts by Mortality %
< 1% 1-2% 2-3% 3-4% 4-5% 5-6% 6-7% 7-8% 8-9% 9-10% >= 10% Overall
No. Closeouts 944 1,780 1,385 839 442 268 142 102 84 56 206 6,295
No. Pigs 1,765,416 3,493,162 3,039,336 1,808,521 854,449 499,758 202,028 189,297 153,057 630,043 334,147 12,461,844
Start Wt 13.3 13.1 13.1 12.9 12.9 12.9 12.6 12.8 12.9 12.8 12.8 13.0
Out Wt 52.8 55.4 55.3 54.7 53.7 52.6 49.9 49.1 51.6 47.8 50.5 54.1
Avg DOF 45.1 48.2 48.7 49.0 49.2 49.2 48.6 48.7 50.3 48.4 50.9 48.2
Lb Feed/Pig 64.6 68.8 68.0 67.4 65.4 64.9 60.5 59.8 64.6 58.6 63.0 66.7
Cost/Lb Gain $0.3476 $0.3365 $0.3430 $0.3501 $0.3614 $0.3705 $0.3869 $0.4076 $0.3785 $0.4103 $0.4107 $0.3508
Mortality % 0.67% 1.48% 2.45% 3.44% 4.44% 5.44% 6.43% 7.45% 8.50% 9.47% 14.82% 3.03%
ADG 0.86 0.86 0.85 0.84 0.81 0.78 0.74 0.72 0.74 0.69 0.69 0.84
FCR 1.61 1.62 1.62 1.64 1.63 1.68 1.66 1.72 1.72 1.75 1.78 1.64
ADFI 1.39 1.40 1.38 1.36 1.32 1.30 1.22 1.22 1.26 1.19 1.22 1.36
Avg Group Size 1,870 1,962 2,194 2,156 1,933 1,865 1,423 1,856 1,822 1,126 1,622 1,980
Average Mortality %
lighter start wt groups have higher mortality %
higher mortality groups have higher feed cost/lb gain
higher mortality groups have lower ADG, higher FCR, lower ADFI

NURSERY BENCHMARKING INSIGHTS
The Power of Organized Data™
Feed cost/lb gain -- just as you'd expect
Group size effects? Huge variation in group size, not easy to see a pattern
No. of sow farm sources into nursery -- no effect
No. of fills -- no effect
Time to fill -- no effect

Average performance for nursery [NUR], finishing [FIN], and single-stock wean-to-finish [W2F (SS)] closeouts for groups closed January 1 through December 31, 2012. Weights are in lbs, costs are $USD.
NUR FIN SS W2F
No. Closeouts 6,295 7,405 1,476
No. Pigs 12,461,844 13,946,859 2,822,284
Start Wt 13 55 13.5
Out Wt 54 270 270
Avg DOF 48 120 163
Lb Feed/Pig 67 612 661
Cost/Lb Gain $0.3508 $0.4106 $0.3652
Mortality % 3.0% 4.1% 5.9%
ADG 0.84 1.80 1.57
FCR 1.64 2.92 2.64
ADFI 1.36 5.25 4.12
Avg Group Size 1,980 1,883 1,915
% Mkt Sales 90.2% 89.0%
% SubStnd Sales 1.84% 2.60%
Feed cost/ton $432.17 $281.13 $294.50
Corn cost/bu $6.44 $6.38 $6.55

WEAN-TO-FINISH BENCHMARKING INSIGHTS
MetaFarms 2012 Benchmarking Single-Stock Wean-to-Finish Closeouts -- Percentiles Across CLOSEOUTS
1,476 Closeouts; 2,822,284 Pigs
10 20 30 40 50 60 70 80 90 Overall
Start Wt 12.0 12.4 12.8 12.8 13.5 14.0 14.0 15.0 15.0 13.5
Out Wt 235 241 242 258 265 270 271 273 287 270
Avg DOF 148 154 157 161 163 166 169 173 178 163
Lb Feed/Pig 596 616 634 649 664 678 693 709 727 661
Cost/Lb Gain $0.4497 $0.4192 $0.3959 $0.3928 $0.3916 $0.3881 $0.3719 $0.3679 $0.3596 $0.3652
Mortality % 13.9% 8.7% 8.3% 7.8% 6.4% 6.1% 5.2% 4.6% 4.0% 5.9%
ADG 1.32 1.36 1.43 1.49 1.56 1.59 1.60 1.64 1.66 1.57
FCR 2.82 2.82 2.81 2.74 2.65 2.52 2.50 2.48 2.45 2.64
ADFI 3.83 3.83 3.95 4.01 4.04 4.07 4.37 4.48 4.55 4.12
% Mkt Sales 67.0% 74.0% 76.0% 88.0% 89.0% 92.0% 92.0% 93.0% 94.0% 89.0%
% SubStnd Sales 4.80% 3.80% 3.60% 3.60% 1.60% 1.20% 0.00% 0.00% 0.00% 2.60%
Feed cost/ton $319.00 $308.00 $301.00 $300.00 $293.00 $281.00 $280.00 $273.00 $269.00 $294.50
Corn cost/bu $6.81 $6.66 $6.38 $6.36 $6.30 $6.16 $6.10 $6.55
Group Size 1,243 1,342 1,439 1,528 2,163 2,255 2,383 2,666 3,455 1,915
Percentiles

WEAN-TO-FINISH BENCHMARKING INSIGHTS
The Power of Organized Data™
What’s the effect of Start Weight?

WEAN-TO-FINISH BENCHMARKING INSIGHTS
MetaFarms 2012 Benchmarking Single-Stock Wean-to-Finish Closeouts by Start Weight
1,476 Closeouts; 2,822,284 Pigs
10-11 lb 11-12 lb 12-13 lb 13-14 lb 14-15 lb 15-16 lb > 16 lb Overall
No. Closeouts 33 122 445 370 279 156 58 1,476
No. Pigs 59,044 239,894 928,022 757,151 491,600 258,591 75,133 2,821,230
Start Wt 10.6 11.6 12.4 13.5 14.4 15.4 16.5 13.5
Out Wt 266 266 269 270 270 271 273 270
Avg DOF 167 164 164 163 163 163 160 163
Lb Feed/Pig 659 649 658 665 666 664 656 661
Cost/Lb Gain $0.3631 $0.3746 $0.3631 $0.3595 $0.3693 $0.3791 $0.3604 $0.3653
Mortality % 7.3% 6.6% 6.2% 5.7% 5.6% 5.8% 5.7% 5.9%
ADG 1.52 1.55 1.57 1.58 1.57 1.57 1.61 1.57
FCR 2.64 2.61 2.61 2.66 2.66 2.66 2.62 2.64
ADFI 4.00 4.03 4.09 4.15 4.13 4.17 4.22 4.12
% Mkt Sales 85.8% 88.7% 89.1% 90.2% 89.9% 88.8% 90.4% 89.4%
% SubStnd Sales 3.10% 2.60% 2.50% 2.30% 3.10% 2.30% 2.50% 2.60%
Feed cost/ton $279.70 $298.40 $294.10 $295.00 $298.60 $298.60 $279.90 $294.50
Corn cost/bu $6.30 $6.48 $6.51 $6.56 $6.63 $6.64 $6.73 $6.55
Group Size 1,789 1,966 2,085 2,046 1,762 1,658 1,318 1,913

WEAN-TO-FINISH BENCHMARKING INSIGHTS
The Power of Organized Data™
What’s the effect of Days on Feed?

WEAN-TO-FINISH BENCHMARKING INSIGHTS
MetaFarms 2012 Benchmarking Single-Stock Wean-to-Finish Closeouts by DOF
1,476 Closeouts; 2,822,284 Pigs
< 140 140-150 150-160 160-170 170-180 > 180 Overall
No. Closeouts 31 178 347 512 288 107 1,476
No. Pigs 48,052 300,195 646,506 970,800 602,112 235,432 2,821,230
Start Wt 14.2 13.4 13.6 13.5 13.4 12.8 13.5
Out Wt 253 266 268 271 272 275 270
Avg DOF 137 146 156 165 174 186 163
Lb Feed/Pig 578 622 649 670 689 706 661
Cost/Lb Gain $0.3524 $0.3808 $0.3739 $0.3778 $0.3410 $0.3212 $0.3653
Mortality % 3.0% 3.6% 4.7% 6.0% 7.7% 8.8% 5.9%
ADG 1.74 1.73 1.63 1.56 1.48 1.40 1.57
FCR 2.43 2.48 2.57 2.66 2.73 2.83 2.64
ADFI 4.21 4.23 4.17 4.12 4.05 4.03 4.12
% Mkt Sales 82.7% 89.7% 90.3% 89.6% 89.1% 88.5% 89.4%
% SubStnd Sales 2.1% 2.8% 3.1% 2.5% 2.4% 1.4% 2.6%
Feed cost/ton $290.50 $302.10 $297.40 $294.60 $286.50 $290.50 $294.50
Corn cost/bu $6.43 $6.52 $6.54 $6.62 $6.50 $6.50 $6.55
Group Size 1,550 1,686 1,863 1,896 2,091 2,200 1,913

The Power of Organized Data™
FINISHING GROUPS BENCHMARKING INSIGHTS

Average performance for nursery [NUR], finishing [FIN], and single-stock wean-to-finish [W2F (SS)] closeouts for groups closed January 1 through December 31, 2012. Weights are in lbs, costs are $USD.
NUR FIN SS W2F
No. Closeouts 6,295 7,405 1,476
No. Pigs 12,461,844 13,946,859 2,822,284
Start Wt 13 55 13.5
Out Wt 54 270 270
Avg DOF 48 120 163
Lb Feed/Pig 67 612 661
Cost/Lb Gain $0.3508 $0.4106 $0.3652
Mortality % 3.0% 4.1% 5.9%
ADG 0.84 1.80 1.57
FCR 1.64 2.92 2.64
ADFI 1.36 5.25 4.12
Avg Group Size 1,980 1,883 1,915
% Mkt Sales 90.2% 89.0%
% SubStnd Sales 1.84% 2.60%
Feed cost/ton $432.17 $281.13 $294.50
Corn cost/bu $6.44 $6.38 $6.55
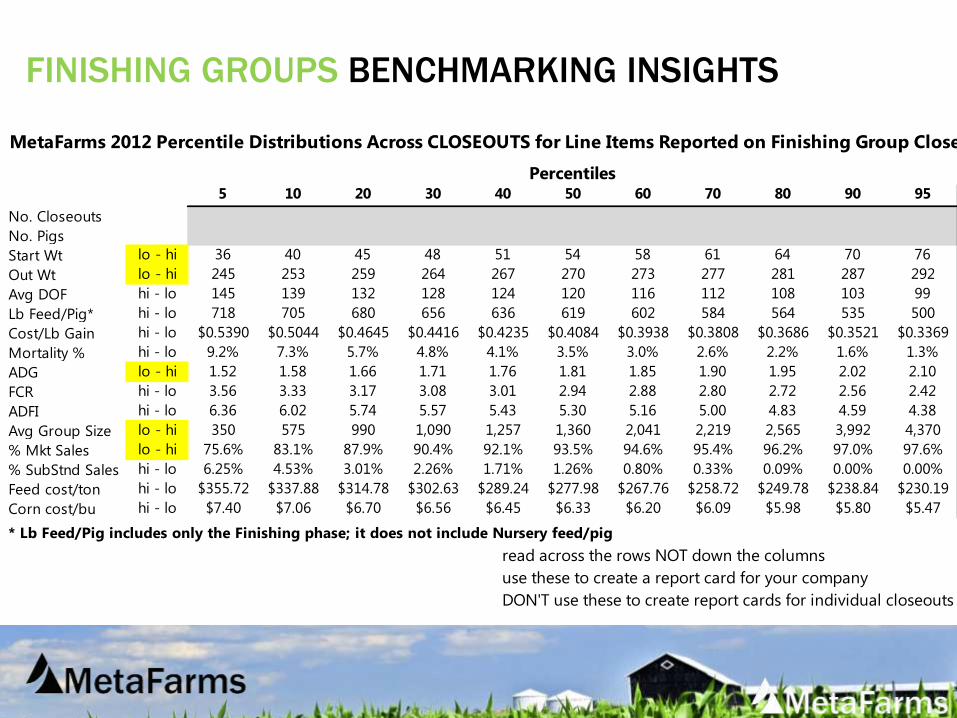
FINISHING GROUPS BENCHMARKING INSIGHTS
read across the rows NOT down the columns
use these to create a report card for your company
DON'T use these to create report cards for individual closeouts
MetaFarms 2012 Percentile Distributions Across CLOSEOUTS for Line Items Reported on Finishing Group Closeouts
5 10 20 30 40 50 60 70 80 90 95 Overall
No. Closeouts 7,405
No. Pigs 13,946,859
Start Wt lo - hi 36 40 45 48 51 54 58 61 64 70 76 55
Out Wt lo - hi 245 253 259 264 267 270 273 277 281 287 292 270
Avg DOF hi - lo 145 139 132 128 124 120 116 112 108 103 99 120
Lb Feed/Pig* hi - lo 718 705 680 656 636 619 602 584 564 535 500 611.9
Cost/Lb Gain hi - lo $0.5390 $0.5044 $0.4645 $0.4416 $0.4235 $0.4084 $0.3938 $0.3808 $0.3686 $0.3521 $0.3369 $0.4106
Mortality % hi - lo 9.2% 7.3% 5.7% 4.8% 4.1% 3.5% 3.0% 2.6% 2.2% 1.6% 1.3% 4.1%
ADG lo - hi 1.52 1.58 1.66 1.71 1.76 1.81 1.85 1.90 1.95 2.02 2.10 1.80
FCR hi - lo 3.56 3.33 3.17 3.08 3.01 2.94 2.88 2.80 2.72 2.56 2.42 2.92
ADFI hi - lo 6.36 6.02 5.74 5.57 5.43 5.30 5.16 5.00 4.83 4.59 4.38 5.25
Avg Group Size lo - hi 350 575 990 1,090 1,257 1,360 2,041 2,219 2,565 3,992 4,370 1,883
% Mkt Sales lo - hi 75.6% 83.1% 87.9% 90.4% 92.1% 93.5% 94.6% 95.4% 96.2% 97.0% 97.6% 90.2%
% SubStnd Sales hi - lo 6.25% 4.53% 3.01% 2.26% 1.71% 1.26% 0.80% 0.33% 0.09% 0.00% 0.00% 1.84%
Feed cost/ton hi - lo $355.72 $337.88 $314.78 $302.63 $289.24 $277.98 $267.76 $258.72 $249.78 $238.84 $230.19 $281.13
Corn cost/bu hi - lo $7.40 $7.06 $6.70 $6.56 $6.45 $6.33 $6.20 $6.09 $5.98 $5.80 $5.47 $6.38
* Lb Feed/Pig includes only the Finishing phase; it does not include Nursery feed/pig
Percentiles

FINISHING GROUPS BENCHMARKING INSIGHTS
What’s the effect of Start Weight?
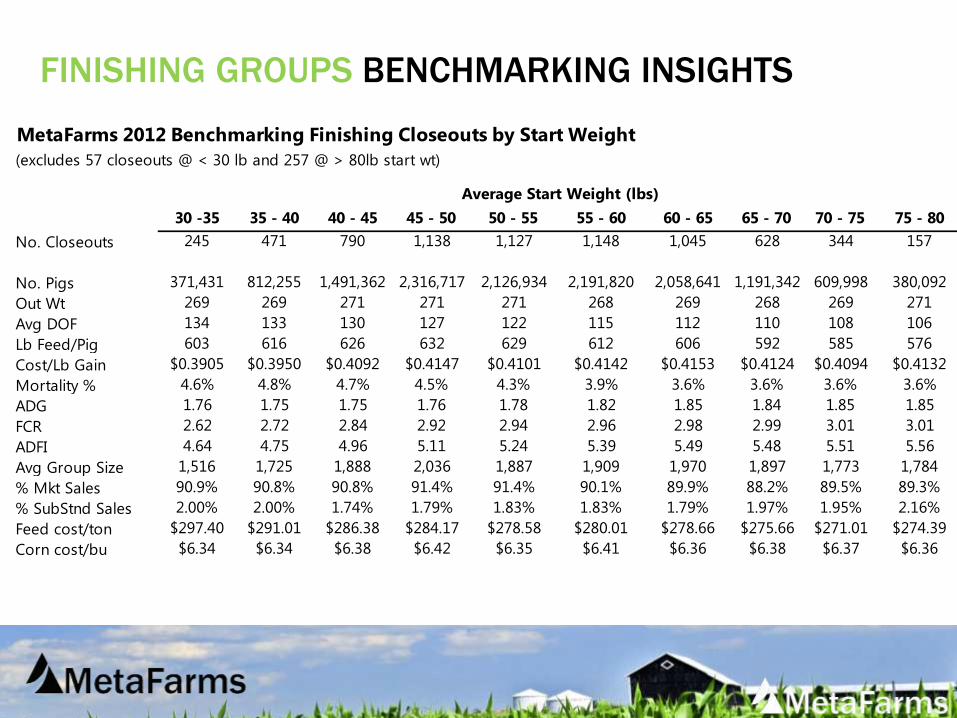
FINISHING GROUPS BENCHMARKING INSIGHTS
MetaFarms 2012 Benchmarking Finishing Closeouts by Start Weight
(excludes 57 closeouts @ < 30 lb and 257 @ > 80lb start wt)
30 -35 35 - 40 40 - 45 45 - 50 50 - 55 55 - 60 60 - 65 65 - 70 70 - 75 75 - 80 Overall
No. Closeouts 245 471 790 1,138 1,127 1,148 1,045 628 344 157 7,405
% of Closeouts
No. Pigs 371,431 812,255 1,491,362 2,316,717 2,126,934 2,191,820 2,058,641 1,191,342 609,998 380,092 13,946,859
Out Wt 269 269 271 271 271 268 269 268 269 271 270
Avg DOF 134 133 130 127 122 115 112 110 108 106 120
Lb Feed/Pig 603 616 626 632 629 612 606 592 585 576 612
Cost/Lb Gain $0.3905 $0.3950 $0.4092 $0.4147 $0.4101 $0.4142 $0.4153 $0.4124 $0.4094 $0.4132 $0.4106
Mortality % 4.6% 4.8% 4.7% 4.5% 4.3% 3.9% 3.6% 3.6% 3.6% 3.6% 4.1%
ADG 1.76 1.75 1.75 1.76 1.78 1.82 1.85 1.84 1.85 1.85 1.80
FCR 2.62 2.72 2.84 2.92 2.94 2.96 2.98 2.99 3.01 3.01 2.92
ADFI 4.64 4.75 4.96 5.11 5.24 5.39 5.49 5.48 5.51 5.56 5.25
Avg Group Size 1,516 1,725 1,888 2,036 1,887 1,909 1,970 1,897 1,773 1,784 1,883
% Mkt Sales 90.9% 90.8% 90.8% 91.4% 91.4% 90.1% 89.9% 88.2% 89.5% 89.3% 90.2%
% SubStnd Sales 2.00% 2.00% 1.74% 1.79% 1.83% 1.83% 1.79% 1.97% 1.95% 2.16% 1.84%
Feed cost/ton $297.40 $291.01 $286.38 $284.17 $278.58 $280.01 $278.66 $275.66 $271.01 $274.39 $281.13
Corn cost/bu $6.34 $6.34 $6.38 $6.42 $6.35 $6.41 $6.36 $6.38 $6.37 $6.36 $6.38
Average Start Weight (lbs)

FINISHING GROUPS BENCHMARKING INSIGHTS
What’s the effect of Days on Feed?
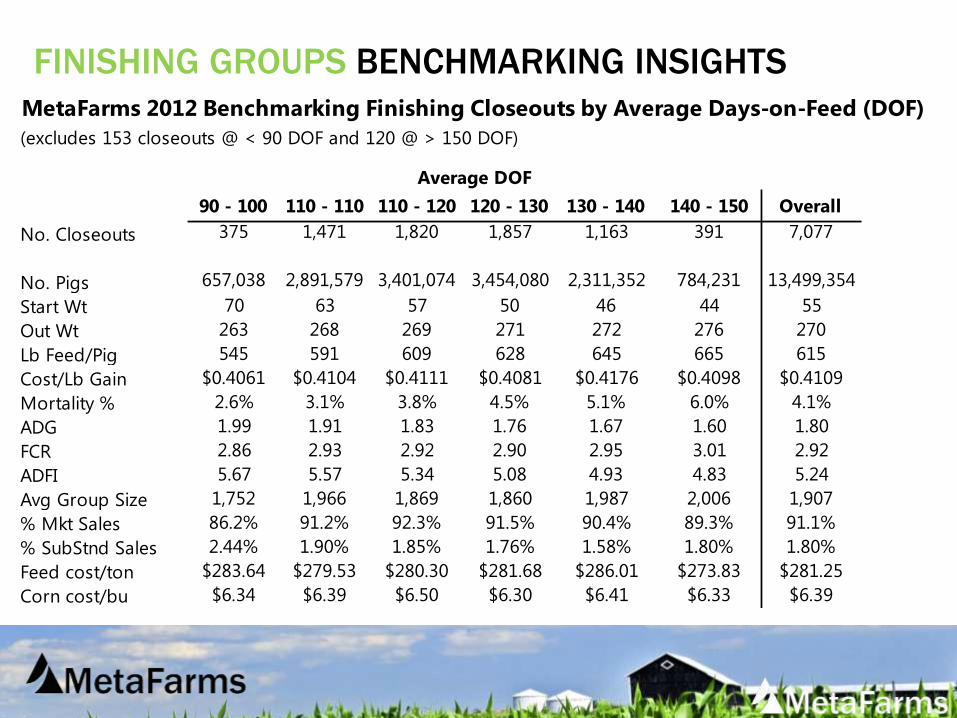
FINISHING GROUPS BENCHMARKING INSIGHTS
MetaFarms 2012 Benchmarking Finishing Closeouts by Average Days-on-Feed (DOF)
(excludes 153 closeouts @ < 90 DOF and 120 @ > 150 DOF)
90 - 100 110 - 110 110 - 120 120 - 130 130 - 140 140 - 150 Overall
No. Closeouts 375 1,471 1,820 1,857 1,163 391 7,077
% of Closeouts
No. Pigs 657,038 2,891,579 3,401,074 3,454,080 2,311,352 784,231 13,499,354
Start Wt 70 63 57 50 46 44 55
Out Wt 263 268 269 271 272 276 270
Lb Feed/Pig 545 591 609 628 645 665 615
Cost/Lb Gain $0.4061 $0.4104 $0.4111 $0.4081 $0.4176 $0.4098 $0.4109
Mortality % 2.6% 3.1% 3.8% 4.5% 5.1% 6.0% 4.1%
ADG 1.99 1.91 1.83 1.76 1.67 1.60 1.80
FCR 2.86 2.93 2.92 2.90 2.95 3.01 2.92
ADFI 5.67 5.57 5.34 5.08 4.93 4.83 5.24
Avg Group Size 1,752 1,966 1,869 1,860 1,987 2,006 1,907
% Mkt Sales 86.2% 91.2% 92.3% 91.5% 90.4% 89.3% 91.1%
% SubStnd Sales 2.44% 1.90% 1.85% 1.76% 1.58% 1.80% 1.80%
Feed cost/ton $283.64 $279.53 $280.30 $281.68 $286.01 $273.83 $281.25
Corn cost/bu $6.34 $6.39 $6.50 $6.30 $6.41 $6.33 $6.39
Average DOF

BENCHMARKING 2012 CLOSEOUTS
Use the distributions to do “report cards” for your company and each closeout or set of closeouts (by
grower, by supervisor, by genetics, etc.)
The Power of Organized Data™

MetaFarms 2012 Benchmarking Finishing Group Closeouts by Company
sorted on Average Days on Feed (DOF) from shortest to longest
80 6,860 1,932 13,252,148 54.5 271.0 120.0 616.2 $0.4058 4.0% 1.80 2.92 5.25 92.8% 1.8% $279 $6.44
CompanySize
Cat*
No.
Closeouts
Group
SizeNo. Pigs
Start
WtOut Wt
Avg
DOF
Lb
Feed/Pig
Cost/Lb
Gain
Mortality
%ADG FCR ADFI
% Mkt
Sales
%
SubStnd
Sales
Feed
cost/ton
Corn
cost/bu
77212 5 83 660 54,784 64.2 271.6 102.1 604.2 $0.4520 2.2% 2.02 2.95 5.87 93.5% 1.9% $306.60 $6.38
76099 1 8 1,689 13,511 66.9 276.1 104.3 617.7 $0.4371 2.4% 1.98 2.98 5.91 95.1% 1.7% $292.72 $6.26
79803 3 29 335 9,727 76.3 266.2 105.5 499.7 $0.3668 2.0% 1.85 2.80 5.26 90.8% 0.0% $262.36
27928 4 42 1,917 80,507 62.5 266.7 106.2 544.1 $0.4252 2.6% 1.95 2.69 5.26 96.1% 1.3% $315.82
12693 6 158 3,054 482,461 63.1 266.7 106.4 568.9 $0.4399 3.1% 1.88 2.84 5.34 94.0% 2.8% $310.20
12267 6 143 1,969 281,509 55.8 266.8 107.0 577.3 $0.4057 1.5% 1.96 2.75 5.38 94.7% 3.7% $295.30 $6.32
26685 2 11 1,109 12,195 64.5 267.7 107.5 572.5 $0.4667 3.1% 1.86 2.85 5.31 94.3% 0.0% $327.48 $6.36
13191 3 22 1,064 23,412 68.1 271.8 107.8 592.3 $0.4821 2.9% 1.87 3.01 5.61 94.4% 0.7% $320.38
84362 6 348 2,123 738,949 64.7 264.2 107.9 593.8 $0.3813 3.6% 1.84 3.05 5.57 92.9% 2.5% $247.15
73268 6 185 1,254 232,069 58.0 266.7 108.1 557.3 $0.3617 2.8% 1.93 2.71 5.23 90.0% 6.8% $267.56 $5.89
51445 6 342 2,196 750,872 60.4 268.6 108.6 605.9 $0.3859 3.1% 1.90 2.94 5.59 95.2% 1.4% $263.21
96767 2 17 849 14,426 57.9 270.6 109.0 571.9 $0.3938 1.7% 1.94 2.71 5.26 95.0% 2.7% $291.22 $6.62
52246 6 407 2,060 838,488 60.4 275.4 110.8 644.1 $0.4288 3.9% 1.91 3.04 5.79 94.4% 0.3% $282.80
28210 1 8 1,061 8,485 60.6 272.2 111.0 626.5 $0.4143 1.3% 1.90 2.97 5.65 98.2% 0.5% $278.92 $6.25
58212 3 28 686 19,220 60.4 268.2 111.8 559.2 $0.3831 3.7% 1.85 2.72 5.03 94.5% 1.8% $281.15 $6.22
18847 2 19 513 9,738 81.0 287.2 112.1 623.5 $0.4751 3.5% 1.81 3.08 5.55 95.5% 0.2% $313.76 $6.71
78339 2 14 790 11,058 58.1 266.8 112.7 591.5 $0.3949 3.2% 1.85 2.92 5.38 93.9% 2.7% $271.70 $5.75
51945 5 88 956 84,102 56.5 265.6 113.0 601.1 $0.4570 2.5% 1.84 2.90 5.32 96.5% 1.0% $316.55 $6.60
56705 5 68 1,420 96,565 57.0 263.1 113.2 591.9 $0.4448 3.3% 1.81 2.90 5.21 95.8% 0.6% $309.17 $6.77
29503 5 82 1,225 100,459 57.9 266.2 113.4 590.9 $0.3998 3.8% 1.85 2.80 5.22 94.1% 1.7% $280.98 $6.35
21866 1 1 4,375 4,375 42.8 274.1 113.5 534.6 $0.3295 2.3% 2.03 2.32 4.71 96.6% 1.1% $283.95 $6.50
55811 2 14 1,002 14,027 50.7 264.9 114.0 563.6 $0.4446 2.3% 1.87 2.79 5.09 95.7% 1.2% $313.64 $6.91

Company Percentile
Start Wt 61.3 80
Out Wt 263.4 10
DOF 117.1 40
Lb Feed/Pig 621.4 63
Cost/Lb Gain $0.4070 55
Mortality % 4.9% 20
ADG 1.70 20
FCR 3.13 8
ADFI 5.32 70
0
10
20
30
40
50
60
70
80
90
Per
cen
tile
s
Creating a
report card
for your
COMPANY
FINISHING GROUPS BENCHMARKING INSIGHTS
Is it possible to rank closeouts by grower?

FINISHING GROUPS – RANKING BY
GROWERMany pork production companies organize quarterly ‘grower meetings’ where they present closeout performance numbers and attempt to rank growers based on a combination of key performance factors. Here’s an example of a grower ranking report for a production system with 54 growers, showing the Top 25% v. Bottom 25%. Same genetics, same building design, same feed budget, same diets. ‘Grower’ is a risk factor for finishing closeout performance. The ‘jury is still out’ on whether you can truly cause improvement in the Bottom 25%, i.e. bring them up to at least average performance levels.
Site
No.
Group
s
OVERALL
RANK
Pigs
Started
Start
Wt
Avg Out
Wt
Market
Sales as %
of Pigs Out
Mortalit
y %ADG FC ADFI
Avg
DOF
A 24 1 15,730 41.3 291.4 97.48% 1.8% 1.92 2.31 4.46 130.0
B 12 2 15,839 49.5 272.5 96.83% 2.3% 1.92 2.40 4.60 116.5
C 24 3 31,690 40.1 268.0 96.16% 3.0% 1.85 2.41 4.45 123.2
D 24 4 26,033 49.4 266.5 94.93% 3.0% 1.85 2.42 4.48 117.3
E 24 5 31,668 41.6 277.7 96.18% 3.0% 1.86 2.44 4.54 126.0
F 24 6 26,550 49.2 268.3 95.83% 3.0% 1.85 2.43 4.50 118.6
G 24 7 31,778 42.5 276.1 96.69% 2.3% 1.84 2.44 4.50 126.4
H 24 8 26,863 41.6 266.3 96.38% 2.7% 1.84 2.38 4.39 121.3
I 12 9 15,885 41.6 282.1 97.24% 2.0% 1.91 2.43 4.64 125.4
J 6 10 2,435 45.2 273.4 97.28% 2.2% 1.90 2.41 4.58 119.8
K 12 11 15,824 40.3 270.0 97.14% 2.1% 1.85 2.41 4.46 124.1
L 20 12 21,944 45.9 278.1 95.98% 3.4% 1.85 2.44 4.52 124.5
RR 12 43 15,725 40.2 278.1 95.17% 3.9% 1.81 2.49 4.52 130.4
SS 10 44 13,288 42.7 266.8 95.41% 3.0% 1.80 2.45 4.40 123.8
TT 8 45 10,629 76.2 277.0 96.99% 2.0% 1.97 2.53 4.99 101.6
UU 12 46 15,774 52.3 271.1 96.10% 2.8% 1.78 2.52 4.50 121.9
VV 20 47 22,200 47.8 264.6 95.58% 3.1% 1.77 2.47 4.38 121.3
WW 18 48 23,282 52.5 271.0 95.88% 2.9% 1.83 2.55 4.66 117.5
XX 12 49 15,902 51.2 267.3 95.37% 3.3% 1.78 2.49 4.43 120.3
YY 12 50 15,813 40.6 265.0 95.77% 2.9% 1.79 2.42 4.32 124.4
ZZ 14 51 18,228 55.8 273.2 95.44% 3.4% 1.77 2.58 4.57 122.0
AAA 24 52 31,464 43.1 261.1 93.48% 4.2% 1.73 2.47 4.27 124.4
BBB 13 53 9,219 59.3 274.3 97.07% 2.3% 1.73 2.49 4.25 125.7
CCC 3 54 2,127 41.2 260.3 95.41% 3.4% 1.71 2.52 4.32 127.1

CHALLENGE OF MANAGING FLOW, SPACE & WEIGHT
Producer says, “we sell at a fixed market wgt.”
But is it DOF or market wgt. ?
Optimizing total system weight is more than optimizing carcass weight
It’s about optimizing space and time relative to total weight produced
1

TODAY’S ‘BRUTE FORCE’ METHOD OF MANAGING
FLOW, SPACE & WEIGHT
12

STRUGGLING WITH MANAGING FLOWS, SPACE & WEIGHT
47% of the pigs
@ 249.7 + 25.9 SD
Cannot optimize carcass weight if half the pigs are
sold at least 30lbs too light!
Producer is leaving $12 per pig on the table for this
closeout
Planned closeout profit becomes loss due to
revenue miss
If we had enough lead time and ‘knew’ that this was likely to happen we could
make a decision to keep half the pigs – the slowest growing – on feed for a few
more weeks

LOGISTICS -- CHALLENGES OF SPACE, FLOW, & WEIGHT

THINK ‘PREDICTION FACTORS’ V. RISK
FACTORS

THINK ‘PREDICTION FACTORS’ V. RISK
FACTORS

THINK ‘PREDICTION FACTORS’ V. RISK
FACTORS

THINK ‘PREDICTION FACTORS’ V. RISK
FACTORS

THINK ‘PREDICTION FACTORS’ V. RISK
FACTORS

TOM’S CONCLUSIONS & QUESTIONS
• Accept variation, manage for it
• The only intervention that works (for the slower-growing ‘tier’ in a group) is TIME
• True Wean-to-Finish system is the winner
• It is possible to predict weights and weight distributions by Week-on-Feed
• Q? Is it possible to improve the Bottom 25% of growers?
• Q? What is the variation of closeout performance across production systems? Are there systems with low variation, i.e. consistency of performance over many many closeouts? If so, let’s study them!
• Q? When placing a group of weaned pigs into a nursery or wean-to-finish site, what is the threshold % of light pigs (e.g. < 10lb or < 9 lb or < 8lb) that tips performance down.
• Q? Is ADG by Selling Groups by Week-on-Feed consistent, stable and predictable withina production system?
• Q? Where is the best place to intervene with TIME? Farrowing house? Nursery? Finishing?

METAFARMS WHO WE ARE
• Founded in 2000
• Thomas E. Stein DVM, MS, PhD, Executive Chairman
• Chad Becker, President & CEO
• Web software as a service (SaaS)
• Multiple species – Swine, Beef, Poultry
• 20+% swine market share in North America and growing.
• Diverse, and global customer base that includes some of the
largest protein businesses in the world as well as some of the
smallest.

METAFARMS MISSION & VISION
Mission:
To provide organized data that empowers todays farmers to
responsibly feed the world.
Vision:
We will become the number one organizer of animal life
cycle data by helping farmers precisely understand their
production connecting them to the broader supply chain to
best meet global food needs.

METAFARMS MISSION
Provide organized data that empowers today’s farmers to responsibly feed the world.
The Power of Organized Data™