dr marie-emmanuelle behr-gross european directorate for ... · e-mail:...
TRANSCRIPT
Dr Marie-Emmanuelle Behr-GrossDepartment of Biological Standardisation, OMCL Network & HealthCareEDQM, Council of Europe7 allée KastnerCS 30026F-67081 STRASBOURG FRANCETel: +33 (0)3 90 21 41 08Fax: +33 (0)3 88 41 27 71E-mail: [email protected]
European Directorate forthe Quality of Medicines &
HealthCare (EDQM)Council of Europe
7 allée KastnerCS 30026
F-67081 STRASBOURG FRANCE
Website: www.edqm.euFor ordering: www.edqm.eu/store
FAQs & EDQM HelpDesk: www.edqm.eu/hd
For further information concerning the work of the Council of Europe / EDQM in the area of blood transfusion please contact:
European Committee (Partial Agreement)
on Blood Transfusion (CD-P-TS)
The Collection, Testing and Use
of Blood and Blood Components
in Europe
2008
Rep
ort

The Collection, Testing and Use of Blood and Blood Components
in Europe
2008 Report
C.L. van der Poel, MD, PhD1, M.P. Janssen, PhD1 and M.-E. Behr-Gross, PhD2
1. Julius Center for Health Sciences and Primary Care, University Utrecht, Utrecht, The Netherlands2. European Directorate for the Quality of Medicines and HealthCare, Council of Europe, Strasbourg, France
For further information concerning the work of the Council of Europe / EDQM in the area ofblood transfusion please contact:
Dr Marie-Emmanuelle Behr-GrossDepartment of Biological Standardisation, OMCL Network & HealthCareEuropean Directorate for the Quality of Medicines and HealthCare (EDQM)Council of Europe7 allée Kastner, CS 30026F - 67081 STRASBOURGFRANCE
tel: +33 (0)3 90 21 41 08fax: +33 (0)3 88 41 27 71
E-mail: [email protected]
Printed on acid-free paper by Bialec, Nancy (France)
The Collection, Testing and Use of Blood and Blood Components in Europe is published by the Directorate for the Quality of Medicines and HealthCare of the Council of Europe (EDQM).
All rights conferred by virtue of the International Copyright Convention are specifically reserved to the Council of Europe and any reproduction or translation requires the written consent of the Publisher.
Director of the Publication: Dr S. Keitel
Page layout and cover: EDQM
© Council of Europe, May 2011

3
The Collection, Testing and Use of Blood and Blood Components in Europe (2008)
CONTENTS
Summary 4
Acknowledgements 6
List of abbreviations 7
Study methods 9
Results: Comments 10
References 18
Results: Tables 19
Table 1 - Donors, first time donors and inhabitants 20
Table 1.1 - Profile of donations 21
Table 2 - Collection of whole blood, autologous blood and blood components 22
Table 3 - Use of blood and blood components for transfusion 24
Table 4 - Plasma for fractionation into medicinal products 25
Table 5.1 - Special processing of blood components 26
Table 5.2 - Inactivation or quarantine of plasma 27
Table 6 - Donation testing strategy for infectious agents 28
Table 7.1 - Confirmed seropositive donors (absolute numbers) 30
Table 7.2 - Prevalence and incidence calculated per 100 000 donors 31
Table 8.1 - Nucleic Acid Amplification Techniques (NAT) testing 32
Table 8.2 - NAT-only confirmed positive donors 34
Table 9 - Bacterial screening 35
Table 10 - Organisation, registration and labelling 36
Table 11a - Quality Management related issues 37
Table 11b - Quality Management related issues 39
Table 12 - Haemovigilance 41
Appendix
Questionnaire on the collection, testing and use of blood and blood components in Europe,
the 2008 Survey

4
The Collection, Testing and Use of Blood and Blood Components in Europe (2008)
SUMMARYThis report provides data on the donors, collection, testing, use and quality aspects of blood and blood components in Member States MS) of the Council of Europe (CoE). Data were supplied by MS in response to a questionnaire requesting detailed information on donors, collections, testing, distribution and quality aspects of blood and blood components for the year 2008. In its present form it follows a series of similar reports that have assessed such data in 1989, 1991, 1993, 1995, 1997 and, in its present revised form, as of the 2001 survey.
A Qualitative Evaluation Report on the questionnaire with recommendations for improvement of the process was performed and was reported in November 2004, including experience with data presentation from the 3 previous years. The format of the questionnaire was reviewed and re-designed by the authors and the CoE experts of the Committee of Experts on Quality Assurance in Blood Transfusion Services (SP-GS) and the Committee of Experts on Blood Transfusion (SP-HM) bureau in 2004.
Also, in 2008 as for former years, not all relevant data was obtained from each MS. Due to difficulties in implementation of data retrieval from automated blood banking systems, and the collation of data from many blood establishments (BE) on a national level within the MS, the process is designed so that annual repetition will lead to improvements.
In contrast to surveys for the years 2003 and earlier, the proportion of donations by voluntary non-remunerated and replacement donors was requested as of the 2004 questionnaire. The European Commission (EC) has acknowledged its importance of this information in its Directive 2002/98/EC.
In MS and in BE, data may be administered in different formats, and different definitions may have been operational. This could result in discrepancies if data is reported in different formats. In addition, some data may not be available from all respondents. It is anticipated that consistency and persistence with these CoE survey methods, in collaboration with the EC, will result in adaptation of the BE and MS towards uniform data collecting, and thereby the generation of better data and higher response rates among MS, when the questionnaires are used annually. In order to facilitate uniformity, definitions of the EC Directives and CoE Guidelines are used as far as possible (Council Recommendation 98/463/EC, Directive 2002/98/EC, Guide to the Preparation, Use and Quality Assurance of Blood and Blood Components, 9th edition, 2003). In addition, it is to be welcomed that the European Medicines Agency (EMA) employs the same definitions, especially on infectious disease epidemiology in donor populations (Guideline on Epidemiological data on Blood Transmissible Infections for inclusion in the Guideline on the Scientific Data Requirements for a Plasma Master File EMEA/CPMP/BWP/3794/03). Uniformity of such definitions is of importance to the field, and circumvents unnecessary and costly repetitions in collating data.
In total, 33 questionnaires were received in 2008; the response rate (72%) is lower than previous years, despite the fact that an easier (web-based) system for data entry has been established. For the 2001 to 2007 surveys the response rates were 84%, 60%, 67%, 73%, 72%, 80% and 76%, respectively.
The average number of donors in relation to the general population is 29 (range 9-63) per 1000 inhabitants. On average 19% of the donor base consists of first time donors.
The number of whole blood (WB) collections is, on average, 39 per 1000 inhabitants, the average use of red blood cells (RBC) is 41 per 1000 inhabitants.
On average 2.6 litres (L) of plasmapheresis plasma per 1000 inhabitants are collected.
5
The Collection, Testing and Use of Blood and Blood Components in Europe (2008)
Blood use is either expressed in units issued by the BE (77% of the reporting MS), or reported as transfused units (23% of the reporting MS). The use of RBC varies considerably (range 9 - 60) and averages 41 total RBC Units (U) per 1000 inhabitants. In three of the reporting MS, less than 20 U per 1000 inhabitants are used, most likely reflecting an insufficient supply. In the reporting MS, on average 38% of the total platelet volume is supplied by (random) single donor platelets by apheresis; in 10 countries this volume amounts to more than 50%.
The amount of plasma delivered for fractionation into medicinal products differs greatly (range 0-31) among MS; an average yield of 8.2 L of plasma for fractionation per 1000 inhabitants is found. However, 17% of reporting MS deliver 15 L or more per 1000 inhabitants. In Europe, on average, 51% of the plasma for fractionation is from recovered plasma.
In 45% of the MS, 100% leucocyte depletion of RBC is carried out. Platelet concentrates and Fresh Frozen Plasma (FFP) are 100% leucocyte depleted in 55% and 33% of reporting MS, respectively. In 38% of the reporting MS all FFP is additionally safeguarded by either quarantine or pathogen reduction methods.
In all reporting MS, each donation is tested for anti-HIV-1/2, HBsAg and anti-HCV. In 91% of the reporting MS, all donations are tested for syphilis. Anti-HTLV-I/II testing is performed on all donations in 20% of reporting MS, and on first time donors in 7%. Anti-HBc is performed on all donations in 21% of the MS, and only on first time donors in another 14%. Prevalence and incidence of infectious diseases vary greatly among MS, and it is noted that in Europe a North-South gradient exists for the frequencies of hepatitis B (HBV) and C virus (HCV). The median prevalence amongst ‘first time tested donors’ is 6.9, 115 and 63 per 100 000 donors for HIV-1/2, HBV and HCV respectively. The median incidence amongst ‘repeat donors’ is 0.6, 1.7 and 2.0 per 100 000 donor years for HIV-1/2, HBV and HCV respectively.
Nucleic Acid Amplification Techniques (NAT) testing for HCV is performed on each donation in 57% of reporting MS, whereas HIV NAT and HBV NAT is performed on each donation in 59% and 36% of the MS, respectively.
Bacterial screening on platelet concentrates is performed in 73% of the MS. Screening of 80% or more of the platelet concentrates is performed in 21% of the MS. Haemovigilance data have repeatedly demonstrated the importance of bacterial safety for platelet concentrates.
All MS report that legally-binding national regulations for the collection, testing, processing, storage and distribution of blood and blood components are in place. In 76% of the reporting MS a National Council or Expert Committee to advise the Ministry of Health on transfusion-related policy issues exists. In 80% of the MS, a national blood policy on the quality and safety of blood and blood components is in place.
In 91 % of the reporting MS, a Quality System (QS) is established and maintained in BE. All donations are covered by ISBT, GMP or other procedures in 83% (25/30) of reporting MS. All donations are covered by Good Manufacturing Practices (GMP) in 20/24 MS reporting to have GMP. In 94% of the reporting MS, inspections are performed by the national authority at least every 2 years.
Labelling according to International Society for Blood Transfusion (ISBT)-128 or other procedures for donation tracking is performed by 87% of reporting MS. Labelling of all components by either ISBT 128 or another system is done by 86% of reporting MS.
Haemovigilance reporting in this survey began in 2004. The format for data acquisition on haemovigilance for the 2004 CoE questionnaire, in its basic form, was developed in collaboration with the CoE, experts and EC and adapted into Directive 2005/61/EC. In this report only those serious adverse reactions are presented that are probably or certainly (imputability grade 2 to 3) ascribable to transfusion of blood products, and data on some conditions that are not caused by these products themselves, such as TACO (Transfusion Associated Circulatory Overload), are
6
The Collection, Testing and Use of Blood and Blood Components in Europe (2008)
also reported. A national haemovigilance reporting system is present in 88% of the MS. Taking into account the possibility of under-reporting and the differences in national reporting systems, an overall incidence of approximately 6.9 serious adverse reactions per 100 000 distributed blood components is estimated. This estimate is based on data provided by 23 MS. Haemolysis, anaphylaxis, Transfusion Related Acute Lung Injury (TRALI) and TACO and transfusion associated HCV infections appear to be the most frequent serious adverse reactions.
Acknowledgements
The CoE and the authors are grateful to all colleagues and experts in MS who collated data at a national level and provided it for inclusion in this report.
Data collection and analysis and preparation of this manuscript was coordinated by Dr Marie-Emmanuelle Behr-Gross (Scientific officer, EDQM) supported by Ms Alison Harle and Ms Ahlem Sanchez (secretarial assistants, EDQM) and by Ms Sandra Fromweiler and Dr John O’Brien (editorial assistants, EDQM).
7
The Collection, Testing and Use of Blood and Blood Components in Europe (2008)
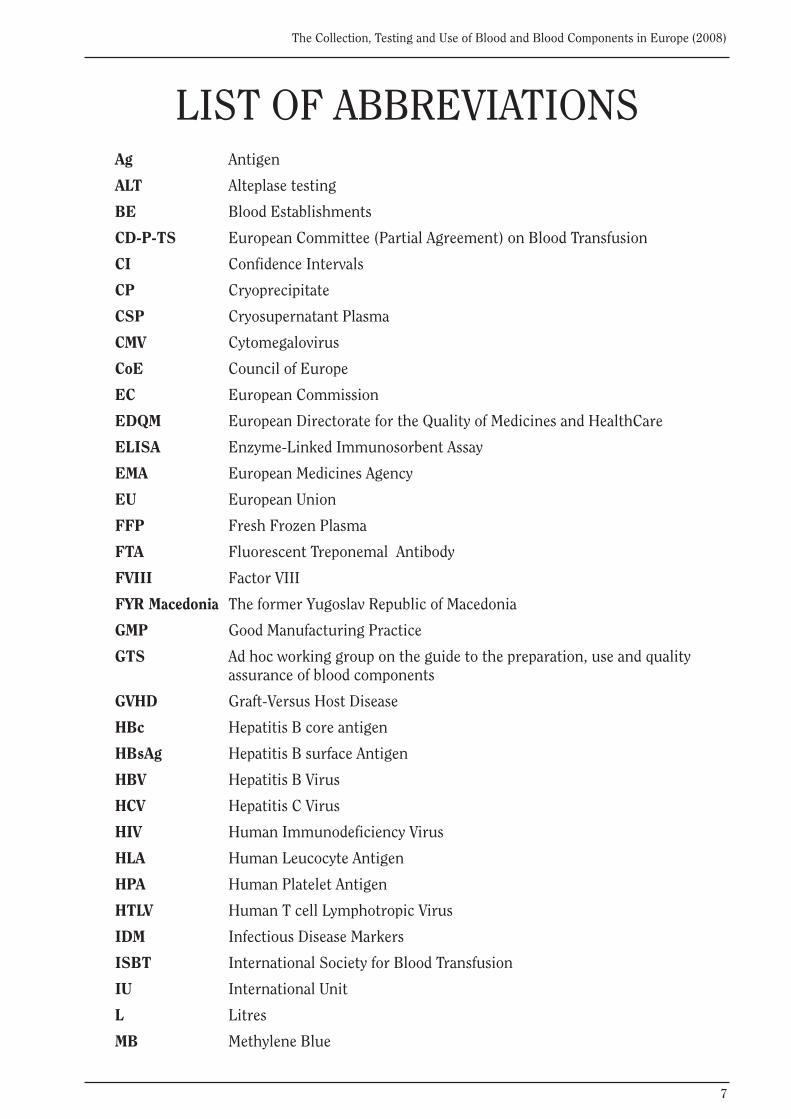
LIST OF ABBREVIATIONSAg Antigen
ALT Alteplase testing
BE Blood Establishments
CD-P-TS European Committee (Partial Agreement) on Blood Transfusion
CI Confidence Intervals
CP Cryoprecipitate
CSP Cryosupernatant Plasma
CMV Cytomegalovirus
CoE Council of Europe
EC European Commission
EDQM European Directorate for the Quality of Medicines and HealthCare
ELISA Enzyme-Linked Immunosorbent Assay
EMA European Medicines Agency
EU European Union
FFP Fresh Frozen Plasma
FTA Fluorescent Treponemal Antibody
FVIII Factor VIII
FYR Macedonia The former Yugoslav Republic of Macedonia
GMP Good Manufacturing Practice
GTS Ad hoc working group on the guide to the preparation, use and quality assurance of blood components
GVHD Graft-Versus Host Disease
HBc Hepatitis B core antigen
HBsAg Hepatitis B surface Antigen
HBV Hepatitis B Virus
HCV Hepatitis C Virus
HIV Human Immunodeficiency Virus
HLA Human Leucocyte Antigen
HPA Human Platelet Antigen
HTLV Human T cell Lymphotropic Virus
IDM Infectious Disease Markers
ISBT International Society for Blood Transfusion
IU International Unit
L Litres
MB Methylene Blue
8
The Collection, Testing and Use of Blood and Blood Components in Europe (2008)
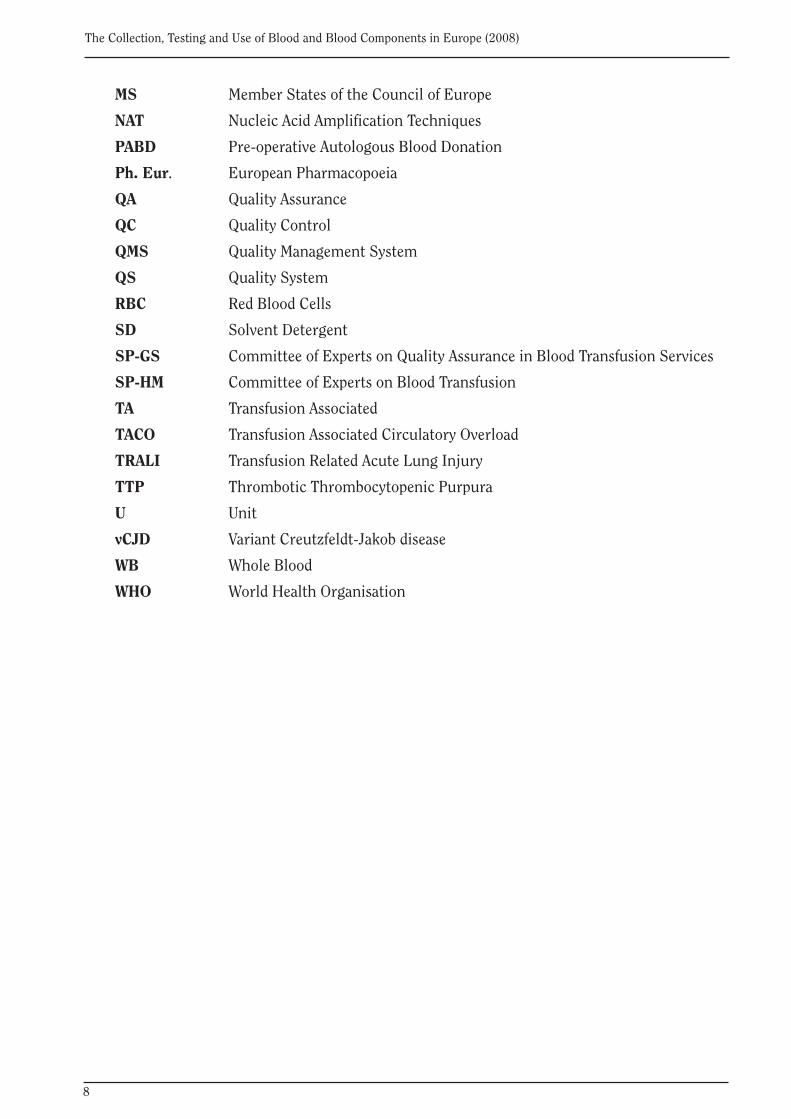
MS Member States of the Council of Europe
NAT Nucleic Acid Amplification Techniques
PABD Pre-operative Autologous Blood Donation
Ph. Eur. European Pharmacopoeia
QA Quality Assurance
QC Quality Control
QMS Quality Management System
QS Quality System
RBC Red Blood Cells
SD Solvent Detergent
SP-GS Committee of Experts on Quality Assurance in Blood Transfusion Services
SP-HM Committee of Experts on Blood Transfusion
TA Transfusion Associated
TACO Transfusion Associated Circulatory Overload
TRALI Transfusion Related Acute Lung Injury
TTP Thrombotic Thrombocytopenic Purpura
U Unit
vCJD Variant Creutzfeldt-Jakob disease
WB Whole Blood
WHO World Health Organisation
9
The Collection, Testing and Use of Blood and Blood Components in Europe (2008)
STUDY METHODSThe methods in this survey are, in principle, the same as those used in previous surveys, with the following modifications. As of the 2007 survey, a dedicated web-based application was developed for performing data collection. Each MS nominated an expert who was granted access to the website and could complete, repeatedly edit and, thereafter, finalise an on-line electronic datasheet for its respective MS. Data collection was completed on 1 November 2010. This report was presented in a draft form to the European Committee (Partial Agreement) on Blood Transfusion (CD-P-TS) in November 2010 for review and approval by MS representatives.
Trend analysis
Comparisons with results from the previous surveys and trend analyses are foreseen. Initial trend analyses have been published (van der Poel et al, 2011) and comprised questionnaire data from 2001 through to 2005. Not all information requested in the Questionnaire is included in the tables reported, but these provide detail where sufficient information is available to justify presentation. Occasionally totals in the tables may not precisely match the contributing figures because of rounding. It was assumed that information was not available when information was not provided. The absence of a response is represented by empty fields in the tables.
Remarks to the data
It remains the responsibility of the MS that the data reported in the questionnaires has been checked against the tables provided in the draft versions of this report.
With the launch of the web-posted questionnaire, which was set-up for collecting the data for 2007 and later surveys, the risk of errors by transcription of the data by the authors has been eliminated.
10
The Collection, Testing and Use of Blood and Blood Components in Europe (2008)
RESULTSResponse rate
The 46 MS of the Council of Europe (CoE) were invited to participate in the 2008 survey. Replies were received at the deadline for submission on 1 November 2010 from 33 MS; a response rate of 72%. For the 2001 to 2007 surveys, the response rates were 84%, 60%, 67%, 73%, 72%, 80% and 76%, respectively. It is possible that the longer period between the beginning and end of data collecting allowed more MS to report. It was also reported to the authors that changing blood supply systems and mergers of blood establishments (BE) hindered the process of data collection.
Donors, first time donors and inhabitants: Table 1
The questionnaire requires data on donors ‘active during the year’, and therefore should include only those donors who actually donated during the reporting year. However, the definition ‘donors active during the year’ may require a precise query on a given donor database. In many establishments or countries, the query format on the donor database would need to be compliant. This may not always be possible. Therefore, it is not certain whether this requirement was always met in generating the data for this survey. Definitions have been largely addressed by the European Commission (EC) Council Recommendation of 29 June 1998 on the suitability of blood and plasma donors and the screening of donated blood in the EC (98/463/EC).
The terms ‘regular and repeat donors’ are defined by the EC Council Recommendation (98/463/ EC) and these definitions apply to regular donors (i.e. donors whose last previous donation was less than 2 reporting years earlier) and for repeat donors (i.e. donors whose last previous donation was more than 2 reporting years earlier). The total of the two categories represents those donors, who are known to the system or establishment and in many countries form the basis and guarantee of continuity of the blood supply. These data are needed for the calculation of the prevalence of infectious diseases among new donors and the incidence of infectious diseases among repeat and regular donors (see Table 7). For EU countries, the reporting of prevalence and incidence on these donor populations became mandatory in 2005 as of Directive 2002/98/EC.
In this survey, the term ‘first time tested donors’ includes all donors who are actually tested for the first time in the reporting year. ´First time donors´ includes all donors who donated for the first time in the reporting year. There are systems where ‘applicant donors’ (98/463/ EC) are only tested, and come back for a first donation later. They become known as ‘qualified donors’ when their applicant donor infectious disease tests are returned negative. Including only ‘qualified donors’ in the report will generate bias in reporting Infectious Disease Markers (IDM) (see Table 7). The term ‘new donors’ in Council Recommendation 98/463/EC does not specify this and allows for the exclusion of ‘non-qualified donors’. Therefore, in this survey, the term ‘first time tested donors’ is used to include all donors who actually are tested for the first time, either at the time of donation or through pre-donation screening.
It should be taken into account that ‘first time donors’ are already a selected population and therefore the prevalence of infectious diseases markers in the general population of a given MS may be different. The ratio of first time donors to the total number of donors in general reflects the annual donor recruitment or, more generally, the turn-over rate in the donor base. This figure may, however, be influenced by recruitment programs. The number of first time donors, as compared to the total number of donors, becomes less meaningful in systems that only register donations and, less so, the uniquely identifiable donors themselves.
11
The Collection, Testing and Use of Blood and Blood Components in Europe (2008)
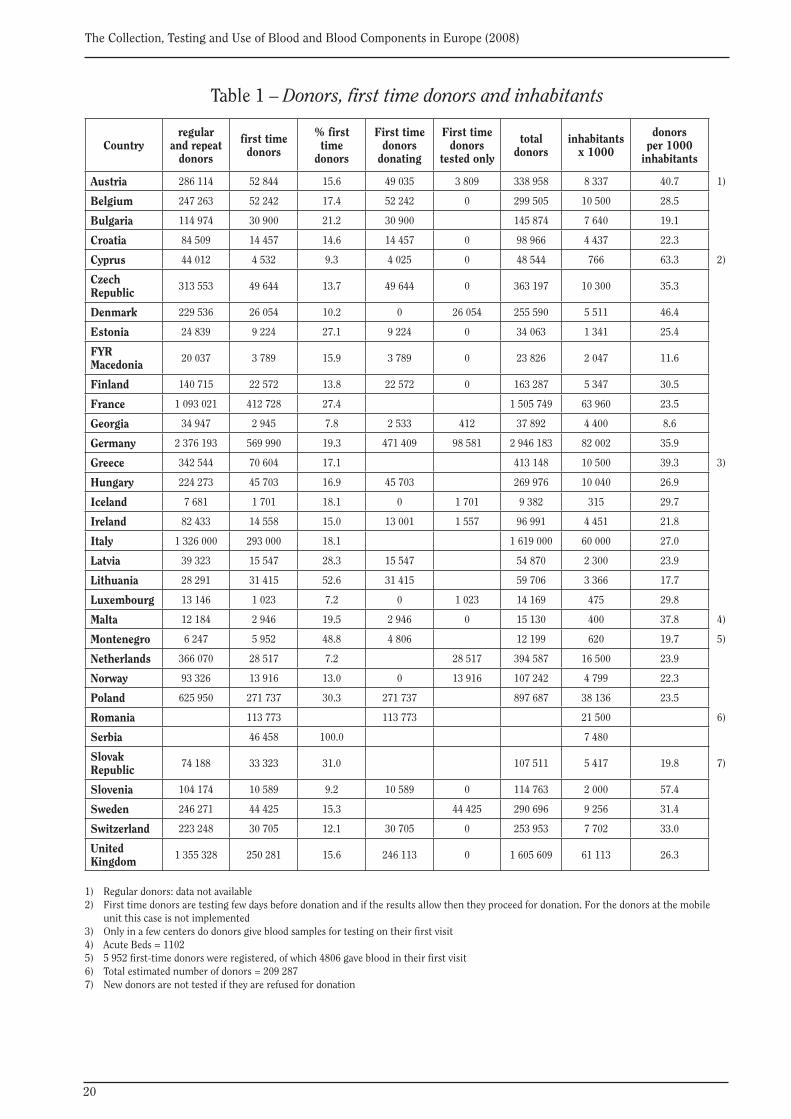
Excluding the 13 MS where first time donors and repeat plus regular donors were not reported separately, 19 % (range 7-53) of the total donor base consists of ‘first time’ donors. It is known that first time donors may have higher incidences of infectious diseases as compared to regular or repeat donors (Schreiber et al., 2001) and that higher incidence translates into an enhanced risk of donations being released with undetected viraemia.
The average number of donors in relation to the general population is 29 (range 9-63) per 1000 inhabitants. This number may reflect the commitment of the population to donate blood in relation to the demand. Differences exist but, arbitrarily, less than 10 donors per 1000 inhabitants should pose a problem with supply and around 30 donors per 1000 inhabitants seems an achievable goal from the given data. Not all countries with a relatively high number of donors per 1000 inhabitants deliver high numbers of red blood cell (RBC) Units (U) to hospitals (see Table 3), but in general these figures are related. As stated before, some caution as to the interpretation of the number of ‘active’ donors seems justified, and bias may occur by ‘inactive’ donors in the database. However, maintaining ‘inactive’ donors in the database may be a strategy to ‘re-activate’ known donors.
Profile of donations: Table 1.1
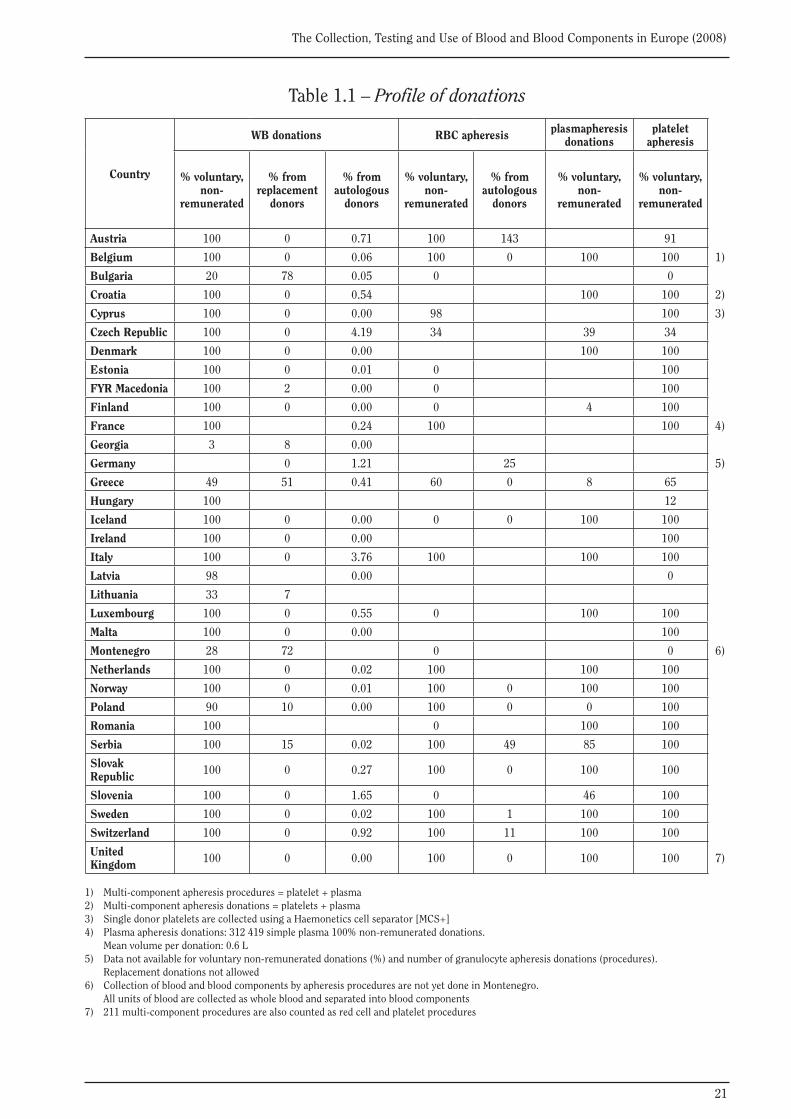
The relative contribution of voluntary non-remunerated donations to the supply is given in Table 1.1.
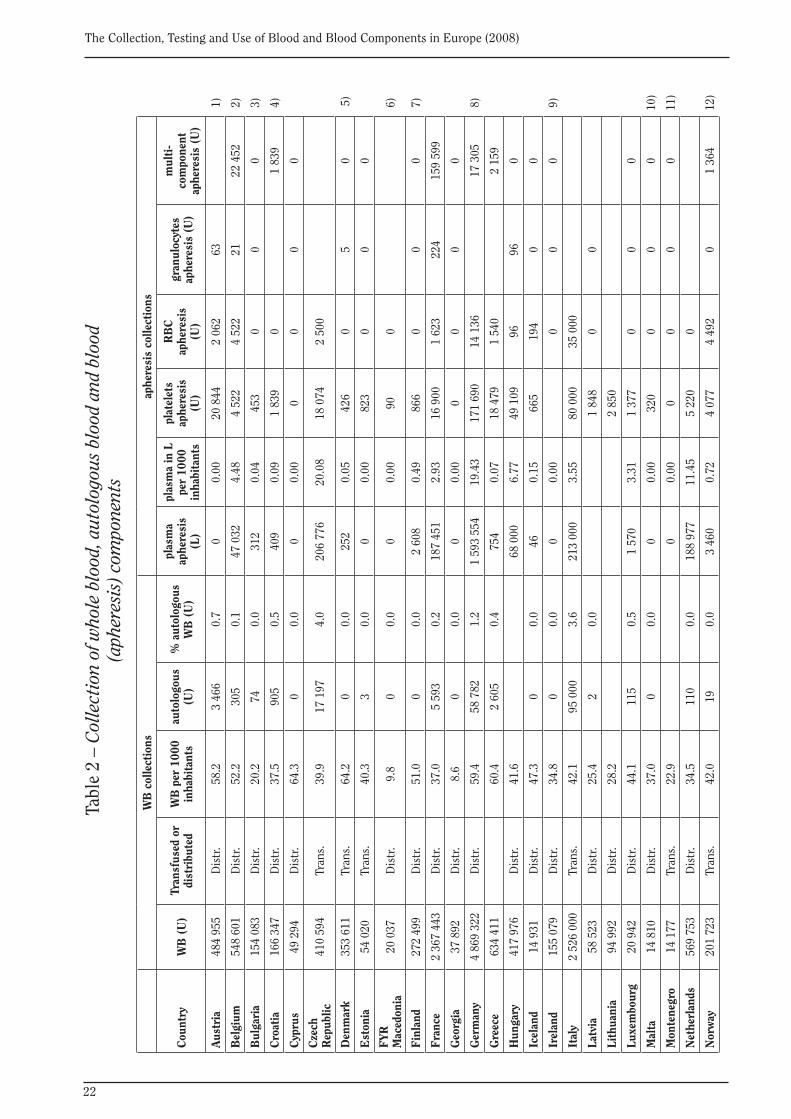
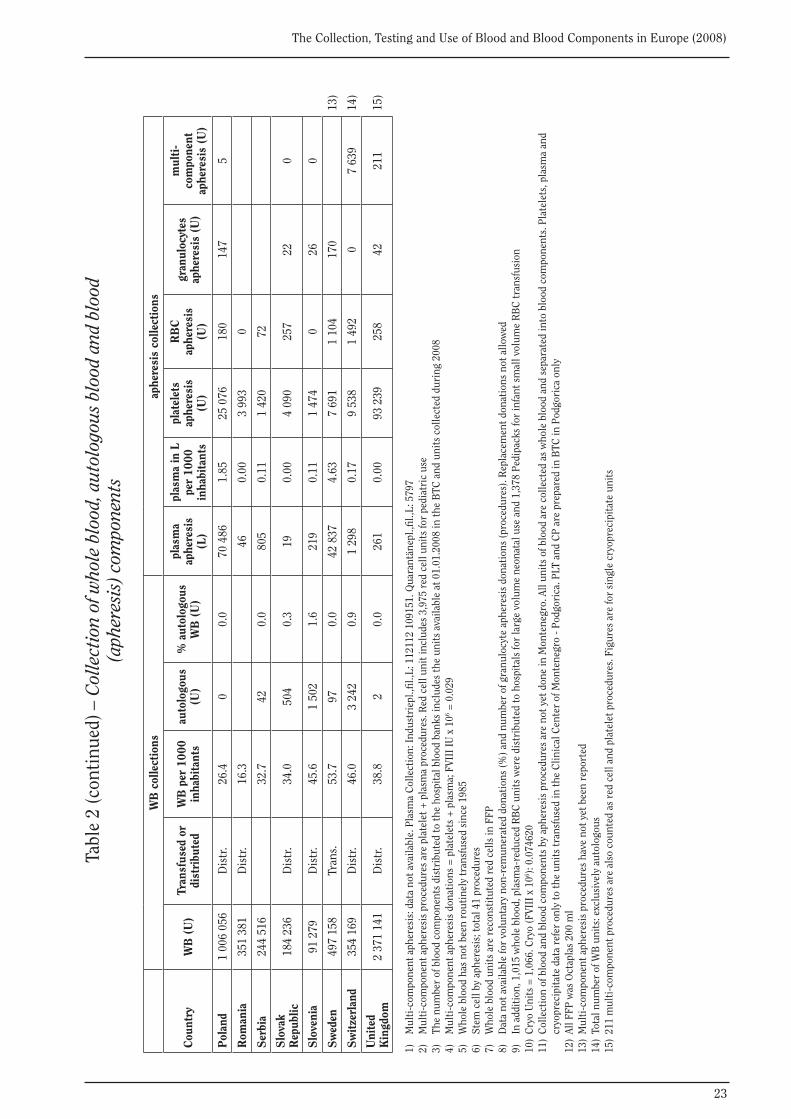
Collection of whole blood, autologous blood and blood components: Table 2• Whole blood
Whole Blood (WB) collections are the basis of the blood supply in most countries, not only for the preparation of blood components, but also for the delivery of ‘recovered plasma’ as source material for the manufacture of medicinal products (see Table 3). The number of WB collections in 28 reporting MS, is on average 39 (range 9-64) per 1000 inhabitants. Given the average use of RBC of 41 (range 9-60) per 1000 inhabitants (see Table 3), the number of WB donations collected appears to either conform to the demand for RBC components or determines their use in hospitals by limiting supply. It is noteworthy that the average use of RBC is slightly higher than the average of WB collections. This is due to the fact that a number of countries with a relatively low number of collections did not provide data on RBC use. For countries that provided numbers for both collection and RBC use, the latter is on average 4% lower than the number of units collected per 1000 inhabitants.
• Autologous blood
Autologous donations have been promoted in relation to safe blood transfusions by limiting exposure to allogeneic blood for patients and also with the purpose of enhancing the supply of blood. In general the factor of enhancing supply appears not to be significant: in 29 countries where autologous donations are given, they contribute on average around 0.5% (range 0-4%) to the WB donations. This is in agreement with the literature and previous reporting. However it should be taken into account that surgery and anaesthesiology techniques, such as pre-operative hemodilution and intra-operative blood salvage are not included in the presented data. In this survey only pre-operative autologous blood donations (PABD) are taken into account.
• Blood components (Apheresis)
Plasmapheresis collections provide source plasma, including plasma with specific antibodies, for fractionation into medicinal products. In some countries plasma for transfusion referred
12
The Collection, Testing and Use of Blood and Blood Components in Europe (2008)
to as Fresh Frozen Plasma (FFP) is also collected by apheresis donations. The volume of plasma collection by apheresis per 1000 inhabitants reflects the volume of the national plasmapheresis programs. In 31 reporting MS, on average 2.6 litres (L) (range 0-20L) of plasma per 1000 inhabitants is collected by plasmapheresis. Apparently, the Czech Republic, Germany and The Netherlands stand out as countries with considerably more extensive plasmapheresis programmes, with about 10 L or more of plasmapheresis plasma per 1000 inhabitants per annum.
Platelet apheresis may be aimed at Human Leucocyte Antigen (HLA) or Human Platelet Antigen (HPA) typed donations for refractory patients, as well as to replace the provision of platelets from pooled WB donations by apheresis platelets in order to reduce donor exposure in patients. The relative importance of platelet apheresis for the total supply of platelet products is given in Table 3. In 24 reporting MS, on average 38 % (range 0-93%) of the adult therapeutic doses of platelets are produced by apheresis. The extremes may reflect different models: low access to HLA typed platelet donors or MS striving towards 100% platelet supply by apheresis.
RBC apheresis is a relatively new development and may be of particular interest for autologous programmes, and for collections of rare types of RBC donors. It appears to be increasingly used for supply reasons.
Granulocyte apheresis donations are infrequent, as indications appear to be limited.
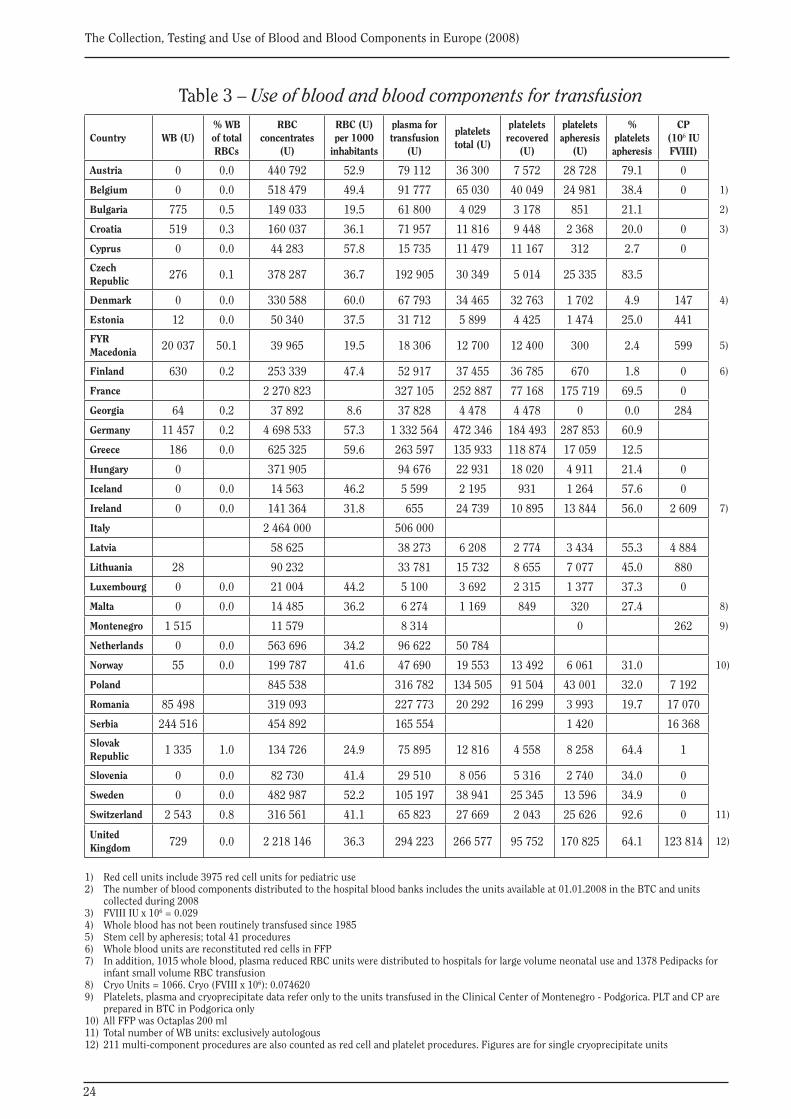
Use of blood and blood components for transfusion: Table 3
The term ‘the use of blood’ may be somewhat misleading as the reported data may not reflect the actual use of blood or blood components in the hospitals, but rather the number of blood components that have been delivered to hospitals by BE. This depends on the source of the data and the national infrastructure. Data on the use in hospitals are generally difficult to obtain in many MS, however in some countries such as Denmark, blood banks are hospital based and the data are related to actual transfusions issued. As component losses in hospitals are limited, for example by exceeding expiry dates, the number of blood components delivered to hospitals represents an acceptable proxy to the blood use estimate, and the heterogeneity of the given data may result in only minor deviations.
In 24 / 31 (77%) reporting MS, the use of blood is expressed as the units distributed by the blood establishments, in 7 it is reported as transfused units, and 2 MS have not reported this information.
WB must be considered as a source material and has no, or only a very restricted, use in transfusion therapy (Guide to the Preparation, Use and Quality Assurance of Blood and Blood Components, 8th edition, 2001). However in countries with limited resources transfusion therapy with WB may be needed when the infrastructure for blood component preparation is lacking. In 22 reporting countries, on average 2.2% (range 0-50%) of the RBC transfusions are performed with WB. In the Former Yugoslavian Republic of Macedonia, the use of WB accounts for more than half of the total volume of RBC products used.
The use of RBC per 1000 inhabitants varies considerably. In 22 reporting MS it averages 41 total RBC products per 1000 inhabitants (range 9-60). Rejman (2000) suggested in his report on the 1997 survey that 40 – 60 WB donations per 1000 inhabitants would be needed for optimal supply, a figure largely driven by the need for RBC for transfusion. Apparently the use of RBC has been greatly reduced in the last decade. RBC’s are mainly used in surgery, obstetrics, haematology and oncology care, and in some countries programmes for ‘better use of blood’ or for ‘optimal use of blood’ have recently been established in order to reduce unnecessary donor exposure to patients. Therefore, the use of 30 to 40 RBC U per 1000 inhabitants could reflect the results of
13
The Collection, Testing and Use of Blood and Blood Components in Europe (2008)
these programmes. In 3 / 24 (13%) of the reporting MS, less than 20 units per 1000 inhabitants are used, most likely reflecting insufficient supply of blood or limited hospital care. A better benchmark may be achieved by including the number of hospital beds in a future survey, and to relate this figure to RBC use.
The use of plasma for transfusion (FFP) has been discouraged over the last decade, mainly because its clinical indications are limited and more plasma was needed as source material for fractionation into medicinal products. However, with multiple coagulation disorders, including Thrombotic Thrombocytopenic Purpura (TTP), FFP transfusions are needed. In order to provide a benchmark, the use of plasma for transfusion can be related to the use of RBC transfusions (use of FFP/RBC ratio). It should be taken into account that, in the programmes for ‘better use of blood’ (e.g. RBC) in some countries, the decline of RBC use increased the FFP/RBC ratio. On average the FFP/RBC ratio is 0.34 (range 0.005-1, Table 4).
In Europe, platelets are generally recovered from 4-5 buffy-coats of WB donations. Discussions on blood safety in relation to Variant Creutzfeldt-Jakob disease (vCJD) have inspired programmes to enhance the use of random single-donor platelets by apheresis in order to reduce donor exposure to recipients. These programmes may have been influential in some MS where the use of apheresis platelets in relation to recovered platelets is relatively high. The extent to which donors are willing to undergo apheresis may be limited, as no supply reaches 100% apheresis platelets. On average in 29 reporting MS, 38% (range 0-93%) of the adult therapeutic doses of platelets are produced by (random) single donor platelets by apheresis (Table 3). In 10 countries this volume amounts to more than 50%.
Cryoprecipitate may incidentally be used for fibrinogen, Von Willebrand’s disease, and complex coagulation disorders. This product has largely been abandoned by most MS.
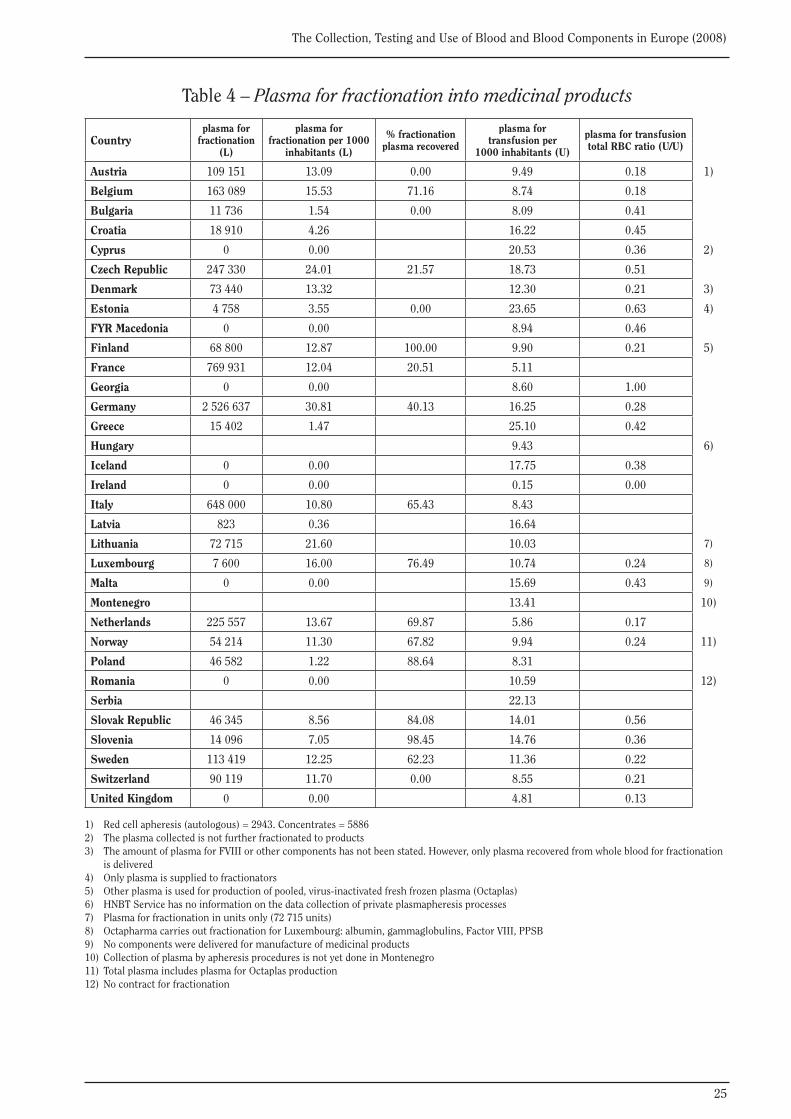
Plasma for fractionation: Table 4
The total amount of plasma issued for fractionation into medicinal products differs among MS. This becomes clearer if the figure is related to the population size. In 25 reporting MS, an average yield of 8.2 L (range 0-31 L) per 1000 inhabitants is found of plasma for fractionation into medicinal products. However, 5 / 30 (17%) of reporting MS deliver 15 L or more plasma per 1000 inhabitants.
In Europe, the main supply of plasma for fractionation is recovered plasma; in 17 reporting MS, on average 51% of the plasma for fractionation is from recovered plasma (range 0-100%).
Apart from a query on the total yield of plasma for fractionation, the questionnaire encompasses two specific questions on plasma delivered for factor VIII (FVIII) production versus other plasma for fractionation. These specific questions are poorly understood by respondents.
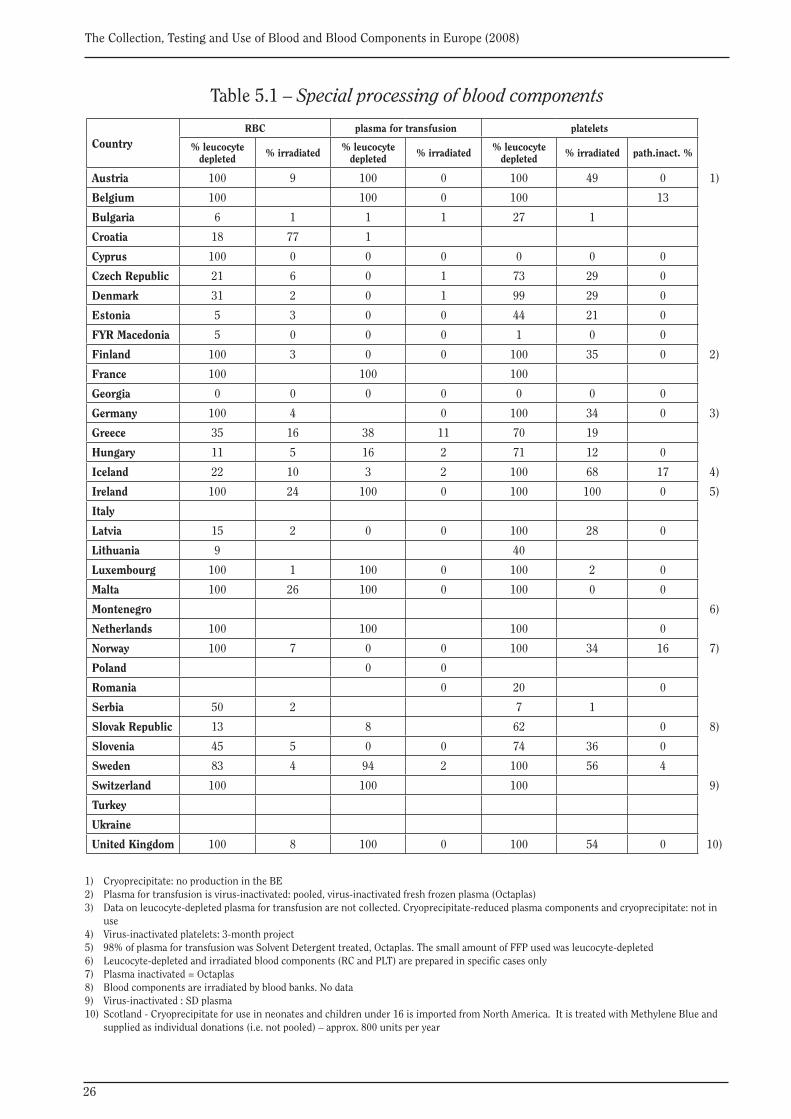
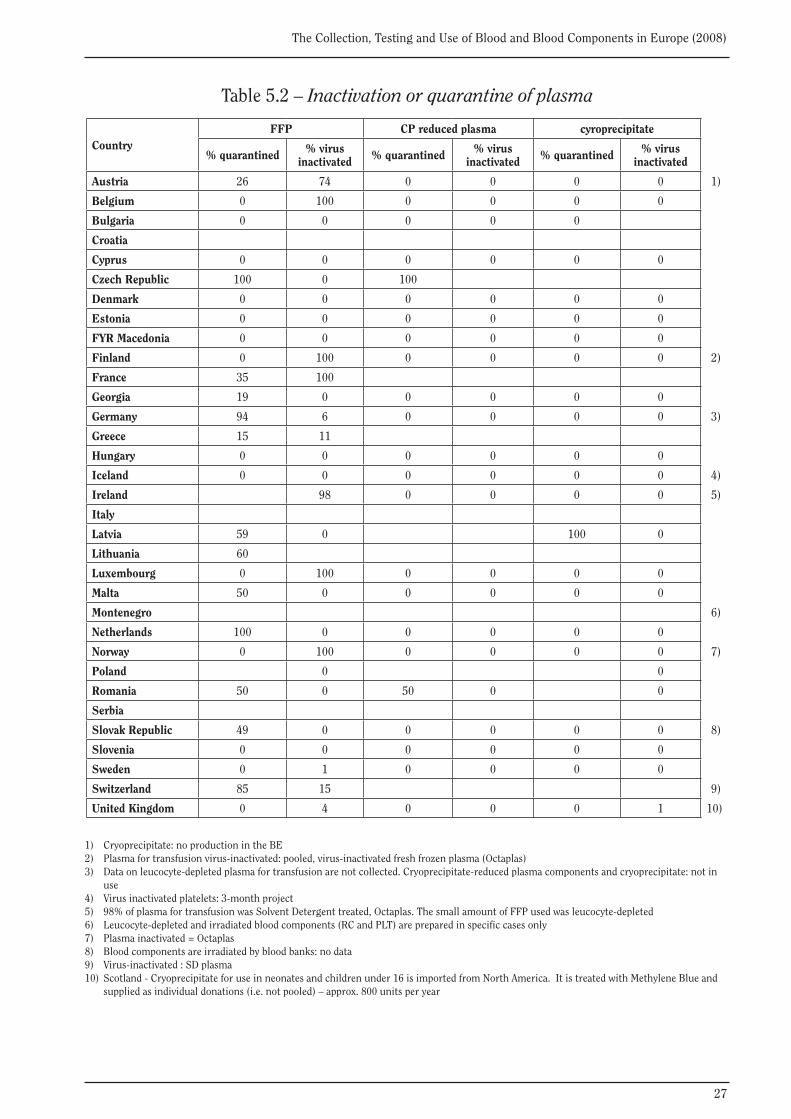
Special processing of blood components and pathogen reduction or quarantine of plasma: Tables 5.1 and 5.2
In 13 / 29 (45%) of reporting MS, 100% leucocyte depletion of RBC products is carried out. This is the case for platelet concentrates in 16 / 29 (55%) reporting MS (1 country applies it to 99% of platelets). Hundred percent leucocyte depletion is applied for plasma for transfusion in 9 / 27 (33%) of the reporting MS.
Irradiation of blood components is carried out in order to prevent Graft versus Host Disease (GvHD) (as a rule, this is relevant for blood components that may carry residual leucocytes), and for a selected group of recipients only. The numbers may reflect the volume of high clinical care; although, in many instances, irradiation is carried out in hospitals where it generally appears more difficult to obtain data.

14
The Collection, Testing and Use of Blood and Blood Components in Europe (2008)
FFP for transfusion, cryosupernatant plasma (CSP) and cryoprecipitate (CP) may be additionally safeguarded against infectious diseases. One method is a quarantine step where the plasma is stored and only released if the donor is negative for IDM on a subsequent donation 4-6 months later. Another method is the application of ‘virus inactivation’ or ‘pathogen reduction’ by Solvent Detergent (SD) or Methylene Blue (MB) treatment. In 10 / 24 (42%) reporting MS, nearly all FFP is safeguarded by either method, in 2 / 27 (7%) MS for 100% by quarantine, in 6 / 28 (21%) by 100% pathogen reduction (one of these MS reported for only 98% or more of FFP), and in 3 / 29 (10%) MS by a combination of both. In 38% of the reporting MS, all FFP plasma is safeguarded by one of these measures.
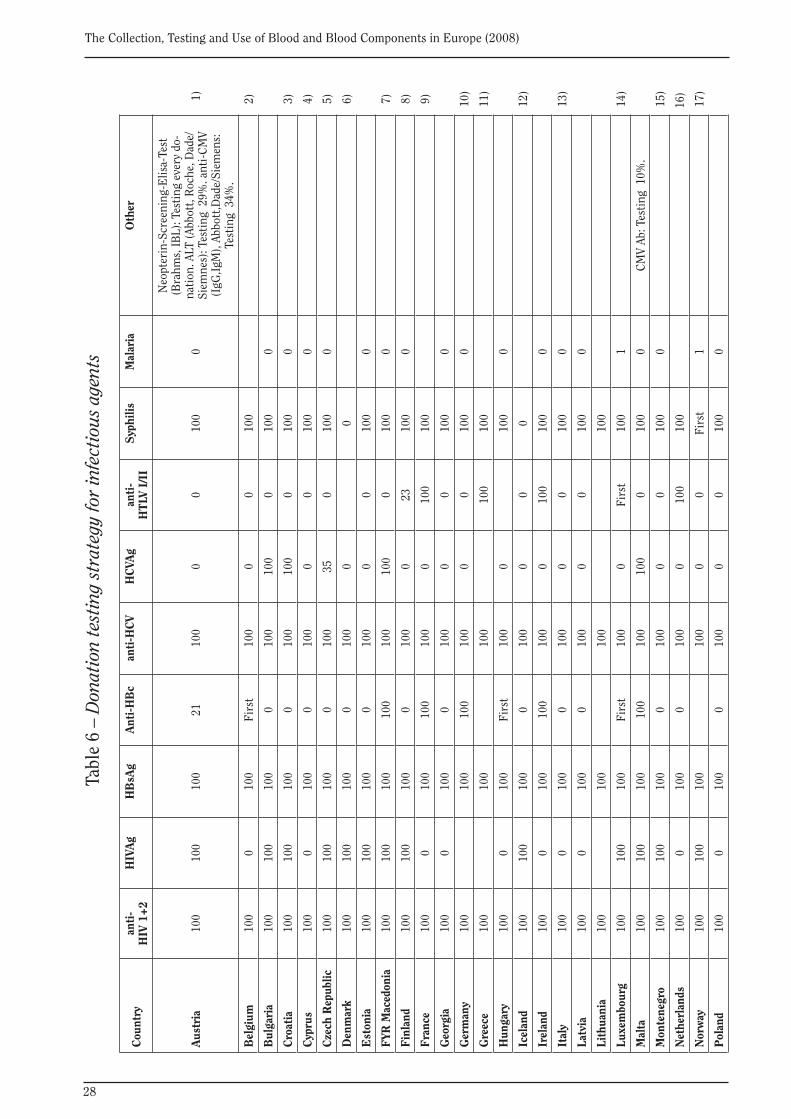
Screening for infectious agents, serological test methods: Table 6
In all 33 reporting MS, all donations are tested for anti-HIV-1/2, HBsAg and anti-HCV. In 30 / 33 (91%) of these MS, all donations are tested for syphilis. It is debated in the literature whether systematic syphilis testing is necessary.
Testing for anti-HTLV-I/II is performed on all donations in 6 / 30 (20%) reporting MS, and only on first time donors in 2 (7%) MS.
Testing for anti-HBc is performed on all donations in 6 (21%) reporting MS, and only on first time donors in 4 (14%) MS.
Confirmed seropositive donors, prevalence and incidence of infectious diseases: Tables 7.1 and 7.2
Given the limited positive predictive value of serological screening tests, donors who are found positive in blood screening for IDM generally need to be ‘confirmed’ with another technique aimed at diagnosing infection. Confirmed positive donors are then notified and deferred from further donations. A typical flow-chart for confirmation is given in EC Recommendation 98/463/EC.
In Table 7.1, the absolute numbers of ‘confirmed positive’ donors reported among all first time donors tested (see Table 1) and among all repeat donors tested (see Table 1) are given. Overall 28 of 33 (85%) MS were able to provide the absolute numbers of confirmed positive donors for HIV, HBV and HCV (see Table 7.1).
• First time donors
The frequency of ‘confirmed positive’ donors among all first time donors tested (see Table 1), yields the ‘prevalence’ of an IDM among first time donors. This reflects the characteristics of the population from which first time donors are recruited. It should be noted that the general population may have different rates of infectious diseases than blood donors. Even at their first visit, blood donors are a selected population. The ‘prevalence’ of infectious diseases among first time donors was calculated from Table 7.1 (number of confirmed positive donors) and Table 1 (number of first time donors), and the ratio is given in Table 7.2.
The prevalence per 100 000 first time tested donors, as calculated from the provided data sets (excluding the entry from FYR Macedonia, which is erroneous), ranges from 0 to 747 for HIV-1/2, from 0 to 31,919 for HBV and 0 to 57,895 for HCV. Although considerable differences in geographical distribution of these infections in Europe exist, it is questionable whether the extremely high frequencies in some countries (Georgia and Bulgaria) reflect reliable data sets on actual ‘confirmed positive donors’ or, merely, refer only to repeat positive donors screened by Enzyme-Linked Immunosorbent Assay (ELISA) and, thereby, including many false positives (see
15
The Collection, Testing and Use of Blood and Blood Components in Europe (2008)
definitions in the questionnaire in appendix). The geographical distribution of the high prevalence areas may coincide with low resources and lack of confirmatory testing. Median estimates might, therefore, be more appropriate values as a reference for European prevalence amongst first time donors. The median prevalence amongst first time tested donors is 6.9, 115 and 63 per 100 000 donors for HIV-1/2, HBV and HCV respectively.
• Repeat and regular donors
The frequency of ‘confirmed positive’ donors among all repeat and regular donors tested yields the ‘incidence’ of an infectious disease among repeat and regular donors (i.e. those donors who had previously been tested, were found to be negative, and were allowed to donate again). This ‘incidence’ accounts for the frequency with which repeat and regular donors acquire a new infection. It is this frequency that directly relates to blood safety via the window period of infectious disease testing (Schreiber et al., 1996, Guideline on Epidemiological data EMEA/ CPMP/BWP/3794/03). The incidence of infectious diseases among repeat and regular donors was calculated from Table 7.1 (number of confirmed positive donors) and Table 1 (number of repeat and regular donors), and is given in Table 7.2. As with the prevalence data in first time donors, the extremely high incidences may refer only to repeat positive donors of ELISA screening instead of confirmed positive donors and, thereby, include many false positives (see definitions in the questionnaire). The geographical distribution of the high incidence areas coincides with high prevalence areas and may be linked to low resources and lack of confirmatory testing.
Notwithstanding the limitations of the data and the question as to whether all positive screening test donors were submitted to confirmatory testing, the prevalence and incidence rates of infectious diseases vary greatly among MS. Overall it is to be noted that, in Europe, a North-South gradient exists: HBV and HCV infections are more common in southern countries.
The incidence per 100 000 repeat tested donor years, if calculated from the provided data sets, ranges from 0 to 75 for HIV-1/2, from 0 to 1,003 for HBV and 0 to 225 for HCV. Although considerable differences in geographical distribution of these infections in Europe exist, it is doubtful whether the very high frequencies of some countries (FYR Macedonia) reflect reliable data sets or, merely, refer only to ELISA screening positive donors (including many false positives), as opposed to ‘confirmed positive donors’ (see definitions in the questionnaire). Again, the median incidence amongst repeat donors is 0.6, 1.7 and 2.0 per 100 000 donor years for HIV-1/2, HBV and HCV, respectively.
Nucleic Acid Amplification Techniques (NAT) testing and NAT-only confirmed positive donors: Tables 8.1 and 8.2
NAT testing for HIV is performed on each donation in 17 / 29 (59%) reporting MS. NAT testing for HBV is performed on each donation in 10 / 28 (36%) reporting MS. NAT for HCV is performed on each donation in 16 / 28 (57%) of the reporting MS. Interestingly, NAT on each donation appears to be performed more often in MS where the incidence rates are relatively low (see Table 7.2 for comparison). As the effectiveness (or ‘yield’) of NAT testing relates to the incidence, an argument could be made for preferentially applying NAT testing in high incidence areas. Unfortunately these areas appear to coincide with limited resources.
The ‘yield’ of NAT is defined as the identification of a NAT-positive donor, who is not found seropositive for that virus in serological screening on the same donation, but is shown later to be a confirmed positive through detection from an additional NAT test on the same sample or by serology. The yield of NAT for HCV, HIV and HBV among first time tested donors and among repeat donors is given in Table 8.2.
16
The Collection, Testing and Use of Blood and Blood Components in Europe (2008)
Bacterial screening: Table 9
A new data set for bacterial screening of platelet concentrates was added in the 2004 report. Haemovigilance data have repeatedly shown the importance of bacterial safety of platelet concentrates. This is due to the fact that the storage temperature of platelets is around 22 °C, thus allowing bacterial growth more easily. Data on bacterial testing were reported by 24 / 33 (73 %) MS. In 5 / 24 (21%) MS, culture is performed on over 80% of all platelets (concentrates recovered both from WB donations and apheresis platelets).
Organisation and registration: Table 10
All 33 MS report that there are legally-binding national regulations for the collection, testing, processing, storage and distribution of blood and blood components. In 25 / 33 (76%) of the reporting MS a National Council or Expert Committee advises the Ministry of Health on transfusion related issues. In 24 / 30 (80%) MS, a national blood policy on the quality and safety of blood and blood components is being implemented.
Quality management: Tables 11a, 11b and 11c
In 29 / 32 (91%) of the reporting MS, a Quality System (QS) is established and maintained by BE. In 20 / 24 (83%) of the reporting MS, 100% of the donations are covered by GMP. In 3 countries that have no GMP, 100% of donations are covered by ISO 9000. Four countries have both 100% GMP and 100% ISO. In Italy, ISO only covers 40% of all donations, but 100% of donations are covered by other regulations. In Malta, all donations are covered by other regulations (EU directive and the EDQM manual). In total 25 / 30 reporting countries (83%) have procedures covering 100% of donations.
In 29 / 33 (94%) of the reporting MS inspections are performed at least every 2 years; the large majority of these inspections (9 / 29, 69%) are (partially) carried out by the national authority.
It is requested that the labelling of donations and issued components is unique so as to allow complete traceability. Labelling according to ISBT-128 for 100% of the donation number is partially performed in 10 / 20 (50%) MS. However, labelling of all donations to either ISBT standards or another system is performed by 27 / 31 of reporting countries (87%).
Labelling of the finished component code is more complex, and generally lags behind developments in donation labelling, as it includes implementation of automation applications in hospitals. ISBT-128 labelling of all issued component is performed in 6 / 18 (33%) reporting countries. However, 24 / 28 countries (86%) report that all components are coded by either ISBT or another system.
A national haemovigilance reporting system has been established in 29 / 33 (88%) MS.
Haemovigilance: Table 12
Since 2004 this survey contains data on haemovigilance i.e. the reporting of serious adverse reactions. The format for data acquisition on haemovigilance in the 2004 questionnaire in its basic form was developed by CoE experts, submitted to the EC and adapted after slight modifications by the EC into Directive 2005/61/EC. Reporting of serious adverse reactions, as performed in haemovigilance programmes, can be considered as a high level of surveillance, as most of these serious reactions are not unexpected untoward effects but well known complications of blood transfusion from the medical literature and commonly indicated in the ‘information leaflets’ for physicians and patients. Most recipients of blood transfusions are very ill
17
The Collection, Testing and Use of Blood and Blood Components in Europe (2008)
and have underlying pathology or medications that greatly influence the signs and symptoms of a possible transfusion reaction. A serious adverse reaction during or immediatly after transfusion, even if most likely related to the transfusion, may be restricted to the given recipient. Therefore, in this report only those serious adverse reactions are presented which are probably or certainly (imputability grade 2 to 3, i.e. likely or certain) related to the transfusion of the blood component. The term imputability includes the causal relationship to the component properties, but also to the transfusion itself (Transfusion Associated Circulatory Overload (TACO)) or recipient properties (allergy).
In contrast to the EC Directives 2002/98/EC and 2005/61/EC, haemovigilance data which may not be caused by blood component properties, such as TACO are also reported here. Haemovigilance data submitted by 23 MS, are presented in Table 12.
Of the Member States that reported having a national haemovigilance system, 23 / 29 (79%) provided actual haemovigilance data. The incidence of serious adverse reactions with high imputability (level 2 to 3) can be calculated relative to the total number of blood components (WB + RBC + plasma + platelets) issued. Taking into account the possibility of under-reporting and the differences in national reporting systems, the incidence of 6.9 serious adverse reactions per 100 000 distributed blood components seems a reasonable estimate. Haemolysis, anaphylaxis, TRALI and TACO and transfusion associated HCV infections appear to be the most frequent serious adverse reactions.
18
The Collection, Testing and Use of Blood and Blood Components in Europe (2008)
REFERENCES• Guide to the preparation, use and quality assurance of blood components. Recommendation No. R (85) 15, 13th edition, January 2007, Council of Europe Publishing, Strasbourg.
• Guideline on Epidemiological data on Blood Transmissible Infections for inclusion in the Guideline on the Scientific data requirements for a Plasma Master File EMEA/CPMP/ BWP/3794/03
• Trends and observations on the Collection, Testing and Use of Blood and Blood Components in Europe, 2001-2005 report, Council of Europe, February 2001
• The Collection, Testing and Use of Blood and Blood Components in Europe, 2005 report, Council of Europe, February 2011.
• The Collection, Testing and Use of Blood and Blood Components in Europe, 2006 report, Council of Europe, February 2011.
• Questionnaire on the collection, testing and use of blood and blood products in Europe, Council of Europe Publishing, Strasbourg, 22 May 2004, SP-HM (2002) 12.
• The Collection, Testing and Use of Blood and Blood Products in Europe in 2001, Council of Europe Publishing, Strasbourg, 2004, www.edqm.eu/medias/fichiers/2001.
• Council Recommendation 98/463/EC on the suitability of blood and plasma donors and the screening of donated blood in the European Community, European Community.
• Directive 2002/98/EC of the European Parliament and of the Council of 27 January 2004, setting standards of quality and safety for the collection, testing, processing, storage and distribution of human blood and blood components and amending Directive 2001/83/EC.
• Rejman A. The collection and use of human blood and plasma in the non- European Union Council of Europe Member States in 1997, Council of Europe Publishing, Strasbourg, 2000.
• Schreiber GB, Busch MP, Kleinman SH, Korelitz JJ. The risk of transfusion transmitted viral infections. The Retrovirus Epidemiology Study. N Engl J Med 1996; 334:1685–1690.
• Schreiber GB, Glynn SA, Busch MP, Sharma UK, Wright DJ, Kleinman SH. Retrovirus Epidemiology Donor Study. Incidence rates of viral infections among repeat donors: are frequent donors safer? Transfusion 2001;41:730-735.
• Guideline on Epidemiological data on Blood Transmissible Infections for inclusion in the Guideline on the Scientific data requirements for a Plasma Master File EMEA/CPMP/ BWP/3794/03.
19
The Collection, Testing and Use of Blood and Blood Components in Europe (2008)
List of countries having participated in the survey (33 out 46 MS)
Austria, Belgium, Bulgaria, Croatia, Cyprus, Czech Republic, Denmark, Estonia, FYR Macedonia, Finland, France, Georgia, Germany, Greece, Hungary, Iceland, Ireland, Italy, Latvia, Lithuania, Luxembourg, Malta, Montenegro, Netherlands, Norway, Poland, Romania, Serbia, Slovak Republic, Slovenia, Sweden, Switzerland, United Kingdom
TABLES
20
The Collection, Testing and Use of Blood and Blood Components in Europe (2008)
Table 1 – Donors, first time donors and inhabitants
Countryregular
and repeat donors
first time donors
% first time
donors
First time donors
donating
First time donors
tested only
total donors
inhabitants x 1000
donors per 1000
inhabitants
Austria 286 114 52 844 15.6 49 035 3 809 338 958 8 337 40.7 1)
Belgium 247 263 52 242 17.4 52 242 0 299 505 10 500 28.5
Bulgaria 114 974 30 900 21.2 30 900 145 874 7 640 19.1
Croatia 84 509 14 457 14.6 14 457 0 98 966 4 437 22.3
Cyprus 44 012 4 532 9.3 4 025 0 48 544 766 63.3 2)
Czech Republic 313 553 49 644 13.7 49 644 0 363 197 10 300 35.3
Denmark 229 536 26 054 10.2 0 26 054 255 590 5 511 46.4
Estonia 24 839 9 224 27.1 9 224 0 34 063 1 341 25.4
FYR Macedonia 20 037 3 789 15.9 3 789 0 23 826 2 047 11.6
Finland 140 715 22 572 13.8 22 572 0 163 287 5 347 30.5
France 1 093 021 412 728 27.4 1 505 749 63 960 23.5
Georgia 34 947 2 945 7.8 2 533 412 37 892 4 400 8.6
Germany 2 376 193 569 990 19.3 471 409 98 581 2 946 183 82 002 35.9
Greece 342 544 70 604 17.1 413 148 10 500 39.3 3)
Hungary 224 273 45 703 16.9 45 703 269 976 10 040 26.9
Iceland 7 681 1 701 18.1 0 1 701 9 382 315 29.7
Ireland 82 433 14 558 15.0 13 001 1 557 96 991 4 451 21.8
Italy 1 326 000 293 000 18.1 1 619 000 60 000 27.0
Latvia 39 323 15 547 28.3 15 547 54 870 2 300 23.9
Lithuania 28 291 31 415 52.6 31 415 59 706 3 366 17.7
Luxembourg 13 146 1 023 7.2 0 1 023 14 169 475 29.8
Malta 12 184 2 946 19.5 2 946 0 15 130 400 37.8 4)
Montenegro 6 247 5 952 48.8 4 806 12 199 620 19.7 5)
Netherlands 366 070 28 517 7.2 28 517 394 587 16 500 23.9
Norway 93 326 13 916 13.0 0 13 916 107 242 4 799 22.3
Poland 625 950 271 737 30.3 271 737 897 687 38 136 23.5
Romania 113 773 113 773 21 500 6)
Serbia 46 458 100.0 7 480
Slovak Republic 74 188 33 323 31.0 107 511 5 417 19.8 7)
Slovenia 104 174 10 589 9.2 10 589 0 114 763 2 000 57.4
Sweden 246 271 44 425 15.3 44 425 290 696 9 256 31.4
Switzerland 223 248 30 705 12.1 30 705 0 253 953 7 702 33.0
United Kingdom 1 355 328 250 281 15.6 246 113 0 1 605 609 61 113 26.3
1) Regular donors: data not available2) First time donors are testing few days before donation and if the results allow then they proceed for donation. For the donors at the mobile unit this case is not implemented3) Only in a few centers do donors give blood samples for testing on their first visit4) Acute Beds = 1102 5) 5 952 first-time donors were registered, of which 4806 gave blood in their first visit6) Total estimated number of donors = 209 2877) New donors are not tested if they are refused for donation
21
The Collection, Testing and Use of Blood and Blood Components in Europe (2008)
Table 1.1 – Profile of donations
Country
WB donations RBC apheresis plasmapheresis donations
platelet apheresis
% voluntary, non-
remunerated
% from replacement
donors
% from autologous
donors
% voluntary, non-
remunerated
% from autologous
donors
% voluntary, non-
remunerated
% voluntary, non-
remunerated
Austria 100 0 0.71 100 143 91
Belgium 100 0 0.06 100 0 100 100 1)
Bulgaria 20 78 0.05 0 0
Croatia 100 0 0.54 100 100 2)
Cyprus 100 0 0.00 98 100 3)
Czech Republic 100 0 4.19 34 39 34
Denmark 100 0 0.00 100 100
Estonia 100 0 0.01 0 100
FYR Macedonia 100 2 0.00 0 100
Finland 100 0 0.00 0 4 100
France 100 0.24 100 100 4)
Georgia 3 8 0.00
Germany 0 1.21 25 5)
Greece 49 51 0.41 60 0 8 65
Hungary 100 12
Iceland 100 0 0.00 0 0 100 100
Ireland 100 0 0.00 100
Italy 100 0 3.76 100 100 100
Latvia 98 0.00 0
Lithuania 33 7
Luxembourg 100 0 0.55 0 100 100
Malta 100 0 0.00 100
Montenegro 28 72 0 0 6)
Netherlands 100 0 0.02 100 100 100
Norway 100 0 0.01 100 0 100 100
Poland 90 10 0.00 100 0 0 100
Romania 100 0 100 100
Serbia 100 15 0.02 100 49 85 100
Slovak Republic 100 0 0.27 100 0 100 100
Slovenia 100 0 1.65 0 46 100
Sweden 100 0 0.02 100 1 100 100
Switzerland 100 0 0.92 100 11 100 100
United Kingdom 100 0 0.00 100 0 100 100 7)
1) Multi-component apheresis procedures = platelet + plasma 2) Multi-component apheresis donations = platelets + plasma 3) Single donor platelets are collected using a Haemonetics cell separator [MCS+] 4) Plasma apheresis donations: 312 419 simple plasma 100% non-remunerated donations. Mean volume per donation: 0.6 L 5) Data not available for voluntary non-remunerated donations (%) and number of granulocyte apheresis donations (procedures). Replacement donations not allowed 6) Collection of blood and blood components by apheresis procedures are not yet done in Montenegro. All units of blood are collected as whole blood and separated into blood components 7) 211 multi-component procedures are also counted as red cell and platelet procedures
22
The Collection, Testing and Use of Blood and Blood Components in Europe (2008)
Tabl
e 2
– C
olle
ctio
n of
who
le b
lood
, aut
olog
ous
bloo
d an
d bl
ood
(aph
eres
is) c
ompo
nent
s
WB
col
lect
ions
aphe
resi
s co
llect
ions
Cou
ntry
WB
(U
)Tr
ansf
used
or
dist
ribu
ted
WB
per
100
0 in
habi
tant
sau
tolo
gous
(U
)%
aut
olog
ous
WB
(U
)
plas
ma
aphe
resi
s (L
)
plas
ma
in L
pe
r 10
00
inha
bita
nts
plat
elet
s ap
here
sis
(U)
RB
C
aphe
resi
s (U
)
gran
uloc
ytes
ap
here
sis
(U)
mul
ti-
com
pone
nt
aphe
resi
s (U
)
Aus
tria
484
955
Dis
tr.
58.2
3 46
60.
70
0.00
20 8
442
062
631)
Bel
gium
548
601
Dis
tr.
52.2
305
0.1
47 0
324.
484
522
4 52
221
22 4
522)
Bul
gari
a15
4 08
3D
istr
.20
.274
0.0
312
0.04
453
00
03)
Cro
atia
166
347
Dis
tr.
37.5
905
0.5
409
0.09
1 83
90
1 83
94)
Cyp
rus
49 2
94D
istr
.64
.30
0.0
00.
000
00
0
Cze
ch
Rep
ublic
410
594
Tran
s.39
.917
197
4.0
206
776
20.0
818
074
2 50
0
Den
mar
k35
3 61
1Tr
ans.
64.2
00.
025
20.
0542
60
50
5)
Est
onia
54 0
20Tr
ans.
40.3
30.
00
0.00
823
00
0
FYR
M
aced
onia
20 0
37D
istr
.9.
80
0.0
00.
0090
06)
Fin
land
272
499
Dis
tr.
51.0
00.
02
608
0.49
866
00
07)
Fra
nce
2 36
7 44
3D
istr
.37
.05
593
0.2
187
451
2.93
16 9
001
623
224
159
599
Geo
rgia
37 8
92D
istr
.8.
60
0.0
00.
000
00
0
Ger
man
y4
869
322
Dis
tr.
59.4
58 7
821.
21
593
554
19.4
317
1 69
014
136
17 3
058)
Gre
ece
634
411
60.4
2 60
50.
475
40.
0718
479
1 54
02
159
Hun
gary
417
976
Dis
tr.
41.6
68 0
006.
7749
109
9696
0
Icel
and
14 9
31D
istr
.47
.30
0.0
460.
1566
519
40
0
Irel
and
155
079
Dis
tr.
34.8
00.
00
0.00
00
09)
Ital
y2
526
000
Tran
s.42
.195
000
3.6
213
000
3.55
80 0
0035
000
Latv
ia58
523
Dis
tr.
25.4
20.
01
848
00
Lith
uani
a94
992
Dis
tr.
28.2
2 85
0
Luxe
mbo
urg
20 9
42D
istr
.44
.111
50.
51
570
3.31
1 37
70
00
Mal
ta14
810
Dis
tr.
37.0
00.
00
0.00
320
00
010
)
Mon
tene
gro
14 1
77Tr
ans.
22.9
00.
000
00
011
)
Net
herl
ands
569
753
Dis
tr.
34.5
110
0.0
188
977
11.4
55
220
0
Nor
way
201
723
Tran
s.42
.019
0.0
3 46
00.
724
077
4 49
20
1 36
412
)
23
The Collection, Testing and Use of Blood and Blood Components in Europe (2008)
WB
col
lect
ions
aphe
resi
s co
llect
ions
Cou
ntry
WB
(U
)Tr
ansf
used
or
dist
ribu
ted
WB
per
100
0 in
habi
tant
sau
tolo
gous
(U
)%
aut
olog
ous
WB
(U
)
plas
ma
aphe
resi
s (L
)
plas
ma
in L
pe
r 10
00
inha
bita
nts
plat
elet
s ap
here
sis
(U)
RB
C
aphe
resi
s (U
)
gran
uloc
ytes
ap
here
sis
(U)
mul
ti-
com
pone
nt
aphe
resi
s (U
)
Pol
and
1 00
6 05
6D
istr
.26
.40
0.0
70 4
861.
8525
076
180
147
5
Rom
ania
351
381
Dis
tr.
16.3
460.
003
993
0
Ser
bia
244
516
32.7
420.
080
50.
111
420
72
Slo
vak
Rep
ublic
18
4 23
6D
istr
.34
.050
40.
319
0.00
4 09
025
722
0
Slo
veni
a91
279
Dis
tr.
45.6
1 50
21.
621
90.
111
474
026
0
Sw
eden
497
158
Tran
s.53
.797
0.0
42 8
374.
637
691
1 10
417
013
)
Sw
itze
rlan
d35
4 16
9D
istr
.46
.03
242
0.9
1 29
80.
179
538
1 49
20
7 63
914
)
Uni
ted
Kin
gdom
2 37
1 14
1D
istr
.38
.82
0.0
261
0.00
93 2
3925
842
211
15)
1)
Mul
ti-c
ompo
nent
aph
eres
is: d
ata
not a
vaila
ble.
Pla
sma
Col
lect
ion:
Indu
stri
epl.,
fi l.,L
: 112
112
1091
51. Q
uara
ntän
epl.,
fi l.,L
: 579
72)
M
ulti
-com
pone
nt a
pher
esis
pro
cedu
res
are
plat
elet
+ p
lasm
a pr
oced
ures
. Red
cel
l uni
t inc
lude
s 3,
975
red
cell
unit
s fo
r pe
diat
ric
use
3)
The
num
ber
of b
lood
com
pone
nts
dist
ribu
ted
to th
e ho
spit
al b
lood
ban
ks in
clud
es th
e un
its
avai
labl
e at
01.
01.2
008
in th
e B
TC a
nd u
nits
col
lect
ed d
urin
g 20
08
4)
M
ulti
-com
pone
nt a
pher
esis
don
atio
ns =
pla
tele
ts +
pla
sma;
FVI
II IU
x 1
06 = 0
.029
5)
Who
le b
lood
has
not
bee
n ro
utin
ely
tran
sfus
ed s
ince
198
5
6)
Stem
cel
l by
aphe
resi
s; to
tal 4
1 pr
oced
ures
7)
W
hole
blo
od u
nits
are
rec
onst
itut
ed r
ed c
ells
in F
FP8)
D
ata
not a
vaila
ble
for
volu
ntar
y no
n-re
mun
erat
ed d
onat
ions
(%) a
nd n
umbe
r of
gra
nulo
cyte
aph
eres
is d
onat
ions
(pro
cedu
res)
. Rep
lace
men
t don
atio
ns n
ot a
llow
ed
9)
In
add
itio
n, 1
,015
who
le b
lood
, pla
sma-
redu
ced
RB
C u
nits
wer
e di
stri
bute
d to
hos
pita
ls fo
r la
rge
volu
me
neon
atal
use
and
1,3
78 P
edip
acks
for
infa
nt s
mal
l vol
ume
RB
C tr
ansf
usio
n10
) C
ryo
Uni
ts =
1,0
66. C
ryo
(FVI
II x
106 )
: 0.0
7462
011
) C
olle
ctio
n of
blo
od a
nd b
lood
com
pone
nts
by a
pher
esis
pro
cedu
res
are
not y
et d
one
in M
onte
negr
o. A
ll un
its
of b
lood
are
col
lect
ed a
s w
hole
blo
od a
nd s
epar
ated
into
blo
od c
ompo
nent
s. P
late
lets
, pla
sma
and
cr
yopr
ecip
itat
e da
ta r
efer
onl
y to
the
unit
s tr
ansf
used
in th
e C
linic
al C
ente
r of
Mon
tene
gro
- Pod
gori
ca. P
LT a
nd C
P ar
e pr
epar
ed in
BTC
in P
odgo
rica
onl
y
12)
All F
FP w
as O
ctap
las
200
ml
13
) M
ulti
-com
pone
nt a
pher
esis
pro
cedu
res
have
not
yet
bee
n re
port
ed
14)
Tota
l num
ber
of W
B u
nits
: exc
lusi
vely
aut
olog
ous
15
) 21
1 m
ulti
-com
pone
nt p
roce
dure
s ar
e al
so c
ount
ed a
s re
d ce
ll an
d pl
atel
et p
roce
dure
s. F
igur
es a
re fo
r si
ngle
cry
opre
cipi
tate
uni
ts
Tabl
e 2
(con
tinu
ed) –
Col
lect
ion
of w
hole
blo
od, a
utol
ogou
s bl
ood
and
bloo
d (a
pher
esis
) com
pone
nts
24
The Collection, Testing and Use of Blood and Blood Components in Europe (2008)
Table 3 – Use of blood and blood components for transfusion
Country WB (U)% WB of total RBCs
RBC concentrates
(U)
RBC (U) per 1000
inhabitants
plasma for transfusion
(U)
platelets total (U)
platelets recovered
(U)
platelets apheresis
(U)
% platelets apheresis
CP (106 IU FVIII)
Austria 0 0.0 440 792 52.9 79 112 36 300 7 572 28 728 79.1 0
Belgium 0 0.0 518 479 49.4 91 777 65 030 40 049 24 981 38.4 0 1)
Bulgaria 775 0.5 149 033 19.5 61 800 4 029 3 178 851 21.1 2)
Croatia 519 0.3 160 037 36.1 71 957 11 816 9 448 2 368 20.0 0 3)
Cyprus 0 0.0 44 283 57.8 15 735 11 479 11 167 312 2.7 0
Czech Republic 276 0.1 378 287 36.7 192 905 30 349 5 014 25 335 83.5
Denmark 0 0.0 330 588 60.0 67 793 34 465 32 763 1 702 4.9 147 4)
Estonia 12 0.0 50 340 37.5 31 712 5 899 4 425 1 474 25.0 441
FYR Macedonia 20 037 50.1 39 965 19.5 18 306 12 700 12 400 300 2.4 599 5)
Finland 630 0.2 253 339 47.4 52 917 37 455 36 785 670 1.8 0 6)
France 2 270 823 327 105 252 887 77 168 175 719 69.5 0
Georgia 64 0.2 37 892 8.6 37 828 4 478 4 478 0 0.0 284
Germany 11 457 0.2 4 698 533 57.3 1 332 564 472 346 184 493 287 853 60.9
Greece 186 0.0 625 325 59.6 263 597 135 933 118 874 17 059 12.5
Hungary 0 371 905 94 676 22 931 18 020 4 911 21.4 0
Iceland 0 0.0 14 563 46.2 5 599 2 195 931 1 264 57.6 0
Ireland 0 0.0 141 364 31.8 655 24 739 10 895 13 844 56.0 2 609 7)
Italy 2 464 000 506 000
Latvia 58 625 38 273 6 208 2 774 3 434 55.3 4 884
Lithuania 28 90 232 33 781 15 732 8 655 7 077 45.0 880
Luxembourg 0 0.0 21 004 44.2 5 100 3 692 2 315 1 377 37.3 0
Malta 0 0.0 14 485 36.2 6 274 1 169 849 320 27.4 8)
Montenegro 1 515 11 579 8 314 0 262 9)
Netherlands 0 0.0 563 696 34.2 96 622 50 784
Norway 55 0.0 199 787 41.6 47 690 19 553 13 492 6 061 31.0 10)
Poland 845 538 316 782 134 505 91 504 43 001 32.0 7 192
Romania 85 498 319 093 227 773 20 292 16 299 3 993 19.7 17 070
Serbia 244 516 454 892 165 554 1 420 16 368
Slovak Republic 1 335 1.0 134 726 24.9 75 895 12 816 4 558 8 258 64.4 1
Slovenia 0 0.0 82 730 41.4 29 510 8 056 5 316 2 740 34.0 0
Sweden 0 0.0 482 987 52.2 105 197 38 941 25 345 13 596 34.9 0
Switzerland 2 543 0.8 316 561 41.1 65 823 27 669 2 043 25 626 92.6 0 11)
United Kingdom 729 0.0 2 218 146 36.3 294 223 266 577 95 752 170 825 64.1 123 814 12)
1) Red cell units include 3975 red cell units for pediatric use2) The number of blood components distributed to the hospital blood banks includes the units available at 01.01.2008 in the BTC and units collected during 2008 3) FVIII IU x 106 = 0.0294) Whole blood has not been routinely transfused since 19855) Stem cell by apheresis; total 41 procedures6) Whole blood units are reconstituted red cells in FFP 7) In addition, 1015 whole blood, plasma reduced RBC units were distributed to hospitals for large volume neonatal use and 1378 Pedipacks for infant small volume RBC transfusion 8) Cryo Units = 1066. Cryo (FVIII x 106): 0.074620 9) Platelets, plasma and cryoprecipitate data refer only to the units transfused in the Clinical Center of Montenegro - Podgorica. PLT and CP are prepared in BTC in Podgorica only 10) All FFP was Octaplas 200 ml 11) Total number of WB units: exclusively autologous12) 211 multi-component procedures are also counted as red cell and platelet procedures. Figures are for single cryoprecipitate units
25
The Collection, Testing and Use of Blood and Blood Components in Europe (2008)
Table 4 – Plasma for fractionation into medicinal products
Countryplasma for
fractionation (L)
plasma for fractionation per 1000
inhabitants (L)
% fractionation plasma recovered
plasma for transfusion per
1000 inhabitants (U)
plasma for transfusion total RBC ratio (U/U)
Austria 109 151 13.09 0.00 9.49 0.18 1)
Belgium 163 089 15.53 71.16 8.74 0.18
Bulgaria 11 736 1.54 0.00 8.09 0.41
Croatia 18 910 4.26 16.22 0.45
Cyprus 0 0.00 20.53 0.36 2)
Czech Republic 247 330 24.01 21.57 18.73 0.51
Denmark 73 440 13.32 12.30 0.21 3)
Estonia 4 758 3.55 0.00 23.65 0.63 4)
FYR Macedonia 0 0.00 8.94 0.46
Finland 68 800 12.87 100.00 9.90 0.21 5)
France 769 931 12.04 20.51 5.11
Georgia 0 0.00 8.60 1.00
Germany 2 526 637 30.81 40.13 16.25 0.28
Greece 15 402 1.47 25.10 0.42
Hungary 9.43 6)
Iceland 0 0.00 17.75 0.38
Ireland 0 0.00 0.15 0.00
Italy 648 000 10.80 65.43 8.43
Latvia 823 0.36 16.64
Lithuania 72 715 21.60 10.03 7)
Luxembourg 7 600 16.00 76.49 10.74 0.24 8)
Malta 0 0.00 15.69 0.43 9)
Montenegro 13.41 10)
Netherlands 225 557 13.67 69.87 5.86 0.17
Norway 54 214 11.30 67.82 9.94 0.24 11)
Poland 46 582 1.22 88.64 8.31
Romania 0 0.00 10.59 12)
Serbia 22.13
Slovak Republic 46 345 8.56 84.08 14.01 0.56
Slovenia 14 096 7.05 98.45 14.76 0.36
Sweden 113 419 12.25 62.23 11.36 0.22
Switzerland 90 119 11.70 0.00 8.55 0.21
United Kingdom 0 0.00 4.81 0.13
1) Red cell apheresis (autologous) = 2943. Concentrates = 58862) The plasma collected is not further fractionated to products 3) The amount of plasma for FVIII or other components has not been stated. However, only plasma recovered from whole blood for fractionation is delivered 4) Only plasma is supplied to fractionators 5) Other plasma is used for production of pooled, virus-inactivated fresh frozen plasma (Octaplas) 6) HNBT Service has no information on the data collection of private plasmapheresis processes 7) Plasma for fractionation in units only (72 715 units) 8) Octapharma carries out fractionation for Luxembourg: albumin, gammaglobulins, Factor VIII, PPSB 9) No components were delivered for manufacture of medicinal products10) Collection of plasma by apheresis procedures is not yet done in Montenegro11) Total plasma includes plasma for Octaplas production12) No contract for fractionation
26
The Collection, Testing and Use of Blood and Blood Components in Europe (2008)
Table 5.1 – Special processing of blood components
CountryRBC plasma for transfusion platelets
% leucocyte depleted % irradiated % leucocyte
depleted % irradiated % leucocyte depleted % irradiated path.inact. %
Austria 100 9 100 0 100 49 0 1)
Belgium 100 100 0 100 13
Bulgaria 6 1 1 1 27 1
Croatia 18 77 1
Cyprus 100 0 0 0 0 0 0
Czech Republic 21 6 0 1 73 29 0
Denmark 31 2 0 1 99 29 0
Estonia 5 3 0 0 44 21 0
FYR Macedonia 5 0 0 0 1 0 0
Finland 100 3 0 0 100 35 0 2)
France 100 100 100
Georgia 0 0 0 0 0 0 0
Germany 100 4 0 100 34 0 3)
Greece 35 16 38 11 70 19
Hungary 11 5 16 2 71 12 0
Iceland 22 10 3 2 100 68 17 4)
Ireland 100 24 100 0 100 100 0 5)
Italy
Latvia 15 2 0 0 100 28 0
Lithuania 9 40
Luxembourg 100 1 100 0 100 2 0
Malta 100 26 100 0 100 0 0
Montenegro 6)
Netherlands 100 100 100 0
Norway 100 7 0 0 100 34 16 7)
Poland 0 0
Romania 0 20 0
Serbia 50 2 7 1
Slovak Republic 13 8 62 0 8)
Slovenia 45 5 0 0 74 36 0
Sweden 83 4 94 2 100 56 4
Switzerland 100 100 100 9)
Turkey
Ukraine
United Kingdom 100 8 100 0 100 54 0 10)
1) Cryoprecipitate: no production in the BE 2) Plasma for transfusion is virus-inactivated: pooled, virus-inactivated fresh frozen plasma (Octaplas) 3) Data on leucocyte-depleted plasma for transfusion are not collected. Cryoprecipitate-reduced plasma components and cryoprecipitate: not in use4) Virus-inactivated platelets: 3-month project 5) 98% of plasma for transfusion was Solvent Detergent treated, Octaplas. The small amount of FFP used was leucocyte-depleted 6) Leucocyte-depleted and irradiated blood components (RC and PLT) are prepared in specific cases only 7) Plasma inactivated = Octaplas 8) Blood components are irradiated by blood banks. No data 9) Virus-inactivated : SD plasma 10) Scotland - Cryoprecipitate for use in neonates and children under 16 is imported from North America. It is treated with Methylene Blue and supplied as individual donations (i.e. not pooled) – approx. 800 units per year
27
The Collection, Testing and Use of Blood and Blood Components in Europe (2008)
Table 5.2 – Inactivation or quarantine of plasma
Country FFP CP reduced plasma cyroprecipitate
% quarantined % virus inactivated % quarantined % virus
inactivated % quarantined % virus inactivated
Austria 26 74 0 0 0 0 1)
Belgium 0 100 0 0 0 0
Bulgaria 0 0 0 0 0
Croatia
Cyprus 0 0 0 0 0 0
Czech Republic 100 0 100
Denmark 0 0 0 0 0 0
Estonia 0 0 0 0 0 0
FYR Macedonia 0 0 0 0 0 0
Finland 0 100 0 0 0 0 2)
France 35 100
Georgia 19 0 0 0 0 0
Germany 94 6 0 0 0 0 3)
Greece 15 11
Hungary 0 0 0 0 0 0
Iceland 0 0 0 0 0 0 4)
Ireland 98 0 0 0 0 5)
Italy
Latvia 59 0 100 0
Lithuania 60
Luxembourg 0 100 0 0 0 0
Malta 50 0 0 0 0 0
Montenegro 6)
Netherlands 100 0 0 0 0 0
Norway 0 100 0 0 0 0 7)
Poland 0 0
Romania 50 0 50 0 0
Serbia
Slovak Republic 49 0 0 0 0 0 8)
Slovenia 0 0 0 0 0 0
Sweden 0 1 0 0 0 0
Switzerland 85 15 9)
United Kingdom 0 4 0 0 0 1 10)
1) Cryoprecipitate: no production in the BE 2) Plasma for transfusion virus-inactivated: pooled, virus-inactivated fresh frozen plasma (Octaplas) 3) Data on leucocyte-depleted plasma for transfusion are not collected. Cryoprecipitate-reduced plasma components and cryoprecipitate: not in use 4) Virus inactivated platelets: 3-month project 5) 98% of plasma for transfusion was Solvent Detergent treated, Octaplas. The small amount of FFP used was leucocyte-depleted6) Leucocyte-depleted and irradiated blood components (RC and PLT) are prepared in specific cases only7) Plasma inactivated = Octaplas 8) Blood components are irradiated by blood banks: no data 9) Virus-inactivated : SD plasma 10) Scotland - Cryoprecipitate for use in neonates and children under 16 is imported from North America. It is treated with Methylene Blue and supplied as individual donations (i.e. not pooled) – approx. 800 units per year
28
The Collection, Testing and Use of Blood and Blood Components in Europe (2008)
Tabl
e 6
– D
onat
ion
test
ing
stra
tegy
for
infe
ctio
us a
gent
s
Cou
ntry
anti
-H
IV 1
+2H
IVA
g
HB
sAg
A
nti-
HB
c
anti
-HC
V
HC
VAg
an
ti-
HT
LV I
/II
Syp
hilis
M
alar
ia
Oth
er
Aus
tria
100
100
100
2110
00
010
00
Neo
pter
in-S
cree
ning
-Elis
a-Te
st
(Bra
hms,
IBL)
: Tes
ting
eve
ry d
o-na
tion
. ALT
(Abb
ott,
Roc
he, D
ade/
Siem
nes)
: Tes
ting
29%
. ant
i-C
MV
(IgG
,IgM
), Ab
bott
,Dad
e/Si
emen
s:
Test
ing
34%
.
1)
Bel
gium
100
010
0Fi
rst
100
00
100
2)
Bul
gari
a10
010
010
00
100
100
010
00
Cro
atia
100
100
100
010
010
00
100
0 3
)
Cyp
rus
100
010
00
100
00
100
0 4
)
Cze
ch R
epub
lic10
010
010
00
100
350
100
0 5
)
Den
mar
k10
010
010
00
100
00
6)
Est
onia
100
100
100
010
00
010
00
FYR
Mac
edon
ia10
010
010
010
010
010
00
100
0 7
)
Fin
land
100
100
100
010
00
2310
00
8)
Fra
nce
100
010
010
010
00
100
100
9)
Geo
rgia
100
010
00
100
00
100
0
Ger
man
y10
010
010
010
00
010
00
10)
Gre
ece
100
100
100
100
100
11)
Hun
gary
100
010
0Fi
rst
100
010
00
Icel
and
100
100
100
010
00
00
12)
Irel
and
100
010
010
010
00
100
100
0
Ital
y10
00
100
010
00
010
00
13)
Latv
ia10
00
100
010
00
010
00
Lith
uani
a10
010
010
010
0
Luxe
mbo
urg
100
100
100
Firs
t10
00
Firs
t10
01
14)
Mal
ta10
010
010
010
010
010
00
100
0C
MV
Ab: T
esti
ng 1
0%.
Mon
tene
gro
100
100
100
010
00
010
00
15)
Net
herl
ands
100
010
00
100
010
010
016
)
Nor
way
100
100
100
100
00
Firs
t1
17)
Pol
and
100
010
00
100
00
100
0
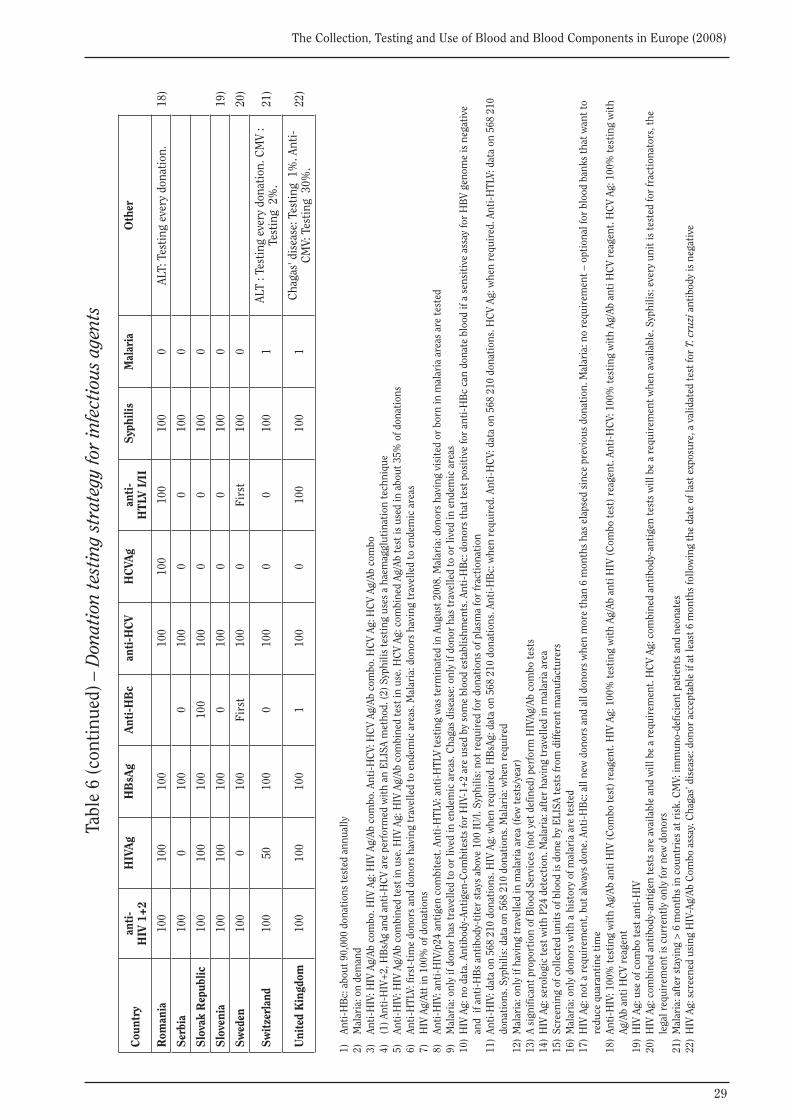
29
The Collection, Testing and Use of Blood and Blood Components in Europe (2008)
Cou
ntry
anti
-H
IV 1
+2H
IVA
g
HB
sAg
A
nti-
HB
c
anti
-HC
V
HC
VAg
an
ti-
HT
LV I
/II
Syp
hilis
M
alar
ia
Oth
er
Rom
ania
100
100
100
100
100
100
100
0AL
T: T
esti
ng e
very
don
atio
n.
18)
Ser
bia
100
010
00
100
00
100
0
Slo
vak
Rep
ublic
10
010
010
010
010
00
010
00
Slo
veni
a10
010
010
00
100
00
100
0 1
9)
Sw
eden
100
010
0Fi
rst
100
0Fi
rst
100
0 2
0)
Sw
itze
rlan
d10
050
100
010
00
010
01
ALT
: Tes
ting
eve
ry d
onat
ion.
CM
V :
Test
ing
2%
. 2
1)
Uni
ted
Kin
gdom
100
100
100
110
00
100
100
1C
haga
s' d
isea
se: T
esti
ng 1
%. A
nti-
CM
V: T
esti
ng 3
0%.
22)
1)
An
ti-H
Bc:
abo
ut 9
0,00
0 do
nati
ons
test
ed a
nnua
lly2)
M
alar
ia: o
n de
man
d3)
An
ti-H
IV: H
IV A
g/Ab
com
bo. H
IV A
g: H
IV A
g/Ab
com
bo. A
nti-
HC
V: H
CV
Ag/A
b co
mbo
. HC
V Ag
: HC
V Ag
/Ab
com
bo4)
(1
) Ant
i-H
IV+
2, H
BsA
g an
d an
ti-H
CV
are
perf
orm
ed w
ith
an E
LISA
met
hod.
(2) S
yphi
lis te
stin
g us
es a
hae
mag
glut
inat
ion
tech
niqu
e5)
An
ti-H
IV: H
IV A
g/Ab
com
bine
d te
st in
use
. HIV
Ag:
HIV
Ag/
Ab c
ombi
ned
test
in u
se. H
CV
Ag: c
ombi
ned
Ag/A
b te
st is
use
d in
abo
ut 3
5% o
f don
atio
ns6)
An
ti-H
TLV:
firs
t-ti
me
dono
rs a
nd d
onor
s ha
ving
trav
elle
d to
end
emic
are
as. M
alar
ia: d
onor
s ha
ving
trav
elle
d to
end
emic
are
as7)
H
IV A
g/At
t in
100%
of d
onat
ions
8)
Anti
-HIV
: ant
i-H
IV/p
24 a
ntig
en c
ombi
test
. Ant
i-H
TLV:
ant
i-H
TLV
test
ing
was
term
inat
ed in
Aug
ust 2
008.
Mal
aria
: don
ors
havi
ng v
isit
ed o
r bo
rn in
mal
aria
are
as a
re te
sted
9)
Mal
aria
: onl
y if
dono
r ha
s tr
avel
led
to o
r liv
ed in
end
emic
are
as. C
haga
s di
seas
e: o
nly
if do
nor
has
trav
elle
d to
or
lived
in e
ndem
ic a
reas
10)
HIV
Ag:
no
data
. Ant
ibod
y-An
tige
n-C
ombi
test
s fo
r H
IV-1
+2
are
used
by
som
e bl
ood
esta
blis
hmen
ts. A
nti-
HB
c: d
onor
s th
at te
st p
osit
ive
for
anti
-HB
c ca
n do
nate
blo
od if
a s
ensi
tive
ass
ay fo
r H
BV
geno
me
is n
egat
ive
an
d if
ant
i-H
Bs
anti
body
-tit
er s
tays
abo
ve 1
00 IU
/l. S
yphi
lis: n
ot r
equi
red
for
dona
tion
s of
pla
sma
for
frac
tion
atio
n11
) An
ti-H
IV: d
ata
on 5
68 2
10 d
onat
ions
. HIV
Ag:
whe
n re
quir
ed. H
BsA
g: d
ata
on 5
68 2
10 d
onat
ions
. Ant
i-H
Bc:
whe
n re
quir
ed. A
nti-
HC
V: d
ata
on 5
68 2
10 d
onat
ions
. HC
V Ag
: whe
n re
quir
ed. A
nti-
HTL
V: d
ata
on 5
68 2
10
do
nati
ons.
Syp
hilis
: dat
a on
568
210
don
atio
ns. M
alar
ia: w
hen
requ
ired
12)
Mal
aria
: onl
y if
havi
ng tr
avel
led
in m
alar
ia a
rea
(few
test
s/ye
ar)
13)
A si
gnifi
cant
pro
port
ion
of B
lood
Ser
vice
s (n
ot y
et d
efin
ed) p
erfo
rm H
IVAg
/Ab
com
bo te
sts
14)
HIV
Ag:
ser
olog
ic te
st w
ith
P24
dete
ctio
n. M
alar
ia: a
fter
hav
ing
trav
elle
d in
mal
aria
are
a15
) Sc
reen
ing
of c
olle
cted
uni
ts o
f blo
od is
don
e by
ELI
SA te
sts
from
diff
eren
t man
ufac
ture
rs16
) M
alar
ia: o
nly
dono
rs w
ith
a hi
stor
y of
mal
aria
are
test
ed17
) H
IV A
g: n
ot a
req
uire
men
t, bu
t alw
ays
done
. Ant
i-H
Bc:
all
new
don
ors
and
all d
onor
s w
hen
mor
e th
an 6
mon
ths
has
elap
sed
sinc
e pr
evio
us d
onat
ion.
Mal
aria
: no
requ
irem
ent –
opt
iona
l for
blo
od b
anks
that
wan
t to
redu
ce q
uara
ntin
e ti
me
18)
Anti
-HIV
: 100
% te
stin
g w
ith
Ag/A
b an
ti H
IV (C
ombo
test
) rea
gent
. HIV
Ag:
100
% te
stin
g w
ith
Ag/A
b an
ti H
IV (C
ombo
test
) rea
gent
. Ant
i-H
CV:
100
% te
stin
g w
ith
Ag/A
b an
ti H
CV
reag
ent.
HC
V Ag
: 100
% te
stin
g w
ith
Ag/A
b an
ti H
CV
reag
ent
19)
HIV
Ag:
use
of c
ombo
test
ant
i-H
IV20
) H
IV A
g: c
ombi
ned
anti
body
-ant
igen
test
s ar
e av
aila
ble
and
will
be
a re
quir
emen
t. H
CV
Ag: c
ombi
ned
anti
body
-ant
igen
test
s w
ill b
e a
requ
irem
ent w
hen
avai
labl
e. S
yphi
lis: e
very
uni
t is
test
ed fo
r fr
acti
onat
ors,
the
le
gal r
equi
rem
ent i
s cu
rren
tly
only
for
new
don
ors
21)
Mal
aria
: aft
er s
tayi
ng >
6 m
onth
s in
cou
ntri
es a
t ris
k. C
MV:
imm
uno-
defic
ient
pat
ient
s an
d ne
onat
es22
) H
IV A
g: s
cree
ned
usin
g H
IV-A
g/Ab
Com
bo a
ssay
. Cha
gas’
dis
ease
: don
or a
ccep
tabl
e if
at le
ast 6
mon
ths
follo
win
g th
e da
te o
f las
t exp
osur
e, a
val
idat
ed te
st fo
r T.
cru
zi a
ntib
ody
is n
egat
ive
Tabl
e 6
(con
tinu
ed) –
Don
atio
n te
stin
g st
rate
gy fo
r in
fect
ious
age
nts

30
The Collection, Testing and Use of Blood and Blood Components in Europe (2008)
Table 7.1 – Confirmed seropositive donors (absolute numbers)
CountryHIV 1 / 2 HBV HCV HTLV-I/II syphilis
first time donors
repeat donors
first time donors
repeat donors
first time donors
repeat donors
first time donors
repeat donors
first time donors
repeat donors
Austria 1 8 61 5 34 24 16 32
Belgium 4 1 40 3 22 5 11 17
Bulgaria 1900 66 160 9 0 600 12
Croatia 1 4 27 11 8 3 6 6
Cyprus 1 0 20 8 10 5 0 0 13 12
Czech Republic 1 1 27 5 63 13 9 10
Denmark 2 1 10 0 3 0 1 0
Estonia 3 2 15 4 65 6 19 34
FYR Macedonia 20037 15 20037 201 20037 45 0 0 20037 8
Finland 1 1 3 2 14 3 0 0 0 3
France
Georgia 22 940 1705 380 1)
Germany 39 61 779 34 408 53 177 106 2)
Greece 25 20 980 293 281 89 3 1 102 52 3)
Hungary 5 3 155 198 144 56 46 43 4)
Iceland 0 0 1 0 0 0
Ireland 1 0 4 2 3 0 0 0 5 2
Italy 56 48 844 101 404 25 0 0 221 107 5)
Latvia 9 9
Lithuania 13 96 178 42 6)
Luxembourg 0 0 0 0 0 0 0 0 2 0
Malta 0 0 5 0 0 0 0 0 7)
Montenegro 1 0 31 2 8)
Netherlands 2 1 16 4 4 0 0 1 11 8
Norway 0 0 5 1 13 1 2 2
Poland
Romania
Serbia
Slovak Republic 2 2 34 9 20 9 4 3
Slovenia 0 0 10 0 4 0 0 0 3 3
Sweden 0 2 11 1 19 0 1 8 9 9)
Switzerland 3 1 39 8 24 0 21 5
United Kingdom 15 13 87 1 76 7 13 1 66 36 10)
1) Figures show total number of confirmed cases. There are no separate statistics for repeat or first-time donors2) Donations not tested for HTLV I/II3) Data on 70 604 first-time donors and on 342 544 repeat donors4) Previous data on HBsAg + a-HBc positive samples was incorrect, hence the increase in confirmed seropositive results5) Coverage 92.3% of donations6) Total of confirmed seropositive tests is presented (first and repeat tested donors)7) No testing for HTLV I/II8) Confirmatory testing on HCV and syphilis was not done in 2008 because of the lack of tests9) HTLV I/II tests are not performed on repeat tested donors. Data are collected on syphilis for the first year10) Northern Ireland - repeat tested donors subjected to new syphilis screening test since last donation and in all cases of past syphilis treatment
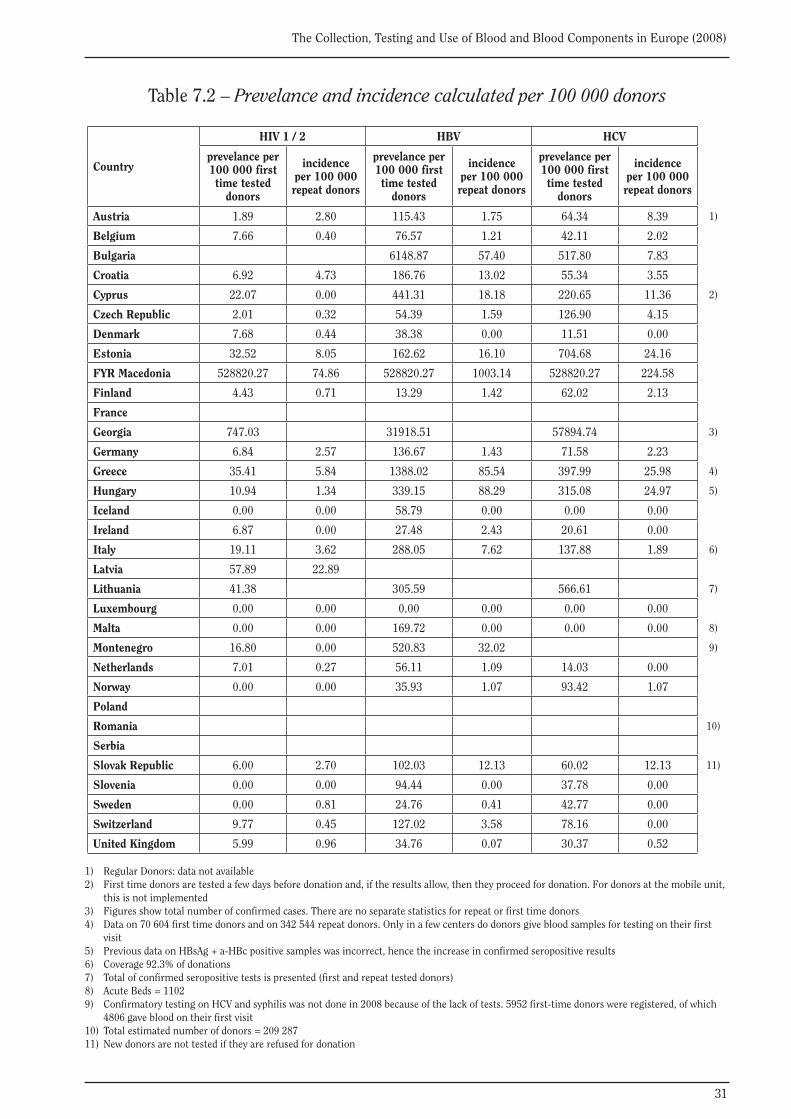
31
The Collection, Testing and Use of Blood and Blood Components in Europe (2008)
Table 7.2 – Prevelance and incidence calculated per 100 000 donors
Country
HIV 1 / 2 HBV HCV
prevelance per 100 000 first time tested
donors
incidence per 100 000 repeat donors
prevelance per 100 000 first time tested
donors
incidence per 100 000 repeat donors
prevelance per 100 000 first time tested
donors
incidence per 100 000 repeat donors
Austria 1.89 2.80 115.43 1.75 64.34 8.39 1)
Belgium 7.66 0.40 76.57 1.21 42.11 2.02
Bulgaria 6148.87 57.40 517.80 7.83
Croatia 6.92 4.73 186.76 13.02 55.34 3.55
Cyprus 22.07 0.00 441.31 18.18 220.65 11.36 2)
Czech Republic 2.01 0.32 54.39 1.59 126.90 4.15
Denmark 7.68 0.44 38.38 0.00 11.51 0.00
Estonia 32.52 8.05 162.62 16.10 704.68 24.16
FYR Macedonia 528820.27 74.86 528820.27 1003.14 528820.27 224.58
Finland 4.43 0.71 13.29 1.42 62.02 2.13
France
Georgia 747.03 31918.51 57894.74 3)
Germany 6.84 2.57 136.67 1.43 71.58 2.23
Greece 35.41 5.84 1388.02 85.54 397.99 25.98 4)
Hungary 10.94 1.34 339.15 88.29 315.08 24.97 5)
Iceland 0.00 0.00 58.79 0.00 0.00 0.00
Ireland 6.87 0.00 27.48 2.43 20.61 0.00
Italy 19.11 3.62 288.05 7.62 137.88 1.89 6)
Latvia 57.89 22.89
Lithuania 41.38 305.59 566.61 7)
Luxembourg 0.00 0.00 0.00 0.00 0.00 0.00
Malta 0.00 0.00 169.72 0.00 0.00 0.00 8)
Montenegro 16.80 0.00 520.83 32.02 9)
Netherlands 7.01 0.27 56.11 1.09 14.03 0.00
Norway 0.00 0.00 35.93 1.07 93.42 1.07
Poland
Romania 10)
Serbia
Slovak Republic 6.00 2.70 102.03 12.13 60.02 12.13 11)
Slovenia 0.00 0.00 94.44 0.00 37.78 0.00
Sweden 0.00 0.81 24.76 0.41 42.77 0.00
Switzerland 9.77 0.45 127.02 3.58 78.16 0.00
United Kingdom 5.99 0.96 34.76 0.07 30.37 0.52
1) Regular Donors: data not available2) First time donors are tested a few days before donation and, if the results allow, then they proceed for donation. For donors at the mobile unit, this is not implemented3) Figures show total number of confirmed cases. There are no separate statistics for repeat or first time donors4) Data on 70 604 first time donors and on 342 544 repeat donors. Only in a few centers do donors give blood samples for testing on their first visit5) Previous data on HBsAg + a-HBc positive samples was incorrect, hence the increase in confirmed seropositive results6) Coverage 92.3% of donations7) Total of confirmed seropositive tests is presented (first and repeat tested donors)8) Acute Beds = 11029) Confirmatory testing on HCV and syphilis was not done in 2008 because of the lack of tests. 5952 first-time donors were registered, of which 4806 gave blood on their first visit10) Total estimated number of donors = 209 28711) New donors are not tested if they are refused for donation
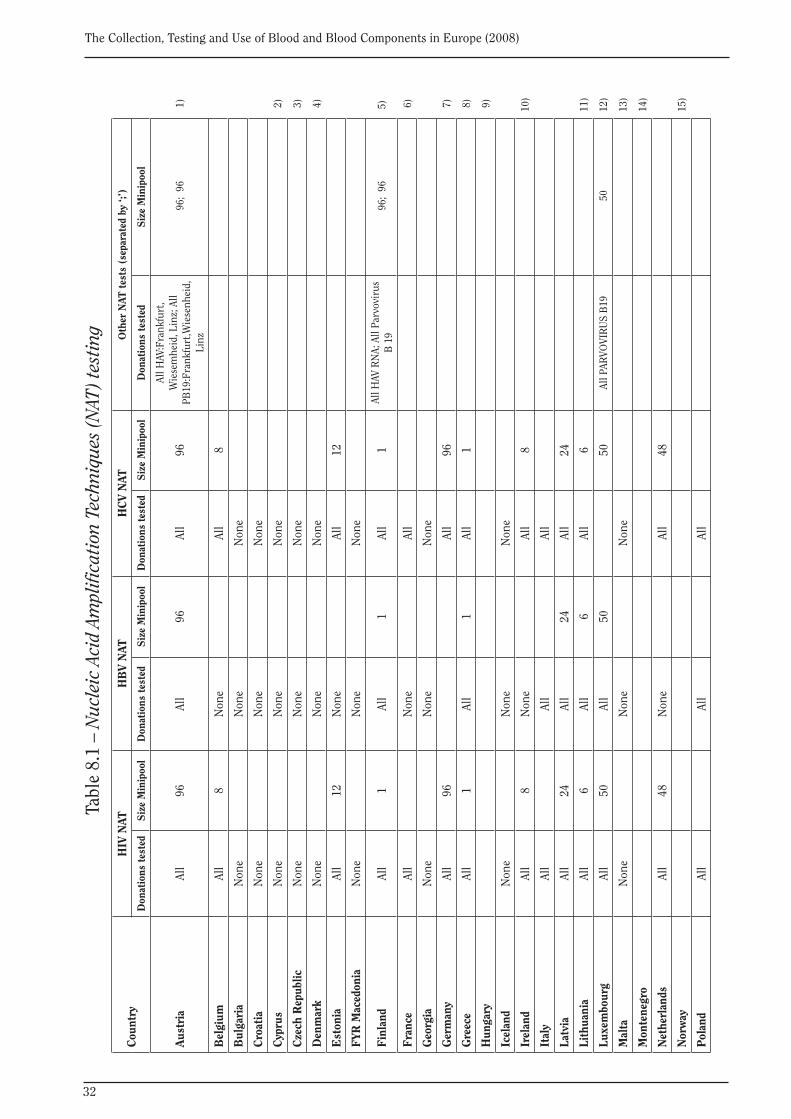
32
The Collection, Testing and Use of Blood and Blood Components in Europe (2008)
Tabl
e 8.
1 –
Nuc
leic
Aci
d Am
plifi
cati
on T
echn
ique
s (N
AT) t
esti
ng
Cou
ntry
HIV
NAT
HB
V N
ATH
CV
NAT
Oth
er N
AT t
ests
(se
para
ted
by ‘;
’)
Don
atio
ns t
este
dS
ize
Min
ipoo
lD
onat
ions
tes
ted
Siz
e M
inip
ool
Don
atio
ns te
sted
Siz
e M
inip
ool
Don
atio
ns t
este
dS
ize
Min
ipoo
l
Aus
tria
All
96Al
l96
All
96
All H
AV:F
rank
furt
, W
iese
mhe
id, L
inz;
All
PB19
:Fra
nkfu
rt,W
iese
nhei
d,
Linz
96;
96
1)
Bel
gium
All
8N
one
All
8
Bul
gari
aN
one
Non
eN
one
Cro
atia
Non
eN
one
Non
e
Cyp
rus
Non
eN
one
Non
e 2
)
Cze
ch R
epub
licN
one
Non
eN
one
3)
Den
mar
kN
one
Non
eN
one
4)
Est
onia
All
12N
one
All
12
FYR
Mac
edon
iaN
one
Non
eN
one
Fin
land
All
1Al
l1
All
1Al
l HAV
RN
A; A
ll Pa
rvov
irus
B
19
96;
96
5)
Fra
nce
All
Non
eAl
l 6
)
Geo
rgia
Non
eN
one
Non
e
Ger
man
yAl
l96
All
96 7
)
Gre
ece
All
1Al
l1
All
1 8
)
Hun
gary
9)
Icel
and
Non
eN
one
Non
e
Irel
and
All
8N
one
All
810
)
Ital
yAl
lAl
lAl
l
Latv
iaAl
l24
All
24Al
l24
Lith
uani
aAl
l6
All
6Al
l6
11)
Luxe
mbo
urg
All
50Al
l50
50Al
l PAR
VOVI
RU
S B
19 5
012
)
Mal
taN
one
Non
eN
one
13)
Mon
tene
gro
14)
Net
herl
ands
All
48N
one
All
48
Nor
way
15)
Pol
and
All
All
All
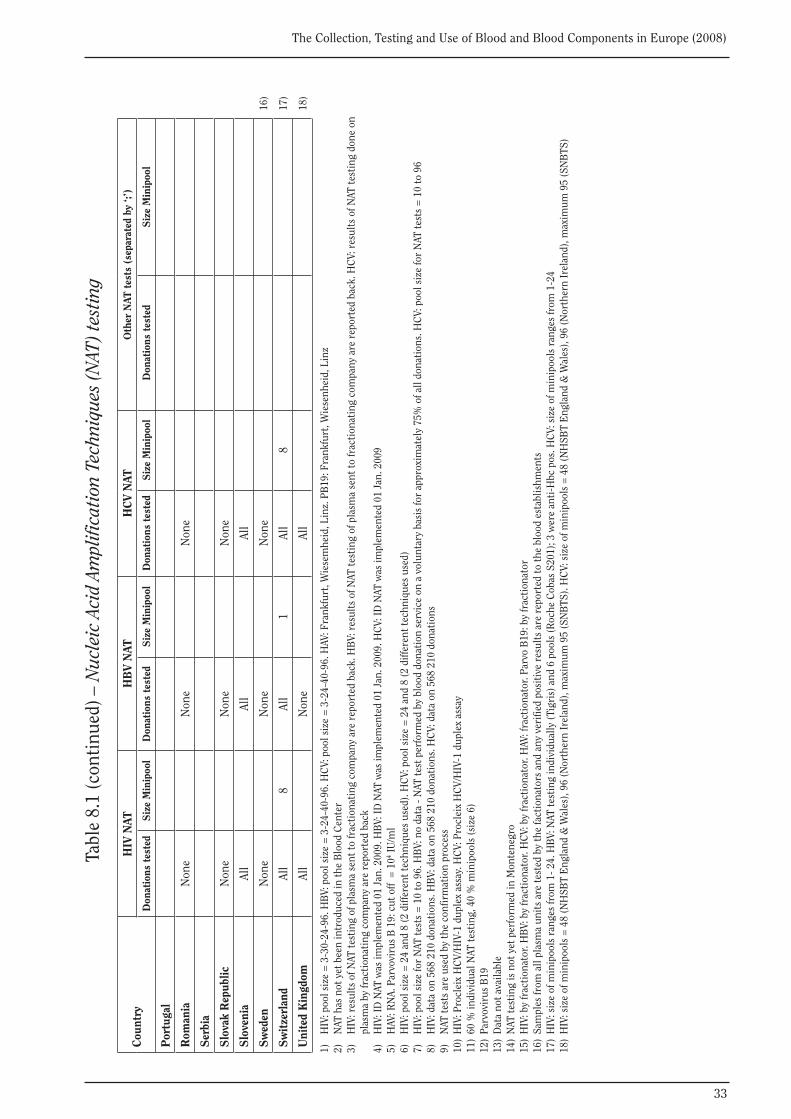
33
The Collection, Testing and Use of Blood and Blood Components in Europe (2008)
Cou
ntry
HIV
NAT
HB
V N
ATH
CV
NAT
Oth
er N
AT t
ests
(se
para
ted
by ‘;
’)
Don
atio
ns t
este
dS
ize
Min
ipoo
lD
onat
ions
tes
ted
Siz
e M
inip
ool
Don
atio
ns te
sted
Siz
e M
inip
ool
Don
atio
ns t
este
dS
ize
Min
ipoo
l
Por
tuga
l
Rom
ania
Non
eN
one
Non
e
Ser
bia
Slo
vak
Rep
ublic
N
one
Non
eN
one
Slo
veni
aAl
lAl
lAl
l
Sw
eden
Non
eN
one
Non
e 1
6)
Sw
itze
rlan
dAl
l8
All
1Al
l8
17)
Uni
ted
Kin
gdom
All
Non
eAl
l 1
8)
1)
HIV
: poo
l siz
e =
3-3
0-24
-96.
HB
V: p
ool s
ize
= 3
-24-
40-9
6. H
CV:
poo
l siz
e =
3-2
4-40
-96.
HAV
: Fra
nkfu
rt, W
iese
mhe
id, L
inz.
PB
19: F
rank
furt
, Wie
senh
eid,
Lin
z2)
N
AT h
as n
ot y
et b
een
intr
oduc
ed in
the
Blo
od C
ente
r3)
H
IV: r
esul
ts o
f NAT
test
ing
of p
lasm
a se
nt to
frac
tion
atin
g co
mpa
ny a
re r
epor
ted
back
. HB
V: r
esul
ts o
f NAT
test
ing
of p
lasm
a se
nt to
frac
tion
atin
g co
mpa
ny a
re r
epor
ted
back
. HC
V: r
esul
ts o
f NAT
test
ing
done
on
pl
asm
a by
frac
tion
atin
g co
mpa
ny a
re r
epor
ted
back
4)
HIV
: ID
NAT
was
impl
emen
ted
01 J
an. 2
009.
HB
V: ID
NAT
was
impl
emen
ted
01 J
an. 2
009.
HC
V: ID
NAT
was
impl
emen
ted
01 J
an. 2
009
5)
HAV
: RN
A. P
arvo
viru
s B
19:
cut
off
= 1
04 IU
/ml
6)
HIV
: poo
l siz
e =
24
and
8 (2
diff
eren
t tec
hniq
ues
used
). H
CV:
poo
l siz
e =
24
and
8 (2
diff
eren
t tec
hniq
ues
used
)7)
H
IV: p
ool s
ize
for
NAT
test
s =
10
to 9
6. H
BV:
no
data
- N
AT te
st p
erfo
rmed
by
bloo
d do
nati
on s
ervi
ce o
n a
volu
ntar
y ba
sis
for
appr
oxim
atel
y 75
% o
f all
dona
tion
s. H
CV:
poo
l siz
e fo
r N
AT te
sts
= 1
0 to
96
8)
HIV
: dat
a on
568
210
don
atio
ns. H
BV:
dat
a on
568
210
don
atio
ns. H
CV:
dat
a on
568
210
don
atio
ns9)
N
AT te
sts
are
used
by
the
conf
irm
atio
n pr
oces
s10
) H
IV: P
rocl
eix
HC
V/H
IV-1
dup
lex
assa
y. H
CV:
Pro
clei
x H
CV/
HIV
-1 d
uple
x as
say
11)
60 %
indi
vidu
al N
AT te
stin
g, 4
0 %
min
ipoo
ls (s
ize
6)12
) Pa
rvov
irus
B19
13)
Dat
a no
t ava
ilabl
e14
) N
AT te
stin
g is
not
yet
per
form
ed in
Mon
tene
gro
15)
HIV
: by
frac
tion
ator
. HB
V: b
y fr
acti
onat
or. H
CV:
by
frac
tion
ator
. HAV
: fra
ctio
nato
r. Pa
rvo
B19
: by
frac
tion
ator
16)
Sam
ples
from
all
plas
ma
unit
s ar
e te
sted
by
the
fact
iona
tors
and
any
ver
ified
pos
itiv
e re
sult
s ar
e re
port
ed to
the
bloo
d es
tabl
ishm
ents
17)
HIV
: siz
e of
min
ipoo
ls r
ange
s fr
om 1
- 24.
HB
V: N
AT te
stin
g in
divi
dual
ly (T
igri
s) a
nd 6
poo
ls (R
oche
Cob
as S
201)
; 3 w
ere
anti
-Hbc
pos
. HC
V: s
ize
of m
inip
ools
ran
ges
from
1-2
418
) H
IV: s
ize
of m
inip
ools
= 4
8 (N
HSB
T E
ngla
nd &
Wal
es),
96 (N
orth
ern
Irel
and)
, max
imum
95
(SN
BTS
). H
CV:
siz
e of
min
ipoo
ls =
48
(NH
SBT
Eng
land
& W
ales
), 96
(Nor
ther
n Ir
elan
d), m
axim
um 9
5 (S
NB
TS)
Tabl
e 8.
1 (c
onti
nued
) – N
ucle
ic A
cid
Ampl
ifica
tion
Tec
hniq
ues
(NAT
) tes
ting
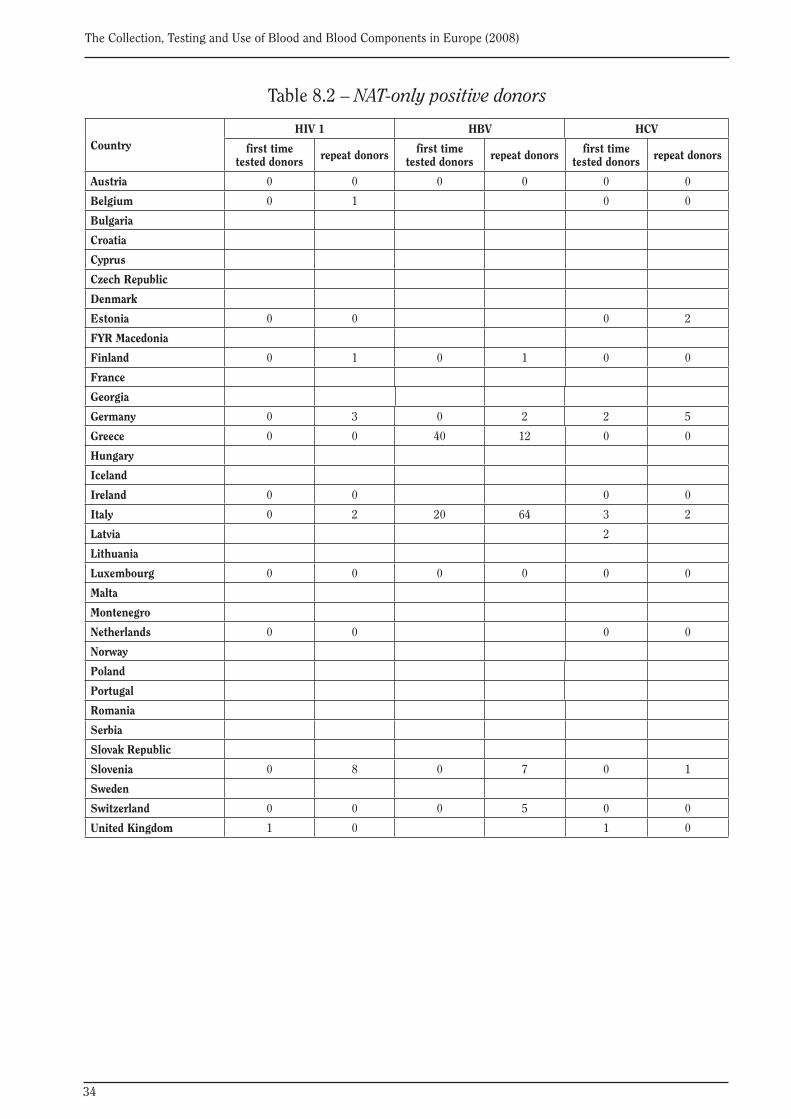
34
The Collection, Testing and Use of Blood and Blood Components in Europe (2008)
Table 8.2 – NAT-only positive donors
CountryHIV 1 HBV HCV
first time tested donors repeat donors first time
tested donors repeat donors first time tested donors repeat donors
Austria 0 0 0 0 0 0
Belgium 0 1 0 0
Bulgaria
Croatia
Cyprus
Czech Republic
Denmark
Estonia 0 0 0 2
FYR Macedonia
Finland 0 1 0 1 0 0
France
Georgia
Germany 0 3 0 2 2 5
Greece 0 0 40 12 0 0
Hungary
Iceland
Ireland 0 0 0 0
Italy 0 2 20 64 3 2
Latvia 2
Lithuania
Luxembourg 0 0 0 0 0 0
Malta
Montenegro
Netherlands 0 0 0 0
Norway
Poland
Portugal
Romania
Serbia
Slovak Republic
Slovenia 0 8 0 7 0 1
Sweden
Switzerland 0 0 0 5 0 0
United Kingdom 1 0 1 0
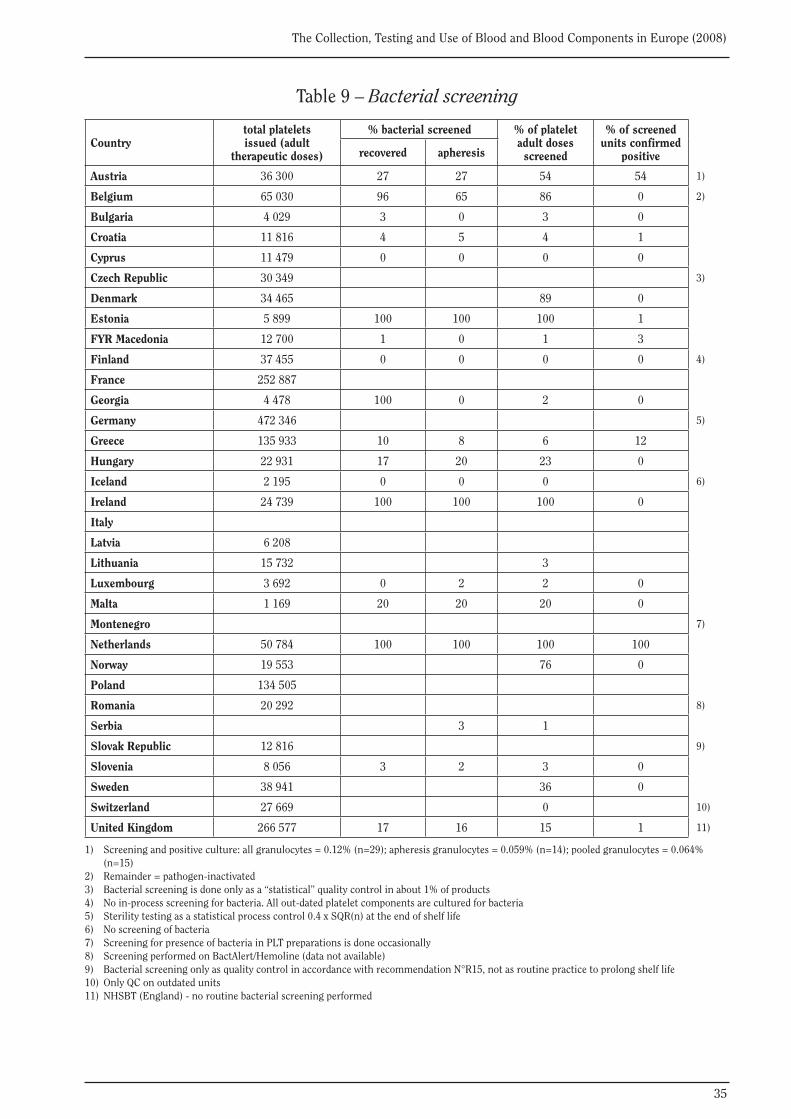
35
The Collection, Testing and Use of Blood and Blood Components in Europe (2008)
Table 9 – Bacterial screening
Countrytotal plateletsissued (adult
therapeutic doses)
% bacterial screened % of platelet adult dosesscreened
% of screened units confirmed
positiverecovered apheresis
Austria 36 300 27 27 54 54 1)
Belgium 65 030 96 65 86 0 2)
Bulgaria 4 029 3 0 3 0
Croatia 11 816 4 5 4 1
Cyprus 11 479 0 0 0 0
Czech Republic 30 349 3)
Denmark 34 465 89 0
Estonia 5 899 100 100 100 1
FYR Macedonia 12 700 1 0 1 3
Finland 37 455 0 0 0 0 4)
France 252 887
Georgia 4 478 100 0 2 0
Germany 472 346 5)
Greece 135 933 10 8 6 12
Hungary 22 931 17 20 23 0
Iceland 2 195 0 0 0 6)
Ireland 24 739 100 100 100 0
Italy
Latvia 6 208
Lithuania 15 732 3
Luxembourg 3 692 0 2 2 0
Malta 1 169 20 20 20 0
Montenegro 7)
Netherlands 50 784 100 100 100 100
Norway 19 553 76 0
Poland 134 505
Romania 20 292 8)
Serbia 3 1
Slovak Republic 12 816 9)
Slovenia 8 056 3 2 3 0
Sweden 38 941 36 0
Switzerland 27 669 0 10)
United Kingdom 266 577 17 16 15 1 11)
1) Screening and positive culture: all granulocytes = 0.12% (n=29); apheresis granulocytes = 0.059% (n=14); pooled granulocytes = 0.064% (n=15)2) Remainder = pathogen-inactivated3) Bacterial screening is done only as a “statistical” quality control in about 1% of products4) No in-process screening for bacteria. All out-dated platelet components are cultured for bacteria5) Sterility testing as a statistical process control 0.4 x SQR(n) at the end of shelf life6) No screening of bacteria7) Screening for presence of bacteria in PLT preparations is done occasionally8) Screening performed on BactAlert/Hemoline (data not available)9) Bacterial screening only as quality control in accordance with recommendation N°R15, not as routine practice to prolong shelf life10) Only QC on outdated units11) NHSBT (England) - no routine bacterial screening performed
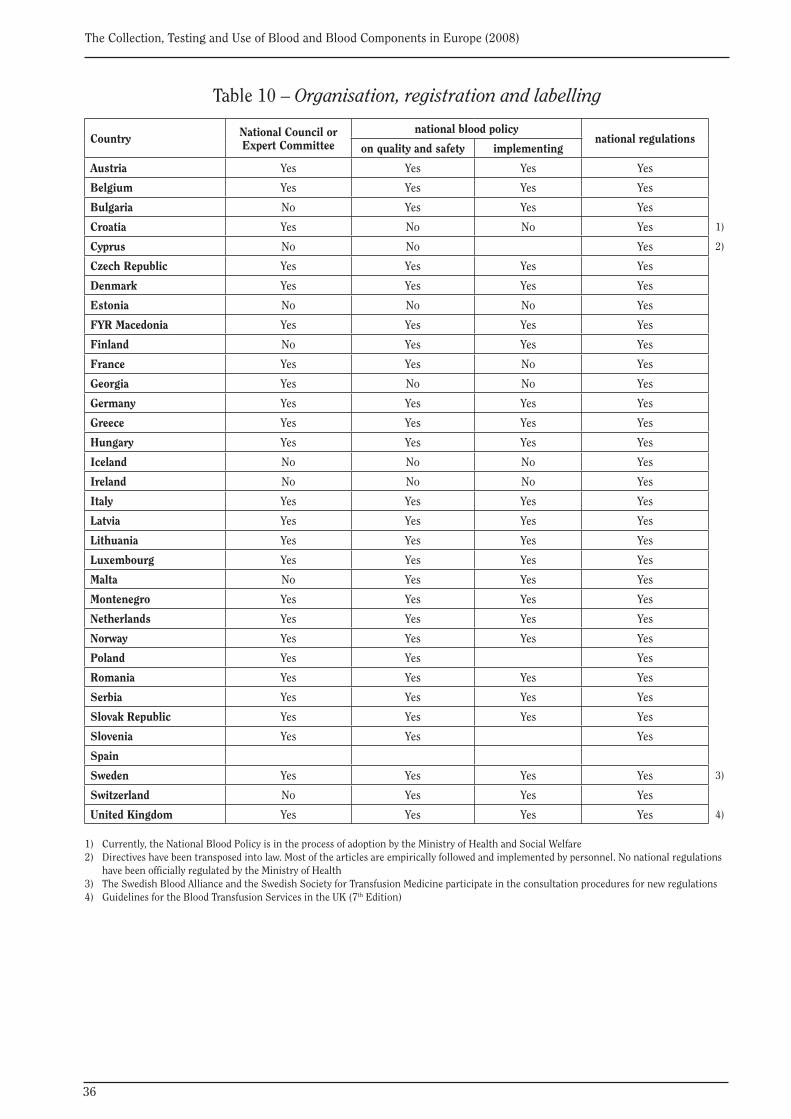
36
The Collection, Testing and Use of Blood and Blood Components in Europe (2008)
Table 10 – Organisation, registration and labelling
Country National Council or Expert Committee
national blood policy national regulations
on quality and safety implementing
Austria Yes Yes Yes Yes
Belgium Yes Yes Yes Yes
Bulgaria No Yes Yes Yes
Croatia Yes No No Yes 1)
Cyprus No No Yes 2)
Czech Republic Yes Yes Yes Yes
Denmark Yes Yes Yes Yes
Estonia No No No Yes
FYR Macedonia Yes Yes Yes Yes
Finland No Yes Yes Yes
France Yes Yes No Yes
Georgia Yes No No Yes
Germany Yes Yes Yes Yes
Greece Yes Yes Yes Yes
Hungary Yes Yes Yes Yes
Iceland No No No Yes
Ireland No No No Yes
Italy Yes Yes Yes Yes
Latvia Yes Yes Yes Yes
Lithuania Yes Yes Yes Yes
Luxembourg Yes Yes Yes Yes
Malta No Yes Yes Yes
Montenegro Yes Yes Yes Yes
Netherlands Yes Yes Yes Yes
Norway Yes Yes Yes Yes
Poland Yes Yes Yes
Romania Yes Yes Yes Yes
Serbia Yes Yes Yes Yes
Slovak Republic Yes Yes Yes Yes
Slovenia Yes Yes Yes
Spain
Sweden Yes Yes Yes Yes 3)
Switzerland No Yes Yes Yes
United Kingdom Yes Yes Yes Yes 4)
1) Currently, the National Blood Policy is in the process of adoption by the Ministry of Health and Social Welfare2) Directives have been transposed into law. Most of the articles are empirically followed and implemented by personnel. No national regulations have been officially regulated by the Ministry of Health3) The Swedish Blood Alliance and the Swedish Society for Transfusion Medicine participate in the consultation procedures for new regulations4) Guidelines for the Blood Transfusion Services in the UK (7th Edition)
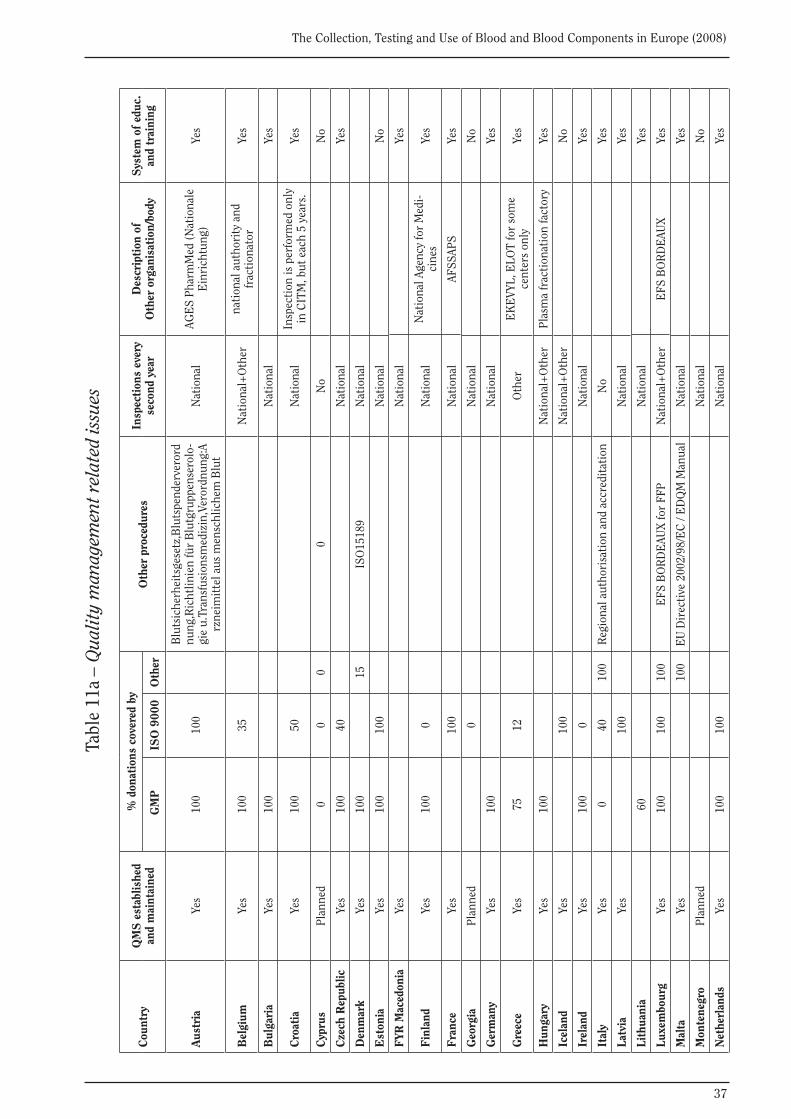
37
The Collection, Testing and Use of Blood and Blood Components in Europe (2008)
Tabl
e 11
a –
Qua
lity
man
agem
ent r
elat
ed is
sues
Cou
ntry
QM
S e
stab
lishe
d an
d m
aint
aine
d
% d
onat
ions
cov
ered
by
Oth
er p
roce
dure
sIn
spec
tion
s ev
ery
seco
nd y
ear
Des
crip
tion
of
Oth
er o
rgan
isat
ion/
body
Sys
tem
of
educ
.an
d tr
aini
ng G
MP
ISO
900
0O
ther
Aus
tria
Yes
100
100
Blu
tsic
herh
eits
gese
tz,B
luts
pend
erve
rord
nung
,Ric
htlin
ien
für
Blu
tgru
ppen
sero
lo-
gie
u.Tr
ansf
usio
nsm
ediz
in,V
eror
dnun
g:A
rzne
imit
tel a
us m
ensc
hlic
hem
Blu
t
Nat
iona
lAG
ES
Phar
mM
ed (N
atio
nale
E
inri
chtu
ng)
Yes
Bel
gium
Yes
100
35N
atio
nal+
Oth
erna
tion
al a
utho
rity
and
fr
acti
onat
orYe
s
Bul
gari
aYe
s10
0N
atio
nal
Yes
Cro
atia
Yes
100
50N
atio
nal
Insp
ecti
on is
per
form
ed o
nly
in C
ITM
, but
eac
h 5
year
s.Ye
s
Cyp
rus
Plan
ned
00
00
No
No
Cze
ch R
epub
licYe
s10
040
Nat
iona
lYe
s
Den
mar
kYe
s10
015
ISO
1518
9N
atio
nal
Est
onia
Yes
100
100
Nat
iona
lN
o
FYR
Mac
edon
iaYe
sN
atio
nal
Yes
Fin
land
Yes
100
0N
atio
nal
Nat
iona
l Age
ncy
for
Med
i-ci
nes
Yes
Fra
nce
Yes
100
Nat
iona
lAF
SSAP
SYe
s
Geo
rgia
Plan
ned
0N
atio
nal
No
Ger
man
yYe
s10
0N
atio
nal
Yes
Gre
ece
Yes
7512
Oth
erE
KE
VYL,
ELO
T fo
r so
me
cent
ers
only
Yes
Hun
gary
Yes
100
Nat
iona
l+O
ther
Plas
ma
frac
tion
atio
n fa
ctor
yYe
s
Icel
and
Yes
100
Nat
iona
l+O
ther
No
Irel
and
Yes
100
0N
atio
nal
Yes
Ital
yYe
s0
4010
0R
egio
nal a
utho
risa
tion
and
acc
redi
tati
onN
oYe
s
Latv
iaYe
s10
0N
atio
nal
Yes
Lith
uani
a60
Nat
iona
lYe
s
Luxe
mbo
urg
Yes
100
100
100
EFS
BO
RD
EAU
X fo
r FF
PN
atio
nal+
Oth
erE
FS B
OR
DE
AUX
Yes
Mal
taYe
s10
0E
U D
irec
tive
200
2/98
/EC
/ E
DQ
M M
anua
lN
atio
nal
Yes
Mon
tene
gro
Plan
ned
Nat
iona
lN
o
Net
herl
ands
Yes
100
100
Nat
iona
lYe
s
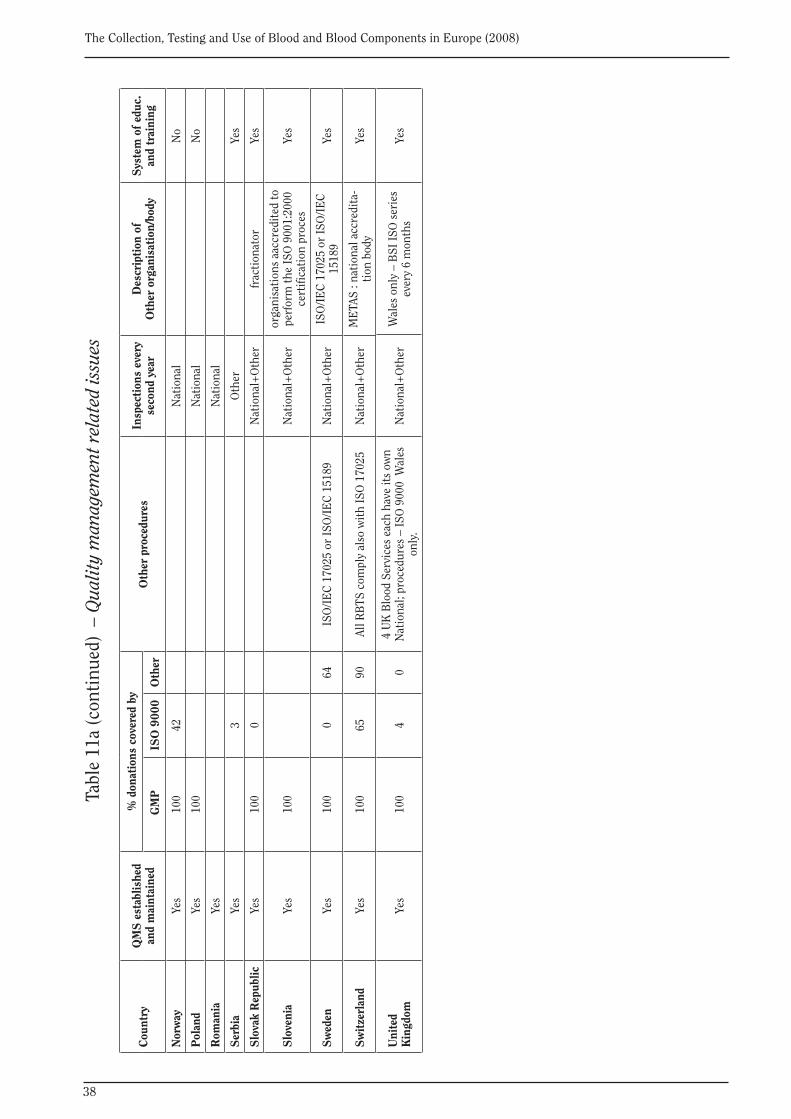
38
The Collection, Testing and Use of Blood and Blood Components in Europe (2008)
Cou
ntry
QM
S e
stab
lishe
d an
d m
aint
aine
d
% d
onat
ions
cov
ered
by
Oth
er p
roce
dure
sIn
spec
tion
s ev
ery
seco
nd y
ear
Des
crip
tion
of
Oth
er o
rgan
isat
ion/
body
Sys
tem
of
educ
.an
d tr
aini
ng G
MP
ISO
900
0O
ther
Nor
way
Yes
100
42N
atio
nal
No
Pol
and
Yes
100
Nat
iona
lN
o
Rom
ania
Yes
Nat
iona
l
Ser
bia
Yes
3O
ther
Yes
Slo
vak
Rep
ublic
Ye
s10
00
Nat
iona
l+O
ther
frac
tion
ator
Yes
Slo
veni
aYe
s10
0N
atio
nal+
Oth
eror
gani
sati
ons
aacc
redi
ted
to
perf
orm
the
ISO
900
1:20
00
cert
ifica
tion
pro
ces
Yes
Sw
eden
Yes
100
064
ISO
/IE
C 1
7025
or
ISO
/IE
C 1
5189
N
atio
nal+
Oth
erIS
O/I
EC
170
25 o
r IS
O/I
EC
15
189
Yes
Sw
itze
rlan
dYe
s10
065
90Al
l RB
TS c
ompl
y al
so w
ith
ISO
170
25N
atio
nal+
Oth
erM
ETA
S : n
atio
nal a
ccre
dita
-ti
on b
ody
Yes
Uni
ted
Kin
gdom
Yes
100
40
4 U
K B
lood
Ser
vice
s ea
ch h
ave
its
own
Nat
iona
l; pr
oced
ures
– IS
O 9
000
Wal
es
only
.N
atio
nal+
Oth
erW
ales
onl
y –
BSI
ISO
ser
ies
ever
y 6
mon
ths
Yes
Tabl
e 11
a (c
onti
nued
) –
Qua
lity
man
agem
ent r
elat
ed is
sues
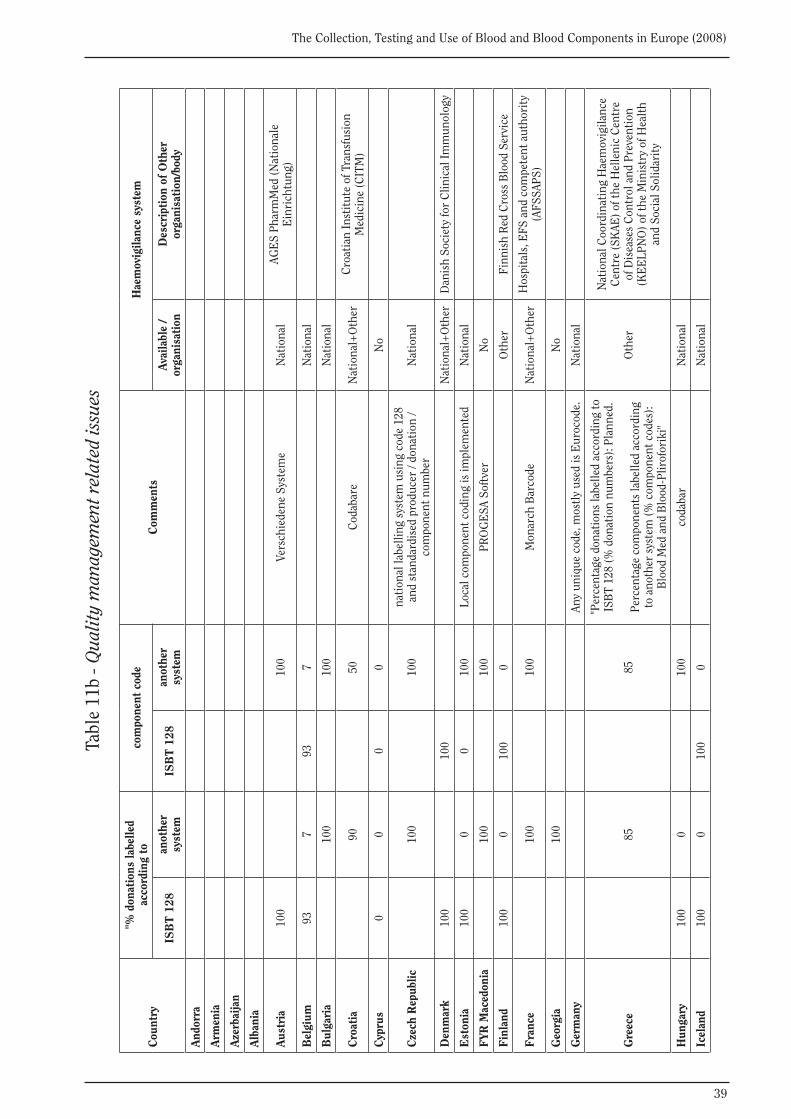
39
The Collection, Testing and Use of Blood and Blood Components in Europe (2008)
Tabl
e 11
b - Q
ualit
y m
anag
emen
t rel
ated
issu
es
Cou
ntry
"% d
onat
ions
labe
lled
acco
rdin
g to
com
pone
nt c
ode
Com
men
tsH
aem
ovig
ilanc
e sy
stem
ISB
T 1
28an
othe
r sy
stem
ISB
T 1
28an
othe
r sy
stem
Avai
labl
e /
orga
nisa
tion
Des
crip
tion
of
Oth
er
orga
nisa
tion
/bod
y
And
orra
Arm
enia
Aze
rbai
jan
Alb
ania
Aus
tria
100
100
Vers
chie
dene
Sys
tem
eN
atio
nal
AGE
S Ph
arm
Med
(Nat
iona
le
Ein
rich
tung
)
Bel
gium
937
937
Nat
iona
l
Bul
gari
a10
010
0N
atio
nal
Cro
atia
9050
Cod
abar
eN
atio
nal+
Oth
erC
roat
ian
Inst
itut
e of
Tra
nsfu
sion
M
edic
ine
(CIT
M)
Cyp
rus
00
00
No
Cze
ch R
epub
lic10
010
0na
tion
al la
belli
ng s
yste
m u
sing
cod
e 12
8 an
d st
anda
rdis
ed p
rodu
cer
/ don
atio
n /
com
pone
nt n
umbe
rN
atio
nal
Den
mar
k10
010
0N
atio
nal+
Oth
erD
anis
h So
ciet
y fo
r C
linic
al Im
mun
olog
y
Est
onia
100
00
100
Loca
l com
pone
nt c
odin
g is
impl
emen
ted
Nat
iona
l
FYR
Mac
edon
ia10
010
0PR
OG
ESA
Sof
tver
No
Fin
land
100
010
00
Oth
erFi
nnis
h R
ed C
ross
Blo
od S
ervi
ce
Fra
nce
100
100
Mon
arch
Bar
code
Nat
iona
l+O
ther
Hos
pita
ls, E
FS a
nd c
ompe
tent
aut
hori
ty
(AFS
SAPS
)
Geo
rgia
100
No
Ger
man
yAn
y un
ique
cod
e, m
ostl
y us
ed is
Eur
ocod
e.N
atio
nal
Gre
ece
8585
"Per
cent
age
dona
tion
s la
belle
d ac
cord
ing
to
ISB
T 12
8 (%
don
atio
n nu
mbe
rs):
Plan
ned.
Perc
enta
ge c
ompo
nent
s la
belle
d ac
cord
ing
to a
noth
er s
yste
m (%
com
pone
nt c
odes
):B
lood
Med
and
Blo
od-P
lirof
orik
i"
Oth
er
Nat
iona
l Coo
rdin
atin
g H
aem
ovig
ilanc
e C
entr
e (S
KAE
) of t
he H
elle
nic
Cen
tre
of D
isea
ses
Con
trol
and
Pre
vent
ion
(KE
ELP
NO
) of t
he M
inis
try
of H
ealt
h an
d So
cial
Sol
idar
ity
Hun
gary
100
010
0co
daba
rN
atio
nal
Icel
and
100
010
00
Nat
iona
l
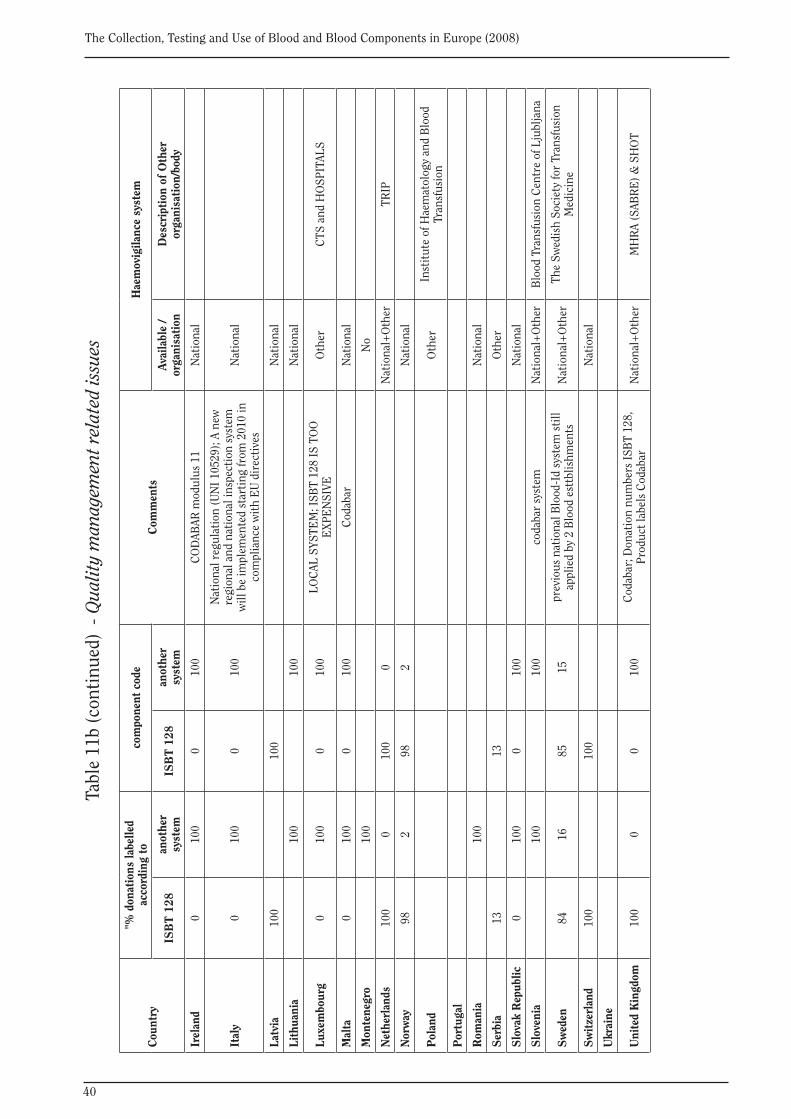
40
The Collection, Testing and Use of Blood and Blood Components in Europe (2008)
Cou
ntry
"% d
onat
ions
labe
lled
acco
rdin
g to
com
pone
nt c
ode
Com
men
tsH
aem
ovig
ilanc
e sy
stem
ISB
T 1
28an
othe
r sy
stem
ISB
T 1
28an
othe
r sy
stem
Avai
labl
e /
orga
nisa
tion
Des
crip
tion
of
Oth
er
orga
nisa
tion
/bod
y
Irel
and
010
00
100
CO
DAB
AR m
odul
us 1
1N
atio
nal
Ital
y0
100
010
0
Nat
iona
l reg
ulat
ion
(UN
I 105
29);
A ne
w
regi
onal
and
nat
iona
l ins
pect
ion
syst
em
will
be
impl
emen
ted
star
ting
from
201
0 in
co
mpl
ianc
e w
ith
EU
dir
ecti
ves
Nat
iona
l
Latv
ia10
010
0N
atio
nal
Lith
uani
a10
010
0N
atio
nal
Luxe
mbo
urg
010
00
100
LOC
AL S
YSTE
M; I
SBT
128
IS T
OO
E
XPE
NSI
VEO
ther
CTS
and
HO
SPIT
ALS
Mal
ta0
100
010
0C
odab
arN
atio
nal
Mon
tene
gro
100
No
Net
herl
ands
100
010
00
Nat
iona
l+O
ther
TRIP
Nor
way
982
982
Nat
iona
l
Pol
and
Oth
erIn
stit
ute
of H
aem
atol
ogy
and
Blo
od
Tran
sfus
ion
Por
tuga
l
Rom
ania
100
Nat
iona
l
Ser
bia
1313
Oth
er
Slo
vak
Rep
ublic
0
100
010
0N
atio
nal
Slo
veni
a10
010
0co
daba
r sy
stem
Nat
iona
l+O
ther
Blo
od T
rans
fusi
on C
entr
e of
Lju
blja
na
Sw
eden
8416
8515
prev
ious
nat
iona
l Blo
od-I
d sy
stem
sti
ll ap
plie
d by
2 B
lood
est
tblis
hmen
tsN
atio
nal+
Oth
erTh
e Sw
edis
h So
ciet
y fo
r Tr
ansf
usio
n M
edic
ine
Sw
itze
rlan
d10
010
0N
atio
nal
Ukr
aine
Uni
ted
Kin
gdom
100
00
100
Cod
abar
; Don
atio
n nu
mbe
rs IS
BT
128,
Pr
oduc
t lab
els
Cod
abar
Nat
iona
l+O
ther
MH
RA
(SAB
RE
) & S
HO
T
Tabl
e 11
b (c
onti
nued
) - Q
ualit
y m
anag
emen
t rel
ated
issu
es
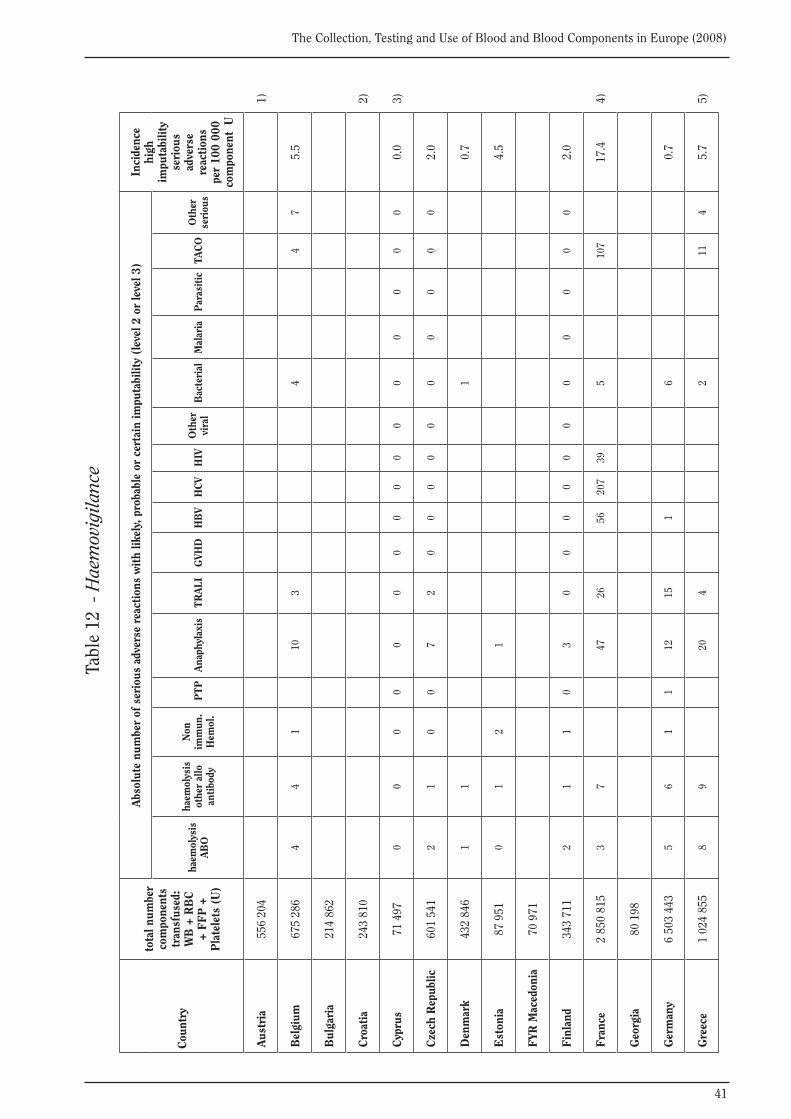
41
The Collection, Testing and Use of Blood and Blood Components in Europe (2008)
Tabl
e 12
- H
aem
ovig
ilanc
e
Cou
ntry
tota
l num
ber
com
pone
nts
tran
sfus
ed:
WB
+ R
BC
+
FF
P +
P
late
lets
(U
)
Abs
olut
e nu
mbe
r of
ser
ious
adv
erse
rea
ctio
ns w
ith
likel
y, p
roba
ble
or c
erta
in im
puta
bilit
y (l
evel
2 o
r le
vel 3
)In
cide
nce
high
im
puta
bilit
y se
riou
s ad
vers
e re
acti
ons
per
100
000
com
pone
nt U
haem
olys
is
AB
O
haem
olys
is
othe
r al
lo
anti
body
Non
im
mun
. H
emol
. P
TP
Ana
phyl
axis
TR
ALI
GVH
DH
BV
HC
VH
IVO
ther
vi
ral
Bac
teri
alM
alar
iaP
aras
itic
TAC
OO
ther
se
riou
s
Aus
tria
556
204
1)
Bel
gium
675
286
44
110
34
47
5.5
Bul
gari
a21
4 86
2
Cro
atia
243
810
2)
Cyp
rus
71 4
970
00
00
00
00
00
00
00
00.
03)
Cze
ch R
epub
lic60
1 54
12
10
07
20
00
00
00
00
02.
0
Den
mar
k43
2 84
61
11
0.7
Est
onia
87 9
510
12
14.
5
FYR
Mac
edon
ia70
971
Fin
land
343
711
21
10
30
00
00
00
00
00
2.0
Fra
nce
2 85
0 81
53
747
2656
207
395
107
17.4
4)
Geo
rgia
80 1
98
Ger
man
y6
503
443
56
11
1215
16
0.7
Gre
ece
1 02
4 85
58
920
42
114
5.7
5)
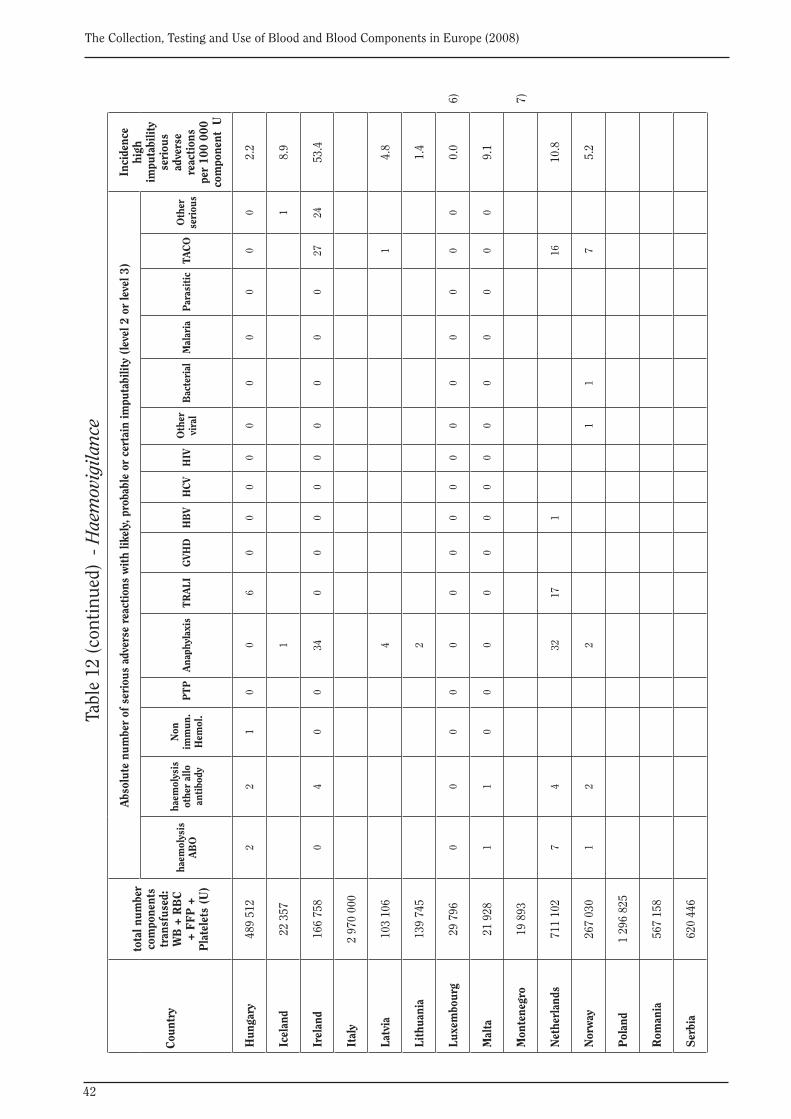
42
The Collection, Testing and Use of Blood and Blood Components in Europe (2008)
Cou
ntry
tota
l num
ber
com
pone
nts
tran
sfus
ed:
WB
+ R
BC
+
FF
P +
P
late
lets
(U
)
Abs
olut
e nu
mbe
r of
ser
ious
adv
erse
rea
ctio
ns w
ith
likel
y, p
roba
ble
or c
erta
in im
puta
bilit
y (l
evel
2 o
r le
vel 3
)In
cide
nce
high
im
puta
bilit
y se
riou
s ad
vers
e re
acti
ons
per
100
000
com
pone
nt U
haem
olys
is
AB
O
haem
olys
is
othe
r al
lo
anti
body
Non
im
mun
. H
emol
. P
TP
Ana
phyl
axis
TR
ALI
GVH
DH
BV
HC
VH
IVO
ther
vi
ral
Bac
teri
alM
alar
iaP
aras
itic
TAC
OO
ther
se
riou
s
Hun
gary
489
512
22
10
06
00
00
00
00
00
2.2
Icel
and
22 3
571
18.
9
Irel
and
166
758
04
00
340
00
00
00
00
2724
53.4
Ital
y2
970
000
Latv
ia10
3 10
64
14.
8
Lith
uani
a13
9 74
52
1.4
Luxe
mbo
urg
29 7
960
00
00
00
00
00
00
00
00.
06)
Mal
ta21
928
11
00
00
00
00
00
00
00
9.1
Mon
tene
gro
19 8
937)
Net
herl
ands
711
102
74
3217
116
10.8
Nor
way
267
030
12
21
17
5.2
Pol
and
1 29
6 82
5
Rom
ania
567
158
Ser
bia
620
446
Tabl
e 12
(con
tinu
ed)
- Hae
mov
igila
nce
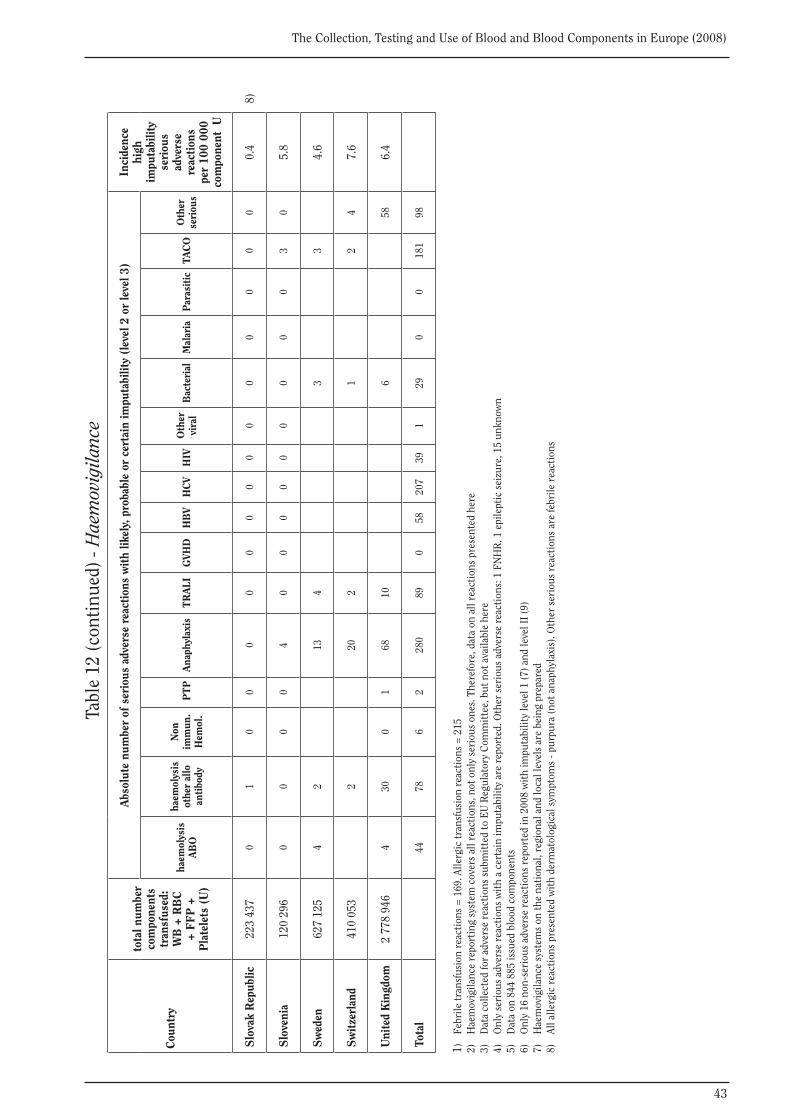
43
The Collection, Testing and Use of Blood and Blood Components in Europe (2008)
Cou
ntry
tota
l num
ber
com
pone
nts
tran
sfus
ed:
WB
+ R
BC
+
FF
P +
P
late
lets
(U
)
Abs
olut
e nu
mbe
r of
ser
ious
adv
erse
rea
ctio
ns w
ith
likel
y, p
roba
ble
or c
erta
in im
puta
bilit
y (l
evel
2 o
r le
vel 3
)In
cide
nce
high
im
puta
bilit
y se
riou
s ad
vers
e re
acti
ons
per
100
000
com
pone
nt U
haem
olys
is
AB
O
haem
olys
is
othe
r al
lo
anti
body
Non
im
mun
. H
emol
. P
TP
Ana
phyl
axis
TR
ALI
GVH
DH
BV
HC
VH
IVO
ther
vi
ral
Bac
teri
alM
alar
iaP
aras
itic
TAC
OO
ther
se
riou
s
Slo
vak
Rep
ublic
22
3 43
70
10
00
00
00
00
00
00
00.
4 8
)
Slo
veni
a12
0 29
60
00
04
00
00
00
00
03
05.
8
Sw
eden
627
125
42
134
33
4.6
Sw
itze
rlan
d41
0 05
32
202
12
47.
6
Uni
ted
Kin
gdom
2 77
8 94
64
300
168
106
586.
4
Tota
l44
786
228
089
058
207
391
290
018
198
1)
Febr
ile tr
ansf
usio
n re
acti
ons
= 1
69. A
llerg
ic tr
ansf
usio
n re
acti
ons
= 2
152)
H
aem
ovig
ilanc
e re
port
ing
syst
em c
over
s al
l rea
ctio
ns, n
ot o
nly
seri
ous
ones
. The
refo
re, d
ata
on a
ll re
acti
ons
pres
ente
d he
re3)
D
ata
colle
cted
for
adve
rse
reac
tion
s su
bmit
ted
to E
U R
egul
ator
y C
omm
itte
e, b
ut n
ot a
vaila
ble
here
4)
Onl
y se
riou
s ad
vers
e re
acti
ons
wit
h a
cert
ain
impu
tabi
lity
are
repo
rted
. Oth
er s
erio
us a
dver
se r
eact
ions
: 1 F
NH
R, 1
epi
lept
ic s
eizu
re, 1
5 un
know
n5)
D
ata
on 8
44 8
85 is
sued
blo
od c
ompo
nent
s6)
O
nly
16 n
on-s
erio
us a
dver
se r
eact
ions
rep
orte
d in
200
8 w
ith
impu
tabi
lity
leve
l 1 (7
) and
leve
l II (
9)7)
H
aem
ovig
ilanc
e sy
stem
s on
the
nati
onal
, reg
iona
l and
loca
l lev
els
are
bein
g pr
epar
ed8)
Al
l alle
rgic
rea
ctio
ns p
rese
nted
wit
h de
rmat
olog
ical
sym
ptom
s - p
urpu
ra (n
ot a
naph
ylax
is).
Oth
er s
erio
us r
eact
ions
are
febr
ile r
eact
ions
Tabl
e 12
(con
tinu
ed) -
Hae
mov
igila
nce
44
The Collection, Testing and Use of Blood and Blood Components in Europe (2008)
APPENDIX
Questionnaire on the collection, testing and use of blood and blood components in Europe
The 2008 survey
45
The Collection, Testing and Use of Blood and Blood Components in Europe (2008)
Strasbourg, 31 March 2006
QUESTIONNAIRE ON THE COLLECTION, TESTING AND USE OF BLOOD AND BLOOD COMPONENTS IN EUROPE
THE 2008 SURVEY
This questionnaire consists of three sections: A. Collection and use of blood and blood components, B. Testing of blood and blood components, and C. General information.
At the end of each section, please provide any additional information and comments that you think may be useful for the interpretation of the data and for the future improvement of the questionnaire. When information or data on specific terms is not available, please indicate “n.a.” (=data not yet available).
This questionnaire has been elaborated by and is copyright of Dr Olof Akerblom and Dr C.L. van der Poel. Revisions and additions have been made to comply with a World Health Organisation (WHO) questionnaire on selected indicators. Any questions you might have when filling out the questionnaire should be directly addressed to Dr C.L. van der Poel, [email protected]
Directive 2002/98/EC, Annex II, requests Member States of the European Union to report annually on the blood establishment’s activity. This request includes figures also asked for in this questionnaire (No. 1.1 + 1.2.1, 2.1-5, 3.1-5, 4.1-2, 7.1 + 8.3.1, 7.2 + 8.3.2, and 12.2).
The questionnaire is to be completed and returned by 15 September 2006 to Dr C.L. van der Poel, [email protected], copy to the Secretariat, Health Division, Council of Europe, F-67075 Strasbourg Cedex, Fax: + 33 388 41 2726; e-mail: [email protected]
46
The Collection, Testing and Use of Blood and Blood Components in Europe (2008)
COUNTRY
Information provided by
Institution
Address
Tel. & fax.
e-mail address
Population in country, number
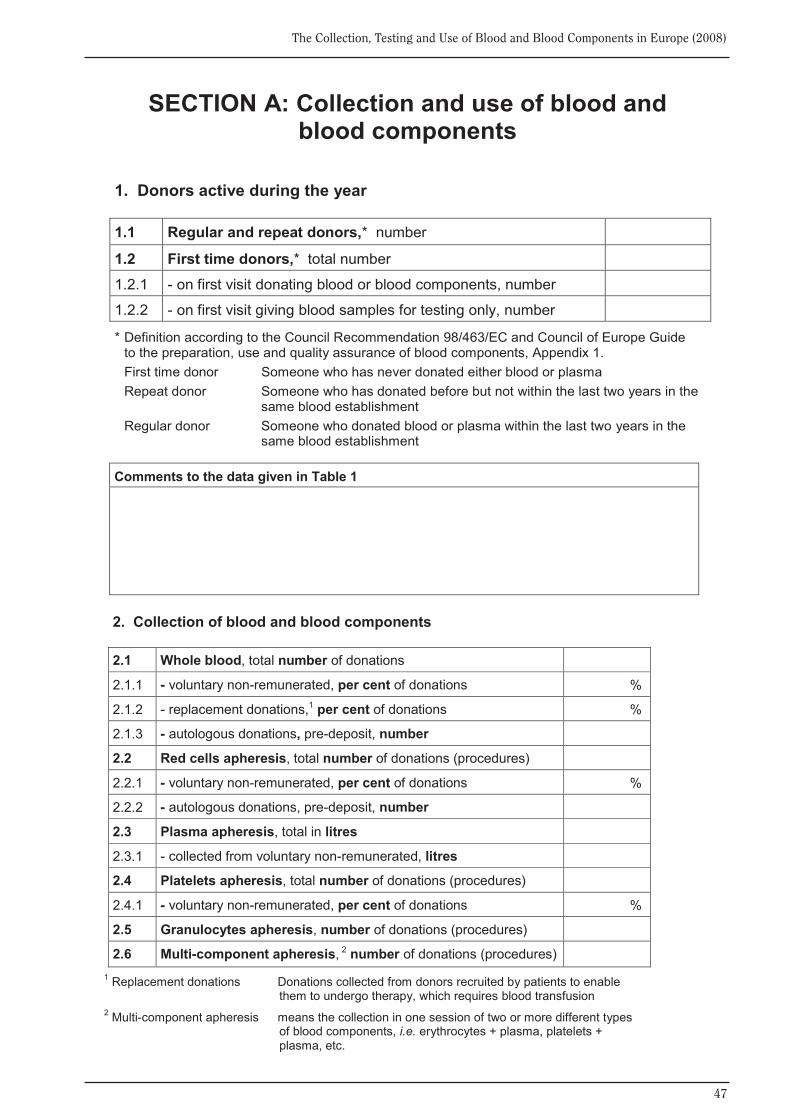
47
The Collection, Testing and Use of Blood and Blood Components in Europe (2008)
Comments to the data given in Table 1
SECTION A: Collection and use of blood and blood components
1. Donors active during the year 1.1 Regular and repeat donors,* number
1.2 First time donors,* total number
1.2.1 - on first visit donating blood or blood components, number
1.2.2 - on first visit giving blood samples for testing only, number
* Definition according to the Council Recommendation 98/463/EC and Council of Europe Guide to the preparation, use and quality assurance of blood components, Appendix 1.
First time donor Someone who has never donated either blood or plasma Repeat donor Someone who has donated before but not within the last two years in the
same blood establishment Regular donor Someone who donated blood or plasma within the last two years in the
same blood establishment
2. Collection of blood and blood components 2.1 Whole blood, total number of donations
2.1.1 - voluntary non-remunerated, per cent of donations %
2.1.2 - replacement donations,1 per cent of donations %
2.1.3 - autologous donations, pre-deposit, number
2.2 Red cells apheresis, total number of donations (procedures)
2.2.1 - voluntary non-remunerated, per cent of donations %
2.2.2 - autologous donations, pre-deposit, number
2.3 Plasma apheresis, total in litres
2.3.1 - collected from voluntary non-remunerated, litres
2.4 Platelets apheresis, total number of donations (procedures)
2.4.1 - voluntary non-remunerated, per cent of donations %
2.5 Granulocytes apheresis, number of donations (procedures)
2.6 Multi-component apheresis, 2 number of donations (procedures) 1 Replacement donations Donations collected from donors recruited by patients to enable
them to undergo therapy, which requires blood transfusion 2 Multi-component apheresis means the collection in one session of two or more different types
of blood components, i.e. erythrocytes + plasma, platelets + plasma, etc.
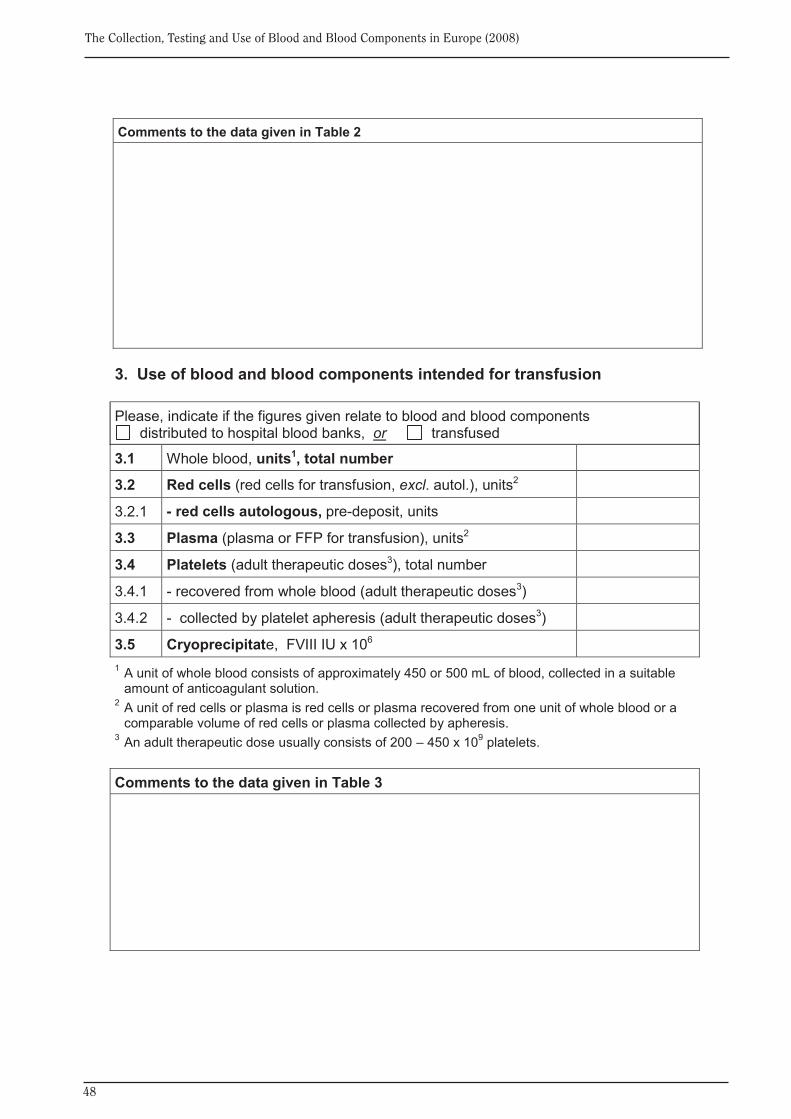
48
The Collection, Testing and Use of Blood and Blood Components in Europe (2008)
Comments to the data given in Table 2
3. Use of blood and blood components intended for transfusion Please, indicate if the figures given relate to blood and blood components
distributed to hospital blood banks, or transfused
3.1 Whole blood, units1, total number
3.2 Red cells (red cells for transfusion, excl. autol.), units2
3.2.1 - red cells autologous, pre-deposit, units
3.3 Plasma (plasma or FFP for transfusion), units2
3.4 Platelets (adult therapeutic doses3), total number
3.4.1 - recovered from whole blood (adult therapeutic doses3)
3.4.2 - collected by platelet apheresis (adult therapeutic doses3)
3.5 Cryoprecipitate, FVIII IU x 106 1 A unit of whole blood consists of approximately 450 or 500 mL of blood, collected in a suitable
amount of anticoagulant solution. 2 A unit of red cells or plasma is red cells or plasma recovered from one unit of whole blood or a
comparable volume of red cells or plasma collected by apheresis. 3 An adult therapeutic dose usually consists of 200 – 450 x 109 platelets. Comments to the data given in Table 3
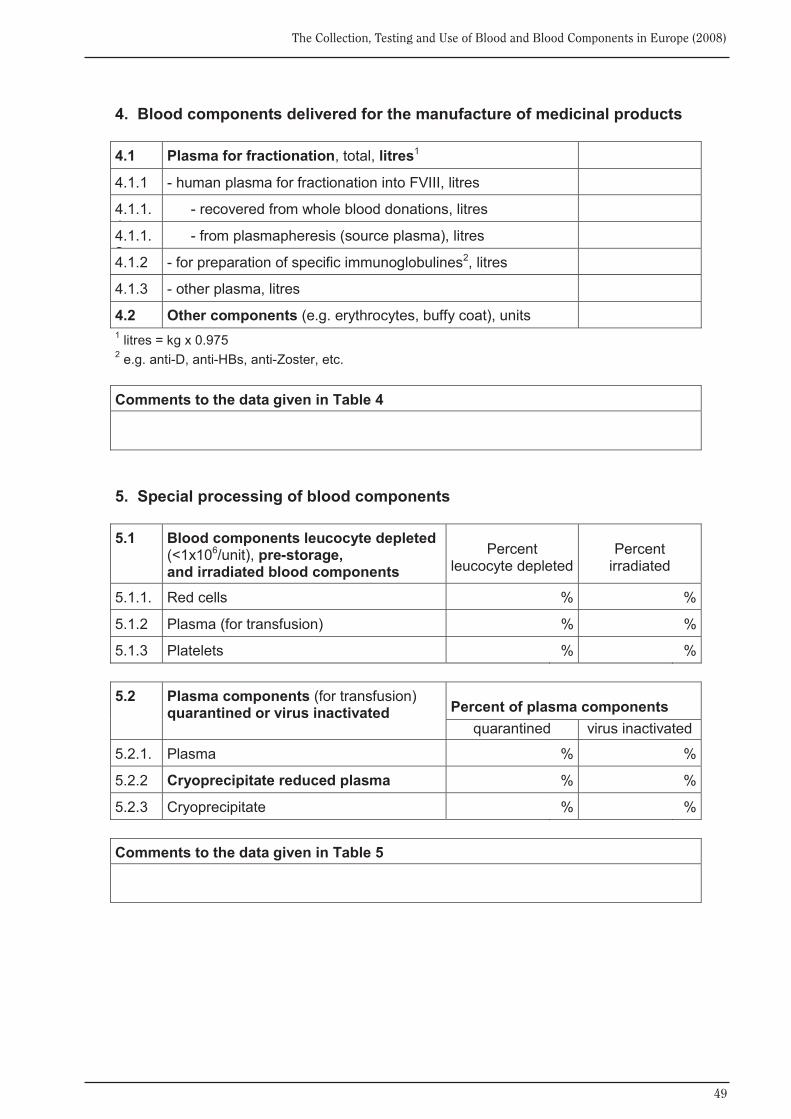
49
The Collection, Testing and Use of Blood and Blood Components in Europe (2008)
4. Blood components delivered for the manufacture of medicinal products 4.1 Plasma for fractionation, total, litres1
4.1.1 - human plasma for fractionation into FVIII, litres
4.1.1.1
- recovered from whole blood donations, litres
4.1.1.2
- from plasmapheresis (source plasma), litres
4.1.2 - for preparation of specific immunoglobulines2, litres
4.1.3 - other plasma, litres
4.2 Other components (e.g. erythrocytes, buffy coat), units 1 litres = kg x 0.975 2 e.g. anti-D, anti-HBs, anti-Zoster, etc. Comments to the data given in Table 4
5. Special processing of blood components 5.1 Blood components leucocyte depleted
(<1x10⁶/unit), pre-storage, and irradiated blood components
Percent leucocyte depleted
Percent irradiated
5.1.1. Red cells % %
5.1.2 Plasma (for transfusion) % %
5.1.3 Platelets % % 5.2 Plasma components (for transfusion)
quarantined or virus inactivated Percent of plasma components quarantined virus inactivated
5.2.1. Plasma % %
5.2.2 Cryoprecipitate reduced plasma % %
5.2.3 Cryoprecipitate % % Comments to the data given in Table 5
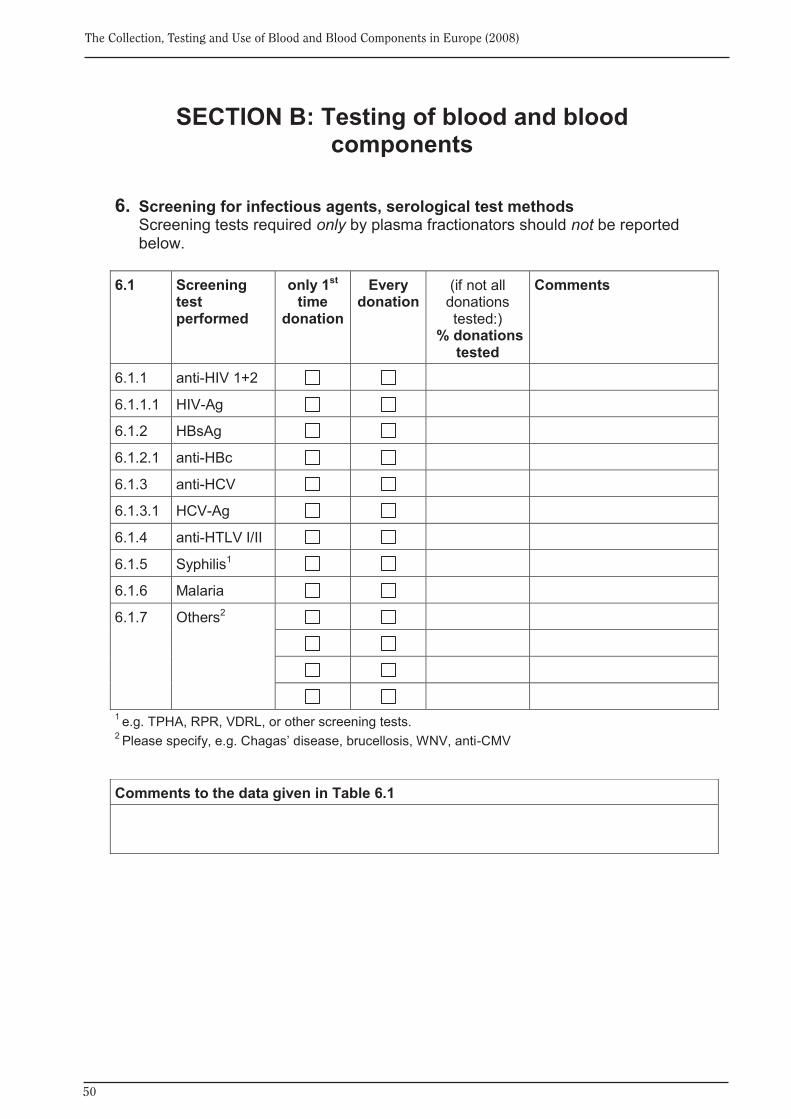
50
The Collection, Testing and Use of Blood and Blood Components in Europe (2008)
SECTION B: Testing of blood and blood components
6. Screening for infectious agents, serological test methods
Screening tests required only by plasma fractionators should not be reported below.
6.1 Screening
test performed
only 1st time
donation
Every donation
(if not all donations tested:)
% donations tested
Comments
6.1.1 anti-HIV 1+2
6.1.1.1 HIV-Ag
6.1.2 HBsAg
6.1.2.1 anti-HBc
6.1.3 anti-HCV
6.1.3.1 HCV-Ag
6.1.4 anti-HTLV I/II
6.1.5 Syphilis1
6.1.6 Malaria
6.1.7 Others2
1 e.g. TPHA, RPR, VDRL, or other screening tests. 2 Please specify, e.g. Chagas’ disease, brucellosis, WNV, anti-CMV
Comments to the data given in Table 6.1
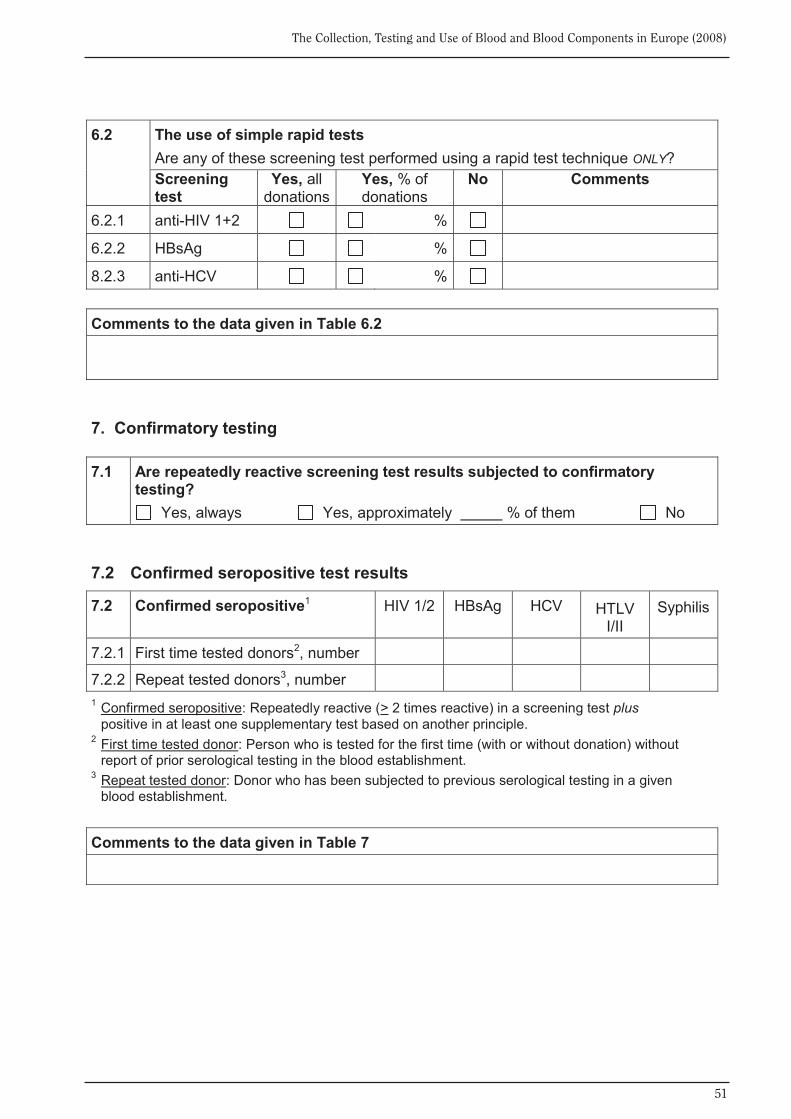
51
The Collection, Testing and Use of Blood and Blood Components in Europe (2008)
6.2 The use of simple rapid tests
Are any of these screening test performed using a rapid test technique ONLY? Screening test
Yes, all donations
Yes, % of donations
No Comments
6.2.1 anti-HIV 1+2 %
6.2.2 HBsAg %
8.2.3 anti-HCV % Comments to the data given in Table 6.2
7. Confirmatory testing 7.1 Are repeatedly reactive screening test results subjected to confirmatory
testing? Yes, always Yes, approximately % of them No
7.2 Confirmed seropositive test results
7.2 Confirmed seropositive1 HIV 1/2 HBsAg HCV HTLV I/II
Syphilis
7.2.1 First time tested donors2, number
7.2.2 Repeat tested donors3, number 1 Confirmed seropositive: Repeatedly reactive (> 2 times reactive) in a screening test plus
positive in at least one supplementary test based on another principle. 2 First time tested donor: Person who is tested for the first time (with or without donation) without
report of prior serological testing in the blood establishment. 3 Repeat tested donor: Donor who has been subjected to previous serological testing in a given
blood establishment. Comments to the data given in Table 7
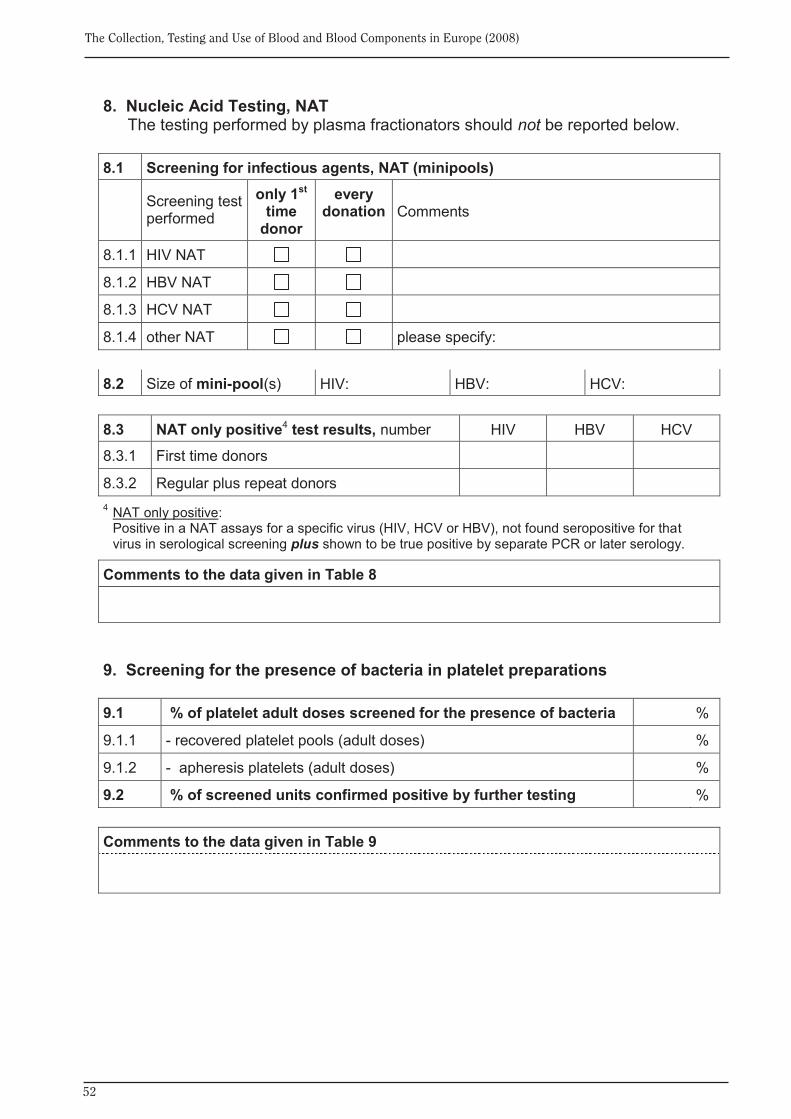
52
The Collection, Testing and Use of Blood and Blood Components in Europe (2008)
8. Nucleic Acid Testing, NAT The testing performed by plasma fractionators should not be reported below.
8.1 Screening for infectious agents, NAT (minipools)
Screening test performed
only 1st time
donor
every donation
Comments
8.1.1 HIV NAT
8.1.2 HBV NAT
8.1.3 HCV NAT
8.1.4 other NAT please specify: 8.2 Size of mini-pool(s) HIV: HBV: HCV: 8.3 NAT only positive4 test results, number HIV HBV HCV
8.3.1 First time donors
8.3.2 Regular plus repeat donors 4 NAT only positive:
Positive in a NAT assays for a specific virus (HIV, HCV or HBV), not found seropositive for that virus in serological screening plus shown to be true positive by separate PCR or later serology.
Comments to the data given in Table 8
9. Screening for the presence of bacteria in platelet preparations 9.1 % of platelet adult doses screened for the presence of bacteria %
9.1.1 - recovered platelet pools (adult doses) %
9.1.2 - apheresis platelets (adult doses) %
9.2 % of screened units confirmed positive by further testing % Comments to the data given in Table 9
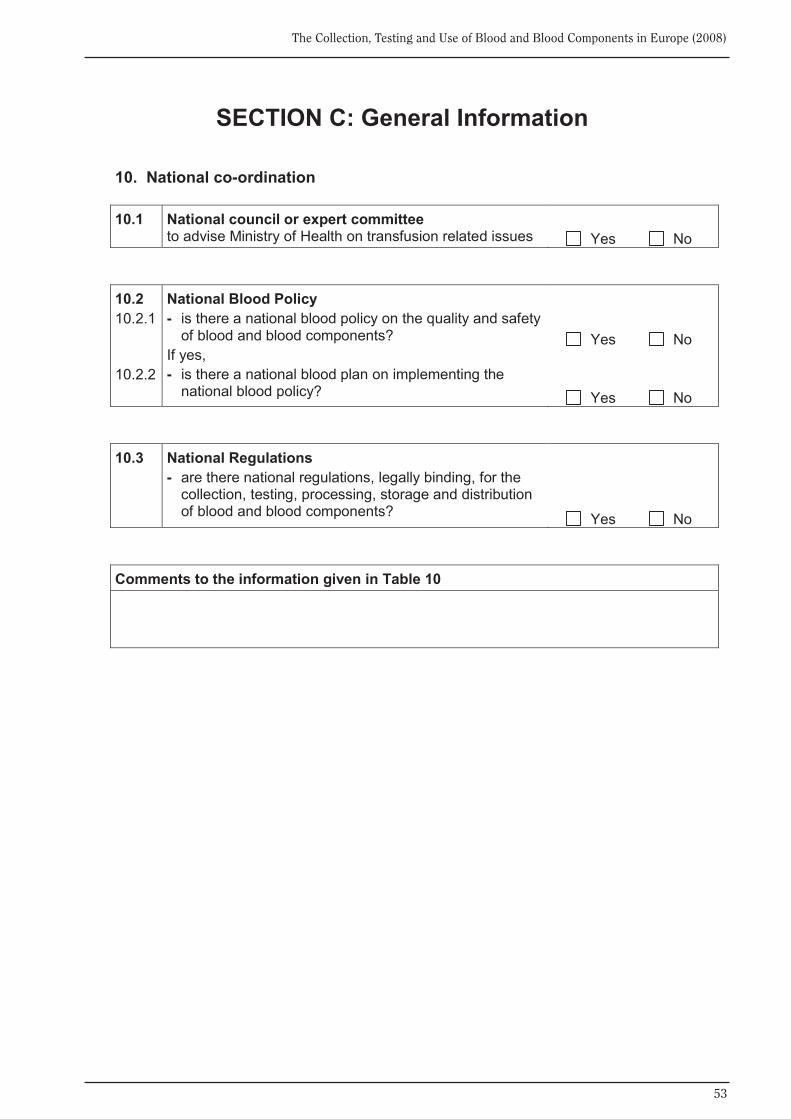
53
The Collection, Testing and Use of Blood and Blood Components in Europe (2008)
SECTION C: General Information 10. National co-ordination 10.1 National council or expert committee
to advise Ministry of Health on transfusion related issues Yes No
10.2 10.2.1 10.2.2
National Blood Policy - is there a national blood policy on the quality and safety
of blood and blood components? If yes, - is there a national blood plan on implementing the
national blood policy?
Yes No Yes No
10.3
National Regulations - are there national regulations, legally binding, for the
collection, testing, processing, storage and distribution of blood and blood components?
Yes No
Comments to the information given in Table 10
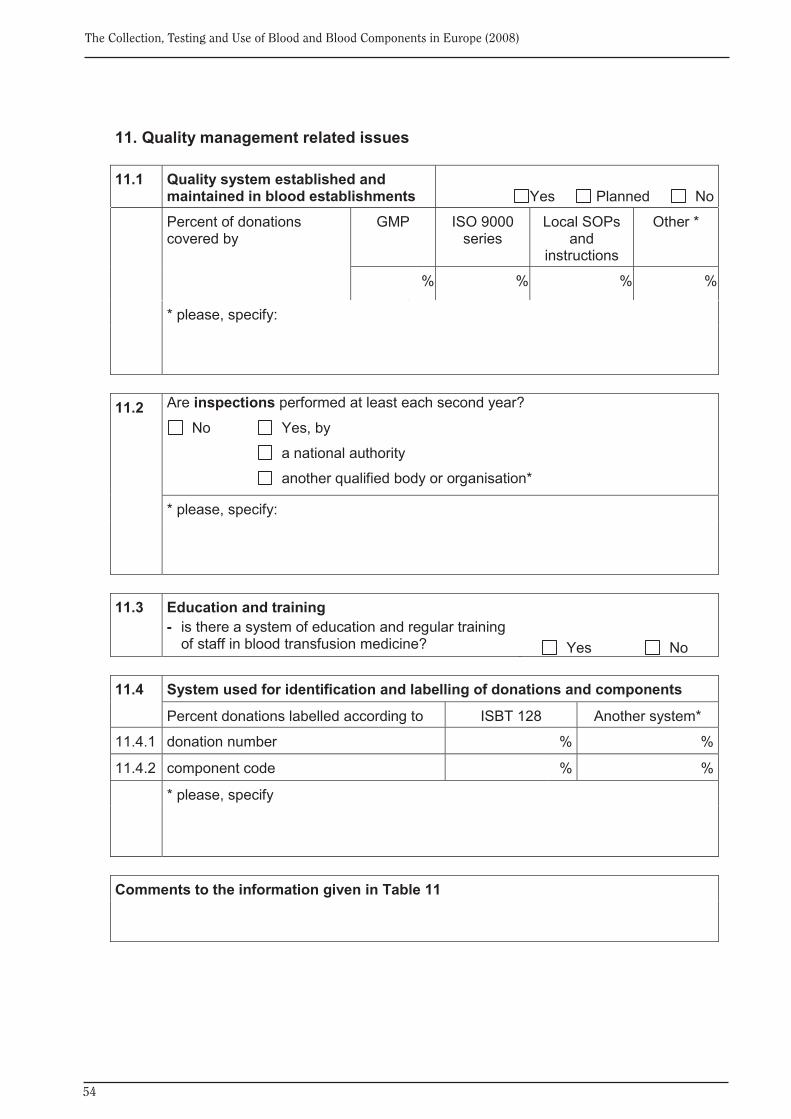
54
The Collection, Testing and Use of Blood and Blood Components in Europe (2008)
11. Quality management related issues 11.1 Quality system established and
maintained in blood establishments
Yes Planned No Percent of donations
covered by GMP ISO 9000
series Local SOPs
and instructions
Other *
%
% % % %
* please, specify:
11.2
Are inspections performed at least each second year?
No Yes, by
a national authority
another qualified body or organisation*
* please, specify:
11.3 Education and training
- is there a system of education and regular training of staff in blood transfusion medicine?
Yes No
11.4 System used for identification and labelling of donations and components
Percent donations labelled according to ISBT 128 Another system*
11.4.1 donation number % %
11.4.2 component code % %
* please, specify
Comments to the information given in Table 11

55
The Collection, Testing and Use of Blood and Blood Components in Europe (2008)
12. Haemovigilance
12.1 Is there a haemovigilance reporting system on national level?
No
Yes, - operated by a national authority
Yes, - operated by another organisation*
- if “Yes”, please give haemovigilance data, if available, in Table 12.2
*please, specify:
12.2 Haemovigilance data Serious adverse reactions* observed in recipients of blood or blood components:
Serious adverse reactions* reported - total - with imputability level*
number NA 0 - 1 2 3
Immunological haemolysis due to
ABO incompatibility
other allo-antibody
Non-immunological haemolysis
Post-Transfusion Purpura
Anaphylaxis / hypersensitivity
Transfusion Related Acute Lung Injury
Graft Versus Host Disease
Transfusion-associated viral infection
HBV
HCV
HIV-1/2
Other
Transfusion-associated bacterial infection
Transfusion-associated parasitical infection
Malaria
Other
Circulatory overload
Other serious reactions * When completing this table, please use the definitions of serious adverse reaction and
imputability presented on the next page.
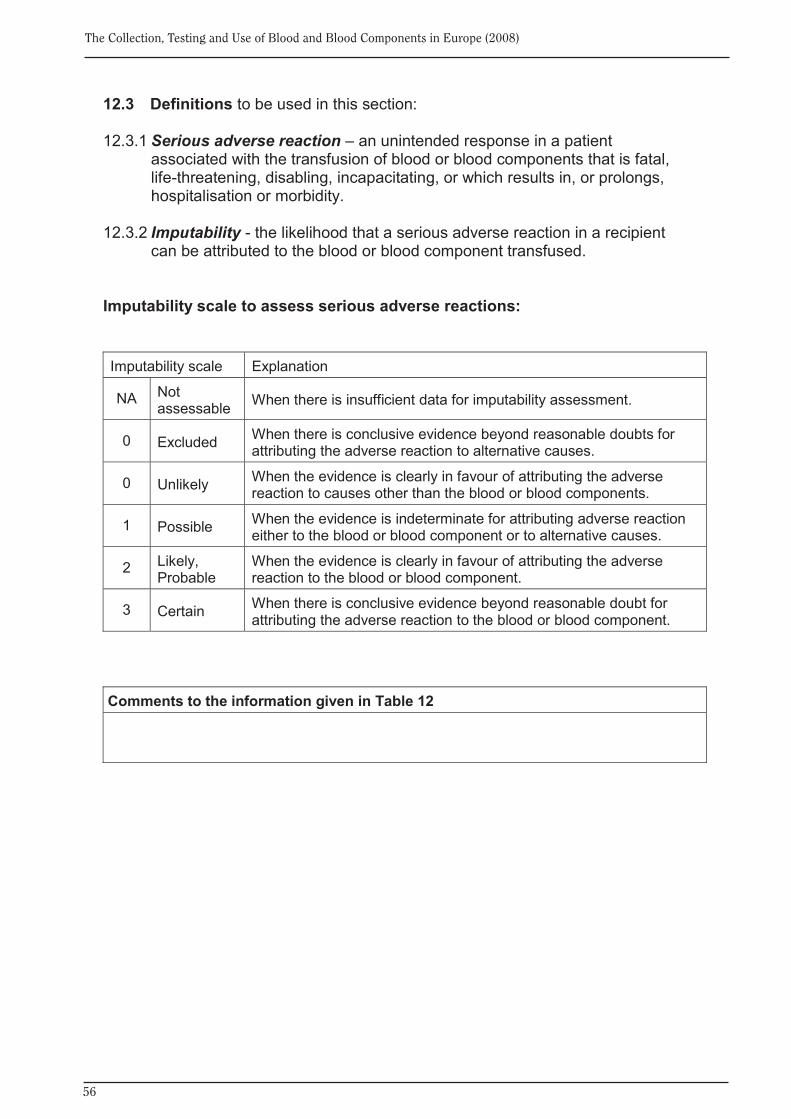
56
The Collection, Testing and Use of Blood and Blood Components in Europe (2008)
12.3 Definitions to be used in this section: 12.3.1 Serious adverse reaction – an unintended response in a patient
associated with the transfusion of blood or blood components that is fatal, life-threatening, disabling, incapacitating, or which results in, or prolongs, hospitalisation or morbidity.
12.3.2 Imputability - the likelihood that a serious adverse reaction in a recipient
can be attributed to the blood or blood component transfused.
Imputability scale to assess serious adverse reactions: Imputability scale Explanation
NA Not assessable When there is insufficient data for imputability assessment.
0 Excluded When there is conclusive evidence beyond reasonable doubts for attributing the adverse reaction to alternative causes.
0 Unlikely When the evidence is clearly in favour of attributing the adverse reaction to causes other than the blood or blood components.
1 Possible When the evidence is indeterminate for attributing adverse reaction either to the blood or blood component or to alternative causes.
2 Likely, Probable
When the evidence is clearly in favour of attributing the adverse reaction to the blood or blood component.
3 Certain When there is conclusive evidence beyond reasonable doubt for attributing the adverse reaction to the blood or blood component.
Comments to the information given in Table 12

Dr Marie-Emmanuelle Behr-GrossDepartment of Biological Standardisation, OMCL Network & HealthCareEDQM, Council of Europe7 allée KastnerCS 30026F-67081 STRASBOURG FRANCETel: +33 (0)3 90 21 41 08Fax: +33 (0)3 88 41 27 71E-mail: [email protected]
European Directorate forthe Quality of Medicines &
HealthCare (EDQM)Council of Europe
7 allée KastnerCS 30026
F-67081 STRASBOURG FRANCE
Website: www.edqm.euFor ordering: www.edqm.eu/store
FAQs & EDQM HelpDesk: www.edqm.eu/hd
For further information concerning the work of the Council of Europe / EDQM in the area of blood transfusion please contact:
European Committee (Partial Agreement)
on Blood Transfusion (CD-P-TS)
The Collection, Testing and Use
of Blood and Blood Components
in Europe
2008
Rep
ort