dr. k.c. gummagolmath dr. s.b. ramya lakshmi ch. bala swamy
TRANSCRIPT


1Working Paper on Coping with Covid-19-“Strategies for Agriculture Sector”
Working Paper onCoping with Covid-19- “Strategies for Agriculture
Sector”
By
Dr. K.C. Gummagolmath
Dr. S.B. Ramya Lakshmi
and
Ch. Bala Swamy
2021
National Institute of Agricultural Extension Management (MANAGE), Hyderabad
2 Working Paper on Coping with Covid-19-“Strategies for Agriculture Sector”
Coping with Covid-19 : Strategies for Agriculture Sector
Editors: Dr. K.C. Gummagolmath, Dr. S.B. Ramya Lakshmi and Mr. Ch. Bala Swamy
Edition: 2021. All rights reserved.
ISBN: 978-81-950446-5-8
Copyright © 2021 National Institute of Agricultural Extension Management (MANAGE), Hyderabad, India.
Citation: Gummagolmath. K.C, Ramya Lakshmi, S.B. and Bala Swamy, CH. (2021). Coping with Covid-19 - “Strategies for Agriculture Sector” [e-book]. Hyderabad: National Institute of Agricultural Extension Management (MANAGE).
This e-book is designed to educate extension workers, students, and research scholars, academicians related to agriculture and allied sectors. Neither the publisher nor the contributors, authors and editors assume any liability for any damage or injury to persons or property from any use of methods, instructions, or ideas contained in the e-book. No part of this publication may be reproduced or transmitted without prior permission of the publisher/editor/authors. Publisher and editor do not give warranty for any error or omissions regarding the materials in this e-book.
Published for Dr. P. Chandra Shekara, Director General, National Institute of Agricultural Extension Management (MANAGE), Hyderabad, India by Dr. Srinivasacharyulu Attaluri, Program Officer, MANAGE and printed at MANAGE, Hyderabad as e-publication.
iWorking Paper on Coping with Covid-19-“Strategies for Agriculture Sector”
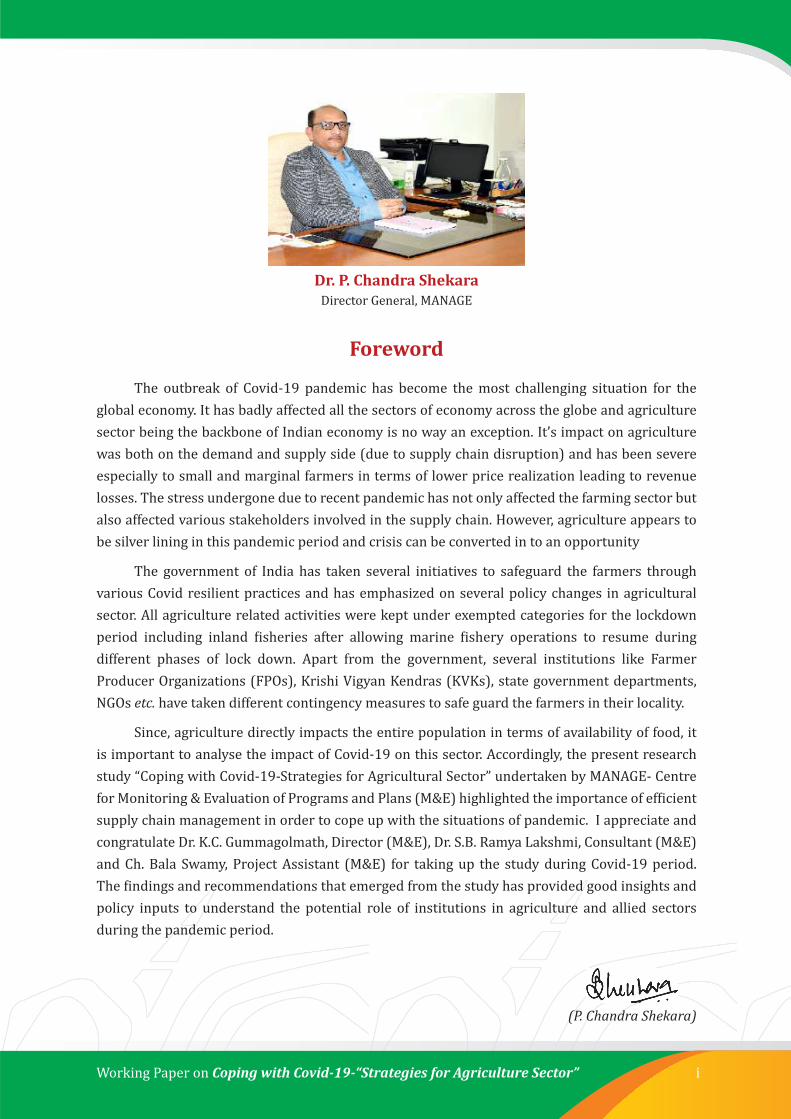
Dr. P. Chandra ShekaraDirector General, MANAGE
Foreword
The outbreak of Covid-19 pandemic has become the most challenging situation for the global economy. It has badly affected all the sectors of economy across the globe and agriculture sector being the backbone of Indian economy is no way an exception. It’s impact on agriculture was both on the demand and supply side (due to supply chain disruption) and has been severe especially to small and marginal farmers in terms of lower price realization leading to revenue losses. The stress undergone due to recent pandemic has not only affected the farming sector but also affected various stakeholders involved in the supply chain. However, agriculture appears to be silver lining in this pandemic period and crisis can be converted in to an opportunity
The government of India has taken several initiatives to safeguard the farmers through various Covid resilient practices and has emphasized on several policy changes in agricultural sector. All agriculture related activities were kept under exempted categories for the lockdown period including inland fisheries after allowing marine fishery operations to resume during different phases of lock down. Apart from the government, several institutions like Farmer Producer Organizations (FPOs), Krishi Vigyan Kendras (KVKs), state government departments, NGOs etc. have taken different contingency measures to safe guard the farmers in their locality.
Since, agriculture directly impacts the entire population in terms of availability of food, it is important to analyse the impact of Covid-19 on this sector. Accordingly, the present research study “Coping with Covid-19-Strategies for Agricultural Sector” undertaken by MANAGE- Centre for Monitoring & Evaluation of Programs and Plans (M&E) highlighted the importance of efficient supply chain management in order to cope up with the situations of pandemic. I appreciate and congratulate Dr. K.C. Gummagolmath, Director (M&E), Dr. S.B. Ramya Lakshmi, Consultant (M&E) and Ch. Bala Swamy, Project Assistant (M&E) for taking up the study during Covid-19 period. The findings and recommendations that emerged from the study has provided good insights and policy inputs to understand the potential role of institutions in agriculture and allied sectors during the pandemic period.
(P. Chandra Shekara)

ii Working Paper on Coping with Covid-19-“Strategies for Agriculture Sector”

iiiWorking Paper on Coping with Covid-19-“Strategies for Agriculture Sector”
Contents
Sl. No. Particulars Page No.1. Introduction
1.1. Impact of Covid-19 on the country’s economy
1.2. Objectives
1
1
32. Methodology
2.1. Sources of Data
2.2. Statistical Techniques
4
3. Results and Discussion
3.1. Impact of Covid-19 on Indian Agriculture and Allied Sectors
1.1.1. Impact of Covid-19 on Agricultural Sector
1.1.2. Impact of Covid-19 on Horticultural Sector
1.1.3. Impact of Covid-19 on Agri-Allied Sectors
3.1.4. Impact of Covid-19 on India’s Exports
3.2. Impact of Covid-19 on the Arrivals and Prices of Vegetables in major Markets of India
3.3. Impact of Covid-19 on the Arrivals and Prices of Vegetables at All India Level
3.4. Retail Markups of Vegetables and Pulses during the Pandemic Period
3.5. Impact of Covid-19 on the Supply Chain Management in Indian Agriculture 3.5.1. Government Initiatives to Overcome the Problems Faced Due to Covid-19
5
5
5
6
7
7
8
17
19
23
24
Way Forward 29References 30

iv Working Paper on Coping with Covid-19-“Strategies for Agriculture Sector”

vWorking Paper on Coping with Covid-19-“Strategies for Agriculture Sector”
List of Acronyms
AGMARKNET Agricultural Marketing Information System
APEDA Agricultural and Processed Food Products Export Development Authority
APMC Agricultural Produce Market Committee
CMFRI Central Marine Fisheries Research Institute
e-NAM Electronic National Agriculture Market
FPC Farmer Producer Company
FPO Farmer Producer Organization
GDP Gross Domestic Product
GoI Government of India
GVA Gross Value Added
ICAR Indian Council of Agricultural Research
INR Indian Rupee
KVK Krishi Vigyan Kendra
MFP Minor Forest Products
MSP Minimum Support Price
NABARD National Bank for Agriculture and Rural Development
NGO Non-Governmental Organization
NHRDF National Horticultural Research and Development Foundation
PE Provisional Estimate
SFAC Small Farmers Agribusiness Consortium

vi Working Paper on Coping with Covid-19-“Strategies for Agriculture Sector”

viiWorking Paper on Coping with Covid-19-“Strategies for Agriculture Sector”
List of TablesTable
No.Title Page No.
1. Estimated Impact by Covid-19 on India between April and June 2020 1
2. Effect of Covid-19 on the Prices of Commodities Involved in International Trade 5
3. Impact of Covid-19 on the arrivals and prices of Onion in Major Markets of India 8
4. Impact of Covid-19 on the arrivals and prices of Tomato in Major Markets of India 11
5. Impact of Covid-19 on the arrivals and prices of Potato in Major Markets of India 13
6. Impact of Covid-19 on the arrivals and prices of Garlic in Major Markets of India 15
7. Retail Markup (%) for Potato in India during April to August 2020 20
8. Retail Markup (%) for Onion in India during April to August 2020 21
9. Retail Markup (%) for Tomato in India during April to August 2020 21
10. Retail Markup (%) for Bengal Gram in India during April to August 2020 22
11. Retail Markup (%) for Red Gram in India during April to August 2020 22
12. Retail Markup (%) for Black Gram in India during April to August 2020 22
13. Retail Markup (%) for Moong Dal in India during April to August 2020 23
14. Retail Markup (%) for Masoor Dal in India during April to August 2020 23

viii Working Paper on Coping with Covid-19-“Strategies for Agriculture Sector”

ixWorking Paper on Coping with Covid-19-“Strategies for Agriculture Sector”
List of FiguresFigure
No.Title Page No.
1. Estimated Impact by Covid-19 on India between April and June 2020 1
2. Trend in Arrivals and Prices of Onion in Bangalore Market, Karnataka 9
3. Trend in Arrivals and Prices of Onion in Delhi Market 9
4. Trend in Arrivals and Prices of Onion in Mumbai Market, Maharashtra 10
5. Trend in Arrivals and Prices of Onion in Nasik Market, Maharashtra 10
6. Trend in Arrivals and Prices of Onion in Aurangabad Market, Maharashtra 10
7. Trend in Arrivals and Prices of Tomato in Kolar Market, Karnataka 11
8. Trend in Arrivals and Prices of Tomato Mulakalacheruvu Market, Andhra Pradesh 12
9. Trend in Arrivals and Prices of Tomato in Mumbai Market, Maharashtra 12
10. Trend in Arrivals and Prices of Tomato in Surat Market, Gujarath 13
11. Trend in Arrivals and Prices of Potato in Agra Market, Uttar Pradesh 13
12. Trend in Arrivals and Prices of Potato in Etawah Market, Uttar Pradesh 14
13. Trend in Arrivals and Prices of Potato in Mumbai Market, Maharashtra 14
14. Trend in Arrivals and Prices of Potato in Bangalore Market, Karnataka 15
15. Trend in Arrivals and Prices of Potato in Rajkot Market, Gujarath 15
16. Trend in Arrivals and Prices of Garlic in Nagpur Market, Maharashtra 16
17. Trend in Arrivals and Prices of Garlic in Mumbai Market, Maharashtra 16
18. Trend in Arrivals and Prices of Garlic in Bangalore Market, Karnataka 17
19. Arrivals and Prices of Garlic in India during 2019 and 2020 17
20. Arrivals and Prices of Onion in India during 2019 and 2020 18
21. Arrivals and Prices of Tomato in India during 2019 and 2020 18
22. Arrivals and Prices of Potato in India during 2019 and 2020 19

x Working Paper on Coping with Covid-19-“Strategies for Agriculture Sector”

xiWorking Paper on Coping with Covid-19-“Strategies for Agriculture Sector”
Executive SummaryThe spread of novel corona virus have had a major economic impact that has affected all
sectors of the economy with no exceptions. The International Monetary Fund (IMF) stated that the global economy will shrink by 3% this year and described the decline as the worst since the great depression of the 1930s. Moreover, the global GDP is expected to decline by 2.1%, while developing countries’ GDP is expected to decline by 2.5% and high-income countries by 1.9%. It has hit all sectors of the economy hard and even agriculture being an important sector had to face the challenge. According to researchers, the impact of covid-19 on US farm income this year is expected to decrease by 5.2% and projected a 0.76% decrease in 2021.
Agriculture being a backbone of Indian economy contributes 13 per cent to GDP and provides employment to about 48 per cent of the population. India is a leading producer of important agricultural commodities and is the second largest fruit and vegetable producer in the world. Besides, it is a leading producer of milk and livestock products. In spite of all this, as the recent pandemic began at a crucial juncture which coincided with the harvesting season and subsequently with the sowing season that has left the small and marginal farmers with no option behind. However, the Government of India and other institutions like FPOs, KVKs, NGOs and state government departments played a major role in protecting the farmers in all ways by implementing several initiatives physically and through electronic modes.
Under these circumstances, the present study “Coping with Covid-19 - Strategies for Agricultural Sector” was undertaken in order to study the impact of Covid-19 on Indian agriculture and allied sectors. Moreover, the study highlighted the role of institutional mechanism in agriculture and suggested few measures to overcome such pandemic situations. The results of the study revealed that, the wholesale prices of tomato, onion have declined sharply in the month of May 2020 across the country, mainly due to the higher production, compression of demand and market disruption amid COVID-19 crisis. It was also observed that the price of potato was high in the month of July 2020 in all the major markets selected. With regard to garlic, the market transactions were not interrupted as the arrivals during the study period were recorded in many markets in order to adjust the supply according to the demand which has become the need of the hour.
The analysis of retail markup for vegetables and pulses revealed that, the retail mark-up of potato from May 2020 shows that retail prices prevailing in Mumbai were 101.1 per cent more than the wholesale prices followed by Delhi and Ahmedabad. The highest retail markup of onion can be seen in the case of Nasik during the month of May (421.50%) followed by July (376.98%) and August (326.46%). Whereas in the case of Mumbai, July recorded the highest mark up of 300 per cent and 291.71 per cent during June. In the case of tomato the highest difference between wholesale and retail prices was recorded in Delhi (440.12%) during the month of June followed by Nasik (342.26%) in the month of April. However, lowest retail markup was observed in Jaipur (14.41%) during April and then reached highest in the month of June (260.52%).
In the case of pulses, when compared to all other cities, higher retail mark ups for bengal gram were recorded in Delhi followed by Mumbai. The difference between wholesale and retail

xii Working Paper on Coping with Covid-19-“Strategies for Agriculture Sector”
prices of red gram was almost less than 25 per cent in the study area. The retail markup of black gram has declined from April to May and then began to increase from May to June except in the case of Kolkata wherein the markup has declined from 11.11 per cent to 6.42 per cent. In the case of moong dal, major difference was not found in the retail markups during the selected period. The retail markups of masoor dal have declined during the months of April to May. However, a gradual increase was observed in the month of August. In the case of Mumbai, the retail markups were higher than other places i.e more than 35 per cent during the entire period.
In addition to the above analyses, the study also presented the impact of covid-19 on the exports as well as supply chain disruption in agriculture, several government initiatives taken up during the pandemic period. The study highlighted the role taken by the institutions like FPOs and KVKs from various parts of the country in helping their farmer members and other farmers in their locality in terms of procuring the produce, marketing them to the consumers, supply of seed and feed to the livestock farmers practicing poultry and aqua culture.

1Working Paper on Coping with Covid-19-“Strategies for Agriculture Sector”
1. Introduction India is the second-most populous country in the world and has become the fifth-largest economy overtaking United Kingdom and France in 2019. India’s post-independence journey began as an agrarian nation. However, over the years the manufacturing and services sector have emerged strongly. Today, its service sector is the fastest-growing sector in the world, contributing more than 60% to its economy and accounting for 28% of employment. Manufacturing sector remains as one of its crucial sectors and is being given due push via the governments’ initiatives, such as “Make in India.” It is also an important sector in terms of providing employment to large sections of the population in the country. One more important sectors of Indian economy is agriculture which is contributing 13 per cent to GDP and providing employment to about 48 per cent of the population. The growth in agriculture sector has been impressive in the recent decades. During FY 2019 (PE) the Gross Value Added (GVA) by agriculture, forestry and fishing is estimated at Rs. 18.55 lakh crore. Growth in GVA by agriculture and allied sectors stood at 2.1 per cent in 2019-20. India has set a food grain production target of 298.3 million tonnes for 2020-21 fiscal year against 291.95 million tonnes in 2019-20 and 285.20 million tonnes in 2018-19. According to the Economic Survey 2019-20, the annual growth rate in real terms in agriculture and its allied sectors was 2.88 per cent from 2014-15 to 2018-19, whereas, the estimated growth rate in 2019-20 was 2.9 per cent. India is a leading producer of important agricultural commodities and is the second largest fruit producer in the world. Although the contribution of its agricultural sector has declined to around 13 per cent from more than 50 per cent during independence, it is still way higher in comparison to the western nations.
The recent pandemic of Covid-19 has badly affected all the sectors of economy across the globe including agriculture. Though agriculture sector is least affected, several studies have indicated that there was a disruption in supply chain and logistics due to hindrance in the movement of agricultural commodities during the lock down period. Though, agricultural commodities were categorized as essential commodities, there was a delay in the transportation of the same. As a result, on one hand consumers are paying higher prices and once again, the middle men in the value chain are realizing higher profits. On this note, an attempt has been made in this paper to ascertain the impact of Covid-19 on Indian agriculture.
1.1 Impact of Covid-19 on the country’s economy India, as a part of the global community, which was already facing a sharp downturn by the end of 2019, has been adversely impacted by ongoing health crisis due to Covid-19 in all most all the sectors of the country as mentioned below:
Table-1: Estimated Impact by COVID-19 on India between April and June 2020Sl. No. Sector Growth Rate (%)
1. Public administration, defence & other services -0.42. Agriculture, forestry & fishing -1.33. Manufacturing -6.34. Overall GVA -9.35. Trade, hotels, transportation, communications and broadcasting services -9.76. Construction -13.37. Electricity, gas and other utility services -13.98. Mining & quarrying - 14.79. Financial, real estate & professional services -17.3
Source: www.statista.com

2 Working Paper on Coping with Covid-19-“Strategies for Agriculture Sector”
From the information presented in Table-1 and Fig-1, it is clearly evident that, the spread of pandemic corona has led to the lockdown of entire country for a period from March to May which resulted in negative growth of all the sectors.
-0.4-1.3
-6.3
-9.3 -9.7
-13.3 -13.9-14.7
-17.3-20
-18
-16
-14
-12
-10
-8
-6
-4
-2
0
Fig. 1: Estimated Impact by COVID-19 on India between April and June 2020
Among various sectors financial, real estate & professional services recorded the highest negative growth rate (-17.3%) followed by Mining and quarrying (-14.7%), Electricity, gas and other utility services (-13.9%), construction (-13.3%), trade (-9.7%), manufacturing (-6.3%), agriculture, forestry and fishing (-1.3%) and public administration, defence & other services recorded a decline of -0.4 per cent.
Since, agriculture directly impacts the entire population in terms of availability of food, it is important to analyse the impact of Covid-19 on the sector. The impact of pandemic began at a crucial juncture as it coincided with the harvesting season and subsequently with the sowing season. Several Covid resilient practices have been adopted by different stakeholders in the supply chain of agriculture. Among them are, innovative production practices by way of minimising the human touch, use of social media for accessing technology, automation of cultural operations and resorting for innovative marketing models such as online selling, direct selling to consumers etc. However, only a limited section of the farmers could realize the benefit of these interventions. While, the impact of pandemic has been severe especially to small and marginal farmers in terms of lower price realization leading to revenue losses. Under these circumstances, the government has emphasized on several policy changes in agricultural sector. The recent such policy initiatives are in the form of two acts passed to bring vibrancy in marketing sector viz. “The Farmers (Empowerment and Protection) Agreement on Price Assurance and Farm Services Act, 2020” and the “Farming Produce Trade and Commerce (Promotion and Facilitation) Act, 2020.”
The stress undergone by the recent pandemic has not only affected the farming sector but also affected various stakeholders involved in the supply chain. Due to closure of APMCs, and ban on transportation, the marketability of the agriculture produce has been affected on a large scale. The salt on the wound is the decline in demand for agriculture produce due to closure of hotels and restaurants.

3Working Paper on Coping with Covid-19-“Strategies for Agriculture Sector”
Keeping in view the severe impacts of COVID-19 on agriculture sector in India, an attempt has been made in this study to analyse the impact of this pandemic virus on India agriculture with the following objectives
1.2. Objectives:
1. To study the impact of covid-19 on Indian agriculture and allied sectors.
2. To analyze the impact of covid-19 on the arrivals and prices of vegetables in major markets of India.
3. To analyze the impact of covid-19 on the arrivals and prices of vegetables at all India level.
4. To analyze the retail markups for vegetables and pulses during the Pandemic period.
5. To study the effect of covid-19 on the supply chain management in agriculture.

4 Working Paper on Coping with Covid-19-“Strategies for Agriculture Sector”
2. Methodology
To analyse the impact of Covid-19 on arrivals and prices of vegetables, major markets of onion, tomato, potato and garlic were selected based on the quantity of arrivals.
2.1. Sources of Data:
For the purpose of studying impact of Covid-19 on Indian agriculture and allied sectors, secondary information was collected from various published sources.
To analyse the impact on vegetables, secondary data on prices and arrivals during January to October in 2019 and 2020 were collected from official websites of National Horticultural Research and Development Foundation (NHRDF), and Ministry of Statistics and Program Implementation.
Secondary data on retail and wholesale prices of vegetables and pulses were collected from the department of commerce affairs, Ministry of Consumer Affairs, Food and Public Distribution in order to analyse the retail markups.
2.2. Statistical Techniques:
Simple percentages were worked out to analyse the changes in arrivals and prices along with graphical presentations during the study period.

5Working Paper on Coping with Covid-19-“Strategies for Agriculture Sector”
3. Results and DiscussionThe data collected in accordance to the objectives from various sources were analysed and
presented in the following sections
3.1. Impact of Covid-19 on Indian Agriculture and Allied SectorsAmid the corona virus lockdown across the country that brought economic activity to a near
halt, the Indian government is expecting that agriculture sector could be a silver lining for the Indian economy as it is estimated to grow at a rate of 3 per cent for the year 2020-21, according to NITI Aayog report. Currently the growth of the agriculture sector is relatively higher than the non-agriculture sectors, which is very rare and the estimated growth is attributed to the normal monsoon this year along with India’s water availability in reservoirs, which is 40-60 per cent higher than last year. However, the prolonged lockdown along with rain and hailstorm in many regions has heightened rural distress, pushing villagers to a situation where farmers are affected in terms of performing agricultural operations. Initially, the pandemic situation coincided with the harvesting season and it is likely to affect sowing operations across the country. To add to the woes, large scale migration is leading to non-availability of labour for performing farm operations. Moreover, the disruption in wholesale markets and transportation hurdles have ravaged the rural economy.
The effect of lockdown has hit the agricultural sector hard. Progressive, entrepreneurial small and marginal farmers cultivating perishable commodities are amongst the worst hit. Global trade restrictions and the nation-wide lockdown had the following impact on Indian agriculture and allied sectors (compiled from different sources).
3.1.1. Impact of Covid-19 on Agriculture Sector
The information collected from different sources revealed the following impacts of Covid-19 on agricultural sector
Prices of most of the agricultural commodities have slipped below their minimum support price (MSP) because of lower demand on account of closure of hotels and restaurants. Moreover, labor and logistic problems, which created supply pressure on markets (mandis) near major production centers. Even remote Agricultural Produce Market Committees (APMCs) remain deserted. There were no arrivals recorded in few APMCs of the country during March to May 2020.
Due to the fall in demand from corona affected countries, the prices of both exportable and importable commodities have declined in line with the global trend as furnished in Table-2 below.
Table-2: Effect of COVID-19 on the Prices of Commodities Involved in International TradeSl. No. Commodity Decline in prices (%)
1 Soybean 10.02 Refined soya oil 7.83 Crude palm oil 12.04 Mustard seed 3.05 Guar gum 20.06 Guar seed 11.07 Jeera 3.88 Castor seed 5.5

6 Working Paper on Coping with Covid-19-“Strategies for Agriculture Sector”
From the Table-2, it can be observed that the decline in prices was as high as 20 per cent in the case of guar gum, followed by crude palm oil (12 per cent), guar seeds (11 per cent), soybean (10 per cent), refined soy oil (7.8 per cent), castor seeds (5.5 per cent), jeera and mustard by 3.8 per cent and 3 per cent respectively. The decline in prices of other commodities is discussed in the ensuing sections of the paper.
Wheat, flour and maida prices declined by 10 per cent in May after a marginal increase in April, because of decline in demand in the domestic market as well as by the importing countries due to lockdown.
Decline in edible oil prices is noticed due to decline in demand across all major consuming sectors following the global shutdown of factories, hotels and restaurants.
The other impact was on the spot trading of food grains and other agri-commodities in the markets, where arrivals were scanty with farmers hesitant to visit the market amid Covid-19.
Decline in cotton and yarn prices by 10 per cent was due to the halt in exports, mainly to China which has a cascading effect of decline in the margin by the exporters’ and eventually leading to decline in revenue to farmers.
It is estimated by the agencies that Indian cotton prices have come down by 12-15% due to the ongoing lockdown and fears that the country’s cotton consumption will reduce, resulting in more carry-forward stocks by September 2020.
The impact of the COVID-19 crisis on the rabi or winter season harvest has been affected badly, despite government efforts to facilitate agricultural activities.
3.1.2. Impact of Covid-19 on Horticulture Sector
On the contrary to decline in wholesale prices, the retail prices have spiked and it has been 20 per cent to 30 per cent higher in the case of potato in major producing states leading to higher cost of living.
As per the reports, the wholesale prices of onions have dropped to ₹ 5-8 per kg during February to May. On the other hand, there was an increase in retail prices during the same period.
Farmers who grow perishables, especially fruits and vegetables, are already bearing the brunt of the situation with the decline in prices, reduction in bulk demand from hotels and restaurants, and uncertainty over exports. For example, as reported in Hindu Business Line, banana prices in Andhra Pradesh at the farm level have seen a sharp fall from ₹ 15 per kg to ₹6 and ditto with mango. The price of bananas went down to Rs 10 per kilo from Rs. 45 in Kerala and Tamil Nadu.
Demand for flowers is almost nil as religious places are shut down and marriage ceremonies are kept in abeyance or muted during Covid-19 period.
The lockdown also had an impact on tea production in Assam and West Bengal, the two main tea producing regions of the country in a big way. The estimated loss will be around 150 million kg of tea as the farmers could not pluck the leaves due to scarcity of labour.

7Working Paper on Coping with Covid-19-“Strategies for Agriculture Sector”
3.1.3. Impact of Covid-19 on Agri -Allied Sectors
Demand for milk from the hotels and restaurant segments, which constitutes 15-20 per cent of total milk consumption, has declined drastically.
Farm-gate chicken prices have dropped by about 60% to an average of about ₹30/kg in south India from ₹72.50/kg in January after rumors on social media linking chicken consumption with Covid-19.
According to an estimate, the country’s monthly broiler production have collapsed from 30 crore live birds in January 2020 to 11-12 crore in May 2020. Monthly egg production has also dropped from 900 crore to 700 crore during this period.
Logistics problems and a sharp decline in international prices due to the ongoing spread of the corona virus has put the brakes on sugar exports from India.
The coronavirus crisis has thrown the export chain completely out of gear as phyto-sanitary inspectors from the US could not attend for inspecting the lots.
3.1.4. Impact of Covid-19 on India’s Exports
India is a major exporter of various commodities like basmathi rice, chillies (dry), spices, onion etc. During 2019, the value of exported agricultural and processed food products was US$ 38.49 billion and the major agricultural commodities exported were basmati rice (US$ 4.71 billion) and non-basmati rice (US$ 3.00 billion).
Indian agricultural/horticultural and processed foods are exported to more than 100 countries/regions and mainly to Middle East, Southeast Asia, SAARC countries, the EU and the US. As per the reports, the economic impact of the pandemic is much lower on exports of agricultural goods as compared to other sectors. However, the impact of Covid-19 on exports of few commodities from India is as follows (compiled from different sources).
Basmathi Rice: India is a leading exporter of Basmati rice to the world. The major importers are Middle East countries and there exists an ample demand from these countries. Morover, the demand increases mainly during April-June every year. But, because of the prevailing pandemic situation in the world, the exports were nearly halved than usual and could not meet the demand. This was mainly due to shortage of cargo containers by 50 to 60 per cent. In addition to this, for exporting the produce to countries which has already entered into a contract, the cost of containers have been hiked by 32 per cent due their high demand and shortage of supply.
India’s non-basmati rice exports have dropped 41% to about 4.5 million tons during Financial Year 2020
Banana: Exports of perishable products like banana has been hit due to the coronavirus outbreak in the European Union (EU), West Asia and South East Asia. Moreover, exports to the United States and Japan has suffered as the inspectors could not come for finalising their orders due to the travel bans and hence no export orders from these countries (www.apeda.gov.in).
Mangoes: The demand from exporters and processors of mango was reduced due to the restrictions on exports.

8 Working Paper on Coping with Covid-19-“Strategies for Agriculture Sector”
India’s overall import of edible oils from November 2019 till May 2020 fell by 18% year-on-year to 6.8 lakh tonne due to reduction in import of RBD Palmolein by 76%. The imports of crude palm oil (CPO) and crude palm kernel oil (CPKO) also registered a 14% decline during the same period, as compared to the previous year. This had an impact on domestic industries and business houses using these products as raw material.
Exports of vegetables and fruits from Kerala to the Gulf countries fell by 50%.
Keeping in view the above impact of Covid-19 on agriculture and allied sectors in general, the present study attempts to analyze in particular the impact of the pandemic virus on the arrivals and prices of various agricultural and horticultural commodities which is presented in detail as follows.
3.2. Impact of Covid-19 on the Arrivals and Prices of Vegetables in major markets of India
The following sections presents the impact of Covid-19 on the arrivals and prices of vegetables in major markets of India.
Table-3: Impact of Covid-19 on the arrivals and prices of Onion in Major Markets of India
Bangalore Delhi Mumbai Nasik Aurangabad
Arrivals Prices Arrivals Prices Arrivals Prices Arrivals Prices Arrivals Prices
January 289970 3398 138769 3384 217326 3844 25568 2908 12699 2480
February 161230 2072 112344 1911 203912 2078 18116 1745 8008 1442
March 286058 1473 171689 1646 178805 1773 19383 1440 8869 1090
April 331866 991 144515 1077 62919 1168 33414 800 10093 635
May 320095 694 87974 738 10824 1008 21977 589 3961 477
June 143598 861 62873 740 62628 892 16796 766 16729 450
July 96801 816 114175 957 105929 816 19815 588 11673 500Source: www.nhrdf.org
Bangalore: It can be observed from the Table-3 and Fig-2 that the arrivals of onion in Bangalore market of Karnataka has an irregular pattern wherein, they declined from January to February by almost 80 per cent. However, a sudden hike was observed from the month of March i.e arrivals increased by 43.63 per cent when compared to February. This increasing trend can be noticed in the month of April, but gradually declined in May. Moreover, there was a steep decline in arrivals from May to June by 123 per cent. With regard to the prices, a continuous declining trend can be observed from January (Rs. 3398 /qtl) to May (Rs. 694 / qtl). The increase in arrivals during March to May might be due to reason that, onion being an exportable commodity but due to global restrictions on the international trade in the wake of pandemic corona, there were no exports of this commodity to the major destinations from India. This led to the increase in domestic supply of onion in the country. In order to clear off the excess stock and to stabilize the demand and supply, the onions were sold at lower prices. Once the market committees have started functioning by the end of May, the prices started increasing at a slow pace from the month of June, however, remained lower than March and April prices.

9Working Paper on Coping with Covid-19-“Strategies for Agriculture Sector”
05001000150020002500300035004000
050000
100000150000200000250000300000350000
Jan-20 Feb-20 Mar-20 Apr-20 May-20 Jun-20 Jul-20
Price
(Rs/
qtl)
Arriv
als (
qtl)
Arrivals Prices
Fig. 2: Trend in Arrivals and Prices of Onion in Bangalore Market, Karnataka
Delhi: The trend in arrivals of onion from January to March in Delhi market (Fig-3) resembles the same trend as that of Bangalore market i.e the arrivals declined from January to May and then a steep hike in the month of March almost by 34.5 per cent. However, the arrivals recorded a declining trend from April to June and then increased in July.
The decrease in arrivals in the months of April to June might be due to the lockdown effect in the country which had a major impact on the transportation of produce from producing areas to the market committees. Irrespective of the change in arrivals, the prices declined gradually from January (Rs. 3384/qtl) to June (Rs. 740/qtl) and slightly increased to an extent of 23 per cent in the month of July (Rs. 957/qtl) when compared to June.
05001000150020002500300035004000
020000400006000080000
100000120000140000160000180000200000
Jan-20 Feb-20 Mar-20 Apr-20 May-20 Jun-20 Jul-20
Price
(Rs/
qtl)
Arriv
als (
qtl)
Arrivals Prices
Fig. 3: Trend in Arrivals and Prices of Onion in Delhi Market
Mumbai: The effect of Covid-19 on the arrivals of the commodities can be clearly visible in the case of onion in Mumbai market. From the Fig-4, it is evident that, the arrivals gradually declined from January (217236 qtl) to March (178805 qtl), but a major decline was seen from March to April by more than 100 per cent (184 per cent). Moreover, in the month of May, the arrivals were very low (10824 qtl) when compared to other months. However, once the market committees started functioning by the end of May, the arrivals started increasing immediately in the months of June and July as compared to May by 82.71 per cent and 90 per cent respectively. With regard to the prices, a declining trend was observed during the study period i.e. from January (Rs. 3844/qtl) to July (Rs. 816/qtl). Maximum arrivals with highest price was recorded during the month of January. Though the arrivals increased in the months of June and July, the prices continued to be lower.

10 Working Paper on Coping with Covid-19-“Strategies for Agriculture Sector”
050010001500200025003000350040004500
0
50000
100000
150000
200000
250000
Jan-20 Feb-20 Mar-20 Apr-20 May-20 Jun-20 Jul-20
Price
(Rs/
qtl)
Arriv
als (
qtl)
Arrivals Prices
Fig. 4: Trend in Arrivals and Prices of Onion in Mumbai Market, Maharashtra
Nasik: The arrivals and prices of onion in Nasik market (Fig-5), exhibited an irregular pattern during the study period. However, peak arrivals (25568 qtl) were recorded in the month of April and maximum price (Rs.2908/qtl) in the month of January. The prices remained low during April - July as compared to January to January to March month.
0500100015002000250030003500
05000
10000150002000025000300003500040000
Jan-20 Feb-20 Mar-20 Apr-20 May-20 Jun-20 Jul-20
Price
(Rs/
qtl)
Arriv
als (
qtl) Arrivals
Prices
Fig. 5: Trend in Arrivals and Prices of Onion in Nasik Market, Maharashtra
Aurangabad: Similar to that of Nasik market, the arrivals in Aurangabad market also exhibited an irregular pattern with a decreasing trend in prices (Fig-6). The lean period of arrivals were observed in the month of May (3961 qtl) and maximum arrivals were recorded in the month of June (16729 qtl). In this market also, the prices during May to July were lower than the prices during January to March.
0
500
1000
1500
2000
2500
3000
02000400060008000
1000012000140001600018000
Jan-20 Feb-20 Mar-20 Apr-20 May-20 Jun-20 Jul-20
Price
(Rs/
qtl)
Arriv
als (
qtl)
Arrivals Prices
Fig. 6: Trend in Arrivals and Prices of Onion in Aurangabad Market, Maharashtra

11Working Paper on Coping with Covid-19-“Strategies for Agriculture Sector”
Table-4: Impact of Covid-19 on the arrivals and prices of Tomato in Major Markets of India
TomatoKolar Mulakalacheruvu Mumbai Surat
Arrivals Prices Arrivals Prices Arrivals Prices Arrivals Prices
January 109550 931 14520 709 70417 1060 47545 1151
February 66210 617 5830 683 26228 874 31795 600
March 48690 540 8430 550 23379 963 21065 554
April 70423 327 29550 522 8233 969 16120 814
May 82400 436 13070 508 3671 933 7355 550
June 26650 950 5980 980 12069 1749 14304 1708
July 23110 1445 3850 2094 12823 2791 21235 2565
Source: www.nhrdf.org
Kolar Market: From the Table-4 and Fig-7, it can be observed that, Covid-19 couldn’t impact the market transactions in the case of Kolar market which is one of the largest markets for tomato in India. The arrivals were maximum in the month of January (109550 qtl) after which they declined in the months of February and March. Even during the period of lock down i.e. in the months of April and May, the arrivals were higher.
02004006008001000120014001600
020000400006000080000
100000120000
Jan-20 Feb-20 Mar-20 Apr-20 May-20 Jun-20 Jul-20Pr
ice (R
s/qt
l)
Arriv
als (
qtl)
Arrivals Prices
Fig. 7: Trend in Arrivals and Prices of Tomato in Kolar Market, Karnataka
However, there existed a positive relation between arrivals and prices from January to March i.e. prices declined along with decreasing arrivals. On the other hand, when compared to May, there was a steep increase in prices in the months of June (54%) and July (70%) as the arrivals declined. Highest price (Rs. 1445/qtl) with lowest arrivals (23110 qtls) was recorded in the month of July.
Mulakalacheruvu: The arrival pattern of tomato was found to be irregular all through the study period from January to July in Mulakalacheruvu market of Andhra Pradesh (Fig-8). However, major fluctuations were not observed among the prices from January to May, but there was sudden hike in the month of June (Rs. 980/qtl) from Rs. 508 per quintal in the month of May (by 48%). Similar to that of Kolar market, even in Mulakalacheruvu market highest price was recorded in the month of July (Rs. 2094/qtl) during which the arrivals were low when compared to the entire study period.

12 Working Paper on Coping with Covid-19-“Strategies for Agriculture Sector”
0
500
1000
1500
2000
2500
05000
100001500020000250003000035000
Jan-20 Feb-20 Mar-20 Apr-20 May-20 Jun-20 Jul-20
Price
(Rs/
qtl)
Arriv
als (
qtl)
Arrivals Prices
Fig. 8: Trend in Arrivals and Prices of Tomato Mulakalacheruvu Market, Andhra Pradesh
Mumbai: The impact of nation’s lockdown due to pandemic corona was clearly evident in the case of Mumbai market, Maharashtra. It can be observed from the Table- 4 and Fig-9, that the arrivals have shown a declining trend from January (70417 qtl) to May (3671 qtl) and the variations were to an extent of 1818 per cent. However, irrespective of arrivals, the prices were more or less stable with minimum fluctuations. In the country, once the sector wise unlock started by the end of May, the arrivals started gradually entering the market and thus they recorded an increasing trend during the months of June and July against previous periods of study. This situation of gradual increase in arrivals has resulted in a sudden hike in the prices during the same period. Though with slight recovery in the arrivals, during June – July the prices were the highest (Rs. 2791/qtl) during the month of July.
0
500
1000
1500
2000
2500
3000
01000020000300004000050000600007000080000
Jan-20 Feb-20 Mar-20 Apr-20 May-20 Jun-20 Jul-20
Price
(Rs/
qtl)
Arriv
als (
qtl) Arrival
s
Fig. 9: Trend in Arrivals and Prices of Tomato in Mumbai Market, Maharashtra
Surat: The behavior of arrivals and prices of tomato in Surat market were similar to that of Mumbai market. It is clearly evident from the Table-4 and Fig-10 that, the peak period of arrivals was observed in the month of January (47545 qtl) and thereafter declined continuously till the month of May which was found to be the lean period (7355 qtl). In this market also, with slightly higher degree of arrivals from June-July, the prices of tomato were at peak during June (Rs. 1708/qtl) and July (Rs. 2565/qtl)
13Working Paper on Coping with Covid-19-“Strategies for Agriculture Sector”
050010001500200025003000
0
10000
20000
30000
40000
50000
Jan-20 Feb-20 Mar-20 Apr-20 May-20 Jun-20 Jul-20
Price
(Rs/
qtl)
Arriv
als (
qtl)
Arrivals Prices
Fig. 10: Trend in Arrivals and Prices of Tomato in Surat Market, Gujarat
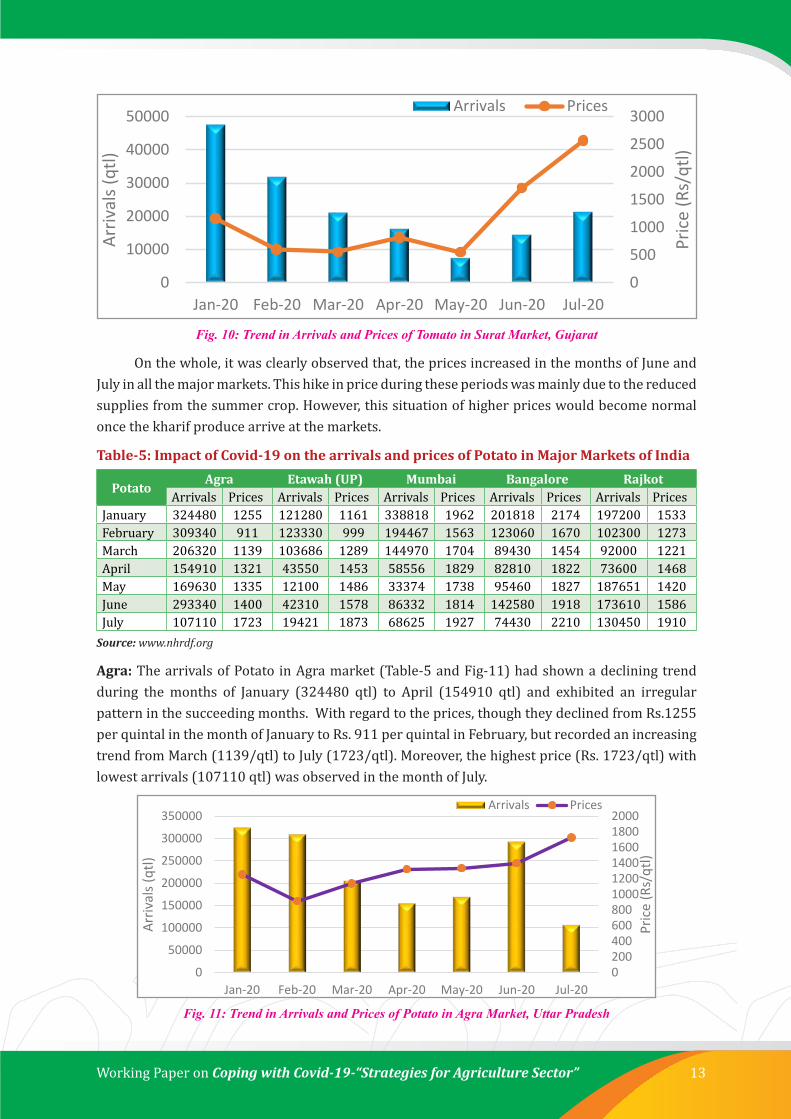
On the whole, it was clearly observed that, the prices increased in the months of June and July in all the major markets. This hike in price during these periods was mainly due to the reduced supplies from the summer crop. However, this situation of higher prices would become normal once the kharif produce arrive at the markets.
Table-5: Impact of Covid-19 on the arrivals and prices of Potato in Major Markets of India
PotatoAgra Etawah (UP) Mumbai Bangalore Rajkot
Arrivals Prices Arrivals Prices Arrivals Prices Arrivals Prices Arrivals PricesJanuary 324480 1255 121280 1161 338818 1962 201818 2174 197200 1533February 309340 911 123330 999 194467 1563 123060 1670 102300 1273March 206320 1139 103686 1289 144970 1704 89430 1454 92000 1221April 154910 1321 43550 1453 58556 1829 82810 1822 73600 1468May 169630 1335 12100 1486 33374 1738 95460 1827 187651 1420June 293340 1400 42310 1578 86332 1814 142580 1918 173610 1586July 107110 1723 19421 1873 68625 1927 74430 2210 130450 1910
Source: www.nhrdf.org
Agra: The arrivals of Potato in Agra market (Table-5 and Fig-11) had shown a declining trend during the months of January (324480 qtl) to April (154910 qtl) and exhibited an irregular pattern in the succeeding months. With regard to the prices, though they declined from Rs.1255 per quintal in the month of January to Rs. 911 per quintal in February, but recorded an increasing trend from March (1139/qtl) to July (1723/qtl). Moreover, the highest price (Rs. 1723/qtl) with lowest arrivals (107110 qtl) was observed in the month of July.
0200400600800100012001400160018002000
050000
100000150000200000250000300000350000
Jan-20 Feb-20 Mar-20 Apr-20 May-20 Jun-20 Jul-20
Price
(Rs/
qtl)
Arriv
als (
qtl)
Arrivals Prices
Fig. 11: Trend in Arrivals and Prices of Potato in Agra Market, Uttar Pradesh

14 Working Paper on Coping with Covid-19-“Strategies for Agriculture Sector”
Etawah: The arrivals of potato in Etawah market (Fig-12) were found to exhibit an irregular pattern, whereas the prices had shown an increasing trend from February (Rs. 999/qtl) to July (Rs. 1873/qtl). Moreover, it was observed that, the price behavior was not in accordance with the arrivals. However, the prices continuously increased from February to March and reached peak during July (more than 100%).
0200400600800100012001400160018002000
020000400006000080000
100000120000140000
Jan-20 Feb-20 Mar-20 Apr-20 May-20 Jun-20 Jul-20
Price
(Rs/
qtl)
Arriv
als (
qtl)
Arrivals Prices
Fig. 12: Trend in Arrivals and Prices of Potato in Etawah Market, Uttar Pradesh
Mumbai: The impact of Covid-19 on the arrivals of potato was clearly visible in the case of Mumbai market of Maharashtra (Table-5 & Fig-13) as they had shown a declining trend from January (338818 qtl) to May (33374 qtl) and then increased during the month of June. The arrivals slightly picked up during June-July compared to April-May (lockdown period).
0
500
1000
1500
2000
2500
050000
100000150000200000250000300000350000400000
Jan-20 Feb-20 Mar-20 Apr-20 May-20 Jun-20 Jul-20
Price
(Rs/
qtl)
Arriv
als (
qtl)
Arrivals Prices
Fig. 13: Trend in Arrivals and Prices of Potato in Mumbai Market, Maharashtra
However, major fluctuations were not observed in the case of prices except in the month of February.
Bangalore: It was observed from the Table –5 and Fig-14 that there was a major decline in the arrivals of potato from the month of January to February by 64 per cent and then declined gradually till the month of April. Arrivals though increased during May and June, declined during the month of July. In line with the arrivals, the prices also declined from January to March and from April to July they recorded an increasing trend.

15Working Paper on Coping with Covid-19-“Strategies for Agriculture Sector”
0
500
1000
1500
2000
2500
0
50000
100000
150000
200000
250000
Jan-20 Feb-20 Mar-20 Apr-20 May-20 Jun-20 Jul-20
Price
(Rs/q
tl)
Arriv
als (q
tl)Arrivals Prices
Fig. 14: Trend in Arrivals and Prices of Potato in Bangalore Market, Karnataka
Rajkot: The arrivals of potato in Rajkot market had exhibited an irregular pattern during the study period (Fig-15). On the other hand, the prices had shown a declining trend from January to April and again picked up in the month of May and increased during the months of June and July. However, irrespective of the arrivals, the prices gradually increased from March to July. The highest prices was observed during July (RS. 1910/qtl) and peak arrivals in the month of January (197200 qtl).
0
500
1000
1500
2000
2500
0
50000
100000
150000
200000
250000
Jan-20 Feb-20 Mar-20 Apr-20 May-20 Jun-20 Jul-20Pr
ice (R
s/qt
l)
Arriv
als (q
tl)
Arrivals Prices
Fig. 15: Trend in Arrivals and Prices of Potato in Rajkot Market, Gujarat
From the above analysis, it can be observed that the price of potato was high in the month of July in all the major markets selected and this was mainly due to lower production, similar to the situation of onions last year and the farmers planted less in response to the low realizations since 2017 as reported in Indian Express 20.08.2020.
Table-6: Impact of Covid-19 on the arrivals and prices of Garlic in Major Markets of India
GarlicNagpur Mumbai Bangalore
Arrivals Prices Arrivals Prices Arrivals PricesJanuary 3407 13925 19458 7625 23750 12068February 2659 14850 10418 7722 24700 13393March 12708 4275 12509 4639 18520 11857April 6300 6250 8911 6769 21090 10917May NA NA 10488 6193 24480 9239June 1335 6500 11791 5732 19720 9614July 1365 7531 7320 6833 7280 9461
Source: www.nhrdf.org

16 Working Paper on Coping with Covid-19-“Strategies for Agriculture Sector”
Nagpur: A peculiar situation of arrivals and prices can be seen in the case of garlic in Nagpur market of Maharashtra (Table-6 and Fig-16). It was observed that, though the maximum arrivals were recorded in the month of March, as the lockdown in the entire nation commenced by the end of March, its impact was clearly visible in the month of April, as the arrivals declined by more than 100 per cent (102%) i.e. from 12708 quintals to 6300 quintals respectively. Also, there were no arrivals during May, as most of the market committees were closed amidst pandemic corona. However, the produce started reaching the market in the month of June and the arrivals recorded were 1335 quintals. On the other hand, the prices also exhibited major fluctuations during the study period with a sharp decline from February to March and increased slightly during April. However, the prices which were very low during the month of May, recovered during the month of June and July.
0
5000
10000
15000
20000
02000400060008000
100001200014000
Jan-20 Feb-20 Mar-20 Apr-20 May-20 Jun-20 Jul-20
Price
(Rs/
qtl)
Arriv
als (
Qtl)
Arrivals Prices
Fig. 16: Trend in Arrivals and Prices of Garlic in Nagpur Market, Maharashtra
Mumbai & Bangalore Markets: Unlike Nagpur market, the trends in arrivals in Mumbai (Fig-17) and Bangalore markets (Fig-18) were substantial, even though declined during February in Mumbai market. The price trends in both the markets did not reveal much fluctuations except a sharp decline during March in Mumbai market.
0
2000
4000
6000
8000
10000
0
5000
10000
15000
20000
25000
Jan-20 Feb-20 Mar-20 Apr-20 May-20 Jun-20 Jul-20
Price
(Rs/
qtl)
Arriv
als (
Qtl)
Arrivals Prices
Fig. 17: Trend in Arrivals and Prices of Garlic in Mumbai Market, Maharashtra

17Working Paper on Coping with Covid-19-“Strategies for Agriculture Sector”
0200040006000800010000120001400016000
05000
1000015000200002500030000
Jan-20 Feb-20 Mar-20 Apr-20 May-20 Jun-20 Jul-20
Price
(Rs/
qtl)
Arriv
als (
Qtl)
Arrivals Prices
Fig. 18: Trend in Arrivals and Prices of Garlic in Bangalore Market, Karnataka
From the above analysis, it can be inferred that there was a continuous demand for spices like garlic during the pandemic period as it is a known fact that garlic boosts the human immunity and is considered as a natural remedy for respiratory disorders which is of utmost important during this pandemic situation. This might be the reason due to which the market transactions were not interrupted as arrivals were recorded in many markets in order to adjust the supply according to the demand which has become the need of the hour.
On the whole, it was observed that, the wholesale prices of tomato, onion have declined sharply in the month of May 2020 across the country, mainly due to the higher production, compression of demand and market disruption amid COVID-19 crisis.
3.3. Impact of Covid-19 on the Arrivals and Prices of Vegetables at all India level
(a) Garlic: It was noticed that in 2019, the arrivals of garlic were more or less similar with a slight decline from January till June and then increased in the month of July by about 60 per cent. However during the same period in 2020, the arrivals recorded a declining trend till May except in the month of March (Fig-19). During 2019, the prices of garlic showed an increasing trend from January to June and declined in July. Whereas, they reached peak during January, 2020 and started declining thereafter. It can be noticed that, there was an increasing trend in prices during 2019 and whereas in 2020, peak period of prices were recorded in January and thereafter continuously declined till the month of June. However, compared to 2019, the prices are relatively higher in 2020.
Jan-19
Feb-19
Mar-19
Apr-19
May-19
Jun-19
Jul-19
Jan-20
Feb-20
Mar-20
Apr-20
May-20
Jun-20
Jul-20
2019 2020Arrivals 8E+0 7E+0 7E+0 7E+0 5E+0 2E+0 5E+0 3E+0 2E+0 2E+0 9195 9755 1E+0 9187Prices 1707 1913 2569 3471 4342 5219 5833 1082 1051 7091 7103 5605 5397 6096
020004000600080001000012000
0100000200000300000400000500000600000700000800000900000 Arrivals Prices
Fig. 19: Arrivals and Prices of Garlic in India during 2019 and 2020
18 Working Paper on Coping with Covid-19-“Strategies for Agriculture Sector”
During lockdown period, despite decline in arrivals, there was a decline in prices of garlic. This might be due to decline in demand on account of closure of hotels and restaurants. It means, for the low arrivals also there were no buyers and hence there was a decline in prices.
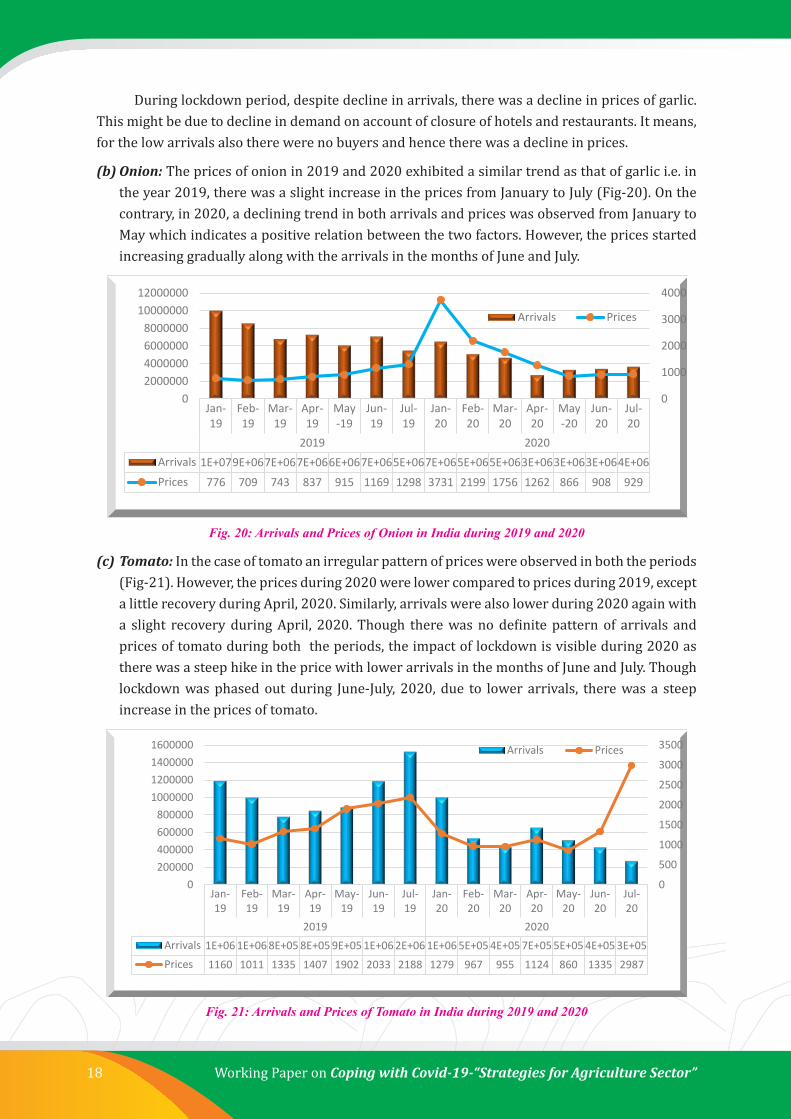
(b) Onion: The prices of onion in 2019 and 2020 exhibited a similar trend as that of garlic i.e. in the year 2019, there was a slight increase in the prices from January to July (Fig-20). On the contrary, in 2020, a declining trend in both arrivals and prices was observed from January to May which indicates a positive relation between the two factors. However, the prices started increasing gradually along with the arrivals in the months of June and July.
Jan-19
Feb-19
Mar-19
Apr-19
May-19
Jun-19
Jul-19
Jan-20
Feb-20
Mar-20
Apr-20
May-20
Jun-20
Jul-20
2019 2020Arrivals 1E+079E+067E+067E+066E+067E+065E+067E+065E+065E+063E+063E+063E+064E+06Prices 776 709 743 837 915 1169 1298 3731 2199 1756 1262 866 908 929
0
1000
2000
3000
4000
02000000400000060000008000000
1000000012000000
Arrivals Prices
Fig. 20: Arrivals and Prices of Onion in India during 2019 and 2020
(c) Tomato: In the case of tomato an irregular pattern of prices were observed in both the periods (Fig-21). However, the prices during 2020 were lower compared to prices during 2019, except a little recovery during April, 2020. Similarly, arrivals were also lower during 2020 again with a slight recovery during April, 2020. Though there was no definite pattern of arrivals and prices of tomato during both the periods, the impact of lockdown is visible during 2020 as there was a steep hike in the price with lower arrivals in the months of June and July. Though lockdown was phased out during June-July, 2020, due to lower arrivals, there was a steep increase in the prices of tomato.
Jan-19
Feb-19
Mar-19
Apr-19
May-19
Jun-19
Jul-19
Jan-20
Feb-20
Mar-20
Apr-20
May-20
Jun-20
Jul-20
2019 2020Arrivals 1E+06 1E+06 8E+05 8E+05 9E+05 1E+06 2E+06 1E+06 5E+05 4E+05 7E+05 5E+05 4E+05 3E+05Prices 1160 1011 1335 1407 1902 2033 2188 1279 967 955 1124 860 1335 2987
0500100015002000250030003500
0200000400000600000800000
1000000120000014000001600000 Arrivals Prices
Fig. 21: Arrivals and Prices of Tomato in India during 2019 and 2020

19Working Paper on Coping with Covid-19-“Strategies for Agriculture Sector”
(d) Potato: A contrasting situation was noticed in the case of arrivals and prices of potato. During 2019, an increasing trend was observed in the prices of potato from January and reached maximum in the month of July (Fig-22). Compared to 2019, the prices of potato during 2020 were higher with a continuous declining trend in arrivals from January till May. Even though arrivals recovered in the month of June, they again declined during July.
Jan-19
Feb-19
Mar-19
Apr-19
May-19
Jun-19
Jul-19
Jan-20
Feb-20
Mar-20
Apr-20
May-20
Jun-20
Jul-20
2019 2020Arrivals 5E+064E+064E+064E+063E+063E+063E+064E+063E+062E+062E+061E+062E+061E+06Prices 677 676 698 811 921 953 966 1519 1240 1349 1643 1611 1652 1972
0
500
1000
1500
2000
2500
0
1000000
2000000
3000000
4000000
5000000
6000000
Arrivals Prices
Fig. 22: Arrivals and Prices of Potato in India during 2019 and 2020
In all, it is revealed from the analysis of wholesale prices and arrivals of vegetables that there is a decline in the prices of most of the commodities across the country irrespective of decline or increase in arrivals. The only exception to this was potato crop. Thus, farmers had to bear the brunt of impact of Covid-19 in terms of decline in prices. Few other such cases are discussed in the subsequent sections of this paper. On the contrary, the analysis of retail prices revealed different scenario as discussed below.
The vegetables, being perishable commodities, the prices in general are subjected to volatility due to volatility in production on account of delayed monsoons, heavy rainfall etc. High price variability in case of primary products affects both producers as well as consumers through a spillover effect to the other sectors, thereby leading to high inflation in the economy (K.C.Gummagolmath et al. 2020). According to the official sources, during the mid of March, 2020, vegetables in retail markets of major cities have become costlier by 30-40 per cent due to a sharp increase in their transportation cost (four times than usual charge of Rs.100) and fears of supply disruptions amid the 21-day lockdown imposed across the country.
It was also observed that, during the initial stages of lock down in March, 2020, in cities like Kolkata, New Delhi, Mumbai etc., the retail prices of tomato went up by 25 per cent, potato by 26 per cent, onion by 8 per cent when compared to the previous weeks of March. There was a steep hike in potato prices by 60 per cent during March, 2020 compared to February, 2020.
3.4. Retail Markups of Vegetables and Pulses during the Pandemic Period
The spread of novel coronavirus had an unprecedented impact on all food markets, including the market for vegetables and pules. However, few reports stated that in India during the nation’s lockdown, the demand for vegetables has seen a major hike due to the misconception that chicken spreads the virus and this has become an advantage for the traders to increase the retail prices.

20 Working Paper on Coping with Covid-19-“Strategies for Agriculture Sector”
As per a report published by Thomson Reuters Foundation, the supply of meat has dropped sharply since a nationwide lockdown, which led millions of Kashmiris to turn towards vegetable cultivation. Since the start of the lockdown, Kashmiris have been consuming large quantities of haakh, a local variant of collard greens, as well as spinach, potatoes and onions, according to the Kashmir Vegetable Dealers Association.
On the other hand, due to the lack of buyers for the harvested vegetables and complete shutdown of APMCs all over India, the farmers in various states adopted direct marketing methods for selling their produce i.e the farmers has sold the vegetables directly to the consumers at their doorsteps. Moreover, in few states like Karnataka, Tamil Nadu, Kerala, Maharashtra, Bihar, Himachal Pradesh etc., the Farmer Producer Companies (FPCs) took a leading role on behalf of the farmers to market the vegetables directly to the consumers.
However, due to the scarcity of labor for harvesting the produce, absence of logistic facilities, closure of APMCs, in some areas the buyers / the private traders has taken the advantage of the situation and procured the vegetables at a lower price, which in turn sold to consumers at higher prices. Hence, in order to analyze the gap between wholesale and retail prices of vegetables, the retail markups were worked out and presented as below.
Potato: As Evident from the Table-7, during the month of April 2020, among different cities in India, the consumers in New Delhi are the most short changed by retailers of potato with margins between the wholesale and retail prices being higher (105.36) than other cities followed by Ahmedabad (100%) and Pune (95.99%). Retail mark-up from May 2020 shows that retail prices prevailing in Mumbai were 101.1 per cent more than the wholesale prices followed by Delhi and Ahmedabad. However, though the first phase of unlock started by the end of May, both the wholesale and retail prices has shown an increasing trend from the month of June to August with highest retail markup in Ahmedabad (118.18%) during June followed by Mumbai in the months of June (111.36%) and August (110%). On the other hand, in comparison with other cities, the consumers in places like Kolkata, Chennai and Hyderabad were least affected by higher retail prices as revealed by lower retail mark ups.
Table-7: Retail Markup (%) for Potato in India during April to August 2020
Centre Apr-20 May-20 June-20 July-20 Aug-20Delhi 105.36 100.76 91.18 89.62 58.07
Ahmedabad 100.00 100.00 118.18 90.57 50.66Mumbai 87.23 101.01 111.36 47.15 110.00Pune 95.99 76.47 57.99 48.41 53.28Jaipur 91.76 45.83 61.73 72.07 82.61Kolkata 20.44 18.07 12.32 16.38 20.32Chennai 25.45 16.91 32.35 54.73 35.49Hyderabad 15.79 15.67 27.27 34.78 21.57
Onion: Is one of the most market sensitive commodities that creates ripples in the trade and its significant position in the diets across all income groups, causes wide ranging effects with any significant change in price. Moreover, a situation of pandemic has become an added advantage for the retailers in hiking the retail prices and it is the poor and the lower middle class who were hit hard in the event of rise in price and so also the middle class. It is apparent from the Table-8

21Working Paper on Coping with Covid-19-“Strategies for Agriculture Sector”
that, in major markets like Nasik, Pune, Mumbai and New Delhi, the prices shoot up during the lock down period wherein the margin between wholesale and retail prices was more than 100 per cent. The highest retail markup can be seen in the case of Nasik during the month of May (421.50%) followed by July (376.98%) and August (326.46%). Whereas in the case of Mumbai, July recorded the highest mark up of 300 per cent and 291.71 per cent during June.
Table-8: Retail Markup (%) for Onion in India during April to August 2020
Centre Apr-20 May-20 June-20 July-20 Aug-20
Delhi 177.78 182.43 220.51 132.41 120.75
Ahmedabad 20.97 66.67 60.71 83.12 68.11
Mumbai 196.00 220.00 291.71 300.00 274.83
Pune 100.00 185.71 265.27 206.71 99.01
Nasik 241.89 421.50 295.33 376.98 326.46
Jaipur 89.25 134.64 137.62 78.76 152.81
Kolkata 26.69 16.50 17.65 33.33 33.62
Chennai 27.78 42.47 57.50 50.00 66.28
Hyderabad 4.87 67.07 18.73 33.33 44.19
Tomato: Tomato in spite of its perishable nature also face a situation of price volatility very frequently. The high price fluctuations might be due to unseasonal and irregular/heavy rainfalls, market forces like demand and supply and so on. The situation of pandemic has created a similar issue of price rise which is clearly evident from the results presented in Table-9. Highest difference between wholesale and retail prices was recorded in Delhi (440.12%) during the month of June followed by Nasik (342.26%) in the month of April. However, lowest retail markup was observed in Jaipur (14.41%) during April and then reached highest in the month of June (260.52%).
Table-9: Retail Markup (%) for Tomato in India during April to August 2020
Centre Apr-20 May-20 June-20 July-20 Aug-20
Delhi 157.80 257.69 440.12 119.12 110.12
Ahmedabad 100.00 100.00 185.71 37.91 35.12
Mumbai 254.84 240.85 182.81 85.74 92.63
Pune 305.76 166.67 195.73 52.73 134.56
Nasik 222.08 342.26 166.68 43.62 122.88
Jaipur 14.41 93.10 260.52 64.05 81.82
Kolkata 41.84 63.04 40.32 21.57 18.04
Chennai 67.48 50.73 189.23 34.33 43.25
Gram: It can be observed from the Table- 10 that, when compared to all other cities, higher retail mark ups for bengal gram were recorded in Delhi followed by Mumbai. However, in the case of Delhi the difference between wholesale and retail prices have declined from April (62.21%) till July (38.17%) and the similar situation is found in Nasik. On the other hand, the consumers were least affected in Jaipur and Hyderabad as is evident from lower markups.

22 Working Paper on Coping with Covid-19-“Strategies for Agriculture Sector”
Table-10: Retail Markup (%) for Bengal Gram in India during April to August 2020
Centre Apr-20 May-20 June-20 July-20 Aug-20
Delhi 62.21 41.71 38.95 38.17 39.44
Mumbai 37.01 34.21 45.71 38.72 41.96
Pune 23.52 28.30 31.43 29.20 20.34
Nashik 19.24 18.81 17.24 16.89 15.78
Jaipur 9.79 5.62 8.02 3.19 19.79
Kolkata 30.36 1.67 17.72 19.16 20.23
Chennai 17.29 27.59 24.25 25.79 25.32
Hyderabad 6.67 6.67 6.67 11.07 8.16
Red Gram: The difference between wholesale and retail prices of red gram (Table-11) was almost less than 25 per cent in the study area. In the case of Delhi (25.47% to 16.57%) and Kolkata (15.38% to 12.55%), the retail mark ups have come down gradually from the month of April till July 2020. On the other side, during the same period in Chennai the retail prices have increased with a markup ranging from 13.94 to 24.44 per cent and then declined to 18.13 per cent in the month of August.
Table-11: Retail Markup (%) for Red Gram in India during April to August 2020
Centre Apr-20 May-20 June-20 July-20 Aug-20
Delhi 25.47 17.64 16.98 16.57 21.69
Mumbai 21.05 16.19 20.45 19.66 24.36
Jaipur 5.61 1.36 4.72 3.20 8.07
Kolkata 15.38 12.50 12.97 12.55 17.05
Chennai 13.94 15.11 22.88 24.44 18.13
Hyderabad 9.02 2.99 6.25 6.90 3.45
Black gram: From the findings presented in the Table-12, it can be inferred that, the retail markup has declined from April to May in the case of Delhi (27.11% to 19.76%), Mumbai (32.99% to 27.14%), Kolkata (11.73% to 11.11%) and Chennai (21.55% to 12.86%). However, it began to increase from May to June except in the case of Kolkata wherein the markup has declined from 11.11 per cent to 6.42 per cent.
Table-12: Retail Markup (%) for Black Gram in India during April to August 2020
Centre Apr-20 May-20 June-20 July-20 Aug-20
Delhi 27.11 19.76 25.22 24.75 31.58
Mumbai 32.99 27.14 29.85 33.20 35.76
Kolkata 11.73 11.11 6.42 9.40 13.65
Chennai 21.55 12.86 25.00 20.07 19.08
Moong Dal: In the case of moong dal, major difference was not found in the retail markups during the selected period (Table-13) except a decline from April to May with regard to Delhi (21.74% to 13.76%) and Chennai (20.10% to 5.97%). When compared with the other places, Kolkata recorded lower retail mark ups during the study period.
23Working Paper on Coping with Covid-19-“Strategies for Agriculture Sector”
Table-13: Retail Markup (%) for Moong Dal in India during April to August 2020Centre Apr-20 May-20 June-20 July-20 Aug-20
Delhi 21.74 13.76 20.36 21.99 27.63Mumbai 25.20 23.52 21.53 23.76 25.33Kolkata 10.42 9.60 10.10 10.00 5.73Chennai 20.10 5.97 21.30 18.03 21.69
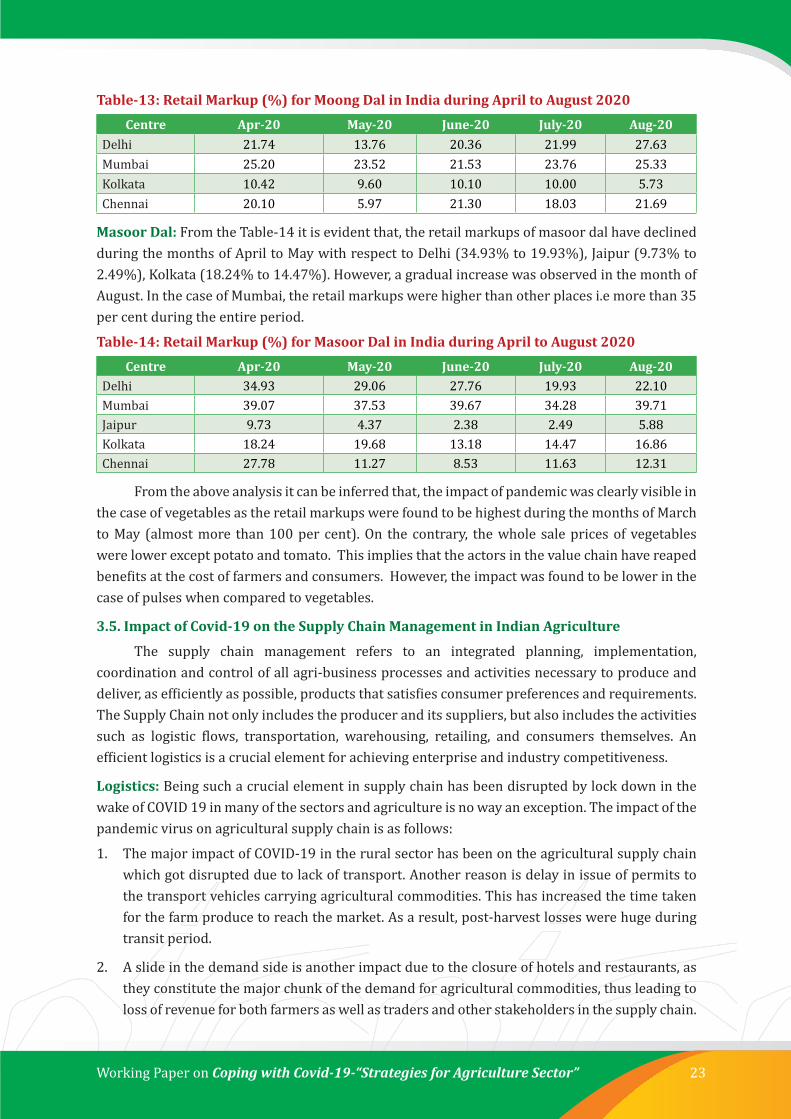
Masoor Dal: From the Table-14 it is evident that, the retail markups of masoor dal have declined during the months of April to May with respect to Delhi (34.93% to 19.93%), Jaipur (9.73% to 2.49%), Kolkata (18.24% to 14.47%). However, a gradual increase was observed in the month of August. In the case of Mumbai, the retail markups were higher than other places i.e more than 35 per cent during the entire period.
Table-14: Retail Markup (%) for Masoor Dal in India during April to August 2020Centre Apr-20 May-20 June-20 July-20 Aug-20
Delhi 34.93 29.06 27.76 19.93 22.10Mumbai 39.07 37.53 39.67 34.28 39.71Jaipur 9.73 4.37 2.38 2.49 5.88Kolkata 18.24 19.68 13.18 14.47 16.86Chennai 27.78 11.27 8.53 11.63 12.31
From the above analysis it can be inferred that, the impact of pandemic was clearly visible in the case of vegetables as the retail markups were found to be highest during the months of March to May (almost more than 100 per cent). On the contrary, the whole sale prices of vegetables were lower except potato and tomato. This implies that the actors in the value chain have reaped benefits at the cost of farmers and consumers. However, the impact was found to be lower in the case of pulses when compared to vegetables.
3.5. Impact of Covid-19 on the Supply Chain Management in Indian Agriculture
The supply chain management refers to an integrated planning, implementation, coordination and control of all agri-business processes and activities necessary to produce and deliver, as efficiently as possible, products that satisfies consumer preferences and requirements. The Supply Chain not only includes the producer and its suppliers, but also includes the activities such as logistic flows, transportation, warehousing, retailing, and consumers themselves. An efficient logistics is a crucial element for achieving enterprise and industry competitiveness.
Logistics: Being such a crucial element in supply chain has been disrupted by lock down in the wake of COVID 19 in many of the sectors and agriculture is no way an exception. The impact of the pandemic virus on agricultural supply chain is as follows:
1. The major impact of COVID-19 in the rural sector has been on the agricultural supply chain which got disrupted due to lack of transport. Another reason is delay in issue of permits to the transport vehicles carrying agricultural commodities. This has increased the time taken for the farm produce to reach the market. As a result, post-harvest losses were huge during transit period.
2. A slide in the demand side is another impact due to the closure of hotels and restaurants, as they constitute the major chunk of the demand for agricultural commodities, thus leading to loss of revenue for both farmers as well as traders and other stakeholders in the supply chain.

24 Working Paper on Coping with Covid-19-“Strategies for Agriculture Sector”
3. Another impact was delay in sowing and harvesting of crops which coincided with the sowing season initially and harvest season in subsequent period. Due to the non-availability of inputs such as seeds, tractors, ancillary support, medicines for crop protection, farmers faced problem in sowing the crop. On the other hand, harvesting was badly affected due to lockdown and on account of shortage of labor on account of reverse migrants.
4. The other impact of Covid-19 was on the exports. India has been a major exporter of crops and as per APEDA, India’s overall agri-exports in 2018-19 were to the tune of Rs. 685 billion. Due to ban on international travel, there is a mere absence of export resulting in loss of foreign exchange earnings. During lockdown, all the ports have been locked and huge inventory has piled up with the traders and farmers.
5. In the short term, millions of businesses have faced labour shortage due to reverse migration, lower incomes, and substantial unemployment.
6. In the medium term, COVID-19 impacts on business may be like past episodes of avian flu in Southeast Asia in the 2000s, which induced contraction in business, leading to the rise of large processing firms and supermarkets.
7. The current farm-gate price realizations will have influence on the cropping patterns for the next season. Moreover, farmers may diversify their cropping pattern towards spices and condiments as they are more in demand due to their medicinal value in boosting the immunity.
8. If the normalcy in the movement of goods is delayed further because of the pandemic, and subsequent lower price realizations, there will be a drastic change in the cropping pattern and thus leading to increase in the acreage under crops with medicinal properties of immunity booster.
3.5.1. Government Initiatives to Overcome the Problems Faced Due to COVID – 19
The government of India has launched various programmes to endorse a constructive environment for the growth of different sectors of economy, including agriculture. The centre has kept all agri related activities under exempted categories for the lockdown period and expanded them to include inland fisheries after allowing marine fishery operations to resume during different phases of lock down. Listed below are some of the initiatives undertaken by the government to overcome the problems faced during and post COVID – 19.
Initially the agricultural term and crop loans have been granted a moratorium of three months (March 01 till May 31, 2020) by banking institutions with 3 percent concession on the interest rate of crop loans up to INR 3,00,000 for borrowers with good repayment behaviour. In view of the extension of lockdown and continuing disruption on account of pandemic, all lending institutions were permitted to extend moratorium by another three months, i.e., up to August 31, 2020.
The Centre has advised states to issue ad hoc direct marketing licenses to corporates for facilitating their purchase of farmers’ produce at village levels, so that crowds at mandis are controlled in sync with the nationwide lockdown. This will help farmers sell their produce direct from farm gate without bothering for transportation and other logistic problems.
Agriculture ministry has raised daily purchase limit of oilseeds and pulses by amending Essential Commodities Act. This amendment in the Act applies few other commodities also.

25Working Paper on Coping with Covid-19-“Strategies for Agriculture Sector”
Amid extension of lockdown in different states due to the Covid-19 outbreak, the Small Farmers Agribusiness Consortium (SFAC), which is implementing the electronic National Agriculture Market (eNAM) project under the agriculture ministry, has added 415 mandis to the existing 585 mandis. This has taken the total number of eNAM mandis to 1,000 across 21 states and Union Territories, to enable the direct marketing of produce through farmer groups and cooperatives and helping farmers to get real-time payments.
The Centre has told states to allow farmers to sell their produce directly to consumers during the lockdown period to make sure that their earnings are not affected by restrictions of the APMC Act. This will help farmers sell their produce with the help of Farmer Producer Organizations (FPO) and cooperatives.
In this regard, GoI has passed three acts pertaining to “The Farmers (Empowerment and Protection) Agreement on Price Assurance and Farm Services Act, 2020,” the “Farming Produce Trade and Commerce (Promotion and Facilitation) Act, 2020” and the Essential Commodities (Amendment) Act, 2020,” which will pave the way for ‘One India, one agriculture market’. The acts aims to create an environment of barrier-free trade within and between states, and allows farmers to sell their produce to any buyer in the country, including on electronic platforms. The amendment to essential commodities Act now allows trader to stock enough and as a result, traders resort for bulk purchase resulting into demand for agricultural produce.
Three ordinances also paved way for farmers’ engagement with large processors and barrier-free agriculture trade, seeking to help them get remunerative price and attract private investment and modern technologies in the farming sector.
State governments were asked to give government-owned warehouses the status of mandi so that transactions can happen directly from there. The Niti Aayog has also recommended to transact from accredited warehouses to decongest mandis.” Accordingly, the state like Karnataka, Telangana, Madhya Pradesh etc. have amended their APMR Acts.
The Ministry of tribal affairs has increased the MSP of 49 Minor Forest Produce (MFP) by 16-66% to ensure more disposable income for tribals.
Launch of Kisan Rath mobile app especially for perishable commodities in order to connect farmers and traders to a network of more than 5 lakh trucks and 20,000 tractors, which aids in provision of timely transportation service at competitive rates for farmers and traders, besides achieving a reduction in food wastage”.
The Pradhan Mantri Garib Kalyan Yojana (PMGKY) relief package, announced to alleviate the distress of people most affected by the nationwide lockdown, might help whittle down some of the excess food grain stocks.
As a part of Atmanirbhar Bharat Abhiyan, stimulus package of Rs. 1 lakh crore to strengthen infrastructure in food processing, fisheries, animal husbandry, horticulture, herbal cultivation and beekeeping with a total funding of Rs. 50,000 crore, including funds allocated earlier in the budget.
Apart from various government initiatives, Krishi Vigyan Kendras (KVKs), a few Farmer Producer Companies promoted by various institutions like KVKs, agricultural and allied

26 Working Paper on Coping with Covid-19-“Strategies for Agriculture Sector”
departments, NGOs have taken different contingency measures to safe guard the farmers in their locality. The information compiled from various sources is explained as under.
i) WEFSA (water, earth, fire, sky and air) Farmers Producers Company in Perambalur district of Tamil Nadu state which started in the year 2014, decided to pursue organic farming right from the beginning and produces organic farm products including organic turmeric, jaggery, traditional paddy seeds etc. In order to help the farmers during COVID – 19, it has started mobile vending unit through which they procured vegetables directly from the farmers and sold them to the consumers at their door step. Through mobile vending unit, vegetables worth of ₹12.6 lakh have been sold till the mid of June, 2020. This has helped in sustaining the income of the farmers during the pandemic period.
ii) Mayyil Rice Producer Company (MRPC) in Kerala which has its focus on ensuring food security has launched a scheme to grow tapioca and sweet potato in every household to make every household in the Panchayat self-sufficient in food production. As a part of the scheme, during the lockdown the FPC which covers 8000 households in its panchayat has distributed planting materials of both tapioca to over 6,100 households and sweet potato cuttings to nearly 1,000 families.” This initiative will help the farmers in accessing alternative livelihoods.
iii) An initiative was taken by the producer companies of Tamil Nadu to sell the commodities at a very nominal price mainly to facilitate consumers, without thinking of the profits. Tiruchi Malaikottai Farmers Producers Company in Tiruchi district of Tamil Nadu purchased vegetables from its members and from wholesale dealers to make them available for the residents of Tiruchi city at their doorsteps. Further, Tamil Nadu Banana Growers FPC has sold banana at a price lower than the market price through mobile outlets in villages in the rural areas of Tiruchi and Namakkal districts with an intention to help banana growers reeling under a fall in the price of the fruit due to the lockdown. This initiative has helped the banana farmers who were severely affected due to lockdown.
Though, these commodities were sold at lower price to consumers, profit earnings of the farmers was not compromised. For this, the FPCs leveraged margin of profit being taken away by the middlemen by avoiding them in the channel.
iv) Hungund Horticulture Farmers Producer Company financially supported by Dept. of Horticulture, Govt. of Karnataka and technically supported by KVK Bagalkot, has procured banana, watermelon, grapes, onion, chilli, vegetables, papaya, lime and garlic from it’s members and non-members at the farm gate itself which relieved the pain of more than 1800 farmers of in and around villages. The produce including pulses, vegetables and fruits worth of 1.77 crores were purchased by the FPO and sold to ITC, SAFAL, MORE and Reliance Fresh. It also started an outlet at its office for retail marketing of fruits and sold more than 2 tons of fruits.
v) The farmer producer organizations promoted by M.S. Swaminathan Research Foundation in Tamil Nadu has helped the small farmers in overcoming the effects of Covid-19 by ensuring timely supply of pesticides, bio-inputs, pheromone traps etc., from the FPO’s store to the farmer members who were facing the pest menace in the fields. It’s a known fact that, harvesting and marketing of the produce is hampered during the lockdown. Besides, under such circumstances, the FPO helped farmers to get an approval from the department

27Working Paper on Coping with Covid-19-“Strategies for Agriculture Sector”
of agricultural marketing to use farm machinery for harvesting and transport vehicles for marketing of nearly 15 MT of maize with timely payment to farmers.
Furthermore, with the support of FPO, farmers have additionally sold a ½ kg ‘vegetable bag’ comprising a variety of vegetables to support families in the region for a week. In addition to this, the producer companies has stood as a backbone for the dairy farmers as they have a buy back arrangement with a private milk processor and hence even during this challenging period, the members were able to sell 3200 liters per day. Though the farmers received a 10 per cent less price than normal situation, the farmers were very happy as they could sell the produce without facing a distress situation.
vi) In Odisha, with the assistance of KVK Malkangiri, nearly 42 vegetable farmers collectively harvested the crops like pointed gourd, tomato, onion etc. and earned a remunerative price with gross return of Rs. 8.80 lakh.
vii) KVK Sirmour at Dhaulakuan of Himachal Pradesh has linked the strawberry farmers to Himachal Pradesh Horticulture Produce Marketing and Processing Corporation (HPMC). Around 40 to 50 strawberry farmers sold about 90 to 100 q strawberry to HPMC. Also the KVK has advised and assisted farmers in value addition aspects of strawberry like preparing pulp which was sold to HPMC and different factories for making jam, jelly and juices. If this could not have happened, the produce of farmers might have been left unsold.
viii) KVK, Uttarkashi, Uttarakhand provided timely advisories for marketing of summer squash. The farmers were linked to the local vendors/ vegetable sellers through various farmer organizations and NGOs working in the area. Through this initiative the farmers could earn an additional profit of Rs. 500 to 1000 per during lock down.
ix) An alternative marketing and supply chain connected by KVK Nanded-I, Maharashtra with the help of state agriculture department for the sale of turmeric, vegetables, watermelon and musk melon proved very effective. Many contact farmers of KVK Nanded-I were selling fresh vegetables and fruits to ‘Sachkhand Gurudwara Lungar’ through their farmers groups as well as supplied to the residents of various societies by adopting proper advisories given by central, state govt & district administration.
x) KVK, Beed, Maharashtra in coordination with different government departments put forth a frame work of marketing of fruits and vegetables adhering to all norms of lockdown. “The Market on Wheel” came into existence wherein the FPOs and farmers were given temporary licenses to sell their goods.
xi) Cooch behar KVK of West Bengal and Kisankarts Agro Management Private limited (Registered Start-up KISANKARTS.COM) jointly developed an online Farm-to-Home delivery model of fresh vegetables, fruits and other food grains KISANKARTS.COM has procured Green vegetables (5 t), Watermelon (90 t), Wheat (25 t), Pulses (10 t), Potato (70 t). Moreover, the Start-up has booked to procure field crops in advance viz., lentil (100 mt) worth of Rs. 53.5 lakh and maize (1000 mt) worth of Rs. 1.35 crore from the farmers of Cooch behar district.
xii) Agri-Input dealers, trained under the Diploma in Agricultural Extension Services for Input Dealers (DAESI) program by MANAGE, Hyderabad have played a key role in providing advisory and marketing support to farmers during the COVID-19 lockdown. A few input

28 Working Paper on Coping with Covid-19-“Strategies for Agriculture Sector”
dealers of Karnataka, in addition to the provision of advisories on crop and pest management during lockdown, took a step forward in purchasing the fruits like mango, pomegranate and vegetables like tomato, brinjal, onion etc., directly from the farmers in their locality. Moreover, some of the input dealers have helped in linking the farmers to potential buyers like Reliance Fresh, Ninja cart and Big Basket.
xiii) In addition to the above, the farmers have resorted to the option of using mobile phones and various IT platforms like what’s app, Zoom app, online classes for online advisories and consultations from extension personnel. The problems were understood with the help of photographs and video clips and online solutions were provided on all the problems related to crops and livestock. Few of them are listed below:
- KVK, Ranchi contacted Reliance foundation and assisted in organizing Audio Conferences with farmers of different remote areas of Ranchi district to sort out their problems.
- KVK East Singhbhum, Jharkhand started new what’s app group named “Unnat Krishi Abhiyan” to provide advisory and address the problems faced by farmers during lockdown.
- Online classes were delivered by way of facebook live by KVK Ernakulam of ICAR-CMFRI, Kerala to fish and poultry farmers. They also delivered 15,000 fish speed and 200 kg feed to 46 fish farmers during the lock down period.
- KVK Saraiya, Muzaffarpur, Bihar provided technical support through Agromet advisories to make farmers aware about weather forecast, field operation etc. this has helped in saving one to two irrigations in vegetable crop during lockdown.

29Working Paper on Coping with Covid-19-“Strategies for Agriculture Sector”
Way Forward
An innovative supply chain management approach is need of the hour to fight the disruption in supply chain on account of Covid-19. Other policy decisions are going to be taken by different countries across the globe like a more stringent entry and exit barrier between countries, change in trade policies between countries like USA and China which will have a global impact.
• Agribusiness companies must resort to efficient supply chain management practices to cope up with limitations of Covid-19.
• Governments will have to develop more policies to cope up with the adverse conditions to avoid supply chain disruptions, rise in food prices and automation in supply chain operations.
• On one hand, the strategy must emphasize on robust public health measures to slow down the spread of disease and on the other hand address food security through free distribution of food packages using either the surplus food grains available.
• In order to avoid human contact, automated machines should be introduced for various agricultural operations like the planting of seeds, weeding and other cultural operations.
• Including standardization and promotion of Indigenous Technology Knowledge (ITK) in agriculture, where techniques are dependent on local resources in dealing with nutrition, disease and pests.
• Branding of local farm products to be sold globally, the branding helps to tide over price spirals and making farmers quality-conscious. A branded quality product has the potential to increase India’s post Covid global export share.
30 Working Paper on Coping with Covid-19-“Strategies for Agriculture Sector”
References
• Cooper, M.C., Lambert, D.M. & Pagh, J.D. 1997. Supply chain management: more than a new name for logistics, International Journal of Logistics Management, 8, 1, 1-13.
• Gummagolmath, K.C. et al. 2020. Price instability of onion in India – An analysis. International Research Journal of Agricultural Economics and Statistics. 11(1), 2020. 1-11.
• http://agriexchange.apeda.gov.in/indexp/monthexport.aspx.
• https://apeda.gov.in/apedawebsite/about_apeda/Market_Intelligence_UpdateCOVID/ Market_Intelligence_COVID_April,2020.pdf.
• https://apeda.gov.in/apedawebsite/about_apeda/Market_Intelligence_UpdateCOVID/ APEDA_COVID_version_II.pdf.
• https://news.trust.org/profile/?id=003D000001BGCIeIAP.
• https://news.trust.org/item/20200506004633-2e99p.
• https://tigr2ess.globalfood.cam.ac.uk/news/farmer-producer-organisations-could-help-small-holder-farmers-overcome-effects-covid-19.
• https://www.aesanetwork.org/field-notes-11-input-dealers-support-farmers-during-the-covid-19-crisis.
• https://www.outlookindia.com/newsscroll/impact-of-covid19-pandemic-less-on exports-of-agricultural-goods-iopepc/1896782.
• https://www.thehindu.com/news/cities/Tiruchirapalli/fpo-launches-mobile-retail-sale-of-vegetables-banana/article31318561.ece.
• https://www.thehindu.com/sci-tech/agriculture/kerala-gives-a-push-to-tuber-cultivation-during-the-covid-19-lockdown/article31640355.ece.
• www.agmatknet.nic.in.
• www.nhrdf.org.
• www.statista.com.

