dr. jason ross - strategies to improve swine reproduction
TRANSCRIPT
Strategies to Improve Swine Reproduction
Jason W. Ross
Iowa State University
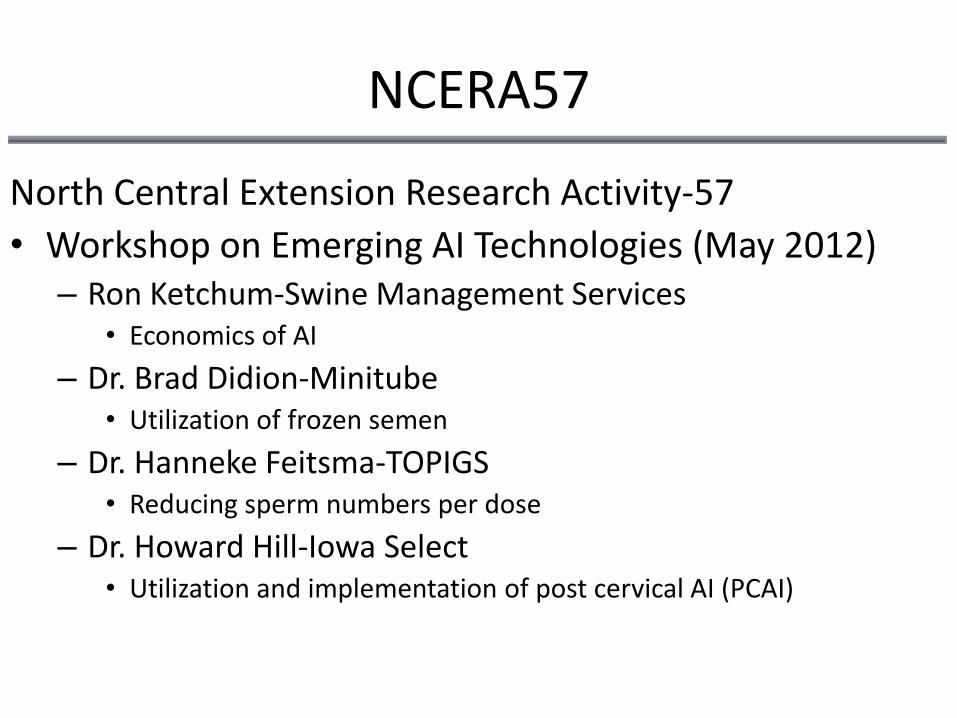
NCERA57
North Central Extension Research Activity-57
• Workshop on Emerging AI Technologies (May 2012)– Ron Ketchum-Swine Management Services
• Economics of AI
– Dr. Brad Didion-Minitube• Utilization of frozen semen
– Dr. Hanneke Feitsma-TOPIGS• Reducing sperm numbers per dose
– Dr. Howard Hill-Iowa Select• Utilization and implementation of post cervical AI (PCAI)
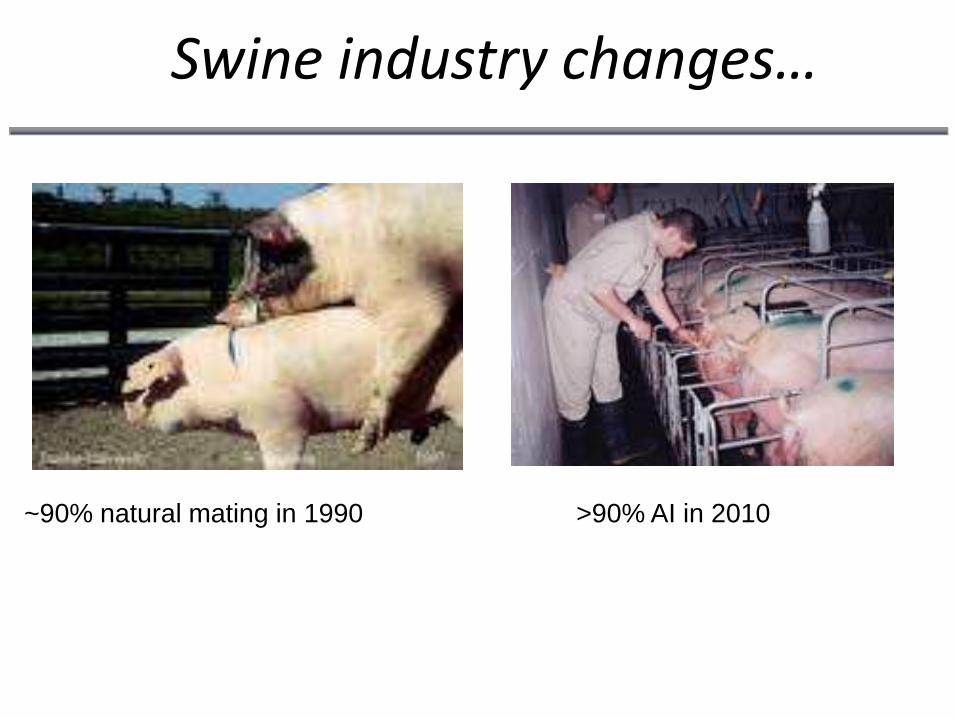
Swine industry changes…
~90% natural mating in 1990 >90% AI in 2010
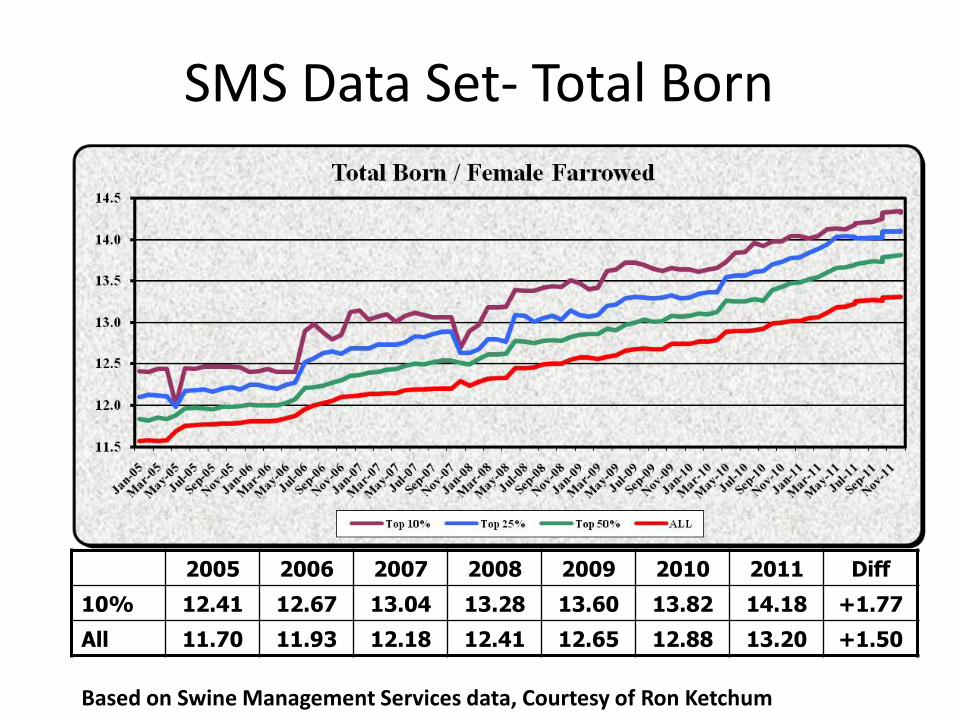
SMS Data Set- Total Born
2005 2006 2007 2008 2009 2010 2011 Diff
10% 12.41 12.67 13.04 13.28 13.60 13.82 14.18 +1.77
All 11.70 11.93 12.18 12.41 12.65 12.88 13.20 +1.50
Based on Swine Management Services data, Courtesy of Ron Ketchum
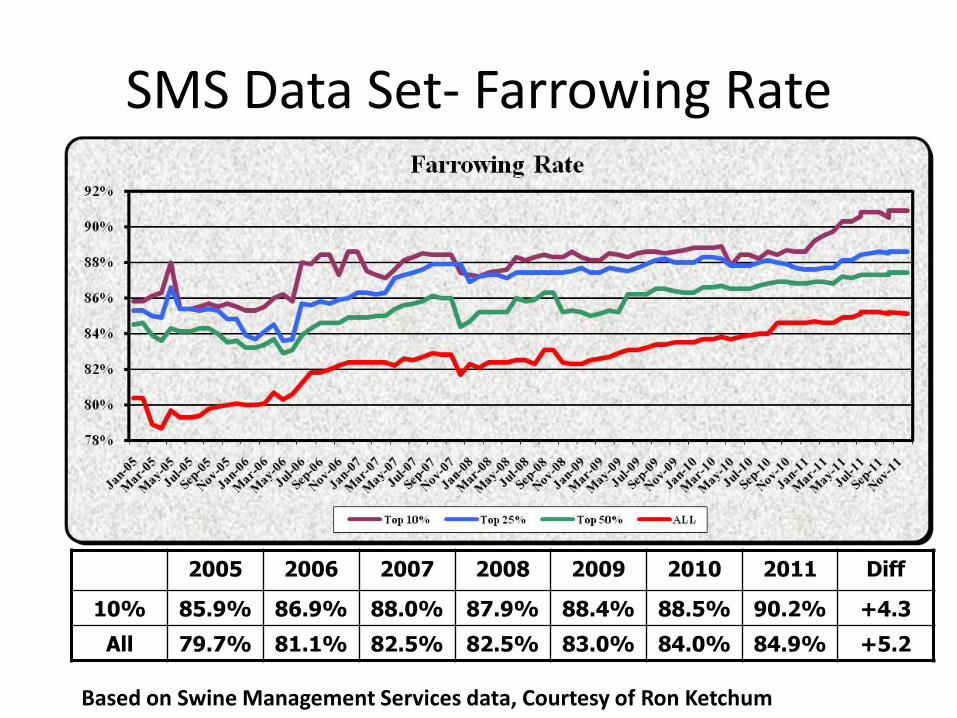
SMS Data Set- Farrowing Rate
2005 2006 2007 2008 2009 2010 2011 Diff
10% 85.9% 86.9% 88.0% 87.9% 88.4% 88.5% 90.2% +4.3
All 79.7% 81.1% 82.5% 82.5% 83.0% 84.0% 84.9% +5.2
Based on Swine Management Services data, Courtesy of Ron Ketchum
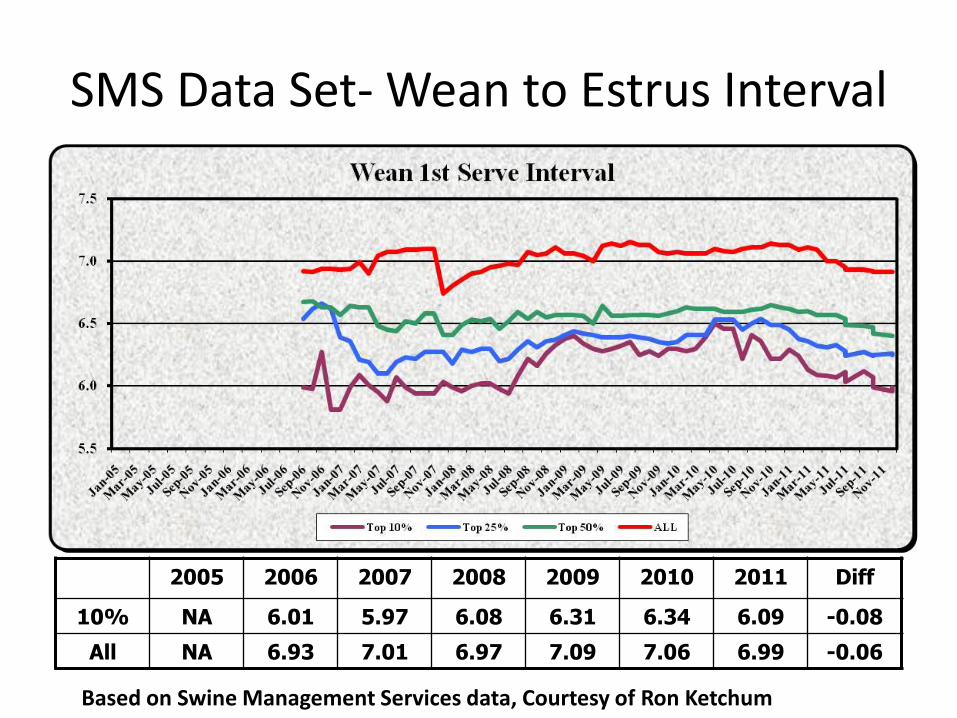
SMS Data Set- Wean to Estrus Interval
2005 2006 2007 2008 2009 2010 2011 Diff
10% NA 6.01 5.97 6.08 6.31 6.34 6.09 -0.08
All NA 6.93 7.01 6.97 7.09 7.06 6.99 -0.06
Based on Swine Management Services data, Courtesy of Ron Ketchum
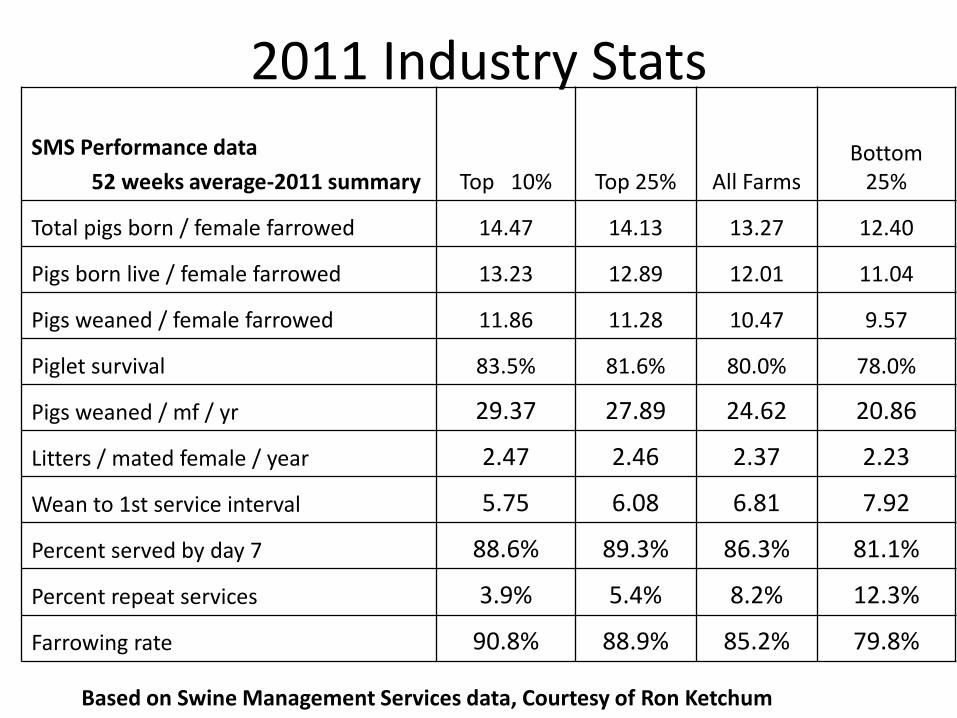
2011 Industry Stats
SMS Performance data
52 weeks average-2011 summary Top 10% Top 25% All FarmsBottom
25%
Total pigs born / female farrowed 14.47 14.13 13.27 12.40
Pigs born live / female farrowed 13.23 12.89 12.01 11.04
Pigs weaned / female farrowed 11.86 11.28 10.47 9.57
Piglet survival 83.5% 81.6% 80.0% 78.0%
Pigs weaned / mf / yr 29.37 27.89 24.62 20.86
Litters / mated female / year 2.47 2.46 2.37 2.23
Wean to 1st service interval 5.75 6.08 6.81 7.92
Percent served by day 7 88.6% 89.3% 86.3% 81.1%
Percent repeat services 3.9% 5.4% 8.2% 12.3%
Farrowing rate 90.8% 88.9% 85.2% 79.8%
Based on Swine Management Services data, Courtesy of Ron Ketchum
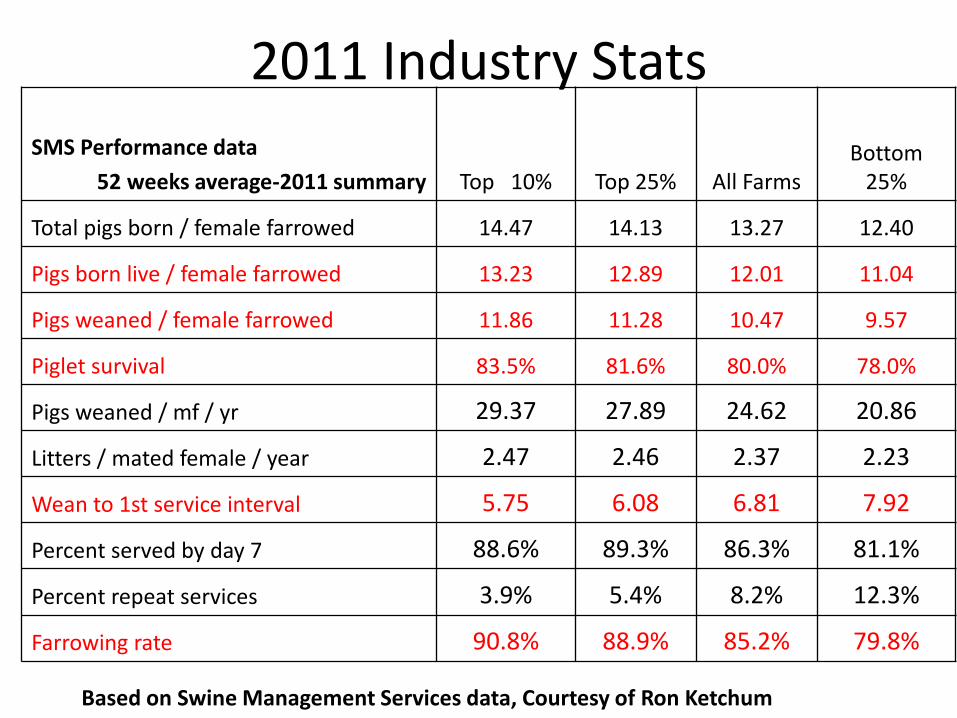
2011 Industry Stats
SMS Performance data
52 weeks average-2011 summary Top 10% Top 25% All FarmsBottom
25%
Total pigs born / female farrowed 14.47 14.13 13.27 12.40
Pigs born live / female farrowed 13.23 12.89 12.01 11.04
Pigs weaned / female farrowed 11.86 11.28 10.47 9.57
Piglet survival 83.5% 81.6% 80.0% 78.0%
Pigs weaned / mf / yr 29.37 27.89 24.62 20.86
Litters / mated female / year 2.47 2.46 2.37 2.23
Wean to 1st service interval 5.75 6.08 6.81 7.92
Percent served by day 7 88.6% 89.3% 86.3% 81.1%
Percent repeat services 3.9% 5.4% 8.2% 12.3%
Farrowing rate 90.8% 88.9% 85.2% 79.8%
Based on Swine Management Services data, Courtesy of Ron Ketchum
TOPIGS Research Center IPG
“How low can you go?”
Hanneke Feitsma, manager R&D
0.0
0.5
1.0
1.5
2.0
2.5
3.0
3.5
4.0
1975 1980 1985 1990 1995 2000 2005 2010 2015
Year
No
. m
oti
le s
pe
rm/d
ose
(b
illi
on
s)
10
12
14
16
18
20
22
24
26
28
30
We
an
ed
pig
lets
/so
w/y
ea
r
Check
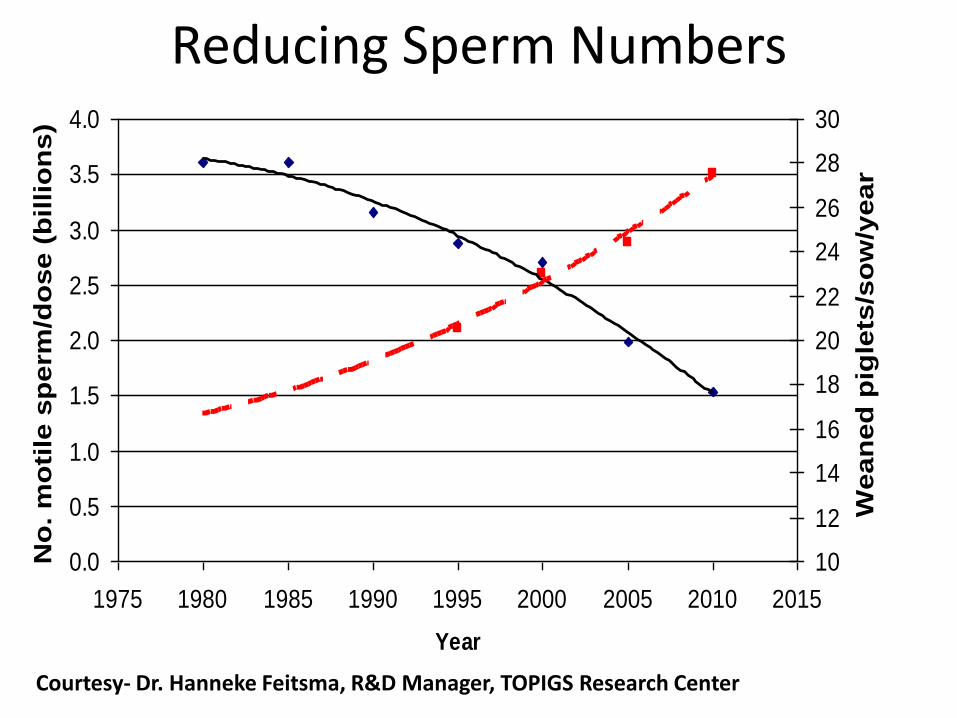
Courtesy- Dr. Hanneke Feitsma, R&D Manager, TOPIGS Research Center
Reducing Sperm Numbers
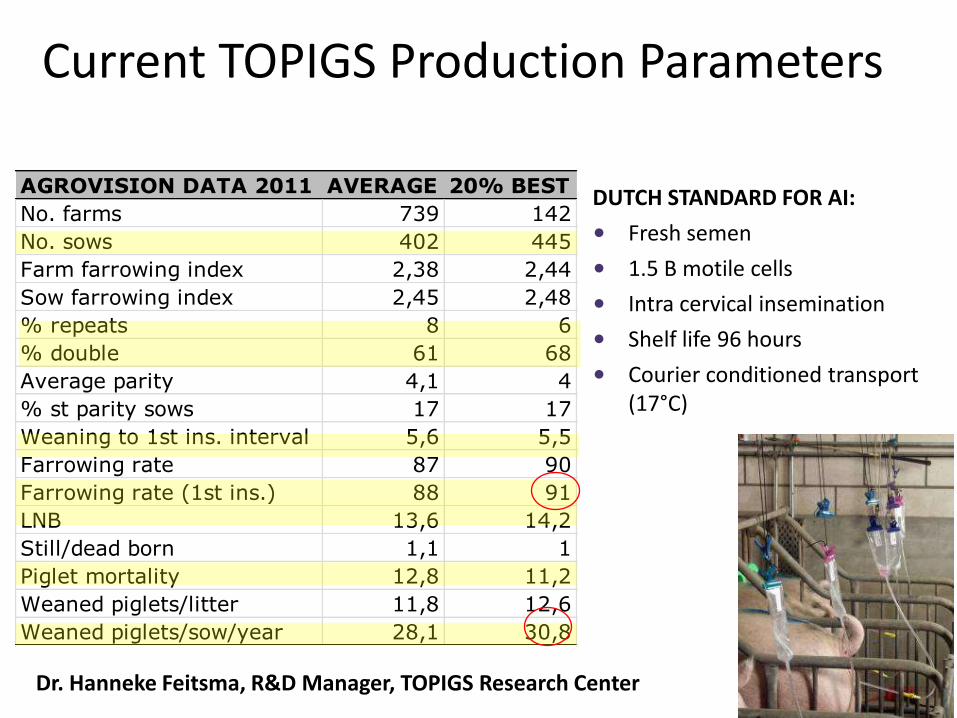
Current TOPIGS Production Parameters
AGROVISION DATA 2011 AVERAGE 20% BEST
No. farms 739 142
No. sows 402 445
Farm farrowing index 2,38 2,44
Sow farrowing index 2,45 2,48
% repeats 8 6
% double 61 68
Average parity 4,1 4
% st parity sows 17 17
Weaning to 1st ins. interval 5,6 5,5
Farrowing rate 87 90
Farrowing rate (1st ins.) 88 91
LNB 13,6 14,2
Still/dead born 1,1 1
Piglet mortality 12,8 11,2
Weaned piglets/litter 11,8 12,6
Weaned piglets/sow/year 28,1 30,8
DUTCH STANDARD FOR AI:
• Fresh semen
• 1.5 B motile cells
• Intra cervical insemination
• Shelf life 96 hours
• Courier conditioned transport (17°C)
Dr. Hanneke Feitsma, R&D Manager, TOPIGS Research Center
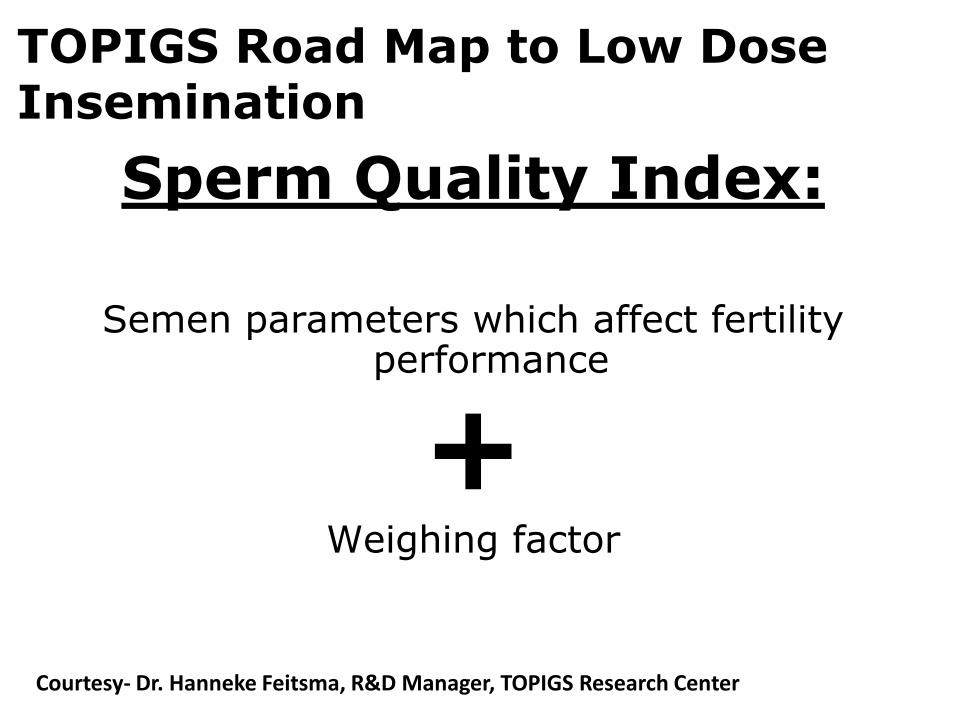
Sperm Quality Index:
Semen parameters which affect fertility performance
+Weighing factor
TOPIGS Road Map to Low Dose Insemination
Courtesy- Dr. Hanneke Feitsma, R&D Manager, TOPIGS Research Center
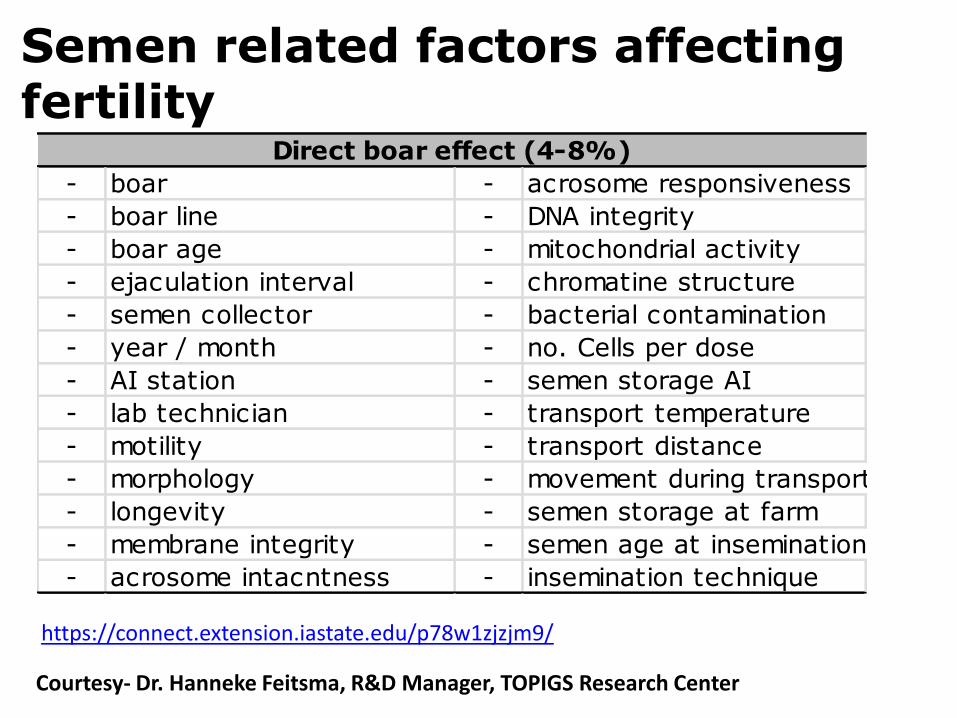
Semen related factors affecting fertility
- boar - acrosome responsiveness
- boar line - DNA integrity
- boar age - mitochondrial activity
- ejaculation interval - chromatine structure
- semen collector - bacterial contamination
- year / month - no. Cells per dose
- AI station - semen storage AI
- lab technician - transport temperature
- motility - transport distance
- morphology - movement during transport
- longevity - semen storage at farm
- membrane integrity - semen age at insemination
- acrosome intacntness - insemination technique
Direct boar effect (4-8%)
Courtesy- Dr. Hanneke Feitsma, R&D Manager, TOPIGS Research Center
https://connect.extension.iastate.edu/p78w1zjzjm9/
-
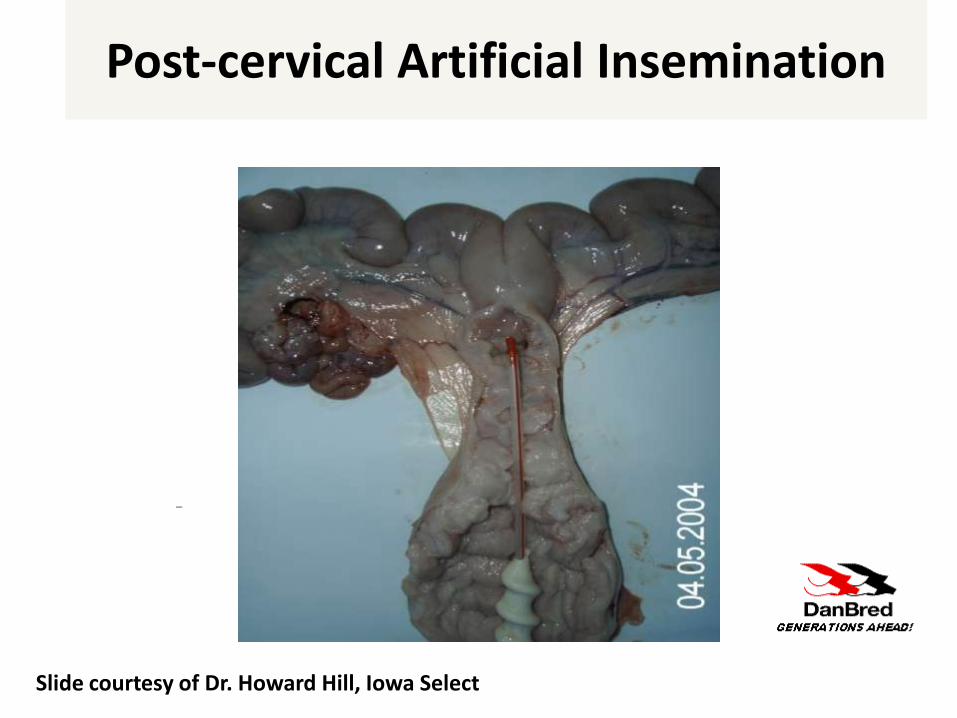
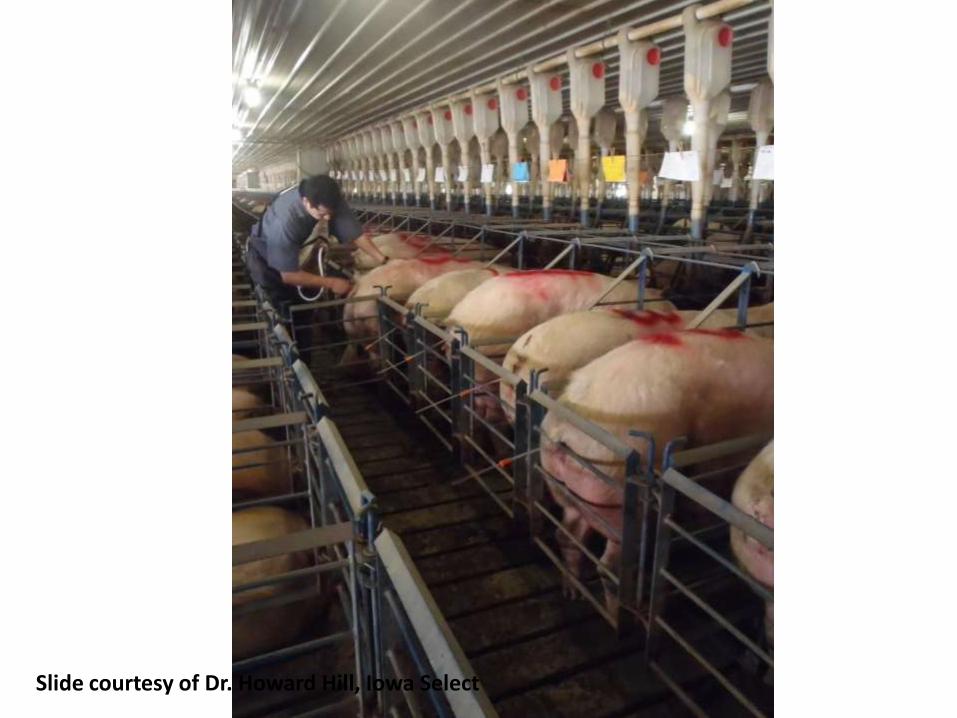
Post-cervical Artificial Insemination
Slide courtesy of Dr. Howard Hill, Iowa Select
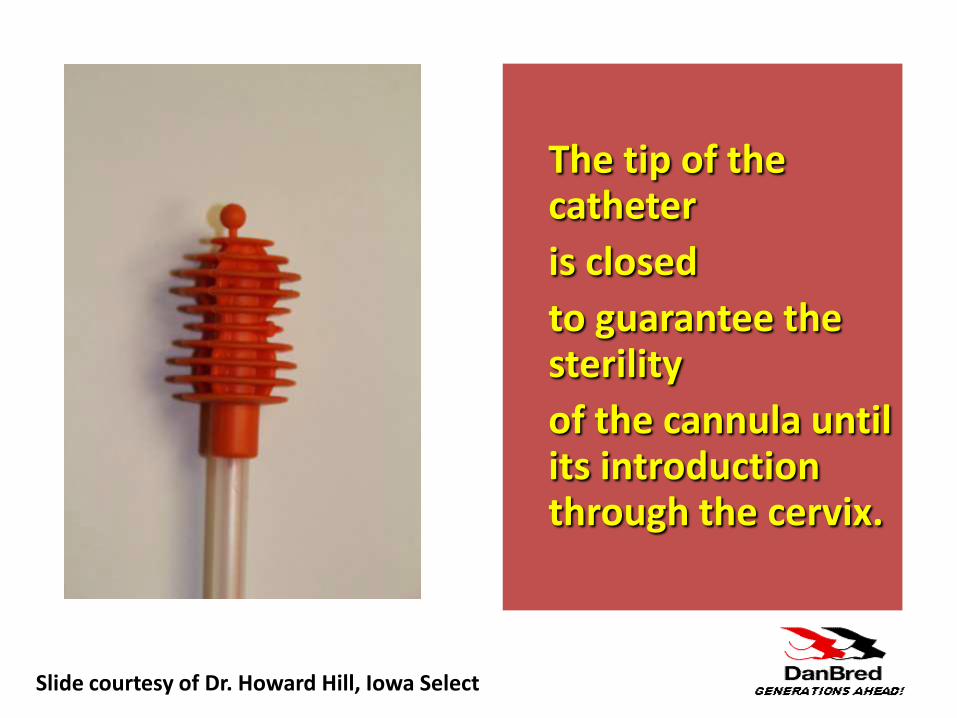
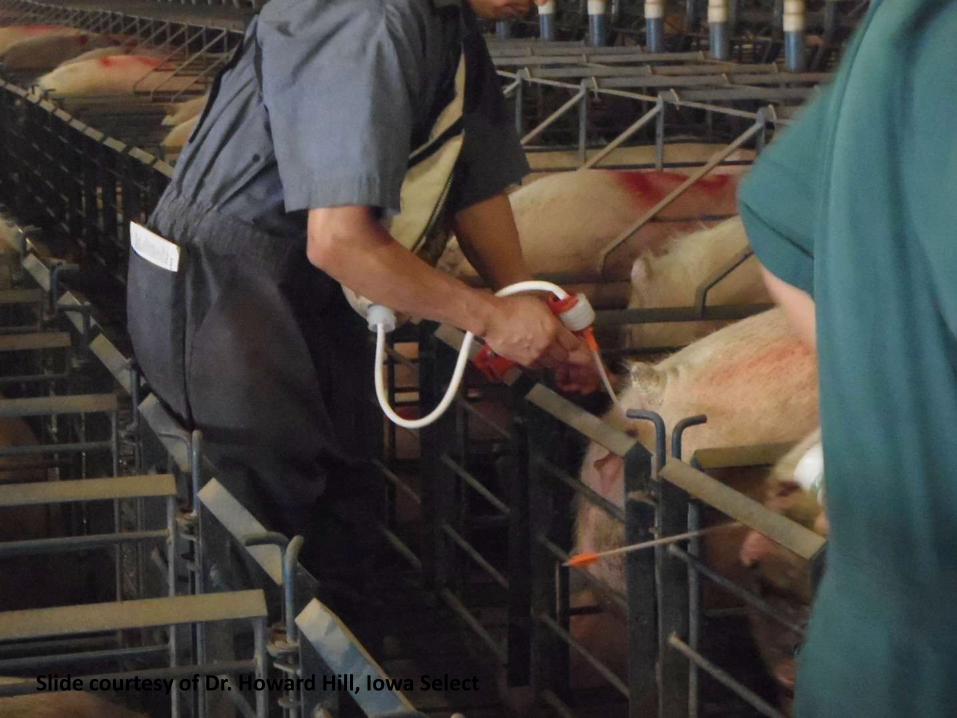
The tip of the catheter
is closed
to guarantee the sterility
of the cannula until its introduction through the cervix.
Slide courtesy of Dr. Howard Hill, Iowa Select
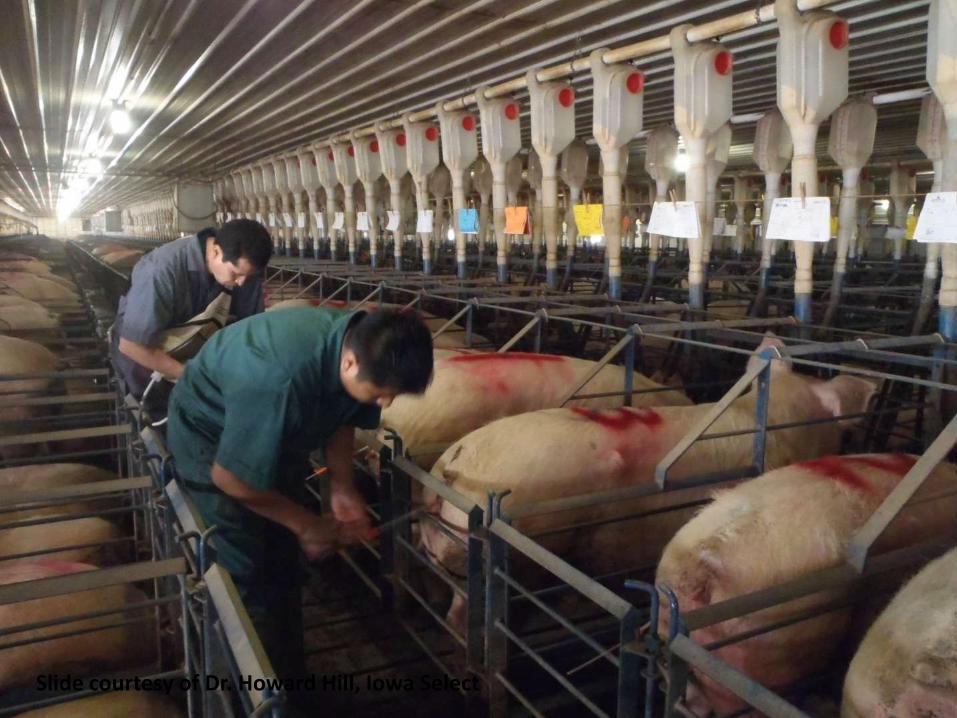
Slide courtesy of Dr. Howard Hill, Iowa Select
Slide courtesy of Dr. Howard Hill, Iowa Select
Slide courtesy of Dr. Howard Hill, Iowa Select
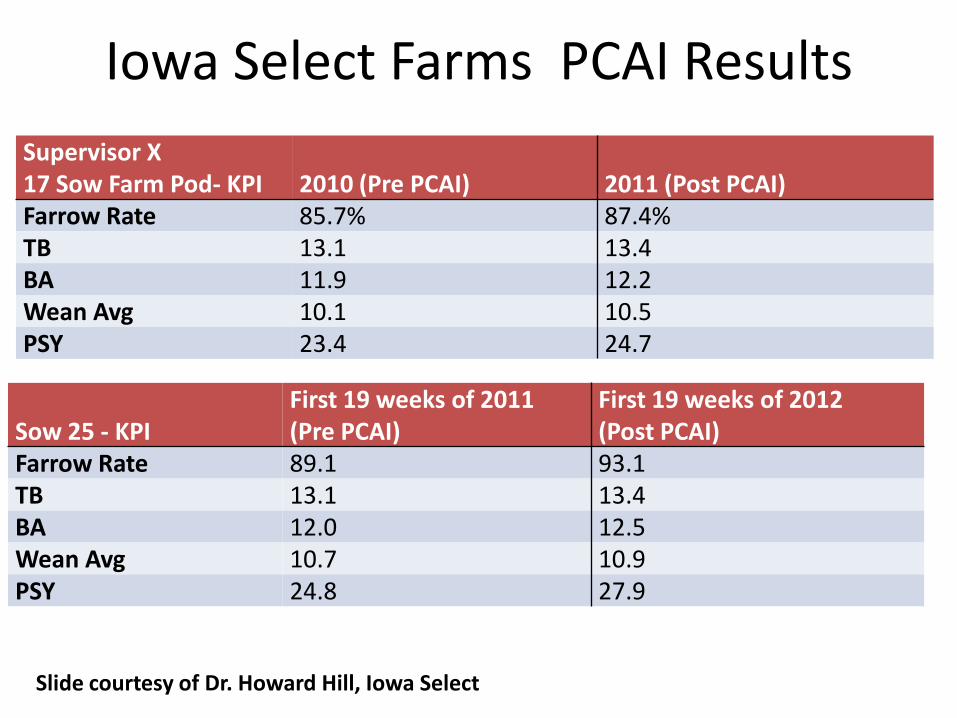
Iowa Select Farms PCAI Results
Supervisor X 17 Sow Farm Pod- KPI 2010 (Pre PCAI) 2011 (Post PCAI)Farrow Rate 85.7% 87.4%TB 13.1 13.4BA 11.9 12.2Wean Avg 10.1 10.5PSY 23.4 24.7
Sow 25 - KPIFirst 19 weeks of 2011(Pre PCAI)
First 19 weeks of 2012(Post PCAI)
Farrow Rate 89.1 93.1TB 13.1 13.4BA 12.0 12.5Wean Avg 10.7 10.9PSY 24.8 27.9
Slide courtesy of Dr. Howard Hill, Iowa Select
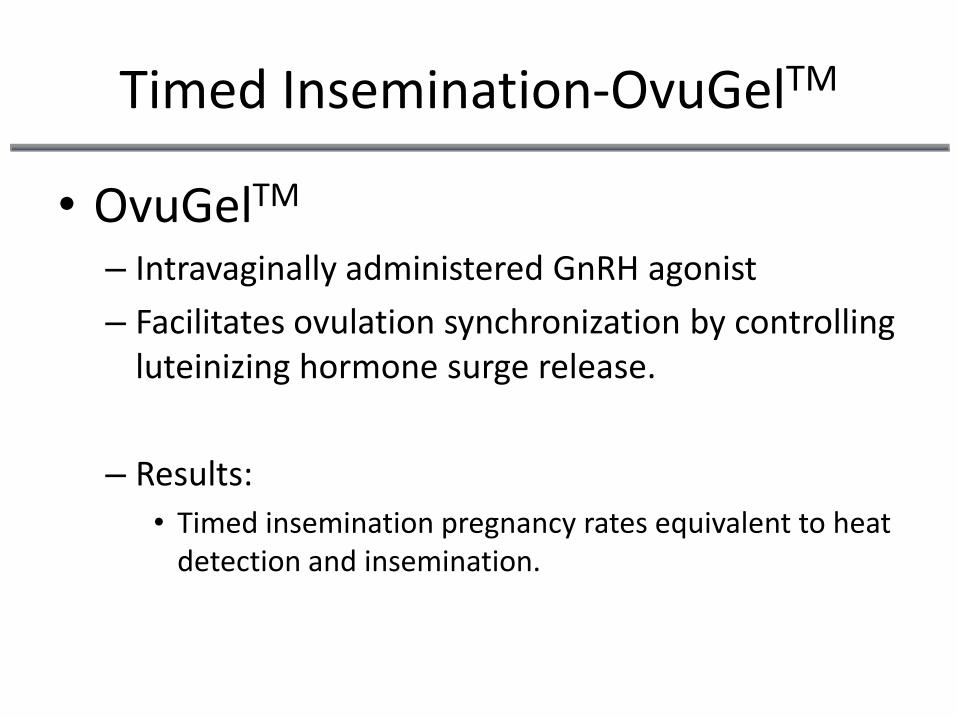
Timed Insemination-OvuGelTM
• OvuGelTM
– Intravaginally administered GnRH agonist
– Facilitates ovulation synchronization by controlling luteinizing hormone surge release.
– Results:
• Timed insemination pregnancy rates equivalent to heat detection and insemination.
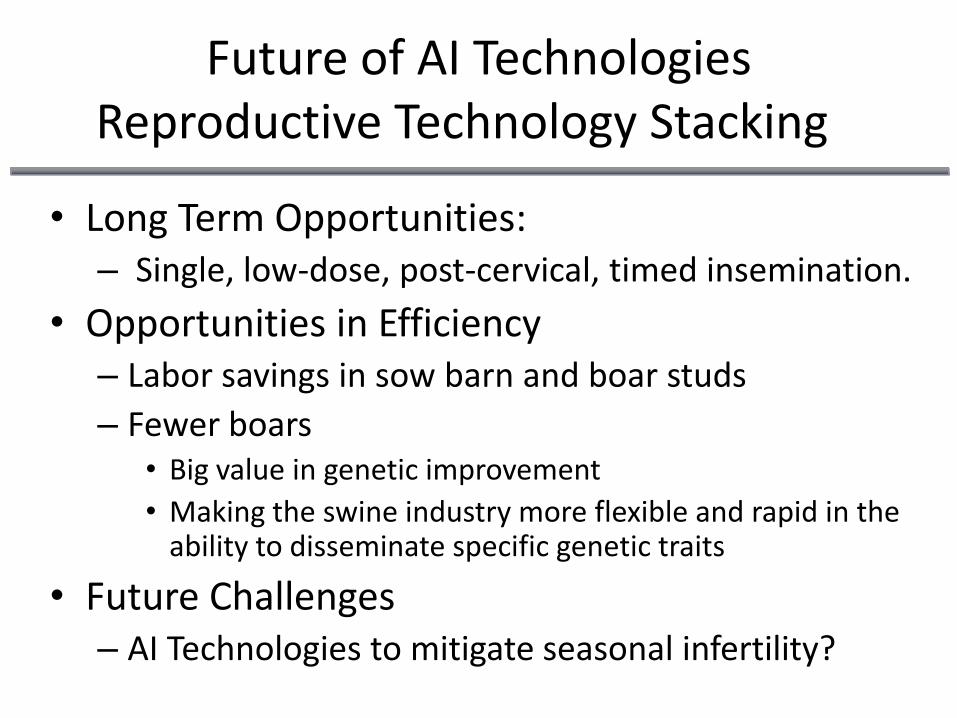
Future of AI TechnologiesReproductive Technology Stacking
• Long Term Opportunities:– Single, low-dose, post-cervical, timed insemination.
• Opportunities in Efficiency– Labor savings in sow barn and boar studs
– Fewer boars• Big value in genetic improvement
• Making the swine industry more flexible and rapid in the ability to disseminate specific genetic traits
• Future Challenges– AI Technologies to mitigate seasonal infertility?

Take Home Message on AI Technologies
• Reasons for implementing?– Unlikely to improve on good FR, TNB, and NBA
– You can decrease costs (Boar costs and Labor)
• Savings in labor can be invested in areas where improvements are feasible – Weaned pigs percentage (day 1-2 piglet care)
• Implementation– Implement incrementally
– Make decisions and adjustments based on data and performance
Identification of measures predictive of age at first puberty
Kody L. Graves, Bethany Mordhorst, Nicole Oldfather, Elane C. Wright, Benjamin Hale, Aileen F. Keating,
Ken Stalder, Jason W. Ross
What is the importance of age of first puberty?
• Impacts the profitability of a swine enterprise.
• Gilts that demonstrate puberty early have less non-productive days than those that demonstrate first estrus late.
• Age at first puberty is an indicators of lifetime productivity.
• Lifetime productivity lacks heritability and can be influenced by environment.
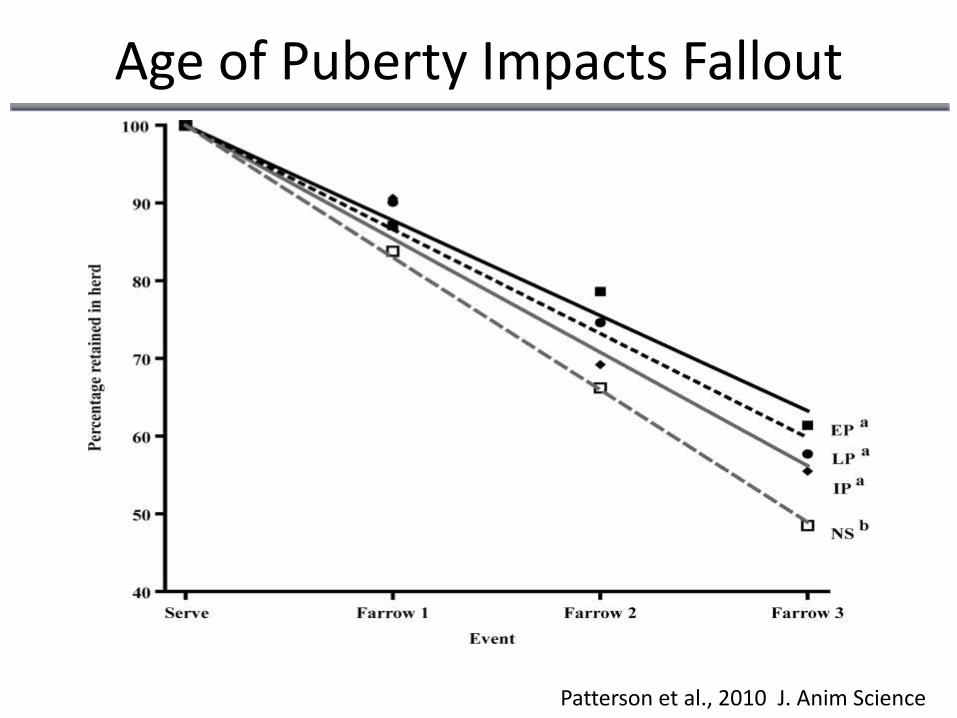
Age of Puberty Impacts Fallout
Patterson et al., 2010 J. Anim Science
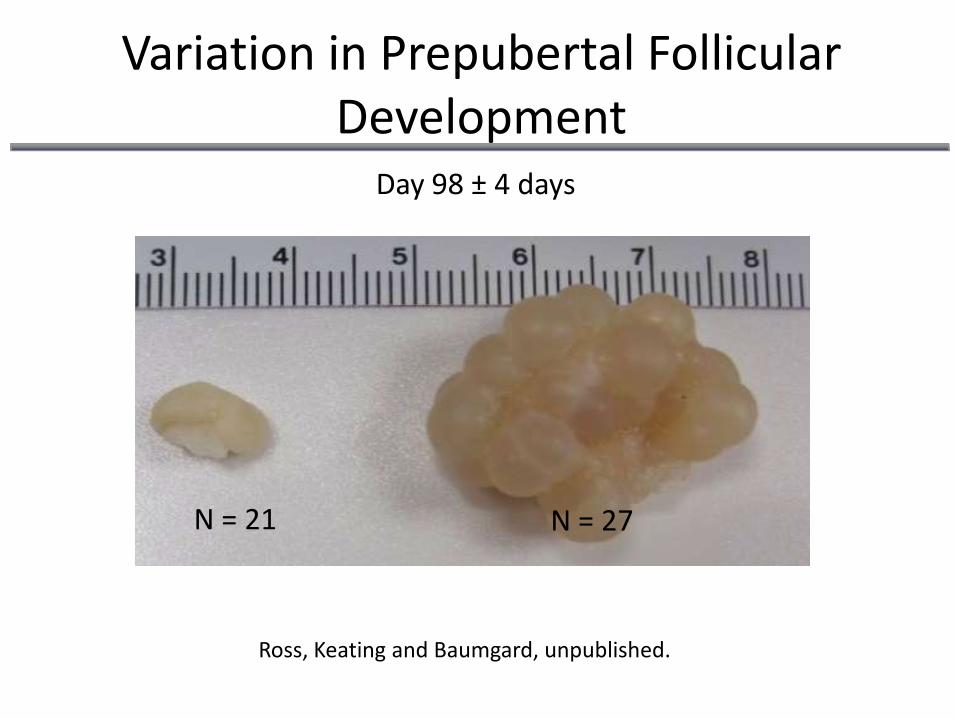
Variation in Prepubertal Follicular Development
Day 98 ± 4 days
N = 21 N = 27
Ross, Keating and Baumgard, unpublished.
Hypothesis
• Gilts that demonstrate follicular activity earliest will achieve puberty earliest. Additionally, these gilts will be phenotypically distinct in at least one physiological parameter.

Objectives
• To identify a specific time when a cohort of gilts demonstrate variability with regard to follicular development.
• To determine the feasibility measuring parameters related to follicular development during prepubertal development.– Vulva development– Serum estradiol– Body weight
• To determine if those factors have a relationship with age of puberty.
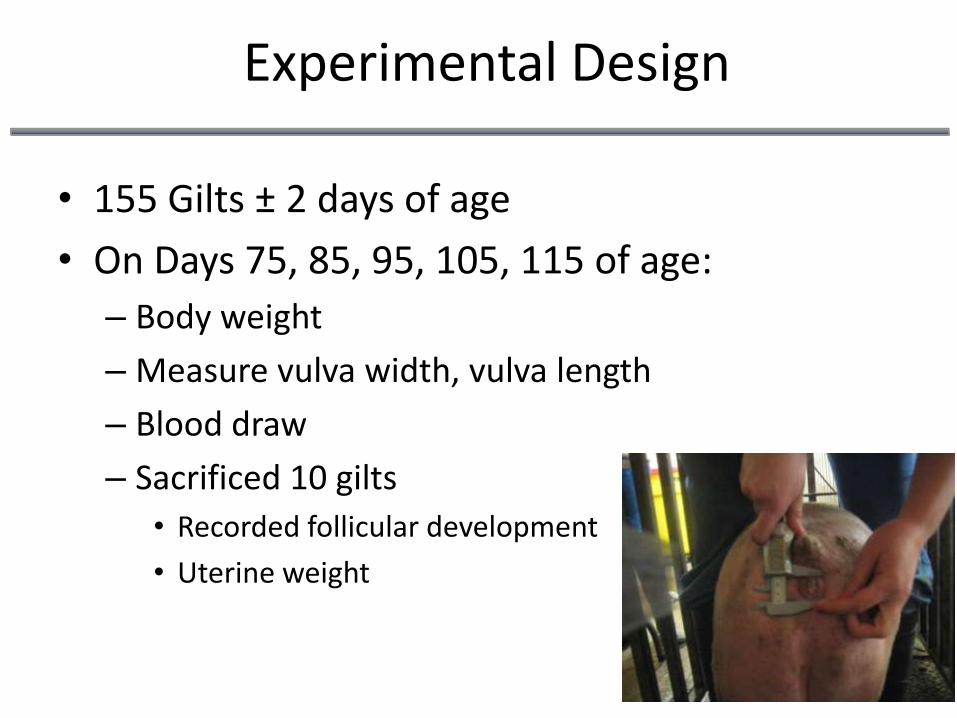
Experimental Design
• 155 Gilts ± 2 days of age
• On Days 75, 85, 95, 105, 115 of age:
– Body weight
– Measure vulva width, vulva length
– Blood draw
– Sacrificed 10 gilts
• Recorded follicular development
• Uterine weight
Experimental Design
• Remaining 105 Gilts
– Heat checked daily
– Beginning at 129 days of age
– Ending at 200 days of age
• Determine association between phenotypes on days 75, 85, 95, 105, and 115 and age of first estrus.
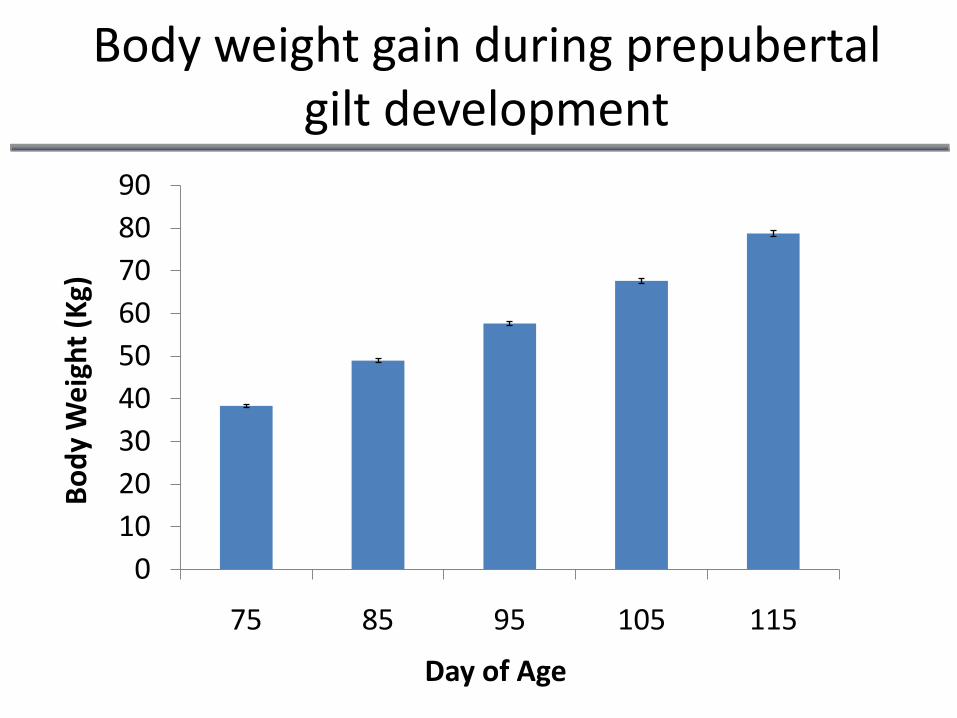
Body weight gain during prepubertal gilt development
0
10
20
30
40
50
60
70
80
90
75 85 95 105 115
Bo
dy
We
igh
t (K
g)
Day of Age
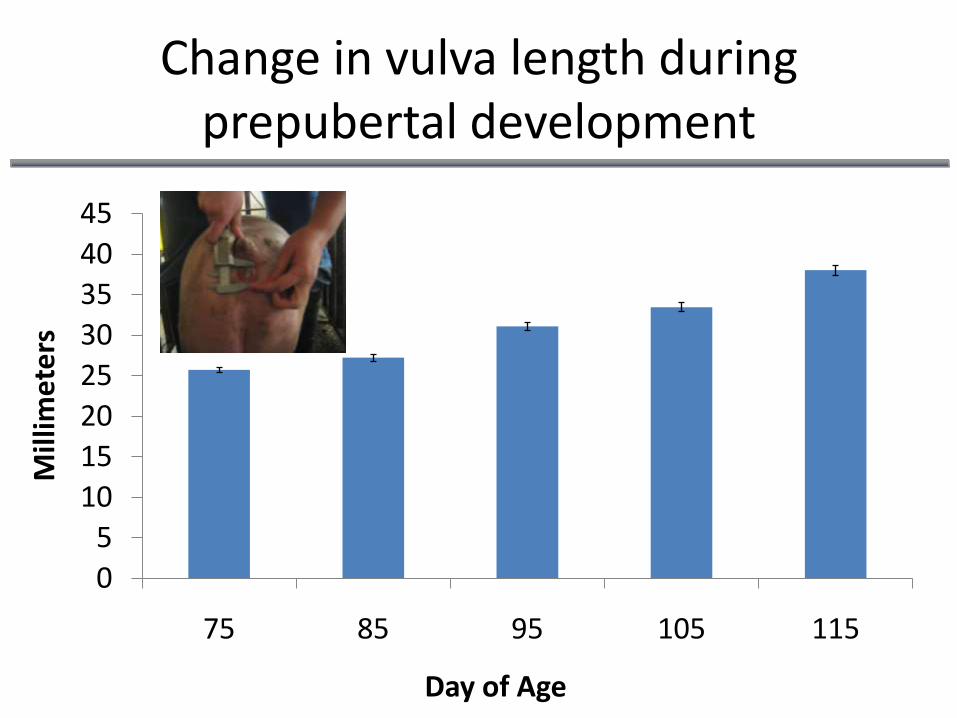
Change in vulva length during prepubertal development
0
5
10
15
20
25
30
35
40
45
75 85 95 105 115
Day of Age
Mill
ime
ters
0
5
10
15
20
25
30
35
40
75 85 95 105 115
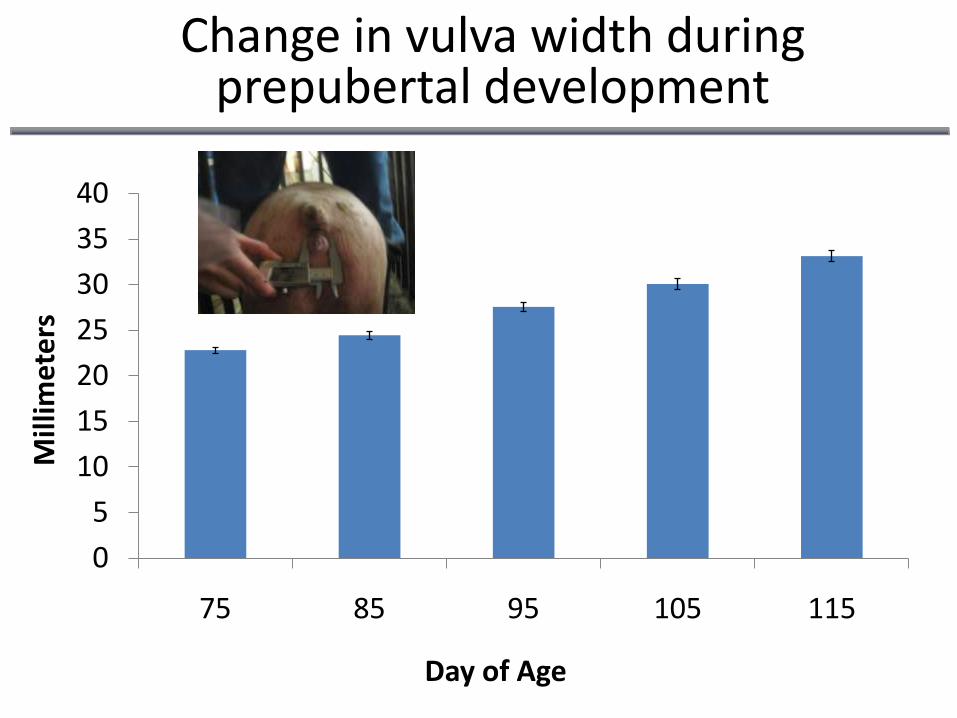
Change in vulva width during prepubertal development
Day of Age
Mill
ime
ters
0
200
400
600
800
1000
1200
1400
75 85 95 105 115Day of Age
Mill
ime
ters
2
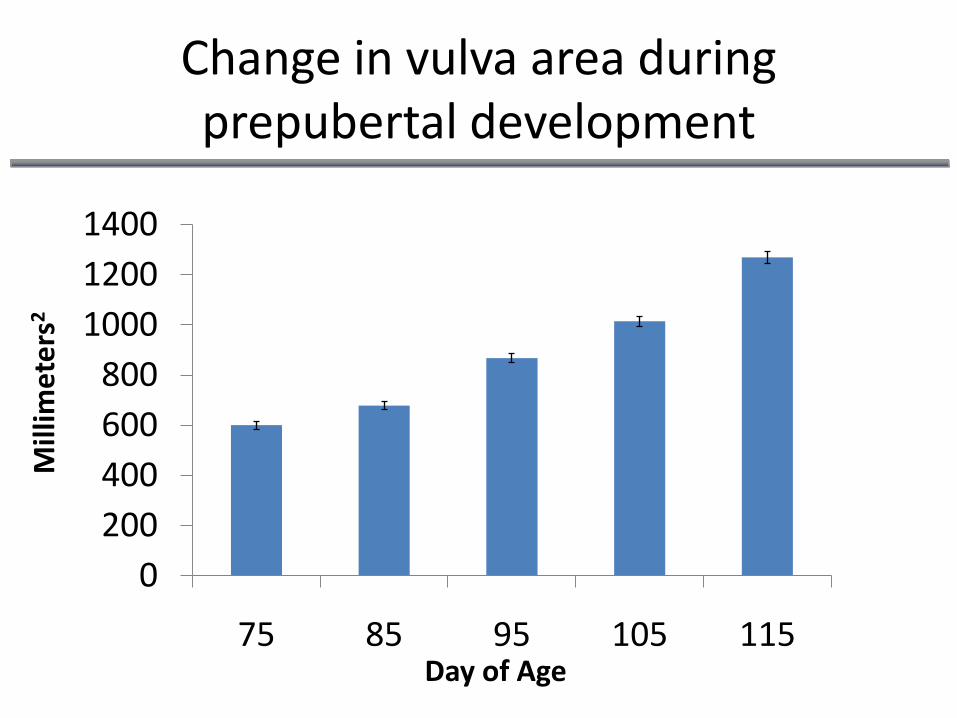
Change in vulva area during prepubertal development
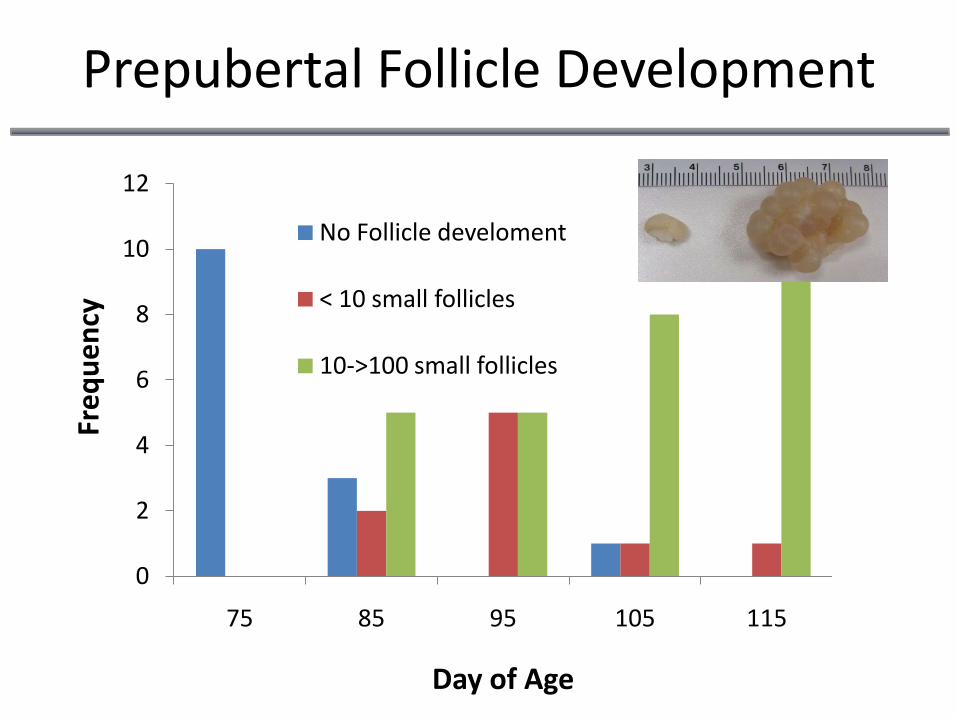
Prepubertal Follicle Development
0
2
4
6
8
10
12
75 85 95 105 115
No Follicle develoment
< 10 small follicles
10->100 small follicles
Fre
qu
en
cy
Day of Age

Uterine Weight of Gilts Sacrificed during Prepubertal Development
0
10
20
30
40
50
60
70
80
75 85 95 105 115
ab
bc
c
d
dDay Effect P < 0.001
Ute
rin
e W
eig
ht
(gra
ms)
Day of Age
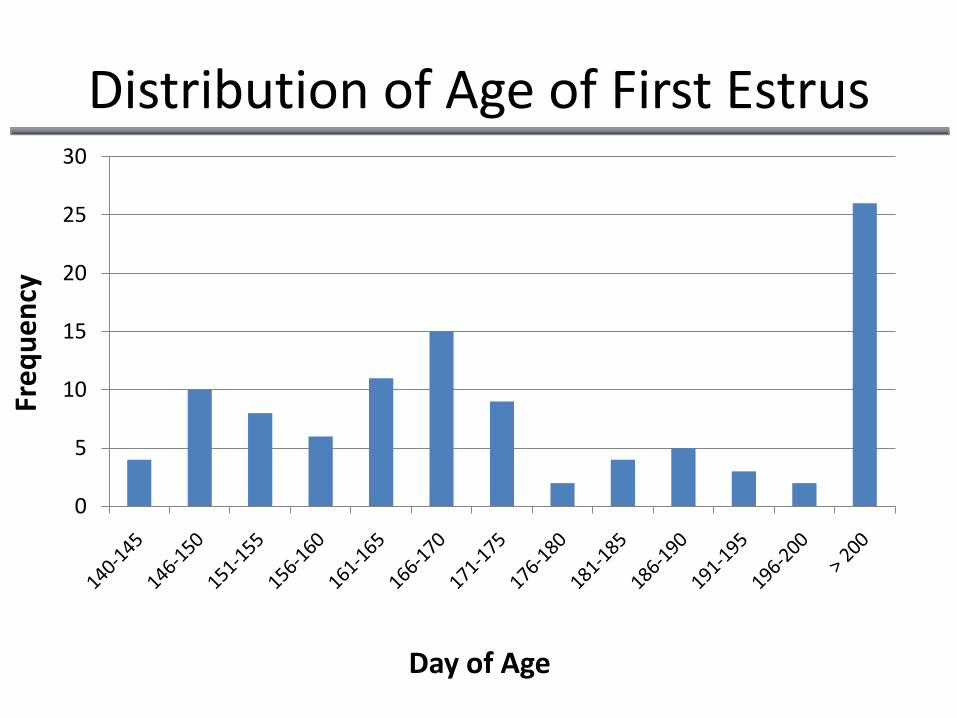
Distribution of Age of First Estrus
0
5
10
15
20
25
30
Day of Age
Fre
qu
en
cy
0
10
20
30
40
50
60
70
80
90
75 85 95 105 115
Estrus
No Estrus
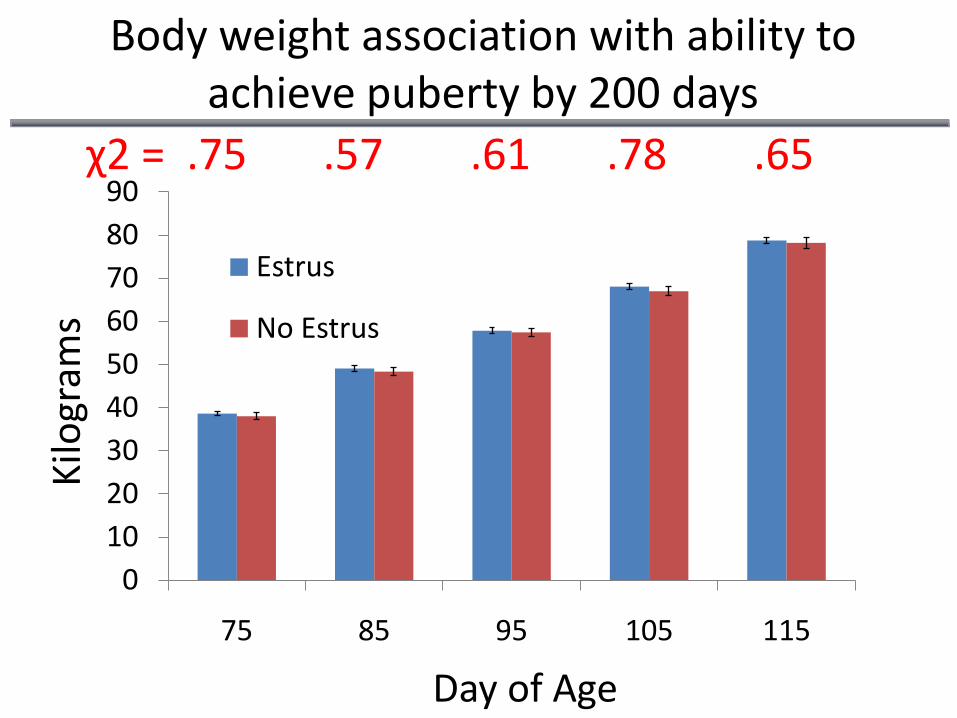
χ2 = .75 .57 .61 .78 .65
Body weight association with ability to achieve puberty by 200 days
Kilo
gram
s
Day of Age
25
30
35
40
45
50
55
135 155 175 195
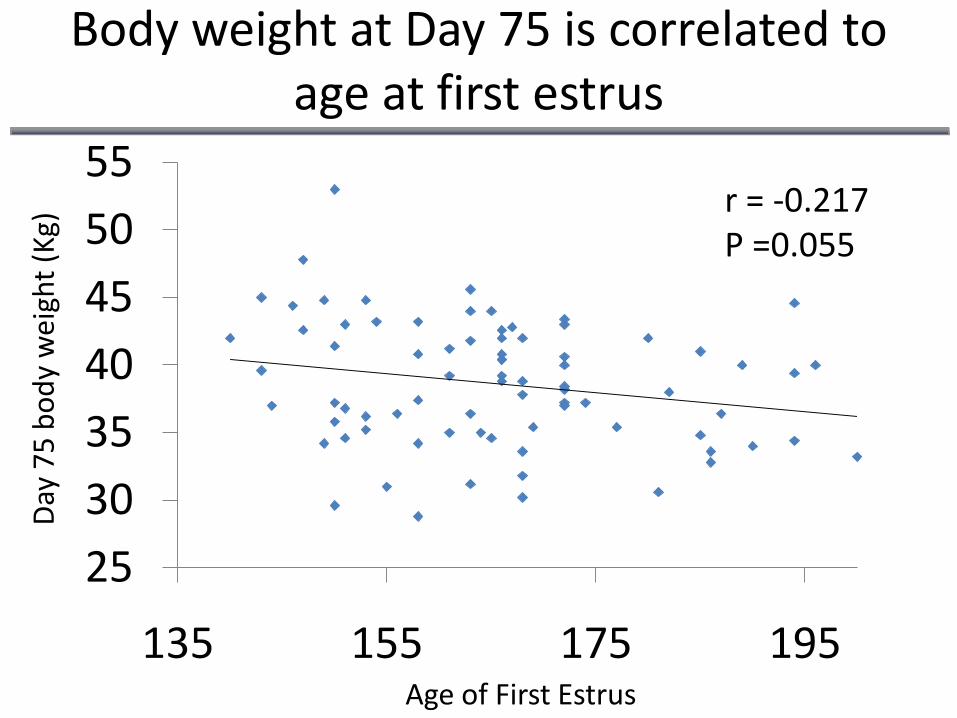
r = -0.217P =0.055
Body weight at Day 75 is correlated to age at first estrus
Day
75
bo
dy
wei
ght
(Kg)
Age of First Estrus
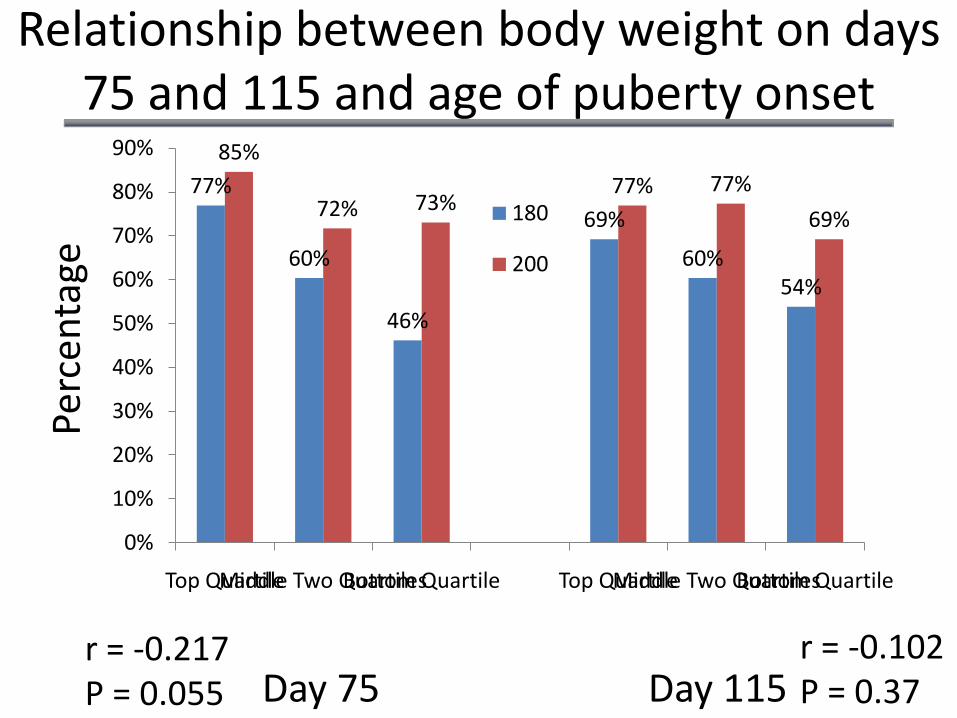
77%
60%
46%
69%
60%54%
85%
72% 73%77% 77%
69%
0%
10%
20%
30%
40%
50%
60%
70%
80%
90%
Top QuartileMiddle Two QuartilesBottom Quartile Top QuartileMiddle Two QuartilesBottom Quartile
180
200
Relationship between body weight on days 75 and 115 and age of puberty onset
Day 75 Day 115
Perc
enta
ge
r = -0.217P = 0.055
r = -0.102P = 0.37
0
10
20
30
40
50
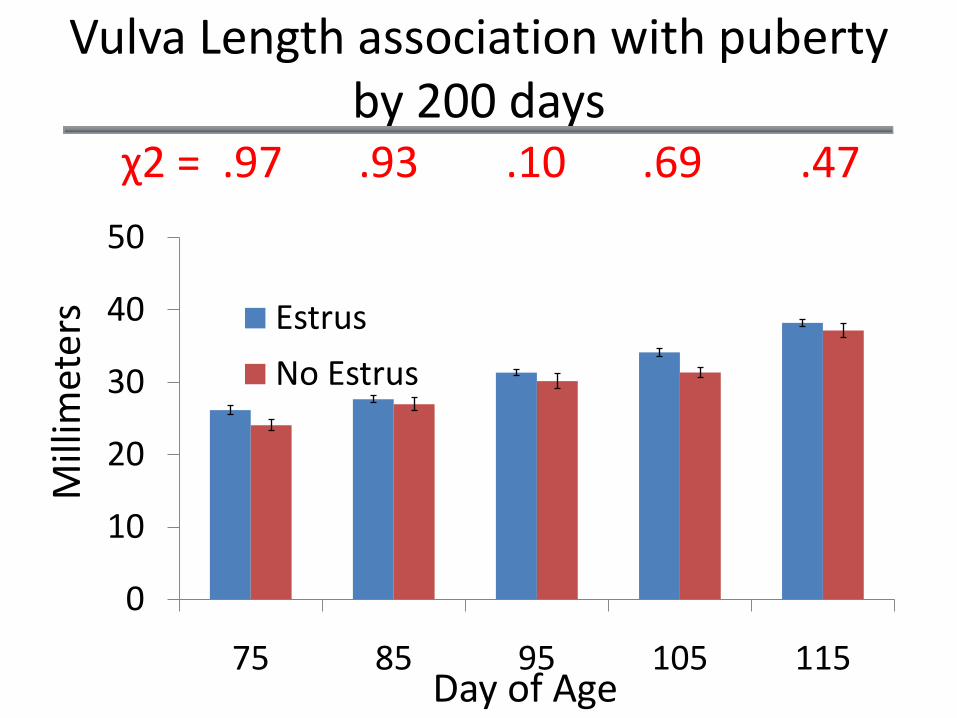
75 85 95 105 115
Estrus
No Estrus
Vulva Length association with puberty by 200 days
χ2 = .97 .93 .10 .69 .47
Mill
imet
ers
Day of Age
0
5
10
15
20
25
30
35
40
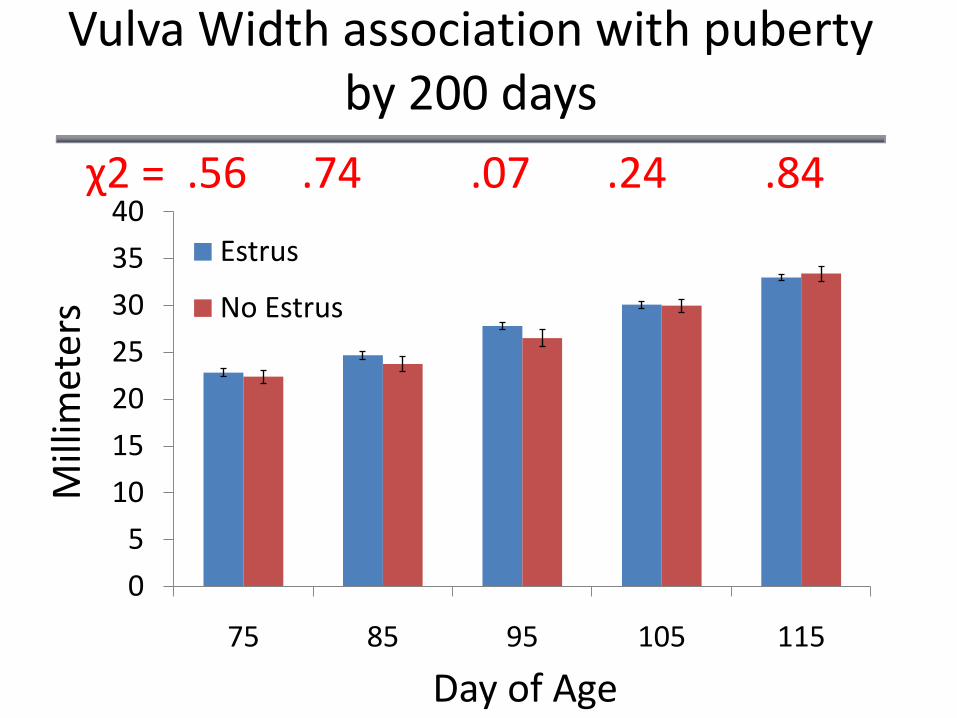
75 85 95 105 115
Estrus
No Estrus
Vulva Width association with puberty by 200 days
χ2 = .56 .74 .07 .24 .84
Mill
imet
ers
Day of Age
20
25
30
35
40
45
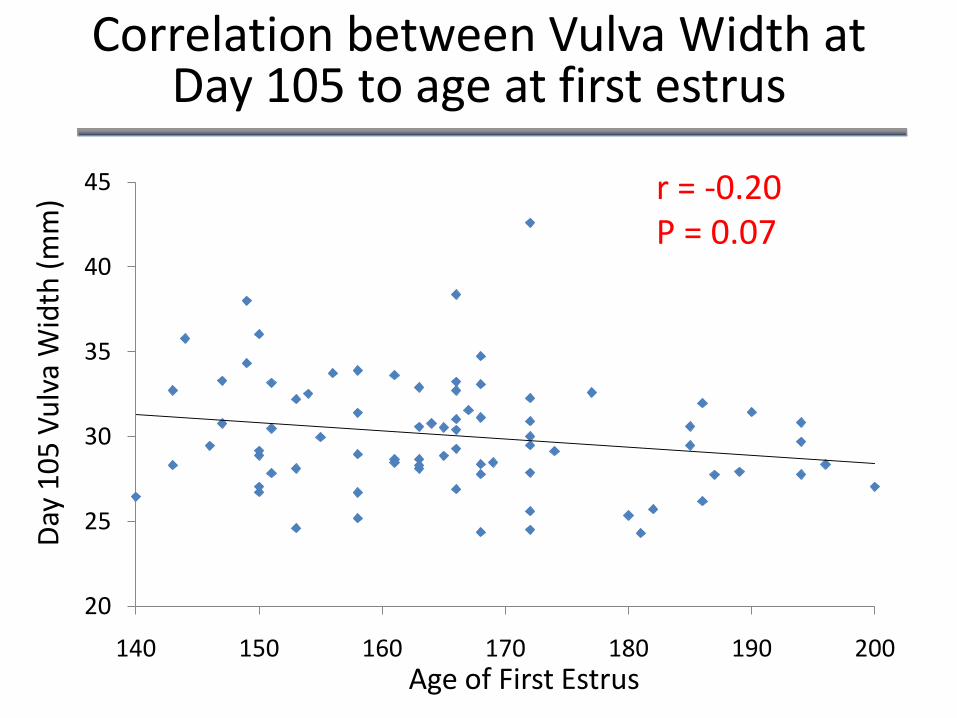
140 150 160 170 180 190 200
r = -0.20P = 0.07
Correlation between Vulva Width at Day 105 to age at first estrus
Age of First Estrus
Day
10
5 V
ulv
a W
idth
(m
m)
20
25
30
35
40
45
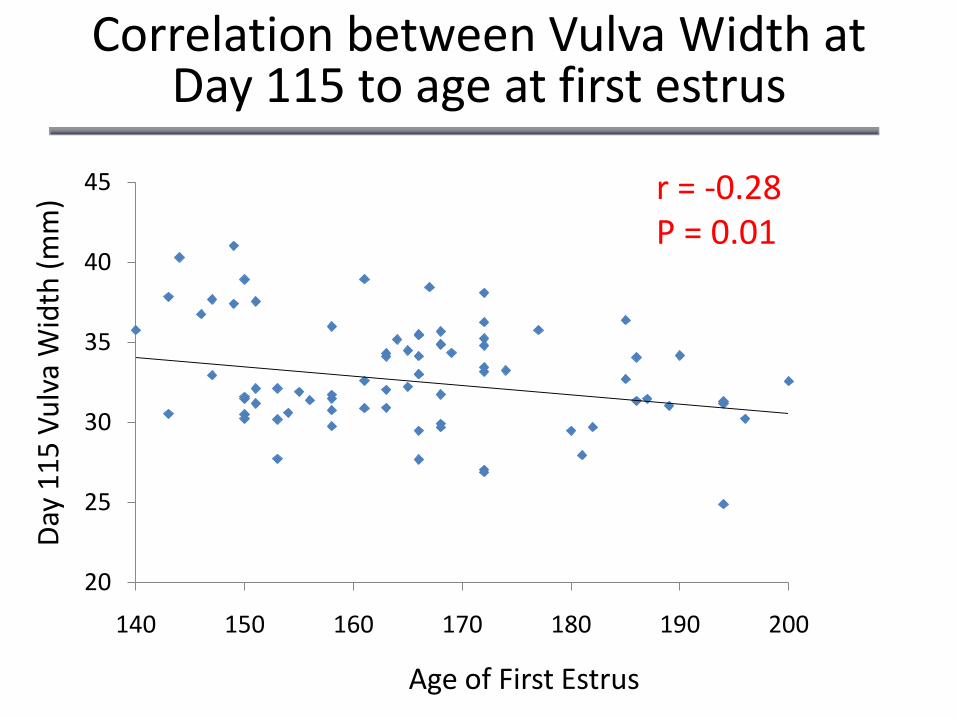
140 150 160 170 180 190 200
r = -0.28P = 0.01
Correlation between Vulva Width at Day 115 to age at first estrus
Age of First Estrus
Day
11
5 V
ulv
a W
idth
(m
m)
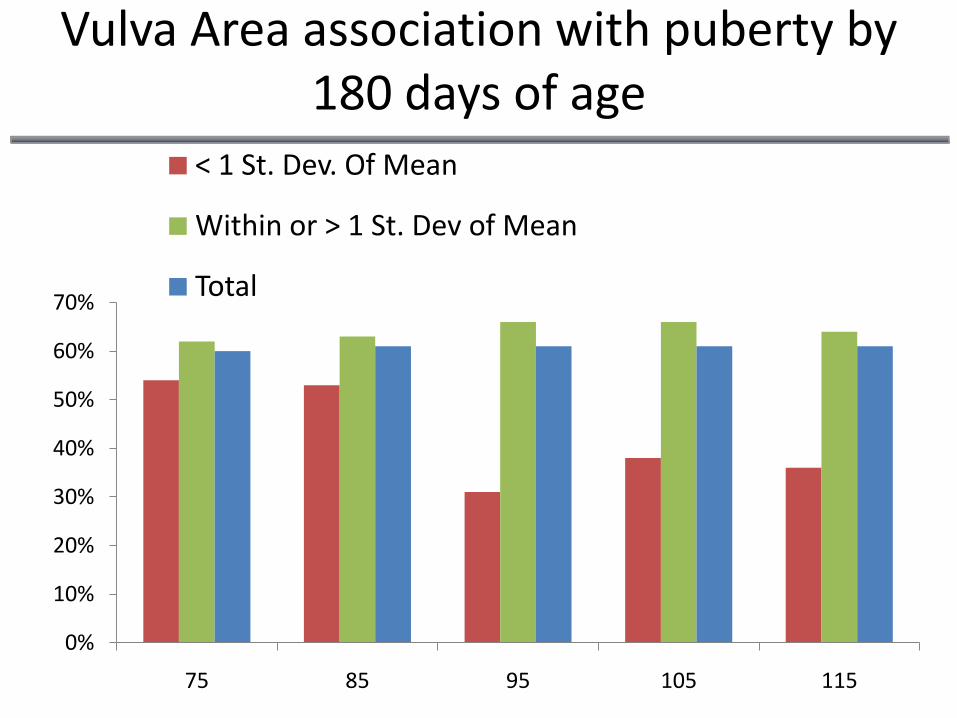
0%
10%
20%
30%
40%
50%
60%
70%
75 85 95 105 115
< 1 St. Dev. Of Mean
Within or > 1 St. Dev of Mean
Total
Vulva Area association with puberty by 180 days of age
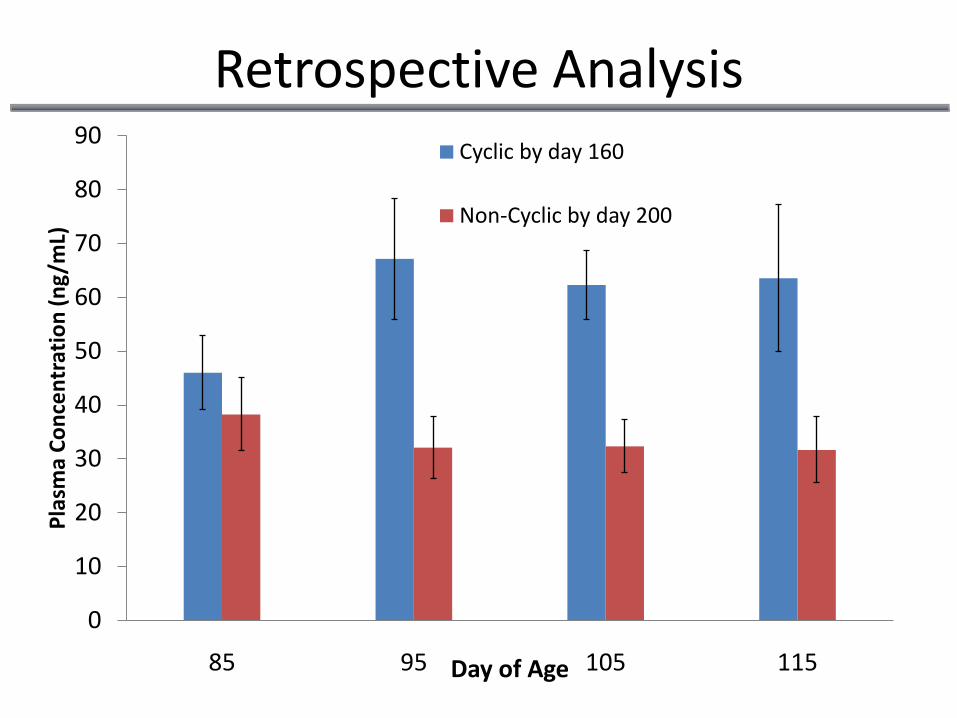
Retrospective Analysis
0
10
20
30
40
50
60
70
80
90
85 95 105 115
Pla
sma
Co
nce
ntr
atio
n (
ng/
mL)
Day of Age
Cyclic by day 160
Non-Cyclic by day 200
Summary and Implications
• These data demonstrate an association between vulva development on day 95 and ability to achieve puberty by 200 days.
• Of those animals that achieved puberty by 200 days:– body weight at day 75 and vulva width at days 105 and 115
were significantly correlated to age at first estrus.
• These developmental time-points represent specific days in age that observations can be made to distinguish gilts with high and low probability of achieving puberty by 200 days of age.
Questions?
Dr. Hanneke Feitsma Talk: https://connect.extension.iastate.edu/p78w1zjzjm9/
Jason Ross Contact: [email protected]