dr.-ing. farshad firouzi - mvise.de · kafka mqtt rabbitmq activemq tibco enterprise message...
TRANSCRIPT

Dr.-Ing. Farshad FirouziSr. Technical Manger for Artificial Intelligence
Mobile: +49 171 4434886
Email: [email protected]
Artificial Intelligence Driven Maintenance:From Device, Edge, To Cloud

2
An unreliable machine results in waste of time, money, and very bad impression
© Dr.-Ing. Farshad Firouzi

3
and unfortunately sometimes so many lives
© Dr.-Ing. Farshad Firouzi

4
That is why, we preventively keep maintaining ALL PARTS!!! Considering the fact that we cannot forecast which part will fail in future!
© Dr.-Ing. Farshad Firouzi
5
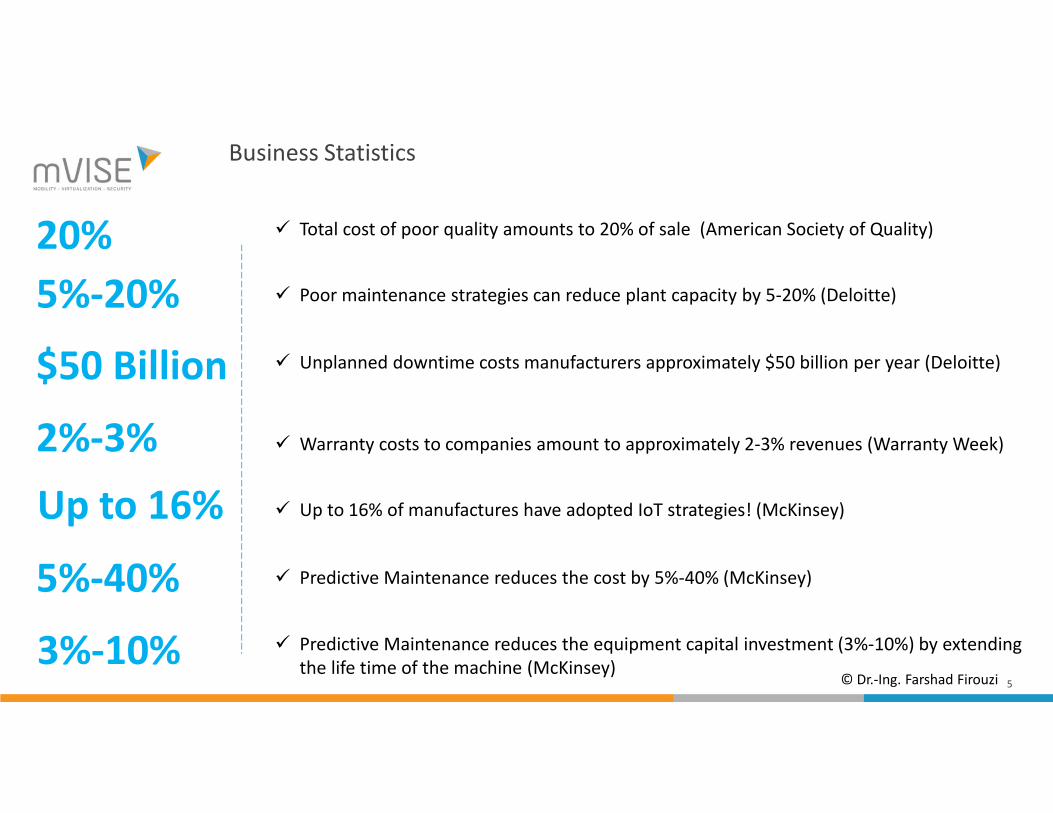
Business Statistics
20% Total cost of poor quality amounts to 20% of sale (American Society of Quality)
5%-20%
$50 Billion
2%-3%
Poor maintenance strategies can reduce plant capacity by 5-20% (Deloitte)
Unplanned downtime costs manufacturers approximately $50 billion per year (Deloitte)
Warranty costs to companies amount to approximately 2-3% revenues (Warranty Week)
Up to 16% of manufactures have adopted IoT strategies! (McKinsey)Up to 16%
5%-40% Predictive Maintenance reduces the cost by 5%-40% (McKinsey)
3%-10% Predictive Maintenance reduces the equipment capital investment (3%-10%) by extending the life time of the machine (McKinsey)
© Dr.-Ing. Farshad Firouzi
6
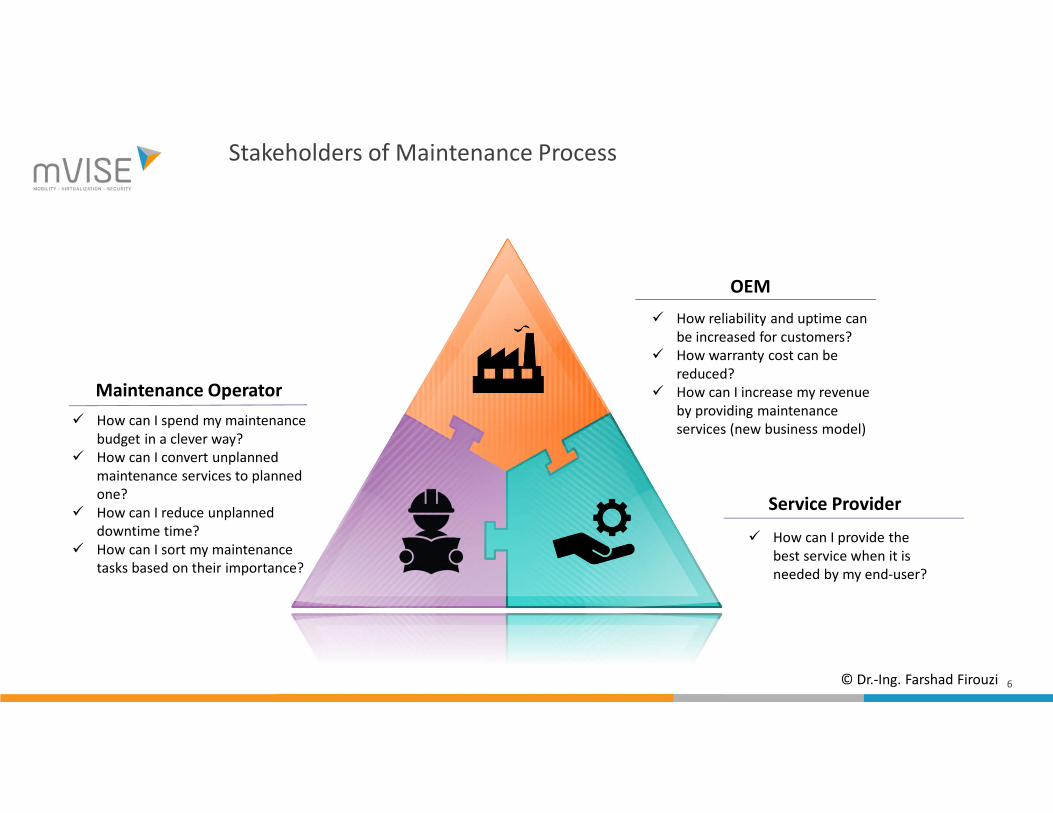
Stakeholders of Maintenance Process
OEM
How reliability and uptime can be increased for customers?
How warranty cost can be reduced?
How can I increase my revenue by providing maintenance services (new business model)
Maintenance Operator
How can I spend my maintenance budget in a clever way?
How can I convert unplanned maintenance services to planned one?
How can I reduce unplanned downtime time?
How can I sort my maintenance tasks based on their importance?
Service Provider
How can I provide the best service when it is needed by my end-user?
© Dr.-Ing. Farshad Firouzi
7
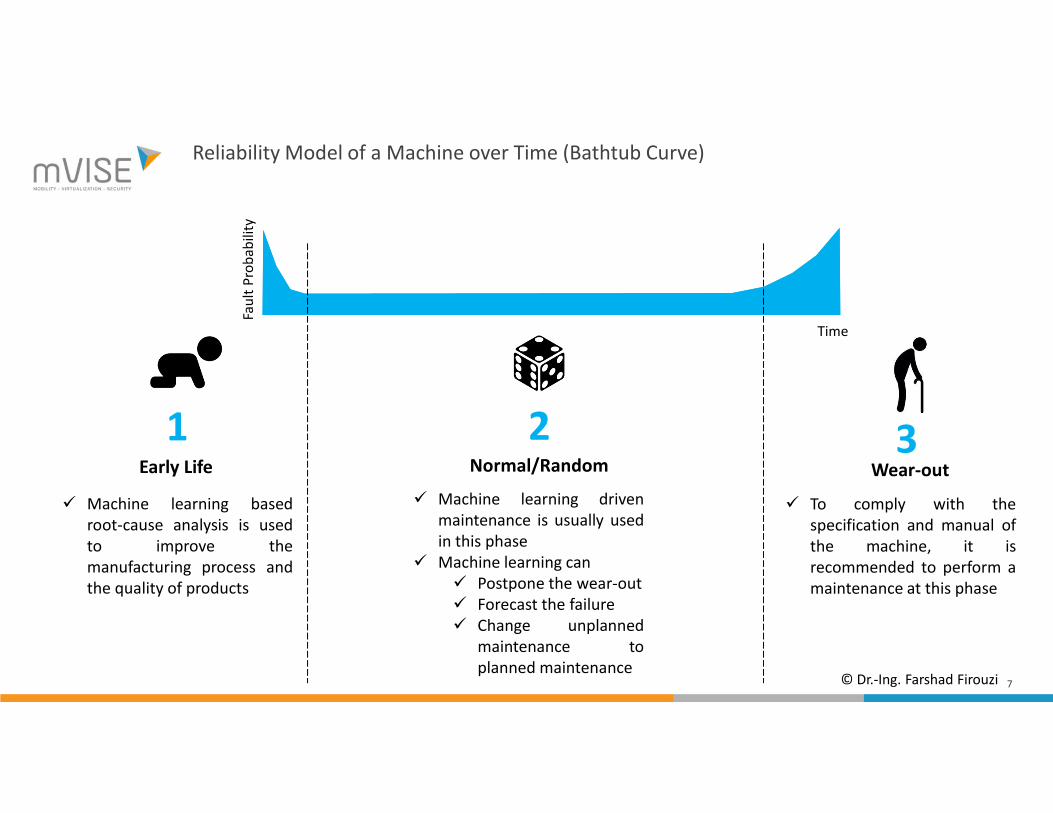
Reliability Model of a Machine over Time (Bathtub Curve)
1 2 3Early Life Normal/Random Wear-out
Fau
lt P
rob
abili
ty
Time
Machine learning basedroot-cause analysis is usedto improve themanufacturing process andthe quality of products
Machine learning drivenmaintenance is usually usedin this phase
Machine learning can Postpone the wear-out Forecast the failure Change unplanned
maintenance toplanned maintenance
To comply with thespecification and manual ofthe machine, it isrecommended to perform amaintenance at this phase
© Dr.-Ing. Farshad Firouzi
8
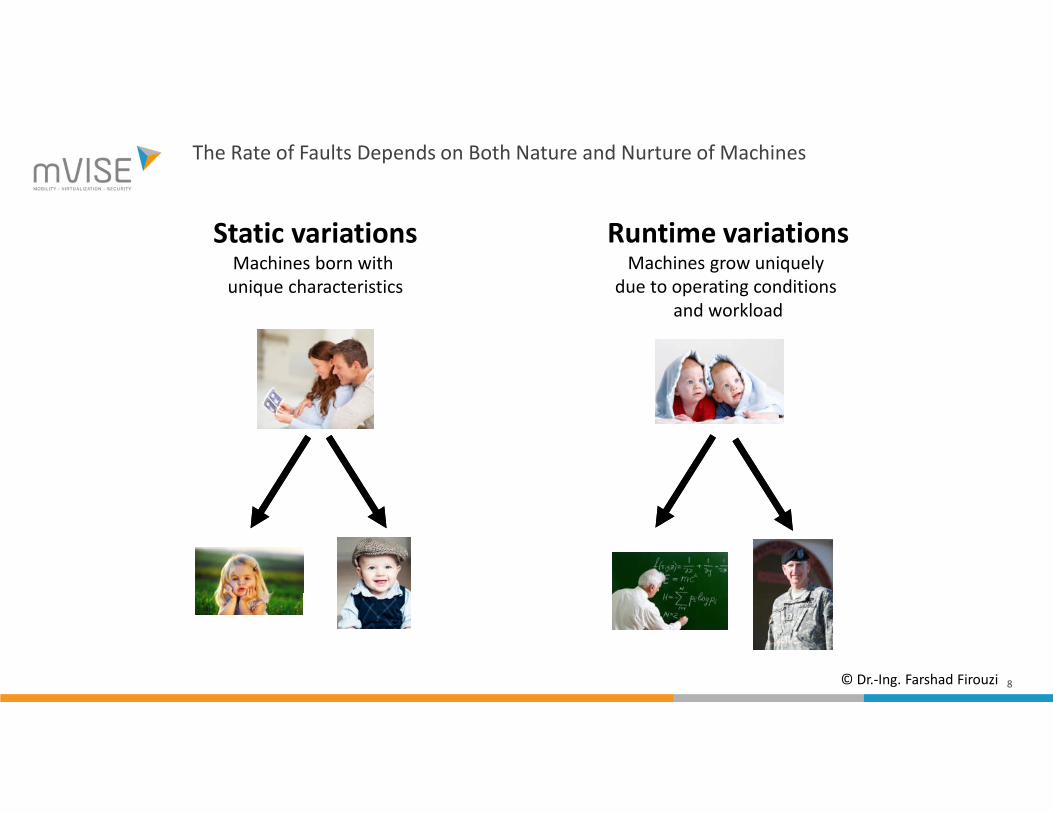
The Rate of Faults Depends on Both Nature and Nurture of Machines
Runtime variationsMachines grow uniquely
due to operating conditions and workload
Static variationsMachines born with
unique characteristics
© Dr.-Ing. Farshad Firouzi
9
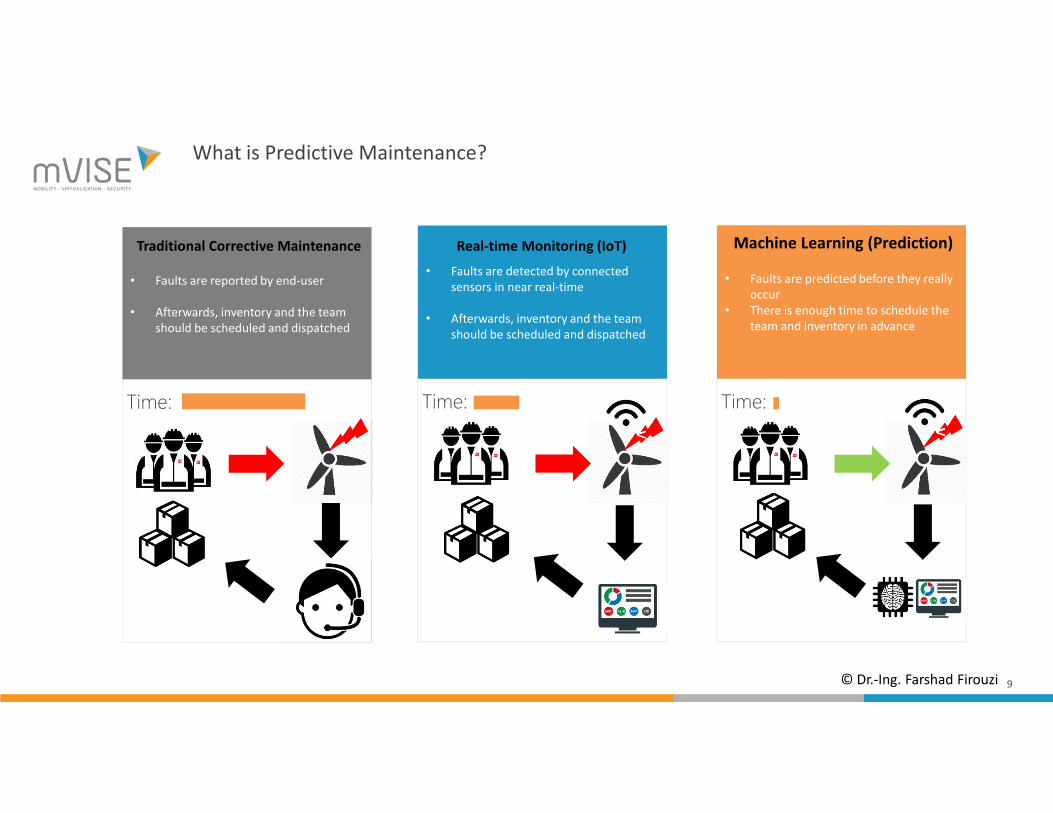
What is Predictive Maintenance?
• Faults are reported by end-user
• Afterwards, inventory and the team should be scheduled and dispatched
Traditional Corrective Maintenance
• Faults are detected by connected sensors in near real-time
• Afterwards, inventory and the team should be scheduled and dispatched
Real-time Monitoring (IoT)
• Faults are predicted before they really occur
• There is enough time to schedule the team and inventory in advance
Machine Learning (Prediction)
Time: Time:vv
Time:
vv
© Dr.-Ing. Farshad Firouzi
10
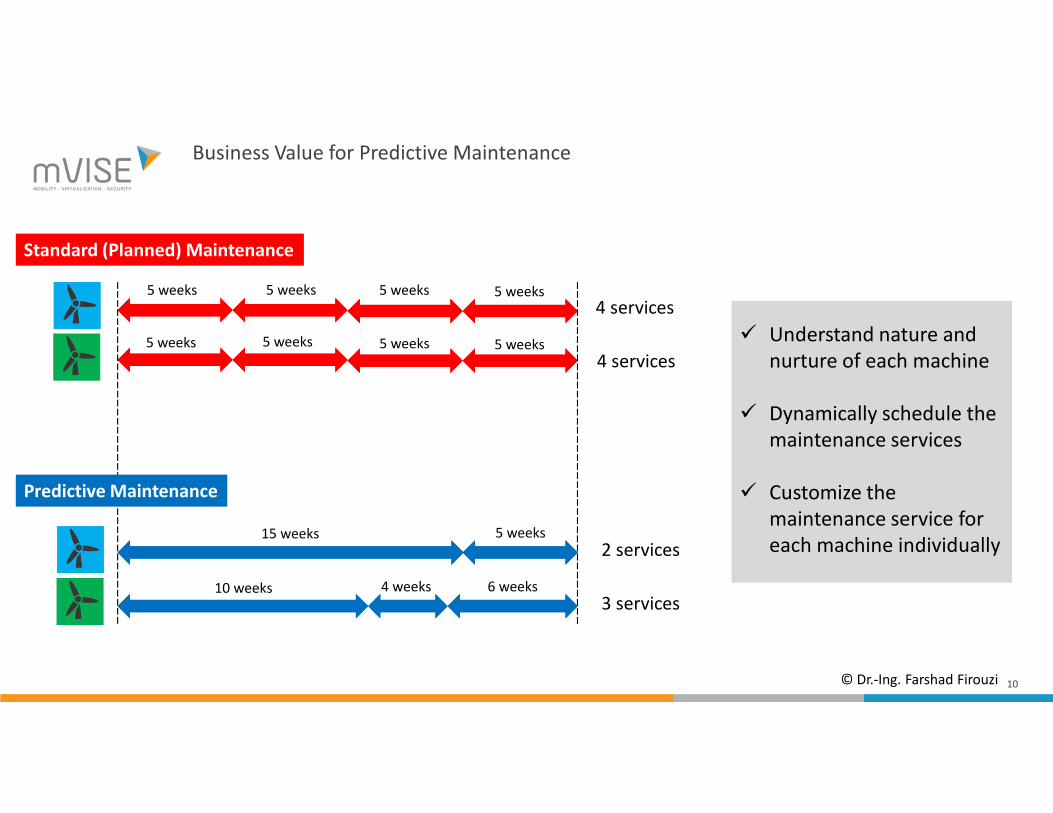
Business Value for Predictive Maintenance
5 weeks 5 weeks 5 weeks 5 weeks
5 weeks 5 weeks 5 weeks 5 weeks
15 weeks 5 weeks
10 weeks 6 weeks4 weeks
4 services
4 services
2 services
3 services
Understand nature and nurture of each machine
Dynamically schedule the maintenance services
Customize the maintenance service for each machine individually
Standard (Planned) Maintenance
Predictive Maintenance
© Dr.-Ing. Farshad Firouzi
11
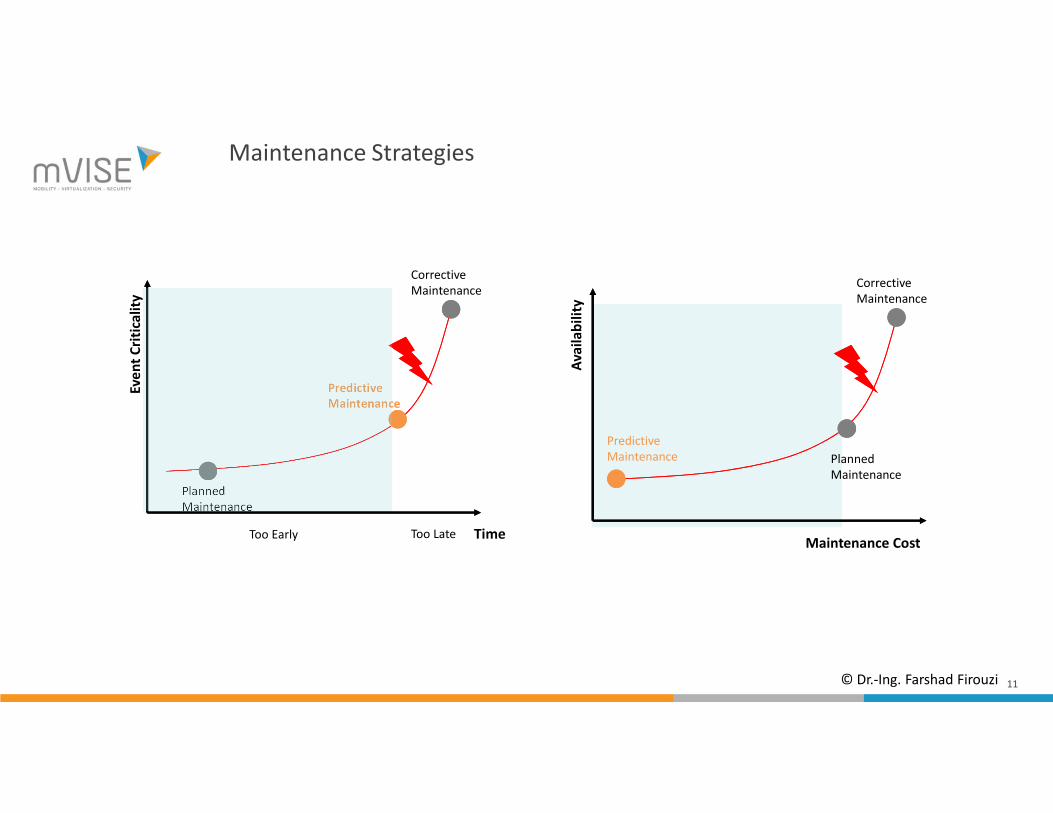
Maintenance Strategies
Planned Maintenance
Predictive Maintenance
Corrective Maintenance
Too Early Too Late
Ava
ilab
ility
Maintenance Cost
Eve
nt
Cri
tica
lity
Planned Maintenance
Predictive Maintenance
Corrective Maintenance
Time
© Dr.-Ing. Farshad Firouzi
12
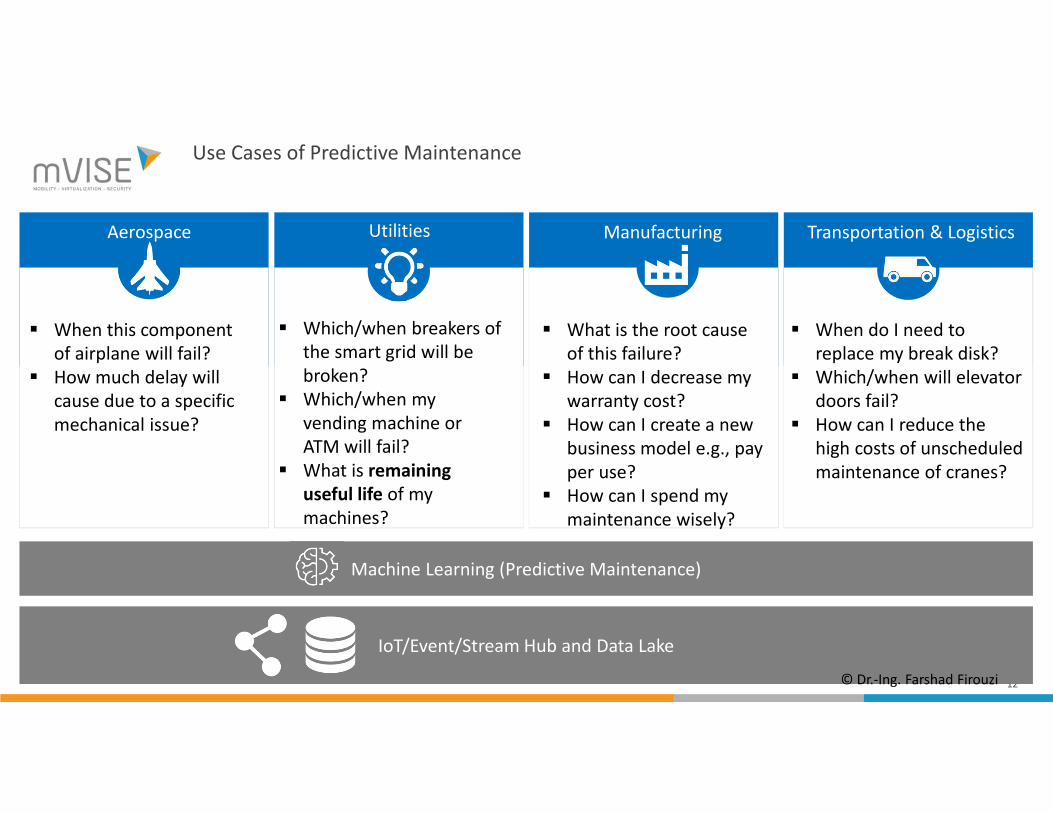
Use Cases of Predictive Maintenance
Aerospace Utilities Manufacturing Transportation & Logistics
When this component of airplane will fail?
How much delay will cause due to a specific mechanical issue?
Which/when breakers of the smart grid will be broken?
Which/when my vending machine or ATM will fail?
What is remaining useful life of my machines?
What is the root cause of this failure?
How can I decrease my warranty cost?
How can I create a new business model e.g., pay per use?
How can I spend my maintenance wisely?
When do I need to replace my break disk?
Which/when will elevator doors fail?
How can I reduce the high costs of unscheduled maintenance of cranes?
Machine Learning (Predictive Maintenance)
IoT/Event/Stream Hub and Data Lake
© Dr.-Ing. Farshad Firouzi
13
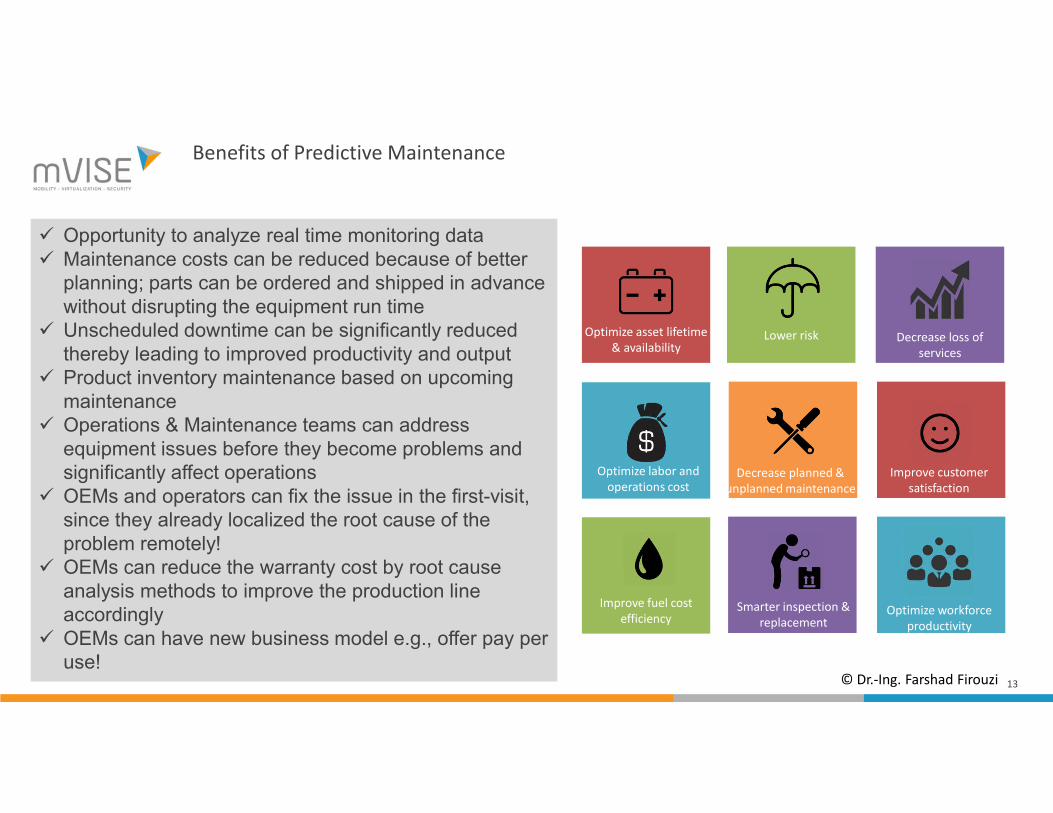
Benefits of Predictive Maintenance
Optimize asset lifetime & availability
Lower risk Decrease loss of services
Optimize labor and operations cost
Decrease planned & unplanned maintenance
Improve customer satisfaction
Improve fuel cost efficiency
Smarter inspection & replacement
Optimize workforce productivity
Opportunity to analyze real time monitoring data Maintenance costs can be reduced because of better
planning; parts can be ordered and shipped in advance without disrupting the equipment run time
Unscheduled downtime can be significantly reduced thereby leading to improved productivity and output
Product inventory maintenance based on upcoming maintenance
Operations & Maintenance teams can addressequipment issues before they become problems and significantly affect operations
OEMs and operators can fix the issue in the first-visit, since they already localized the root cause of the problem remotely!
OEMs can reduce the warranty cost by root cause analysis methods to improve the production line accordingly
OEMs can have new business model e.g., offer pay per use!
© Dr.-Ing. Farshad Firouzi
14
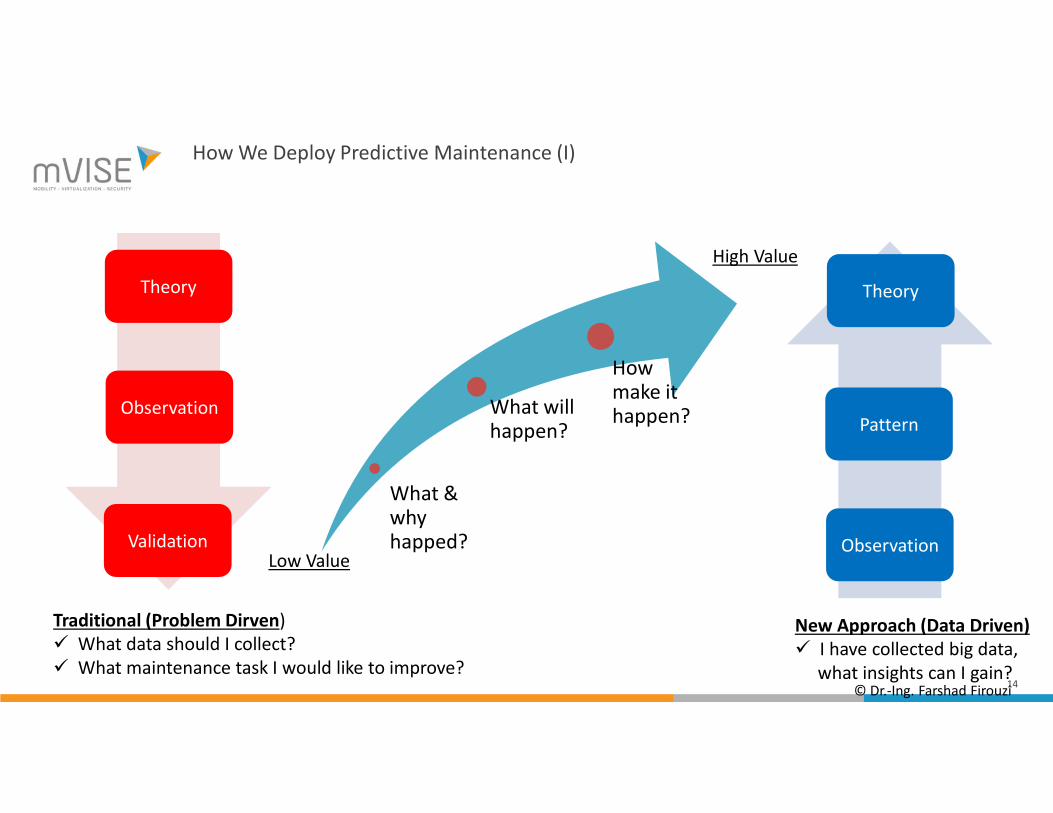
How We Deploy Predictive Maintenance (I)
Theory
Observation
Validation Observation
Pattern
Theory
What & why happed?
What will happen?
How make it happen?
High Value
Low Value
Traditional (Problem Dirven) What data should I collect? What maintenance task I would like to improve?
New Approach (Data Driven) I have collected big data,
what insights can I gain?© Dr.-Ing. Farshad Firouzi
15
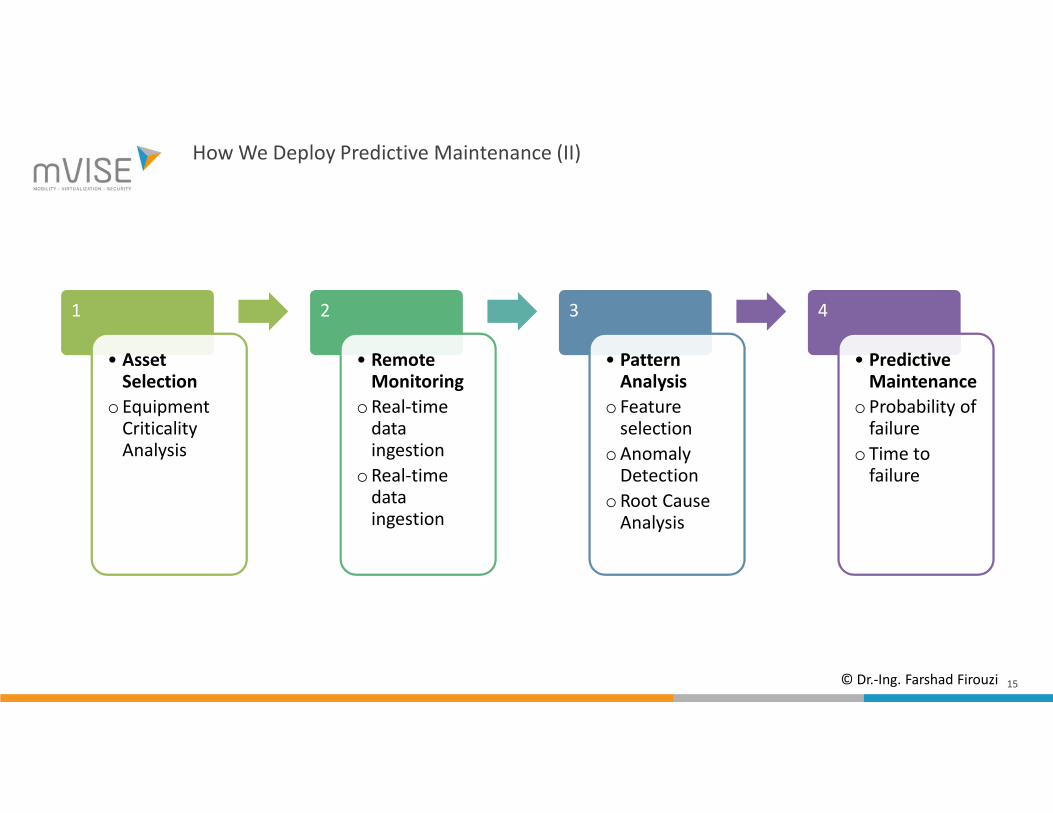
How We Deploy Predictive Maintenance (II)
1
• Asset Selection
o Equipment CriticalityAnalysis
2
• Remote Monitoring
oReal-time data ingestion
oReal-time data ingestion
3
• Pattern Analysis
o Feature selection
oAnomaly Detection
oRoot Cause Analysis
4
• Predictive Maintenance
oProbability of failure
o Time to failure
© Dr.-Ing. Farshad Firouzi
16
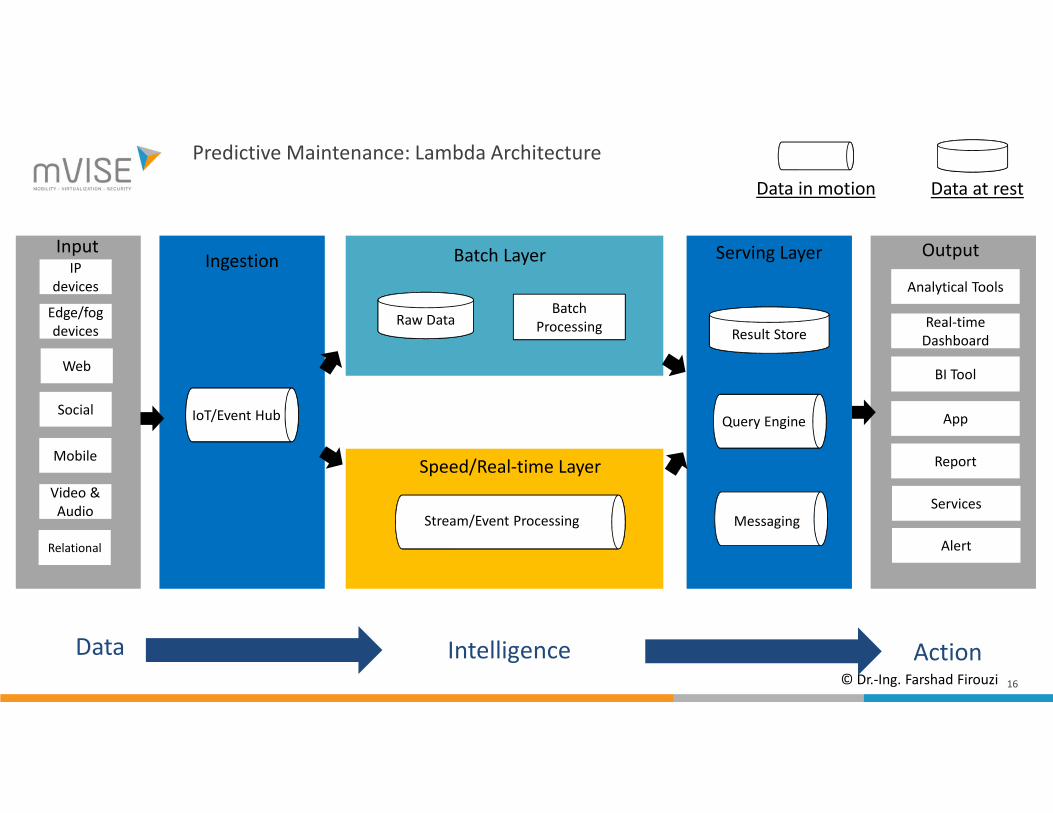
Predictive Maintenance: Lambda Architecture
IP devices
Edge/fog devices
Web
Social
Mobile
Video & Audio
Relational
Raw DataBatch
Processing
Stream/Event Processing
IoT/Event Hub
Result Store
Query Engine
Qu
ery
Engi
ne Messaging
Real-time Dashboard
BI Tool
App
Report
Services
Analytical Tools
Alert
Data in motion Data at rest
Ingestion Batch Layer
Speed/Real-time Layer
Serving LayerInput Output
Data Intelligence Action© Dr.-Ing. Farshad Firouzi
17
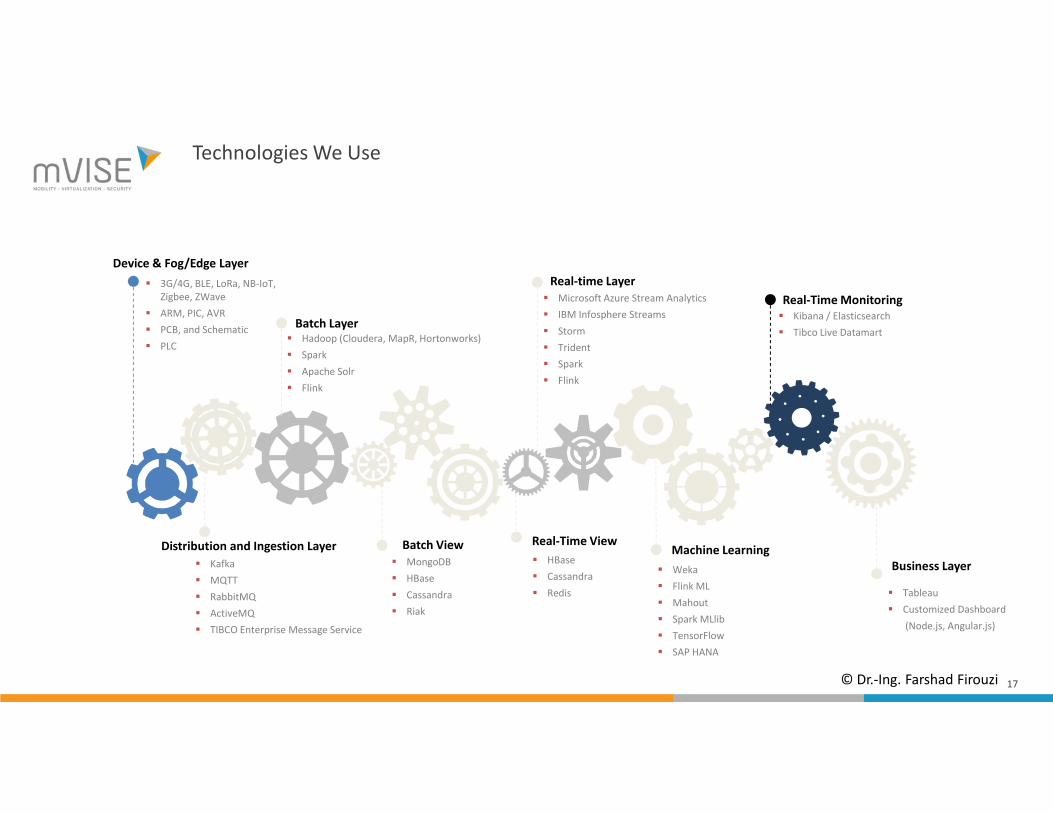
Technologies We Use
Machine Learning
Real-Time Monitoring
Device & Fog/Edge Layer
Batch Layer
3G/4G, BLE, LoRa, NB-IoT, Zigbee, ZWave
ARM, PIC, AVR
PCB, and Schematic
PLC Hadoop (Cloudera, MapR, Hortonworks)
Spark
Apache Solr
Flink
Real-time Layer Microsoft Azure Stream Analytics
IBM Infosphere Streams
Storm
Trident
Spark
Flink
Batch View MongoDB
HBase
Cassandra
Riak
Real-Time View
HBase
Cassandra
Redis
Weka
Flink ML
Mahout
Spark MLlib
TensorFlow
SAP HANA
Kibana / Elasticsearch
Tibco Live Datamart
Tableau
Customized Dashboard
(Node.js, Angular.js)
Distribution and Ingestion Layer
Kafka
MQTT
RabbitMQ
ActiveMQ
TIBCO Enterprise Message Service
Business Layer
© Dr.-Ing. Farshad Firouzi
18
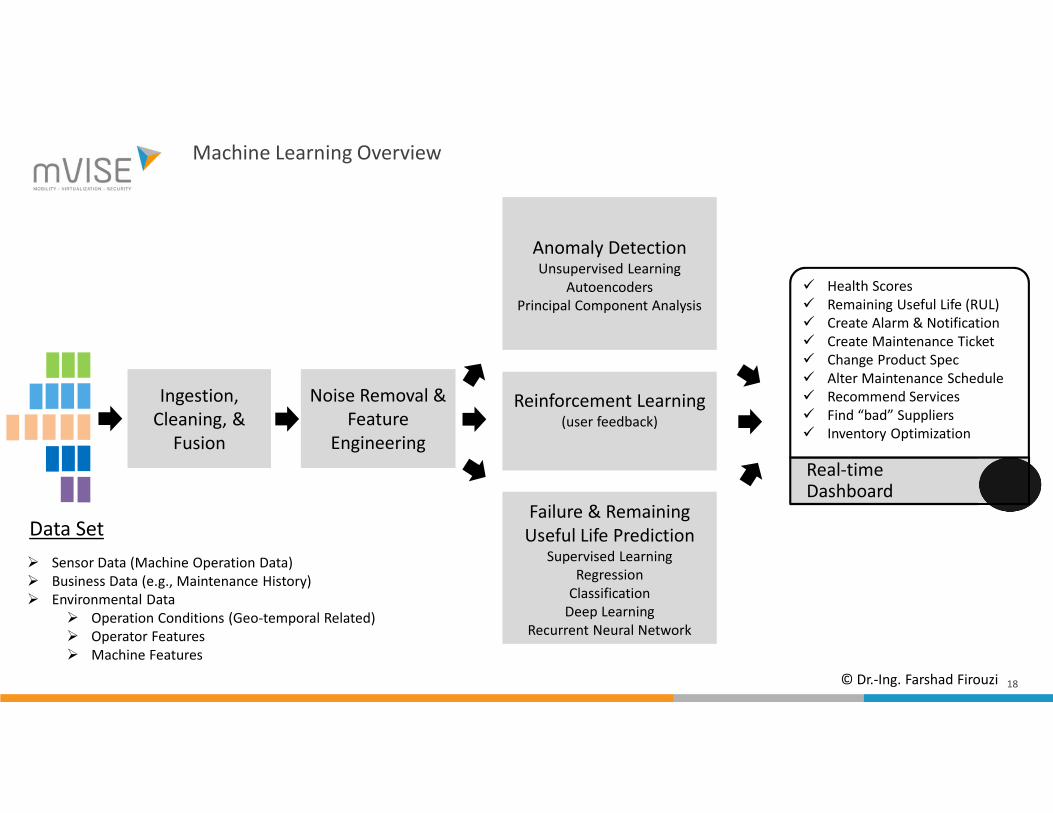
Machine Learning Overview
Ingestion, Cleaning, &
Fusion
Noise Removal &Feature
Engineering
Anomaly DetectionUnsupervised Learning
AutoencodersPrincipal Component Analysis
Reinforcement Learning(user feedback)
Failure & Remaining Useful Life Prediction
Supervised LearningRegression
ClassificationDeep Learning
Recurrent Neural Network
Health Scores Remaining Useful Life (RUL) Create Alarm & Notification Create Maintenance Ticket Change Product Spec Alter Maintenance Schedule Recommend Services Find “bad” Suppliers Inventory Optimization
Real-time Dashboard
Data Set
Sensor Data (Machine Operation Data) Business Data (e.g., Maintenance History) Environmental Data
Operation Conditions (Geo-temporal Related) Operator Features Machine Features
© Dr.-Ing. Farshad Firouzi
19
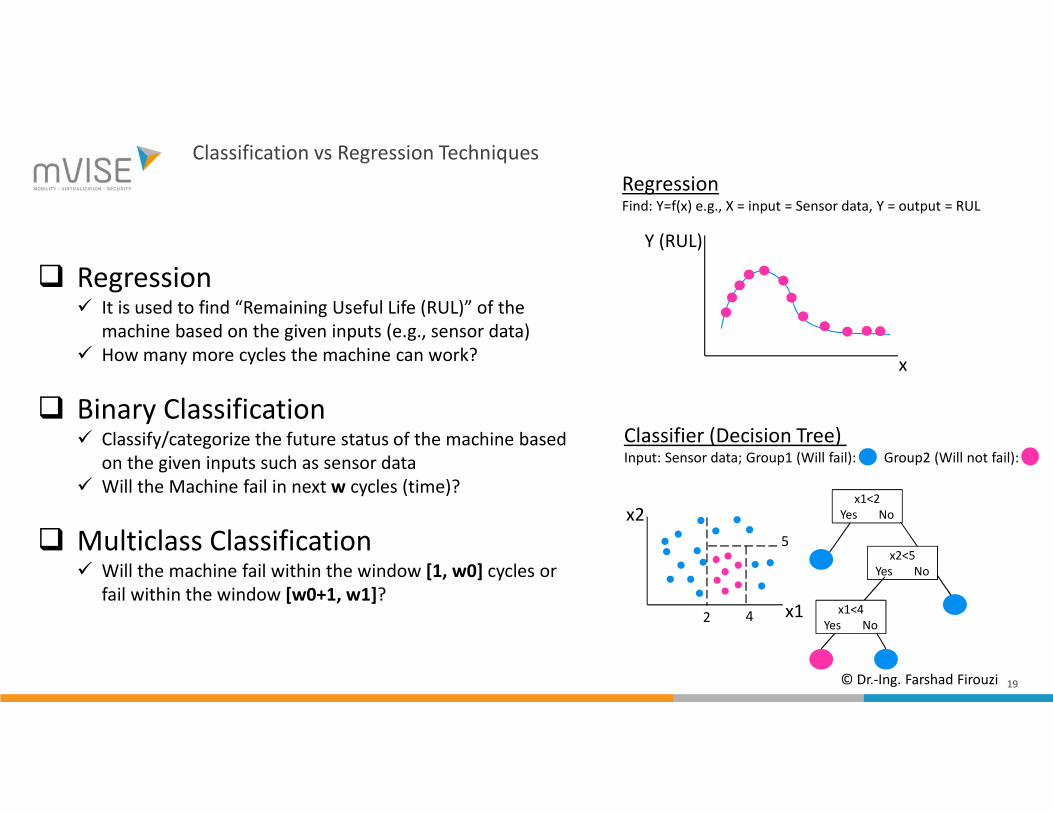
Classification vs Regression Techniques
Regression It is used to find “Remaining Useful Life (RUL)” of the
machine based on the given inputs (e.g., sensor data) How many more cycles the machine can work?
Binary Classification Classify/categorize the future status of the machine based
on the given inputs such as sensor data Will the Machine fail in next w cycles (time)?
Multiclass Classification Will the machine fail within the window [1, w0] cycles or
fail within the window [w0+1, w1]?2 4
5
x1
x2x1<2
Yes No
x2<5Yes No
x1<4Yes No
x
Y (RUL)
RegressionFind: Y=f(x) e.g., X = input = Sensor data, Y = output = RUL
Classifier (Decision Tree) Input: Sensor data; Group1 (Will fail): Group2 (Will not fail):
© Dr.-Ing. Farshad Firouzi
20
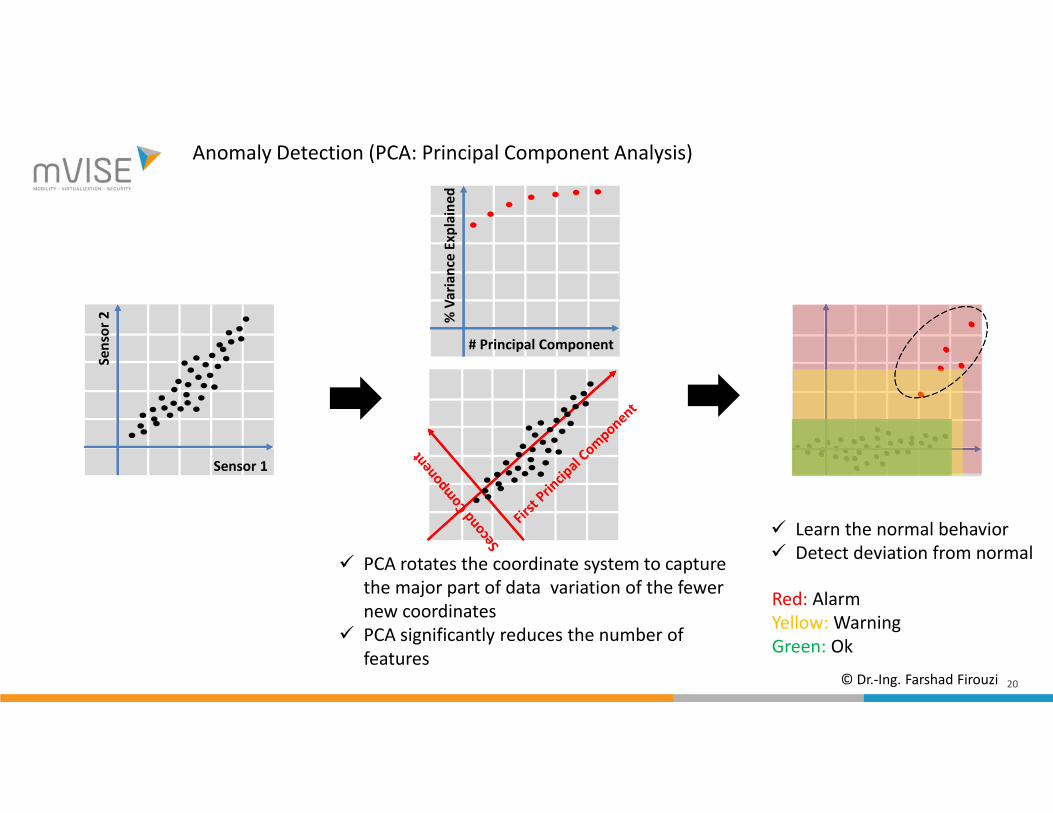
Anomaly Detection (PCA: Principal Component Analysis)
PCA rotates the coordinate system to capture the major part of data variation of the fewer new coordinates
PCA significantly reduces the number of features
Red: AlarmYellow: WarningGreen: Ok
Learn the normal behavior Detect deviation from normal
Sensor 1
Sen
sor
2
# Principal Component
% V
aria
nce
Exp
lain
ed
© Dr.-Ing. Farshad Firouzi
21
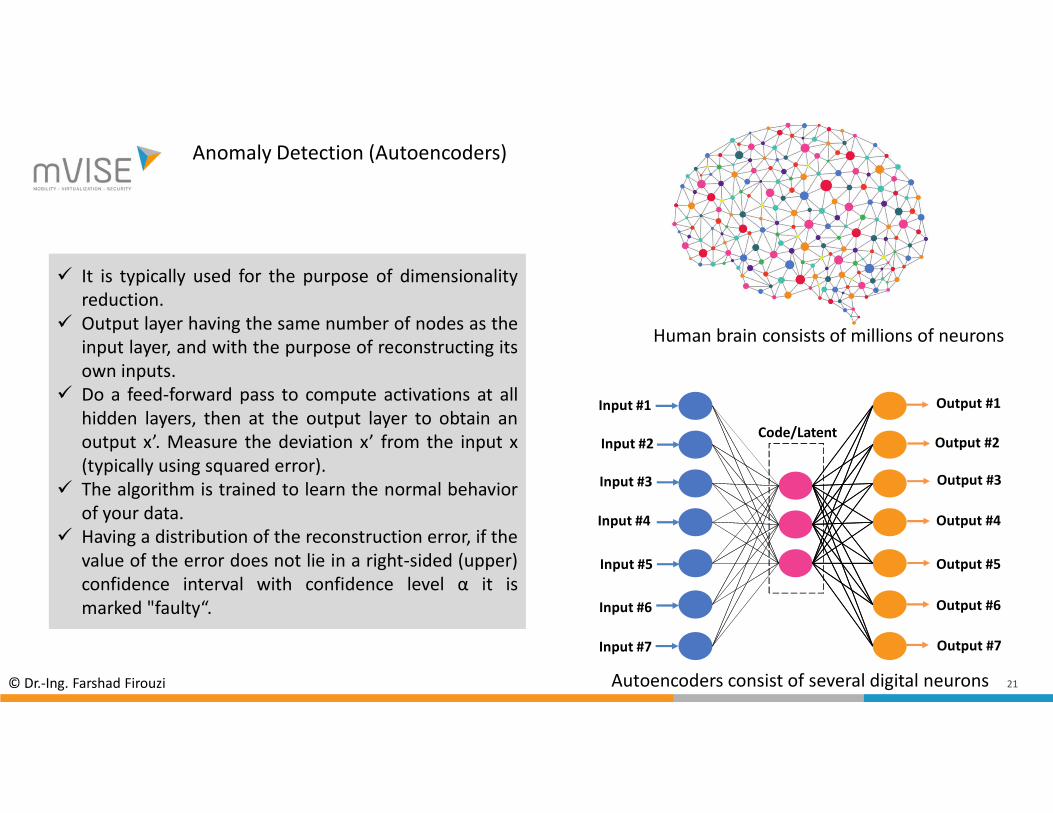
Anomaly Detection (Autoencoders)
It is typically used for the purpose of dimensionalityreduction.
Output layer having the same number of nodes as theinput layer, and with the purpose of reconstructing itsown inputs.
Do a feed-forward pass to compute activations at allhidden layers, then at the output layer to obtain anoutput x’. Measure the deviation x’ from the input x(typically using squared error).
The algorithm is trained to learn the normal behaviorof your data.
Having a distribution of the reconstruction error, if thevalue of the error does not lie in a right-sided (upper)confidence interval with confidence level α it ismarked "faulty“.
Input #1
Input #2
Input #3
Input #4
Input #5
Input #6
Input #7
Output #1
Output #2
Output #3
Output #4
Output #5
Output #6
Output #7
Code/Latent
Human brain consists of millions of neurons
Autoencoders consist of several digital neurons© Dr.-Ing. Farshad Firouzi
22
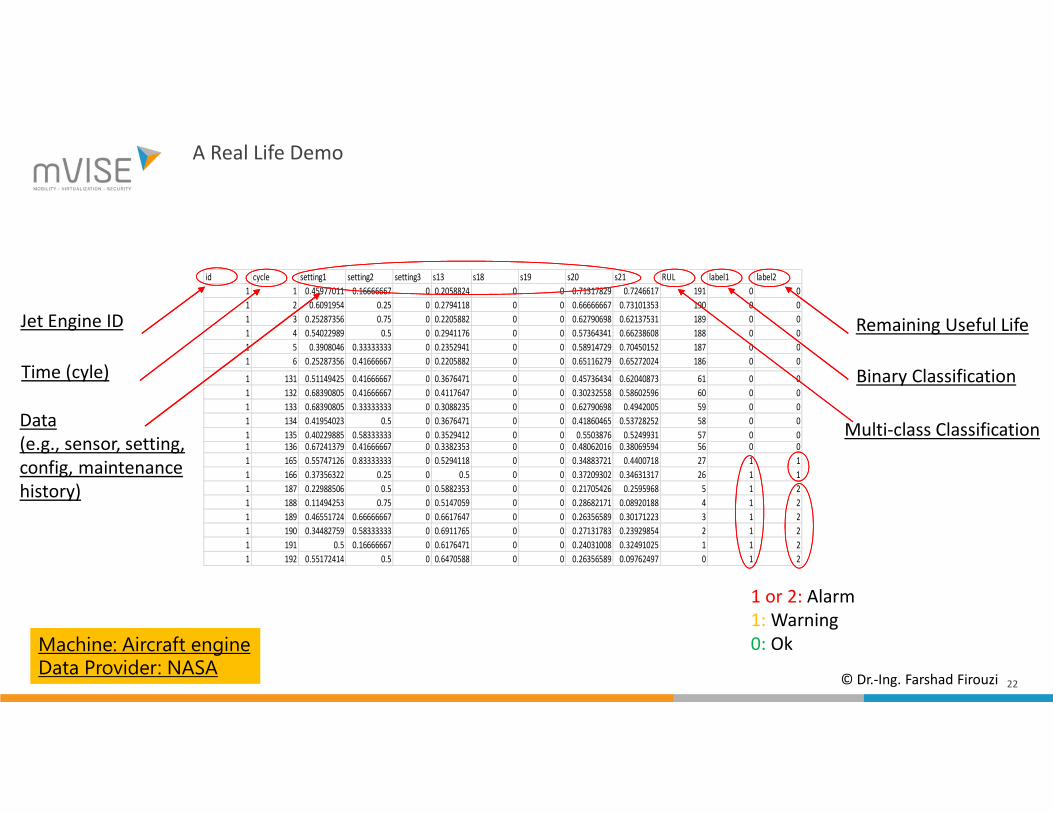
A Real Life Demo
id cycle setting1 setting2 setting3 s13 s18 s19 s20 s21 RUL label1 label2
1 1 0.45977011 0.16666667 0 0.2058824 0 0 0.71317829 0.7246617 191 0 0
1 2 0.6091954 0.25 0 0.2794118 0 0 0.66666667 0.73101353 190 0 0
1 3 0.25287356 0.75 0 0.2205882 0 0 0.62790698 0.62137531 189 0 0
1 4 0.54022989 0.5 0 0.2941176 0 0 0.57364341 0.66238608 188 0 0
1 5 0.3908046 0.33333333 0 0.2352941 0 0 0.58914729 0.70450152 187 0 0
1 6 0.25287356 0.41666667 0 0.2205882 0 0 0.65116279 0.65272024 186 0 01 7 0.55747126 0.58333333 0 0.2205882 0 0 0.74418605 0.667219 185 0 0
1 131 0.51149425 0.41666667 0 0.3676471 0 0 0.45736434 0.62040873 61 0 0
1 132 0.68390805 0.41666667 0 0.4117647 0 0 0.30232558 0.58602596 60 0 0
1 133 0.68390805 0.33333333 0 0.3088235 0 0 0.62790698 0.4942005 59 0 0
1 134 0.41954023 0.5 0 0.3676471 0 0 0.41860465 0.53728252 58 0 0
1 135 0.40229885 0.58333333 0 0.3529412 0 0 0.5503876 0.5249931 57 0 01 136 0.67241379 0.41666667 0 0.3382353 0 0 0.48062016 0.38069594 56 0 0
1 165 0.55747126 0.83333333 0 0.5294118 0 0 0.34883721 0.4400718 27 1 1
1 166 0.37356322 0.25 0 0.5 0 0 0.37209302 0.34631317 26 1 1
1 187 0.22988506 0.5 0 0.5882353 0 0 0.21705426 0.2595968 5 1 2
1 188 0.11494253 0.75 0 0.5147059 0 0 0.28682171 0.08920188 4 1 2
1 189 0.46551724 0.66666667 0 0.6617647 0 0 0.26356589 0.30171223 3 1 2
1 190 0.34482759 0.58333333 0 0.6911765 0 0 0.27131783 0.23929854 2 1 2
1 191 0.5 0.16666667 0 0.6176471 0 0 0.24031008 0.32491025 1 1 2
1 192 0.55172414 0.5 0 0.6470588 0 0 0.26356589 0.09762497 0 1 2
Jet Engine ID
Time (cyle)
Data (e.g., sensor, setting, config, maintenance history)
Remaining Useful Life
Binary Classification
Multi-class Classification
Machine: Aircraft engineData Provider: NASA
1 or 2: Alarm1: Warning0: Ok
© Dr.-Ing. Farshad Firouzi
23
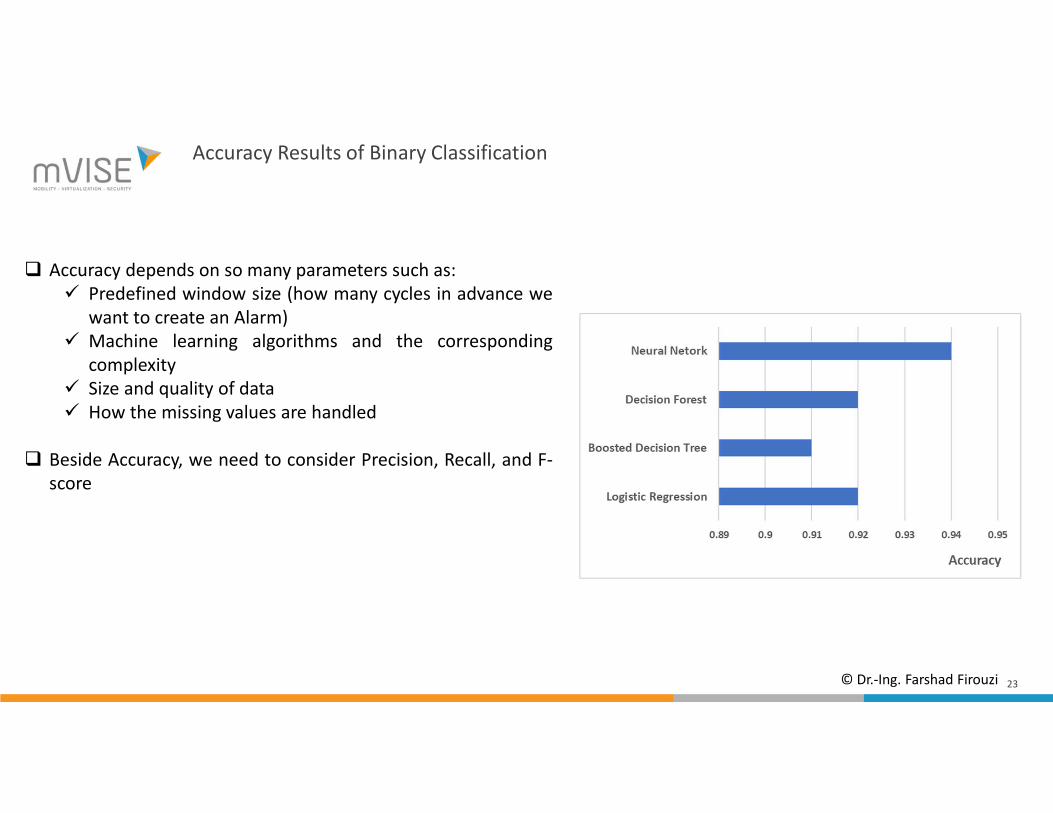
Accuracy Results of Binary Classification
Accuracy depends on so many parameters such as: Predefined window size (how many cycles in advance we
want to create an Alarm) Machine learning algorithms and the corresponding
complexity Size and quality of data How the missing values are handled
Beside Accuracy, we need to consider Precision, Recall, and F-score
© Dr.-Ing. Farshad Firouzi
24
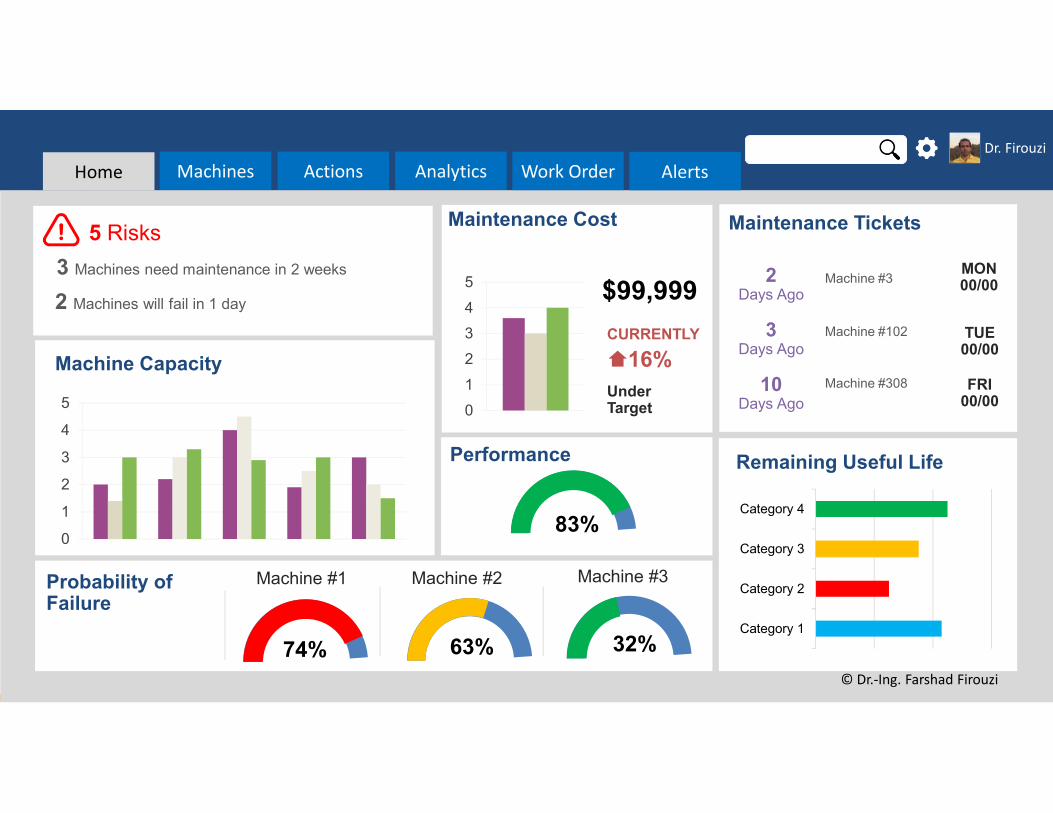
Dr. Firouzi
Home Machines Actions Analytics
5 Risks
3 Machines need maintenance in 2 weeks
2 Machines will fail in 1 day
0
1
2
3
4
5 $99,999
Maintenance Cost
UnderTarget
CURRENTLY
16%
Maintenance Tickets
2 Days Ago
3 Days Ago
10 Days Ago
Machine #3MON00/00
Machine #102 TUE00/00
Machine #308 FRI00/00
0
1
2
3
4
5
Machine Capacity
Machine #1 Machine #2 Machine #3
Category 1
Category 2
Category 3
Category 4
Remaining Useful LifePerformance
74% 63% 32%
Probability of Failure
83%
Work Order Alerts
© Dr.-Ing. Farshad Firouzi
25
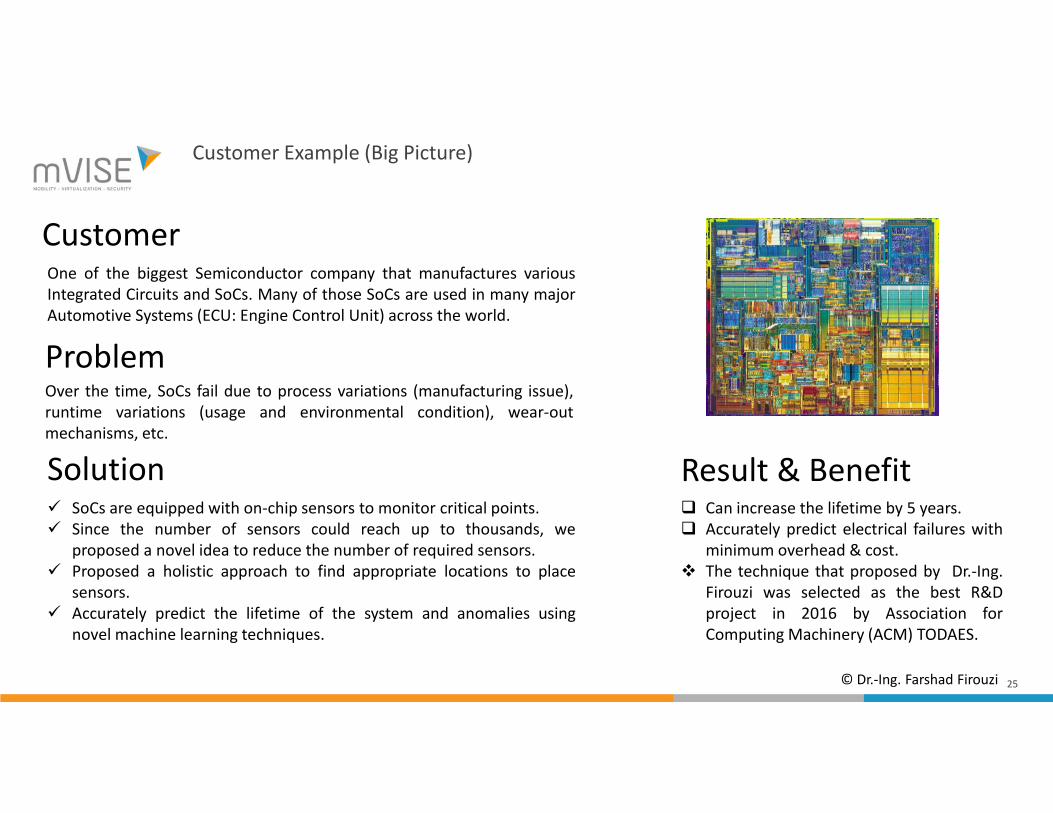
Customer Example (Big Picture)
CustomerOne of the biggest Semiconductor company that manufactures variousIntegrated Circuits and SoCs. Many of those SoCs are used in many majorAutomotive Systems (ECU: Engine Control Unit) across the world.
ProblemOver the time, SoCs fail due to process variations (manufacturing issue),runtime variations (usage and environmental condition), wear-outmechanisms, etc.
Solution SoCs are equipped with on-chip sensors to monitor critical points. Since the number of sensors could reach up to thousands, we
proposed a novel idea to reduce the number of required sensors. Proposed a holistic approach to find appropriate locations to place
sensors. Accurately predict the lifetime of the system and anomalies using
novel machine learning techniques.
Result & Benefit Can increase the lifetime by 5 years. Accurately predict electrical failures with
minimum overhead & cost. The technique that proposed by Dr.-Ing.
Firouzi was selected as the best R&Dproject in 2016 by Association forComputing Machinery (ACM) TODAES.
© Dr.-Ing. Farshad Firouzi
26
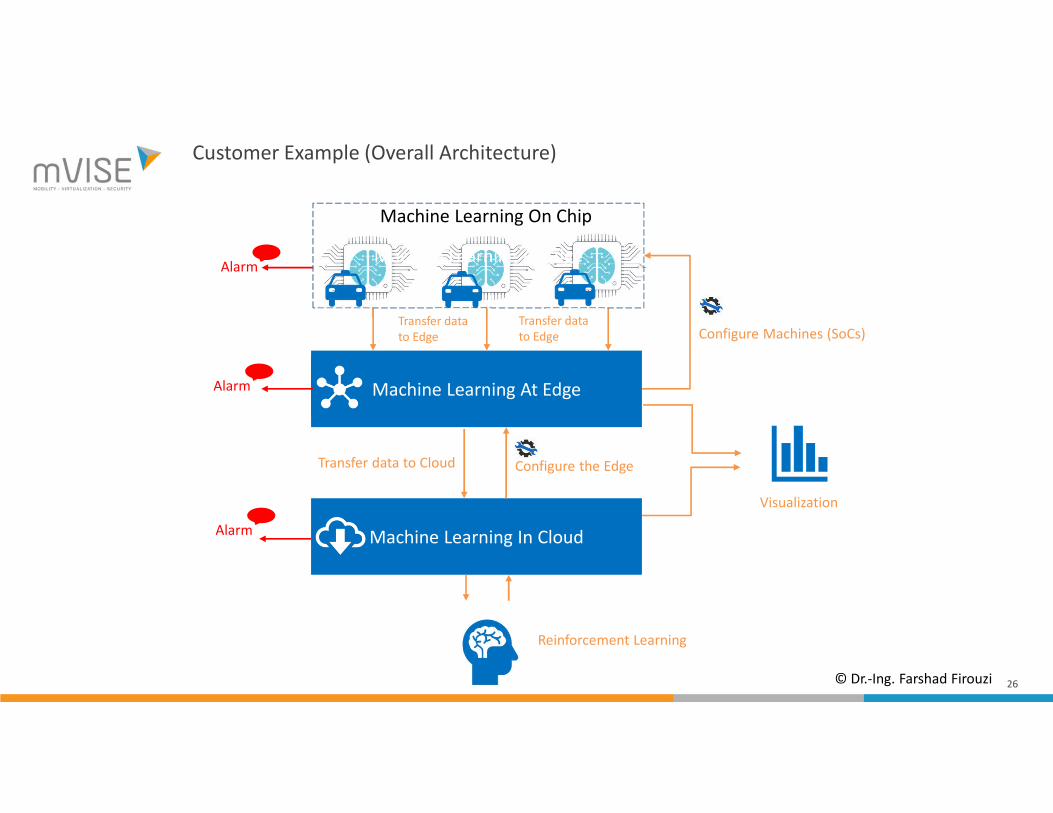
Customer Example (Overall Architecture)
Machine Learning At Edge
Configure Machines (SoCs)
Machine Learning In Cloud
Configure the EdgeTransfer data to Cloud
Alarm
Alarm
Alarm
Visualization
Transfer data to Edge
Transfer data to Edge
Reinforcement Learning
Machine Learning On Chip
Machine Learning At Edge
© Dr.-Ing. Farshad Firouzi
27
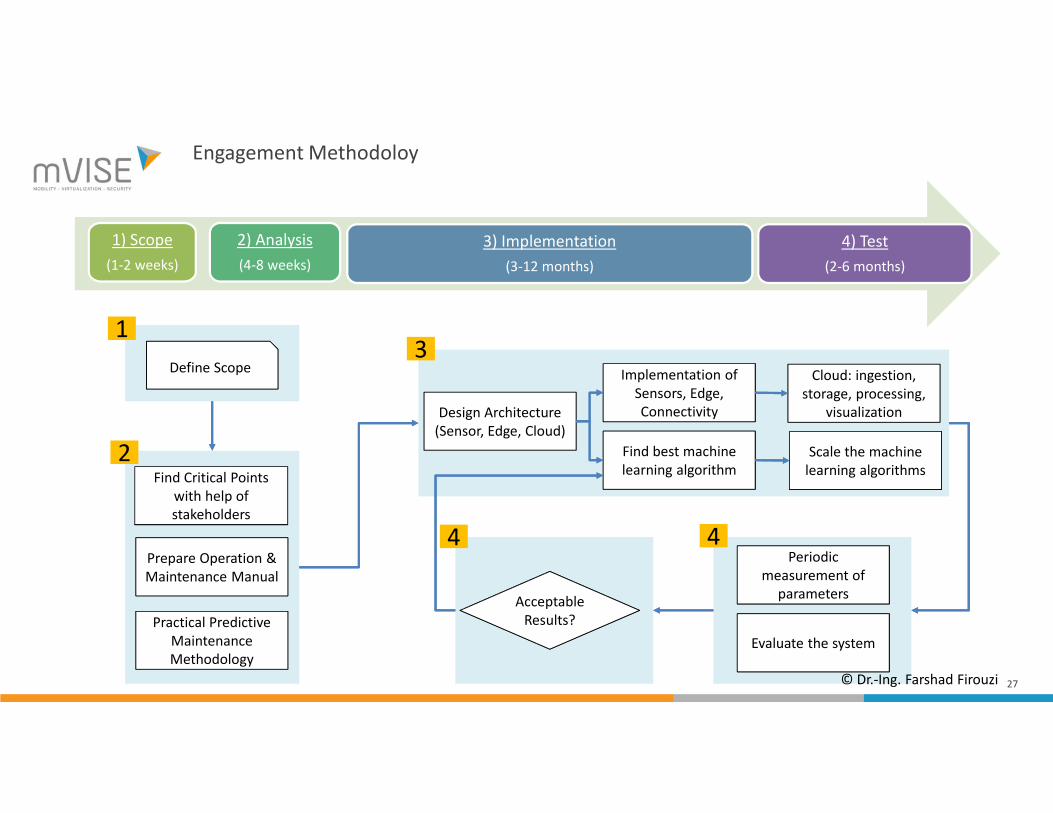
Engagement Methodoloy
1) Scope
(1-2 weeks)
2) Analysis
(4-8 weeks)
3) Implementation
(3-12 months)
4) Test
(2-6 months)
Define Scope
Find Critical Points with help of stakeholders
Prepare Operation & Maintenance Manual
Practical Predictive Maintenance Methodology
Design Architecture (Sensor, Edge, Cloud)
Cloud: ingestion, storage, processing,
visualization
Implementation of Sensors, Edge, Connectivity
Find best machine learning algorithm
Scale the machine learning algorithms
Periodic measurement of
parametersAcceptable
Results?
Evaluate the system
1
2
3
44
© Dr.-Ing. Farshad Firouzi
28
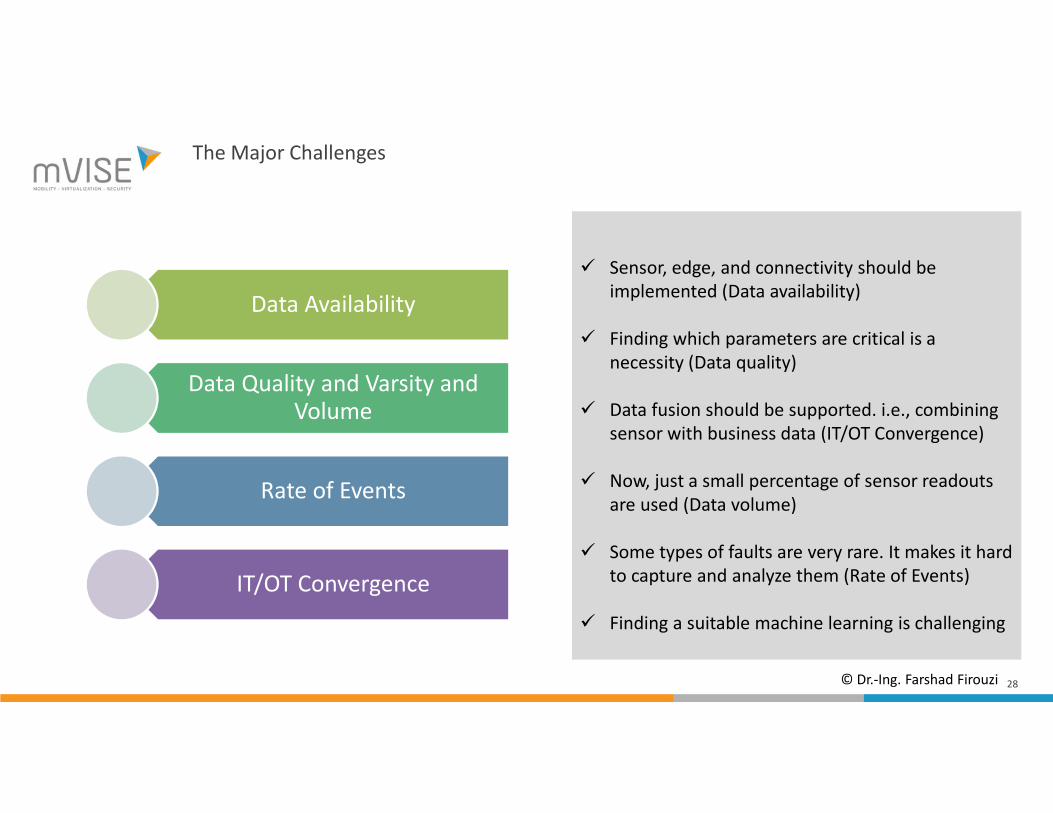
The Major Challenges
Data Availability
Data Quality and Varsity and Volume
Rate of Events
IT/OT Convergence
Sensor, edge, and connectivity should be implemented (Data availability)
Finding which parameters are critical is a necessity (Data quality)
Data fusion should be supported. i.e., combining sensor with business data (IT/OT Convergence)
Now, just a small percentage of sensor readouts are used (Data volume)
Some types of faults are very rare. It makes it hard to capture and analyze them (Rate of Events)
Finding a suitable machine learning is challenging
© Dr.-Ing. Farshad Firouzi

29
We Tailor and Customize the Solution for You
There is no one-approach-fits-all Each Predictive Maintenance is unique
© Dr.-Ing. Farshad Firouzi

30
Thank you.
© Dr.-Ing. Farshad Firouzi