dr aslesh op. nutrition- science of food and its relationship to health dietetics-practical...
TRANSCRIPT
Nutrition and healthDr Aslesh OP
Nutrition- Science of food and its relationship to health
Dietetics-Practical application of principals of nutrition

Changing concepts in nutrition
Nutrition, nutrients and deficiency disorders
Nutrition and agriculture/animal husbandary
Nutrition and socio-politico-economical status
Nutrition and NCDsNutritional epidemiologyNutrition and primary health care
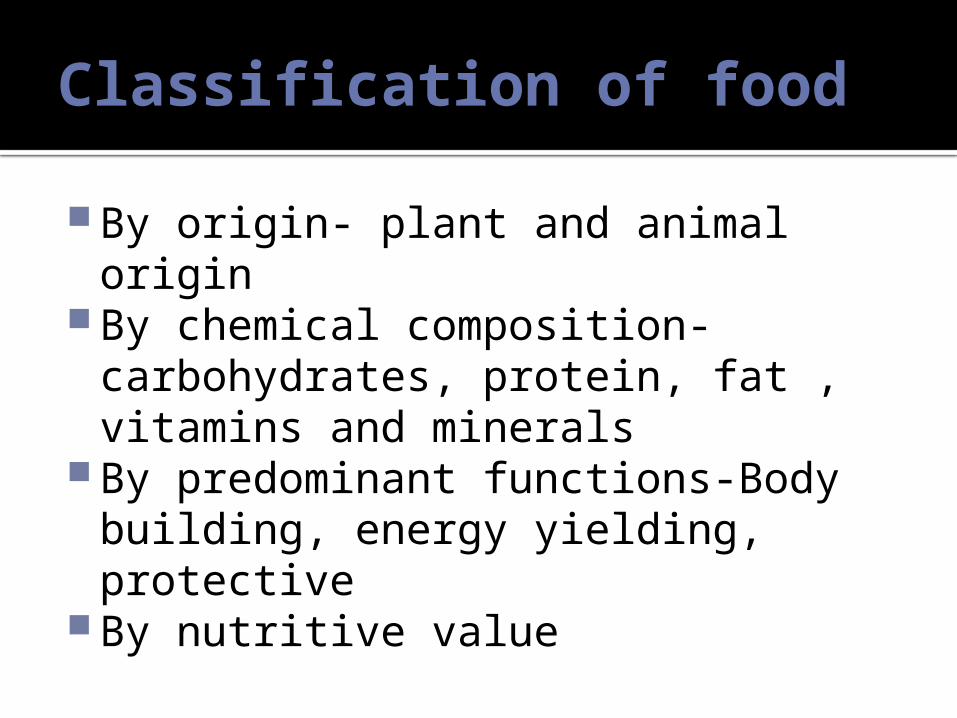
Classification of food
By origin- plant and animal originBy chemical composition-
carbohydrates, protein, fat , vitamins and minerals
By predominant functions-Body building, energy yielding, protective
By nutritive value
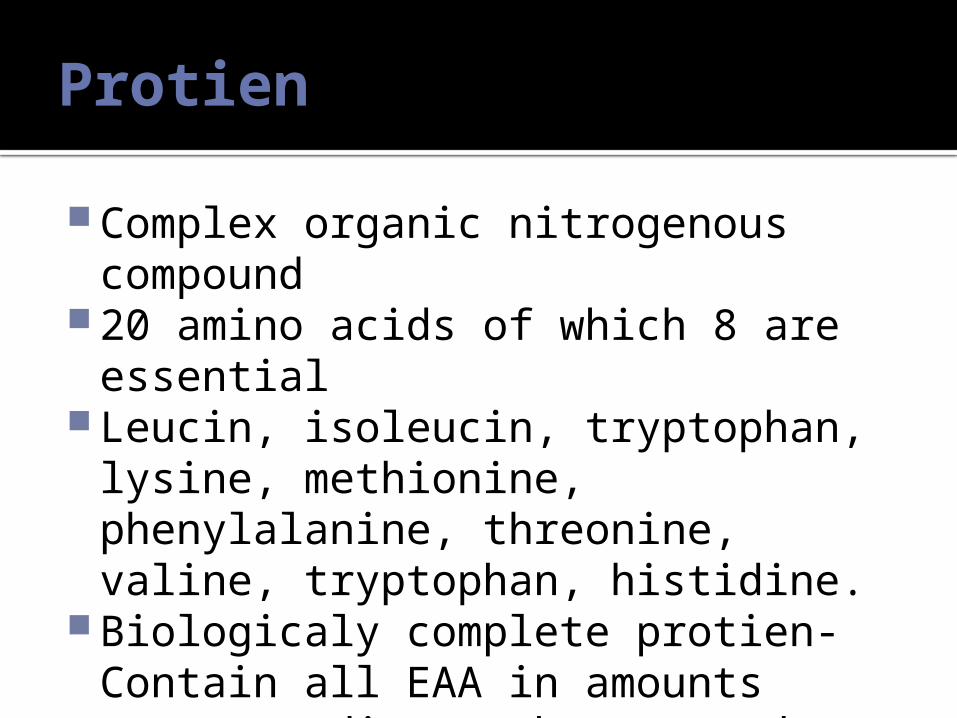
Protien
Complex organic nitrogenous compound
20 amino acids of which 8 are essential
Leucin, isoleucin, tryptophan, lysine, methionine, phenylalanine, threonine, valine, tryptophan, histidine.
Biologicaly complete protien- Contain all EAA in amounts corresponding to human need.
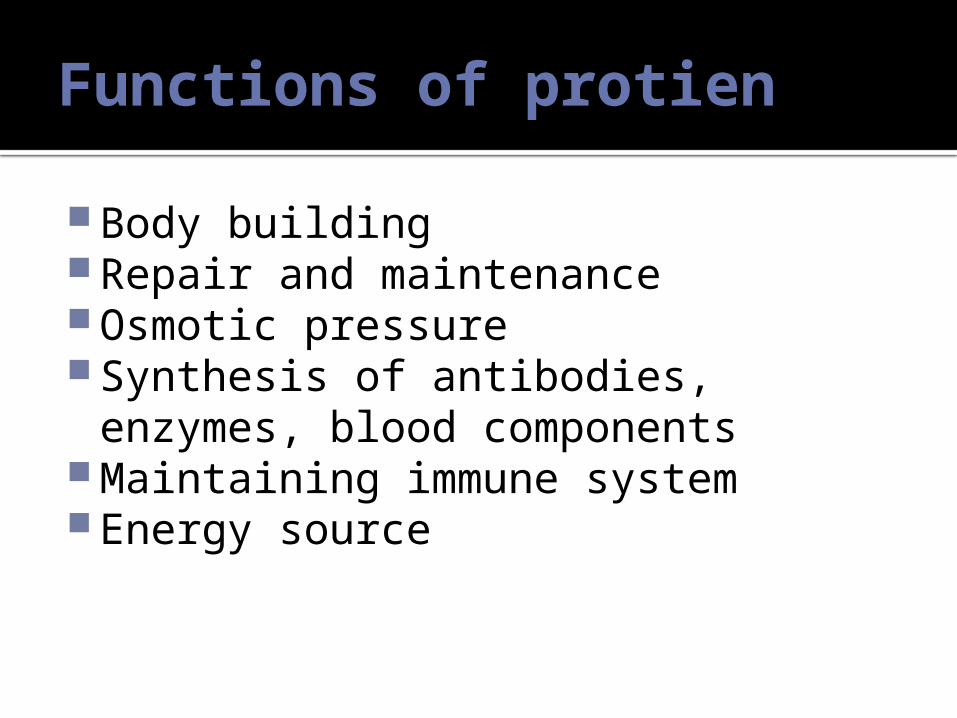
Functions of protien
Body buildingRepair and maintenanceOsmotic pressureSynthesis of antibodies, enzymes,
blood componentsMaintaining immune systemEnergy source
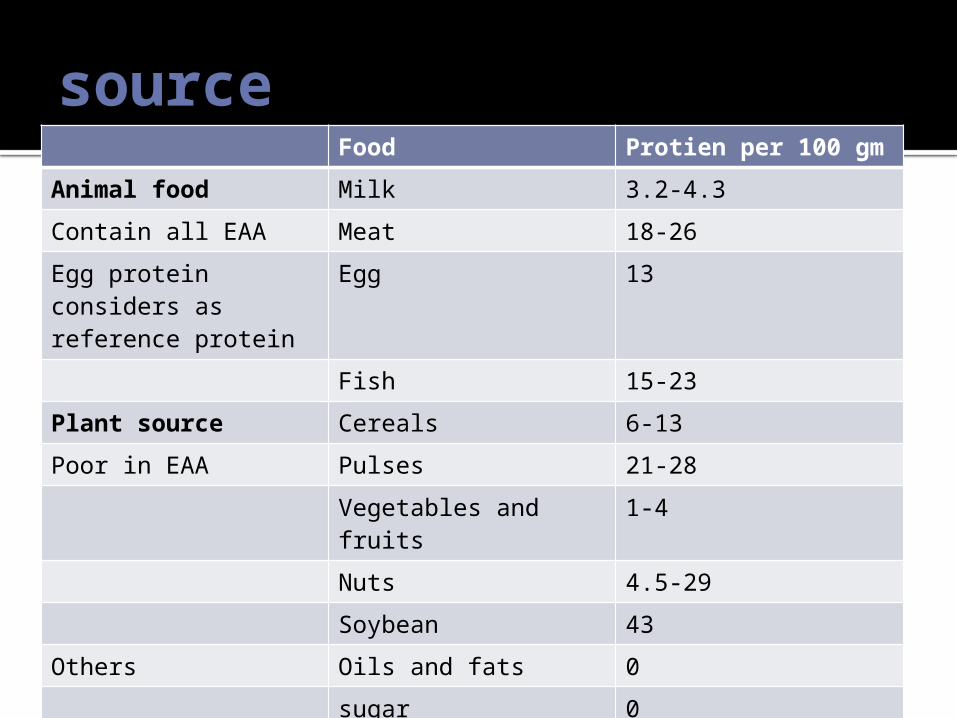
sourceFood Protien per 100 gm
Animal food Milk 3.2-4.3
Contain all EAA Meat 18-26
Egg protein considers as reference protein
Egg 13
Fish 15-23
Plant source Cereals 6-13
Poor in EAA Pulses 21-28
Vegetables and fruits 1-4
Nuts 4.5-29
Soybean 43
Others Oils and fats 0
sugar 0
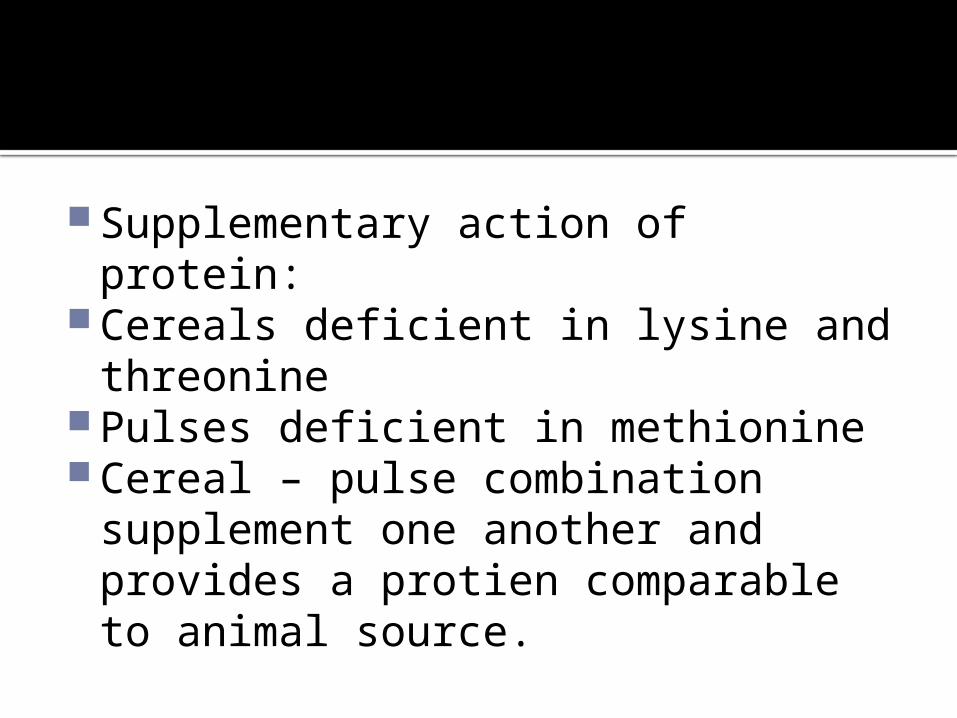
Supplementary action of protein:Cereals deficient in lysine and
threoninePulses deficient in methionineCereal – pulse combination
supplement one another and provides a protien comparable to animal source.
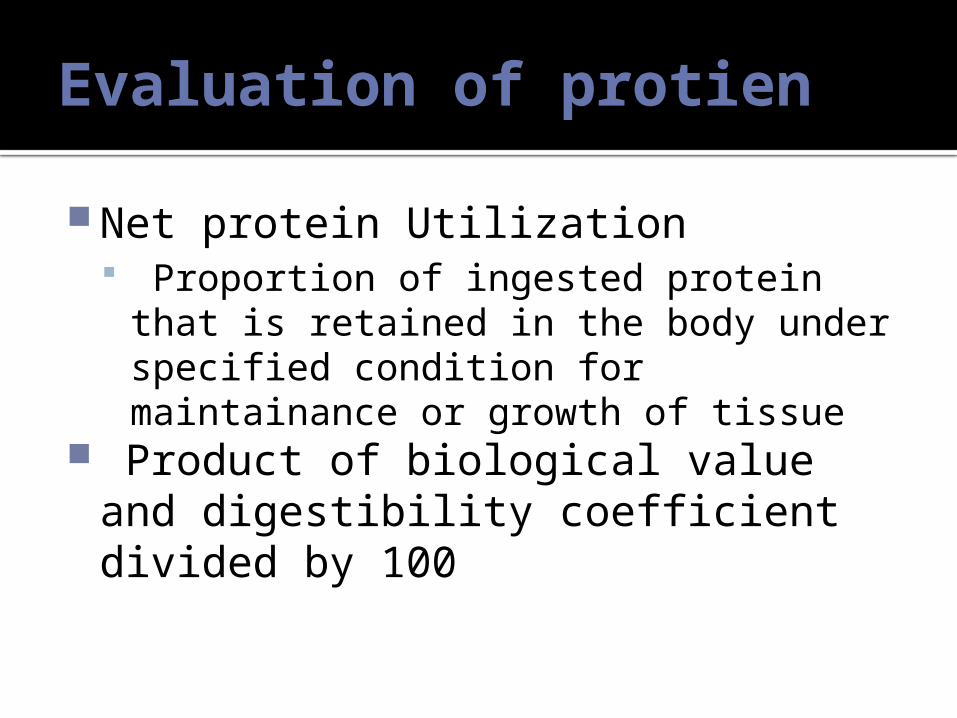
Evaluation of protien
Net protein Utilization Proportion of ingested protein that is
retained in the body under specified condition for maintainance or growth of tissue
Product of biological value and digestibility coefficient divided by 100
Assessment of protein nutrition status
Arm muscle circumferenceCreatinine height indexSerum albumin level
<3g/dl- sever malnutrition, 3-3.5gm/dl- mild malnutrition

Protein requirement
ICMR guidelines1gm/kg body weight assuming a NPU
of 65 for the dietary protein.Pregnancy - +23gmLactation-+19(06 months) - +13(after 6 months)
Fats
• Classified as– Simple lipids- Triglycerides– Compound lipids- Phospholipids– Derived lipids- Cholesterol
• Classification of fatty acids– Saturated fatty acid (SFA)– Mono unsaturated fatty acids (MUFA)– Polyunsaturated fatt acids(PUFA)• Linoliec• Αlpha linolenic
– Trans fatty acids (TFA)

Fatty acid composition of fats and oils
Fats SFA MUFA LA ALA
High SFA
Coconut 92 6 2 0
Palm kernel
83 15 2
Butter /ghee
68 29 2 1
High SFA &MUFA
Palmolien 39 46 11 .5
High MUFA and moderate LA
Ground nut 19 41 32 .5
sesame 16 41 42 .5
Olive oil 14 72 14
High LA
Cotton seed
24 29 48 1
corn 12 35 50 1
Safflower oil
9 13 75
sunflower 12 22 62
LA and ALA
Soyabean 14 24 53 7
canola 6 60 22 10
Mustard oil 4 65 15 14

• Essential fatty acids– Linoliec acid
• Source of fats– Animal– Vegetable– others
• Visible and invisible fats• Hydrogenation• Refined oils
Functions of fats
Energy yielding- 9 kcal per gramVehicle for fat soluble vitaminsSupports visceraStructural integrity of cell membranePrecursors of prostaglandinsProduction of steroid hormones and
bile acids
Fat and Diseases
ObesityPhrenoderma_ deficiency of EFACoronary heart diseases
High fat content in diet - >40% of energy intake
High saturated fat intake Low EFA intake
Cancer- Colon , breast cancer
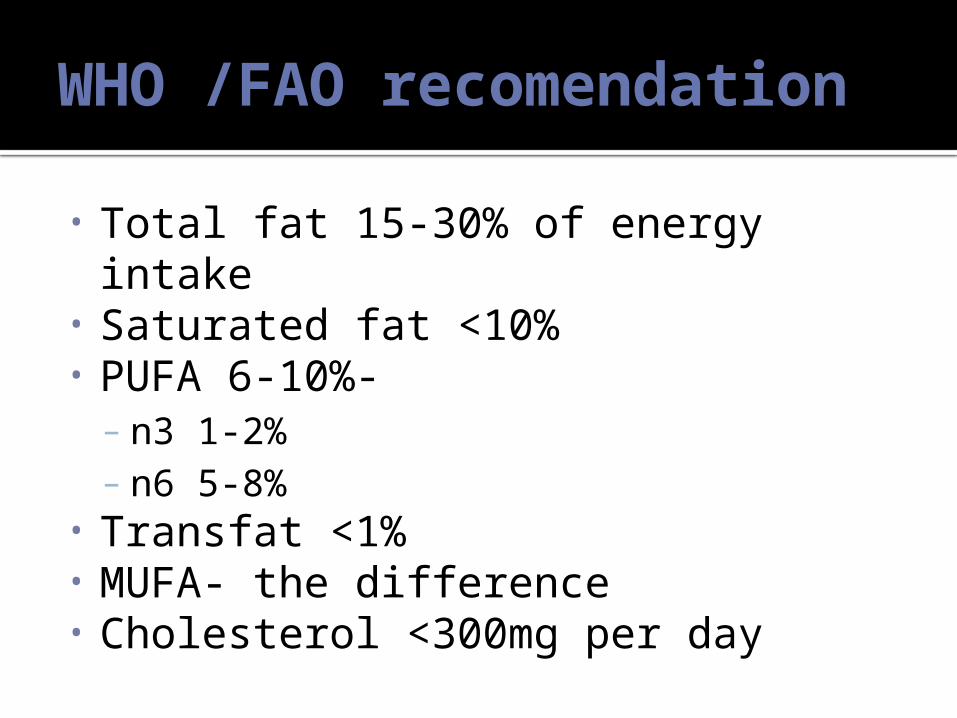
WHO /FAO recomendation
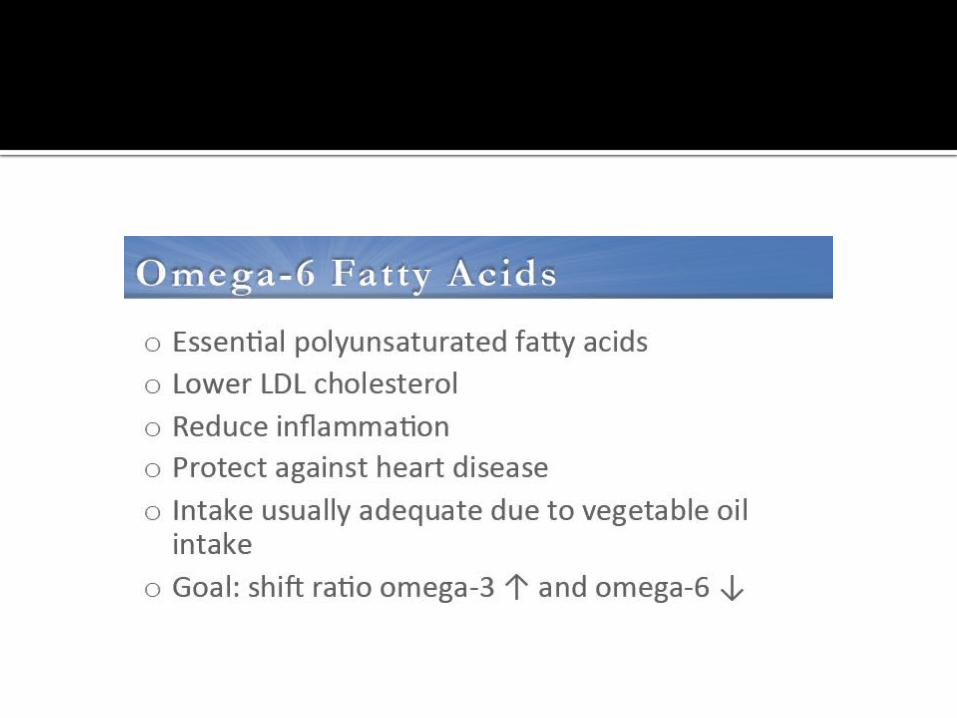
• Total fat 15-30% of energy intake• Saturated fat <10%• PUFA 6-10%- – n3 1-2%– n6 5-8%
• Transfat <1%• MUFA- the difference• Cholesterol <300mg per day

Carbohydrates
• Three major component of CHO– Starch– Sugar– Cellulose
• Glycemic index Area under the 2 hour blood glucose level
following ingestion of 50 gm of test carbohydrate expressed as a proportion against the AUC after ingestion of a standard ( 50gm of glucose or white bread)

The glycemic index (GI) is a ranking of carbohydrates on a scale from 0 to 100 according to the extent to which they raise blood sugar levels after eating.
Foods with a high GI are those which are rapidly digested and absorbed and result in marked fluctuations in blood sugar levels.

Dietary fibres
• It includes polysachharides (cellulose, hemicelulose, pectins), oligosachharides, legnins, butyric acids, poylols ( sorbitol), gums
• Function– Fecal bulking and softening- Crude fiber (cellulose,
hemicellulose, pectins)– Blood cholesterol attenuation– Blood glucose attenuation (gums, pectins)
• Too much fibre hinders absorbtion of micronutrients- ca, fe, zn, mg
• RDA- 40gm per 2000 kcal
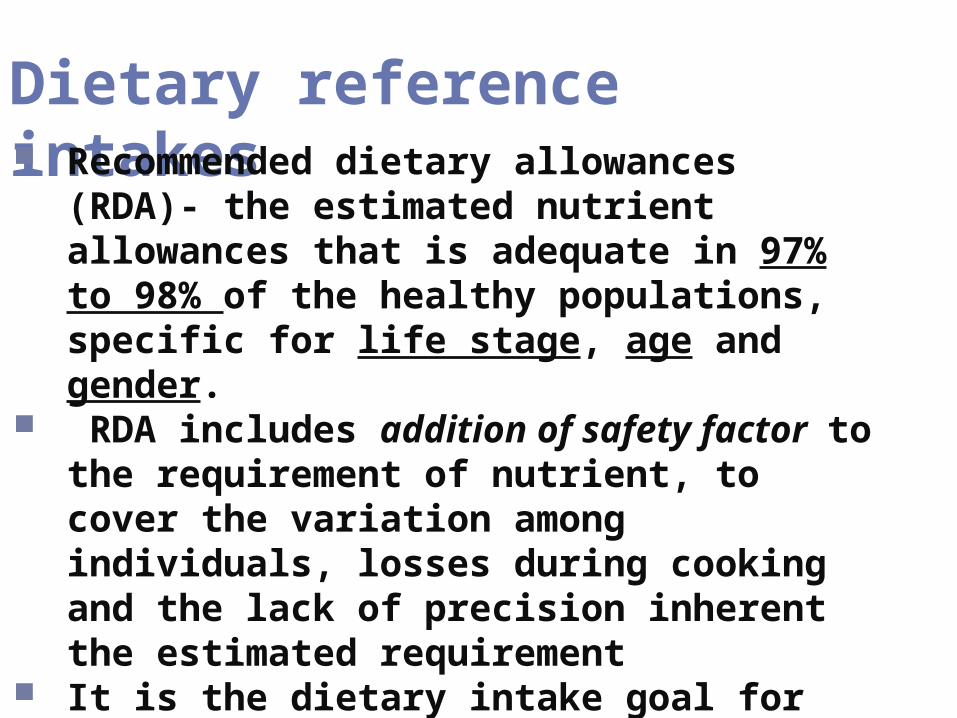
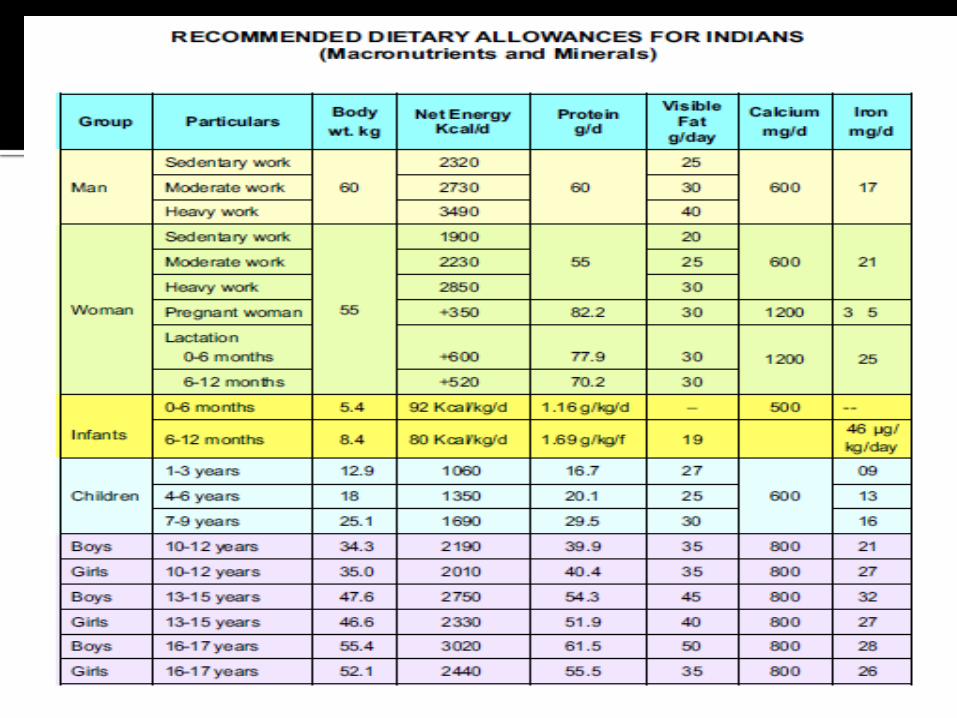
Dietary reference intakes Recommended dietary allowances
(RDA)- the estimated nutrient allowances that is adequate in 97% to 98% of the healthy populations, specific for life stage, age and gender.
RDA includes addition of safety factor to the requirement of nutrient, to cover the variation among individuals, losses during cooking and the lack of precision inherent the estimated requirement
It is the dietary intake goal for individuals.
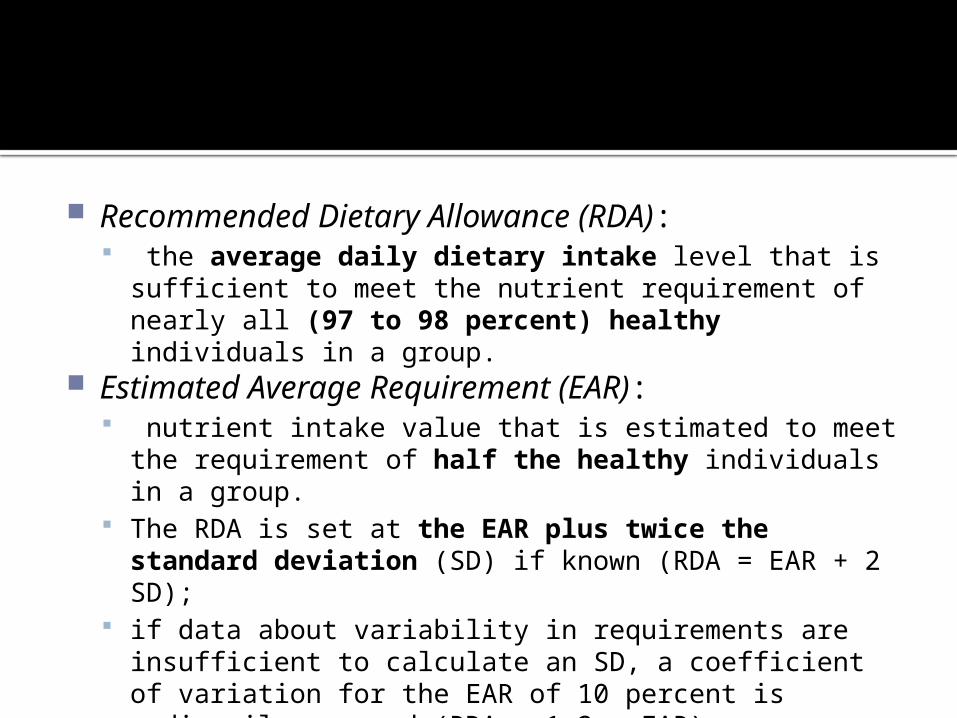
Recommended Dietary Allowance (RDA): the average daily dietary intake level that is
sufficient to meet the nutrient requirement of nearly all (97 to 98 percent) healthy individuals in a group.
Estimated Average Requirement (EAR): nutrient intake value that is estimated to meet the
requirement of half the healthy individuals in a group. The RDA is set at the EAR plus twice the standard
deviation (SD) if known (RDA = EAR + 2 SD); if data about variability in requirements are insufficient
to calculate an SD, a coefficient of variation for the EAR of 10 percent is ordinarily assumed (RDA = 1.2 x EAR).

Adequate Intake (AI): a value based on observed or experimentally
determined approximations of nutrient intake by a group (or groups) of healthy people
used when an RDA cannot be determined. Tolerable Upper Intake Level (UL):
the highest level of daily nutrient intake that is likely to pose no risk of adverse health effects to almost all individuals in the general population.
As intake increases above the UL, the risk of adverse effects increases.
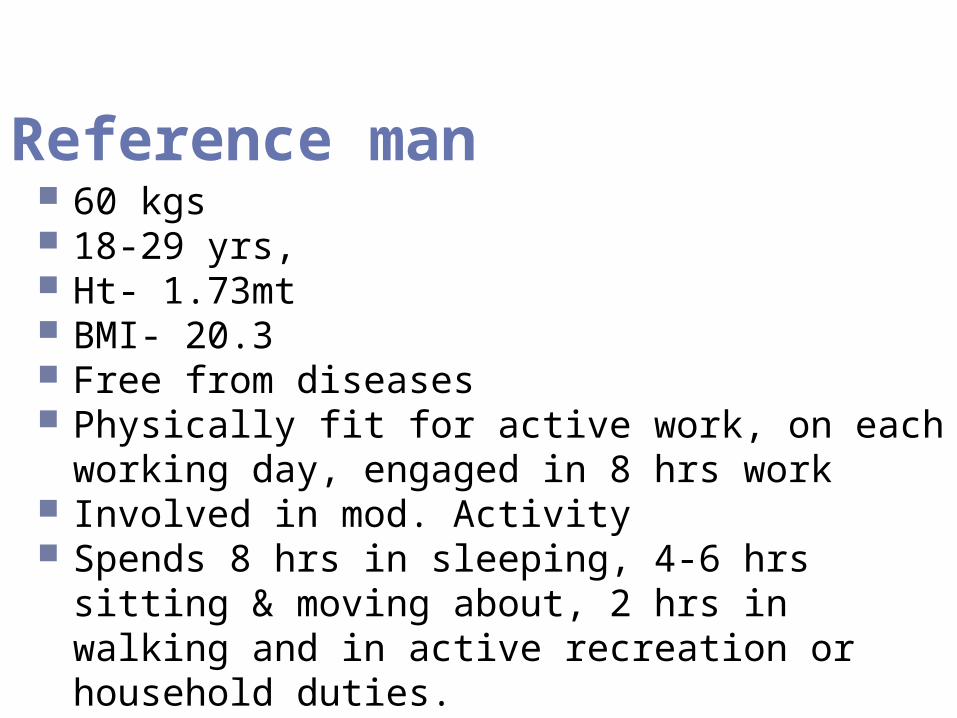
Reference man 60 kgs 18-29 yrs, Ht- 1.73mt BMI- 20.3 Free from diseases Physically fit for active work, on each working
day, engaged in 8 hrs work Involved in mod. Activity Spends 8 hrs in sleeping, 4-6 hrs sitting &
moving about, 2 hrs in walking and in active recreation or household duties.
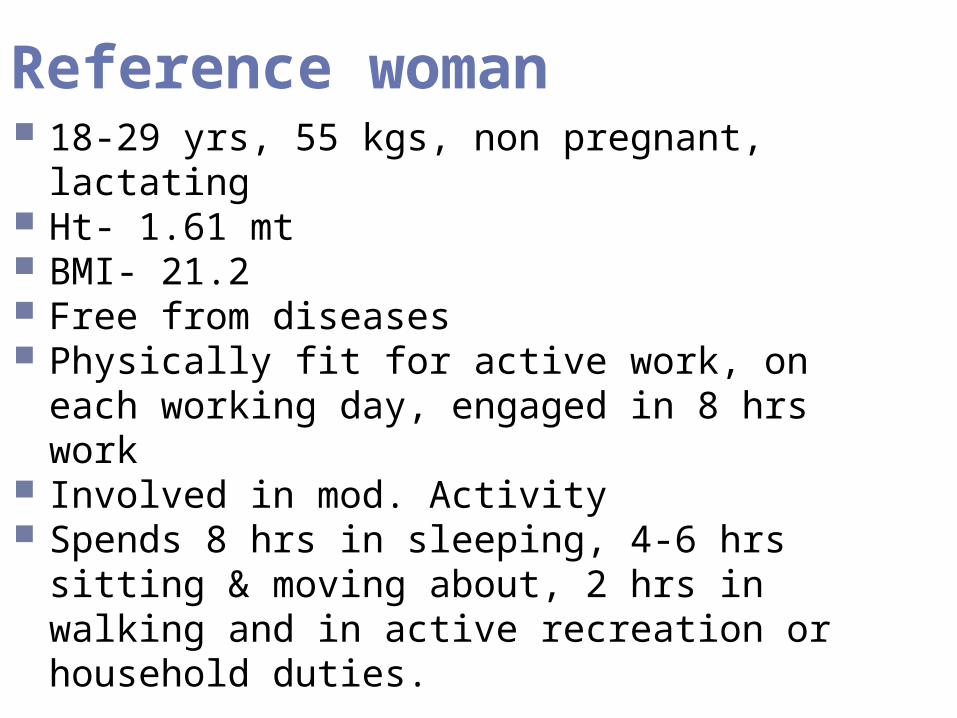
Reference woman 18-29 yrs, 55 kgs, non pregnant, lactating Ht- 1.61 mt BMI- 21.2 Free from diseases Physically fit for active work, on each
working day, engaged in 8 hrs work Involved in mod. Activity Spends 8 hrs in sleeping, 4-6 hrs sitting &
moving about, 2 hrs in walking and in active recreation or household duties.

Moderate work 3 or more days of vigorous activity of at
least 20 min per day 20-50 (9.1-22.7 kg) pounds of force is
exerted 5 or more days of 20-50 pounds intensity
work or walking for at least 30 min per day 5 or more days of any combination of
walking, moderate or vigorous intensity activities
Males-agricultural, labourer, carpenter, mason, welder, coolie, driver, weaver etc
Females-maid servant, basket maker, weaver, agricultural labourer

Heavy work 7 or more days of any combination of
walking, moderate, or vigorous intensity activities
Vigorous intensity activities on at least 3 days
100 pounds or more lifting occasionally or 50 or more pounds of force frequently.
Males- stone-cutter, black smith, mine worker, wood cutter
Females- stone cutter

Sedentary work
Lifting not more than 10 pounds at a time Usually sitting with occasional walking or
standing Standing and walking –total 2 hrs or less
per 8 hrs Sitting- 6 hrs per 8 hrs on work days Males- teacher, executive, priest, barber,
retired personnel, peon. Females- teacher, tailor, executives,
housewives

Nutrition Epidemiology: Epidemiological assessment of nutritional status, nutritional & dietary surveys, nutritional surveillance, nutritional & growth monitoring, nutritional rehabilitation, nutritional indicators and intervention.

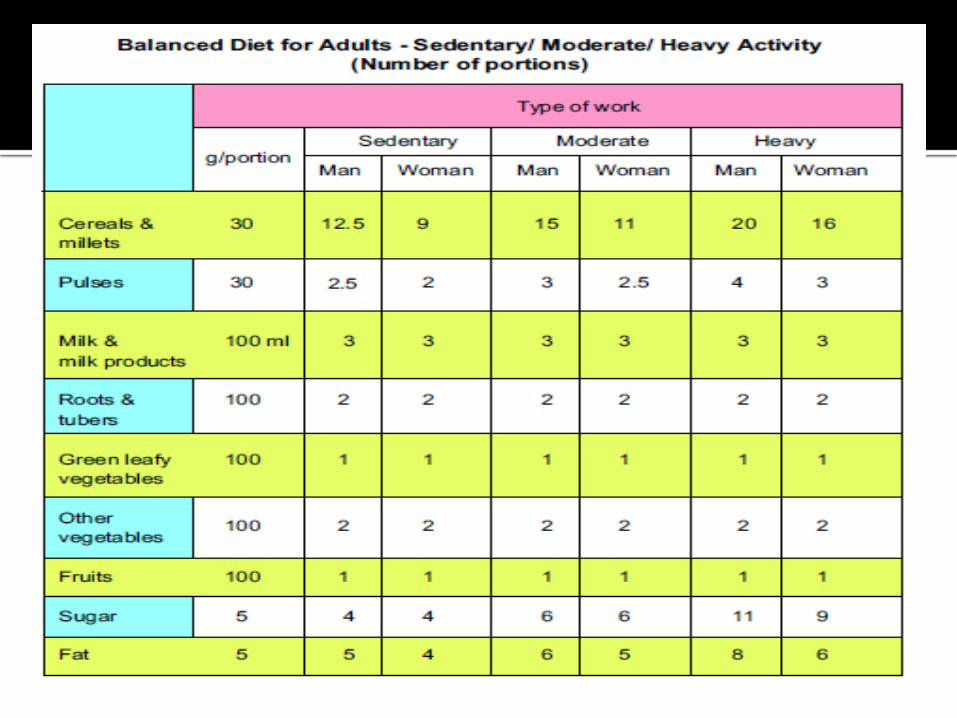
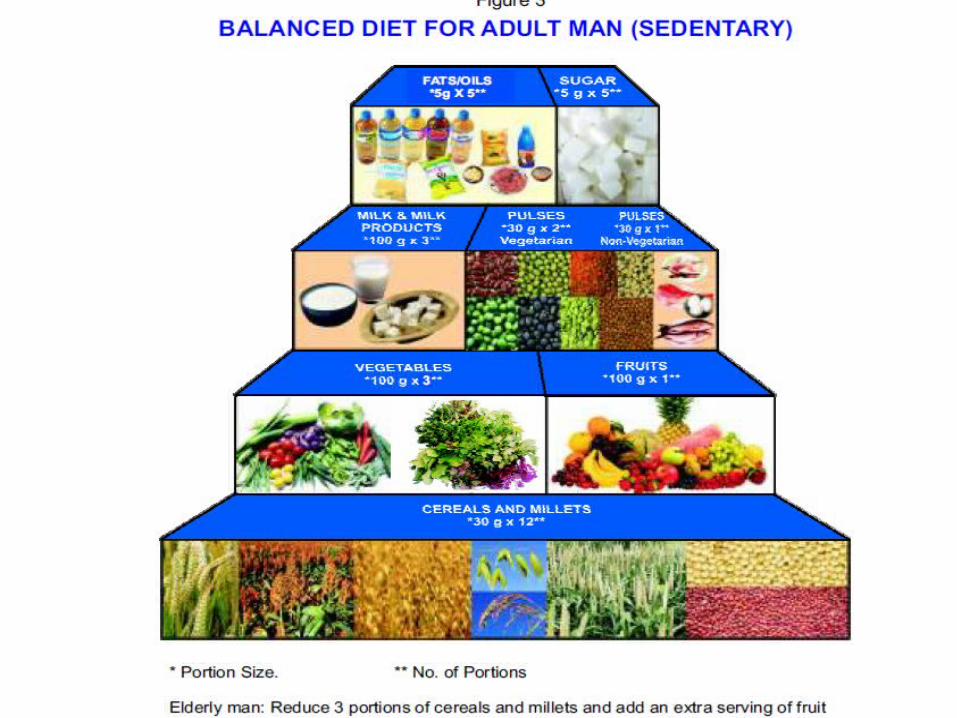
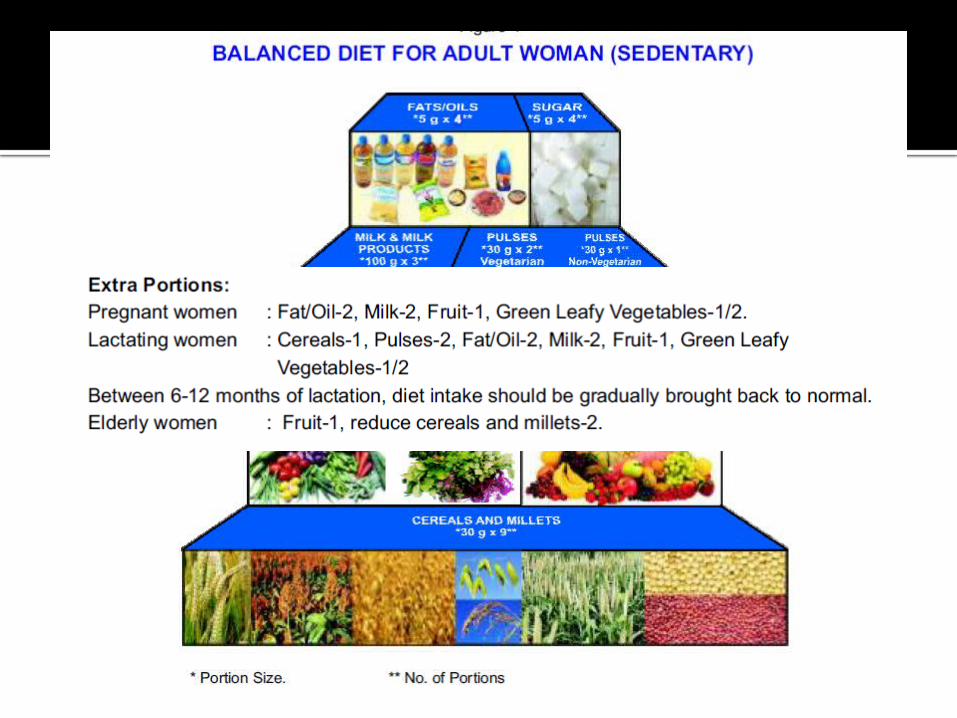
Balanced diet
Diet which contain a variety of food in quantities and proportions that meet the requirement of energy , amino acids, vitamins and minerals for maintaining health and general well bieng.

Principals of balancd diet• Firstly, Requiremnts of protiens should be met- 10-15%
of enery intake• Fat – limited to 15-30%– <10 % saturated– 8-10 PUFA– <1% trans– Rest MUFA
• Carbohydrates should contribute to remaining energy 65-75%– Diet rich in natural fibres– Less of refined sugars
• Restrict alcohol intake• Salt intake less than 5 gm per day• Reduce junk food ( empty calorie foods)


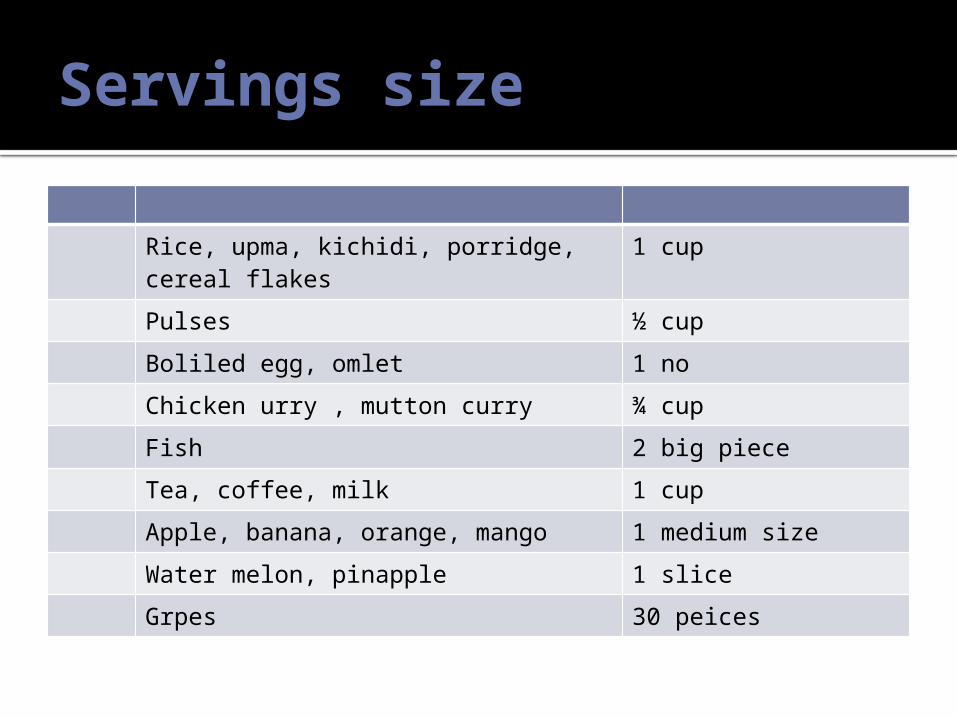
Servings size
Rice, upma, kichidi, porridge, cereal flakes
1 cup
Pulses ½ cup
Boliled egg, omlet 1 no
Chicken urry , mutton curry ¾ cup
Fish 2 big piece
Tea, coffee, milk 1 cup
Apple, banana, orange, mango 1 medium size
Water melon, pinapple 1 slice
Grpes 30 peices

Nutritional problems in public health
Low birth weightProtein energy malnutrition
Gomez classification Waterlows classification▪ Height for age▪ Weight for height
WHO classification Arm circumference

Preventive measures
• Health promotion– Promotion of breast feeding– Low cost weaning foods– Nutrition education– Family planning– Nutritional supplementation
• Specific protection– Providing protien and energy rich food– Immunization– Food fortification
• Early diagnosis and treatment– Periodic surveillance– Treatment of infections– ORT– Supplementary feeding programs– Deworming

Nutritional problems in public health
• Xerophthalmia• Nutritional anemia• Iodine deficiency disorders• Fluorosis• Lathyrism• Cardiovascular diseases• Diabetes• Obesity • Cancer

Food borne diseases
• Disease which is infectious or toxic in anture caused by agents that entre the body through ingestion of food.
• Foodborne intoxication1. naturaly occuring toxins in food– Lathyrism (beta oxylyl amino alanine)– Endemic ascitis (pyrolizidine alkalooids)– Epidemic dropsy ( sanguinarine)2.Toxins produced by bacteria– Botulism– Staphylococus poison3.Toxins produced by fungi– Aflatoxin– Fusarium– Ergot5Food borne chemical poisoning
• Food boren infection
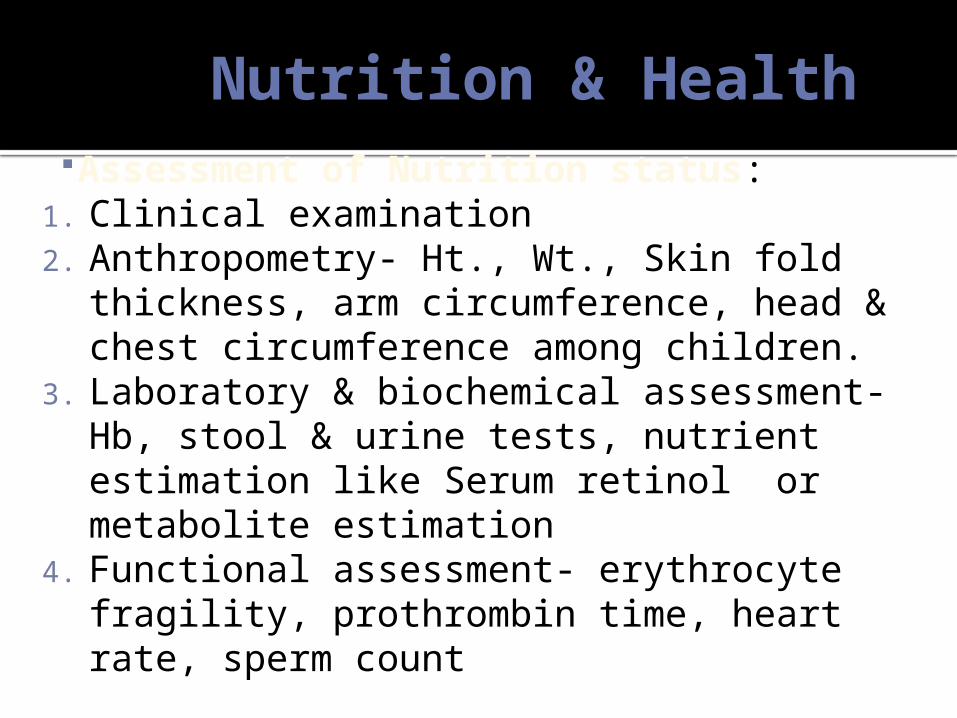
Nutrition & HealthAssessment of Nutrition status:
1. Clinical examination2. Anthropometry- Ht., Wt., Skin fold
thickness, arm circumference, head & chest circumference among children.
3. Laboratory & biochemical assessment- Hb, stool & urine tests, nutrient estimation like Serum retinol or metabolite estimation
4. Functional assessment- erythrocyte fragility, prothrombin time, heart rate, sperm count

Nutrition & HealthAssessment of Nutrition status:4) Assessment of dietary intake
i. Weighment of raw foodii. Weighment of cooked foodiii. 24 hr recall methodiv. Inventory method listv. Expenditure pattern methodvi. Diet historyvii. Duplicate samplesviii. Recording method
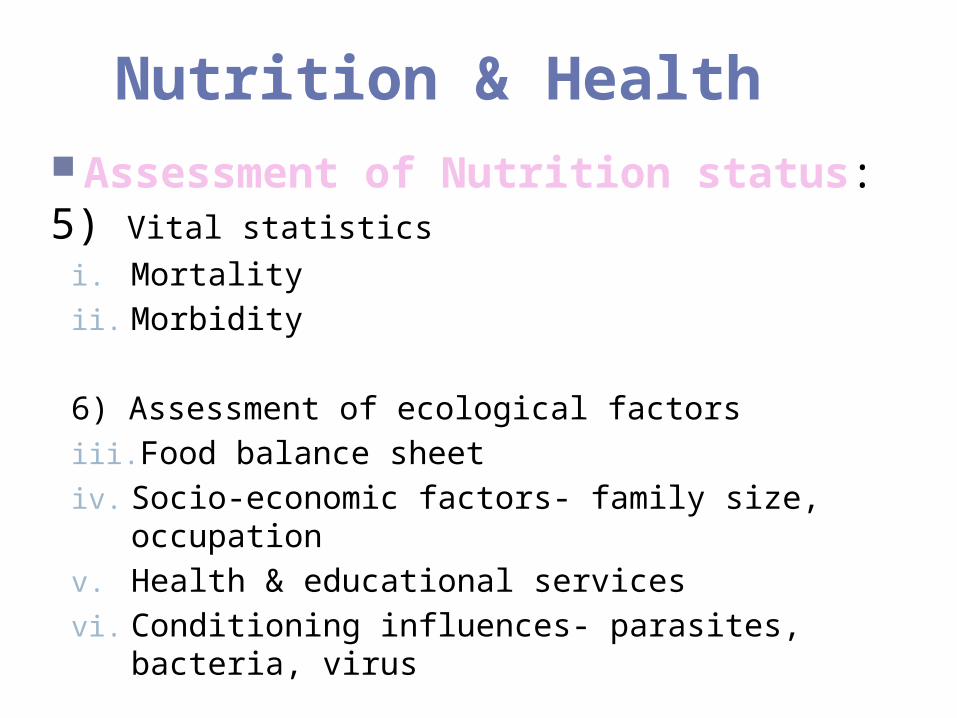
Nutrition & HealthAssessment of Nutrition status:5) Vital statistics
i. Mortalityii. Morbidity
6) Assessment of ecological factorsiii. Food balance sheetiv. Socio-economic factors- family size, occupationv. Health & educational servicesvi. Conditioning influences- parasites, bacteria, virus
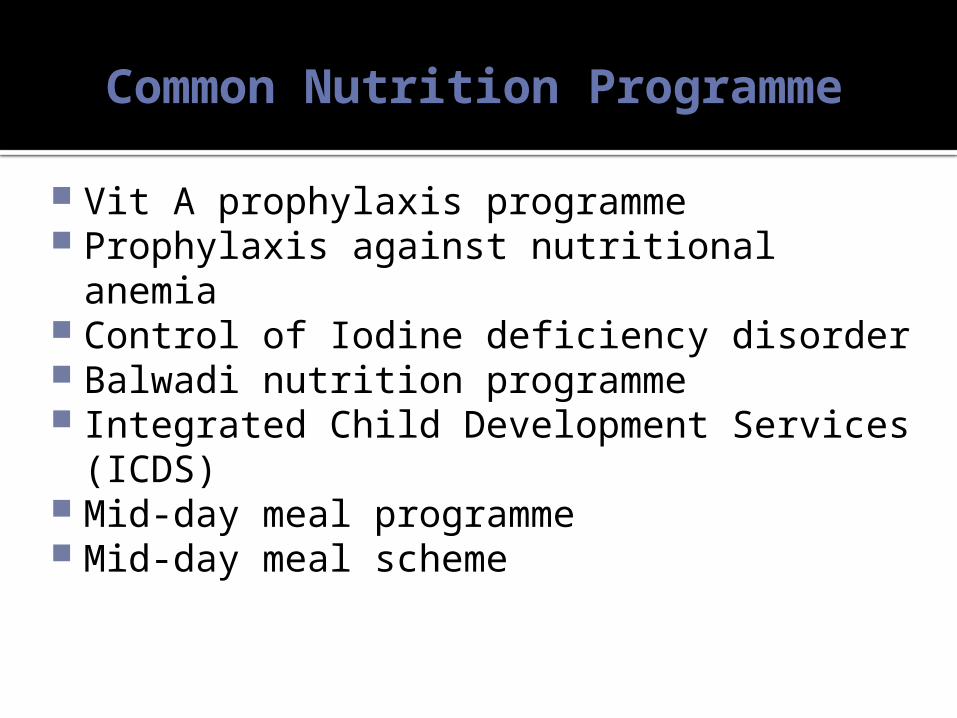
Common Nutrition Programme
Vit A prophylaxis programme Prophylaxis against nutritional anemia Control of Iodine deficiency disorder Balwadi nutrition programme Integrated Child Development Services
(ICDS) Mid-day meal programme Mid-day meal scheme


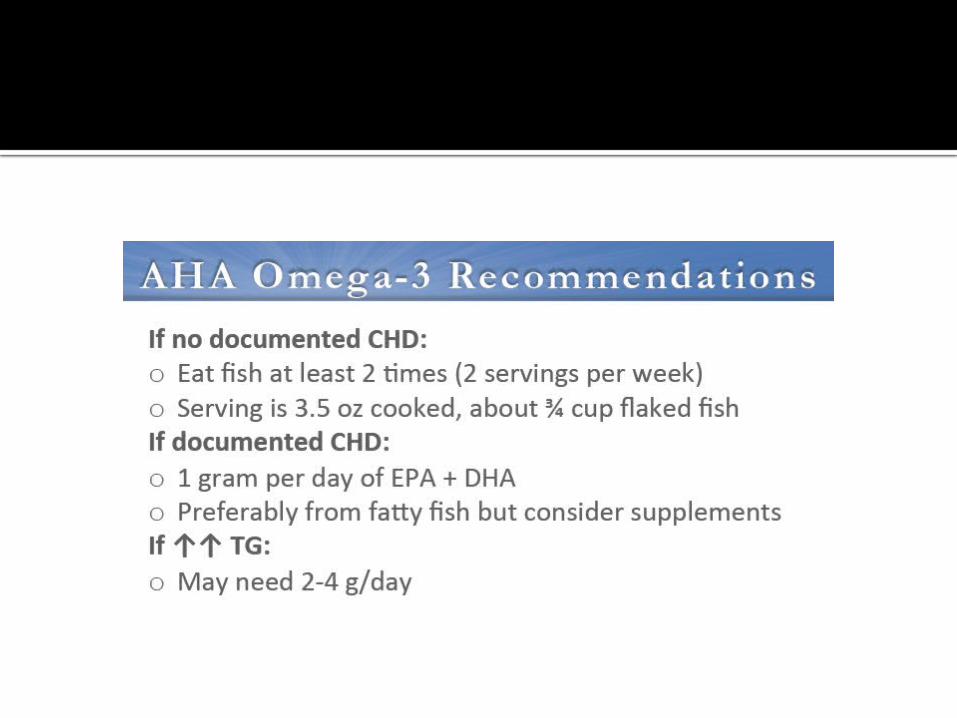
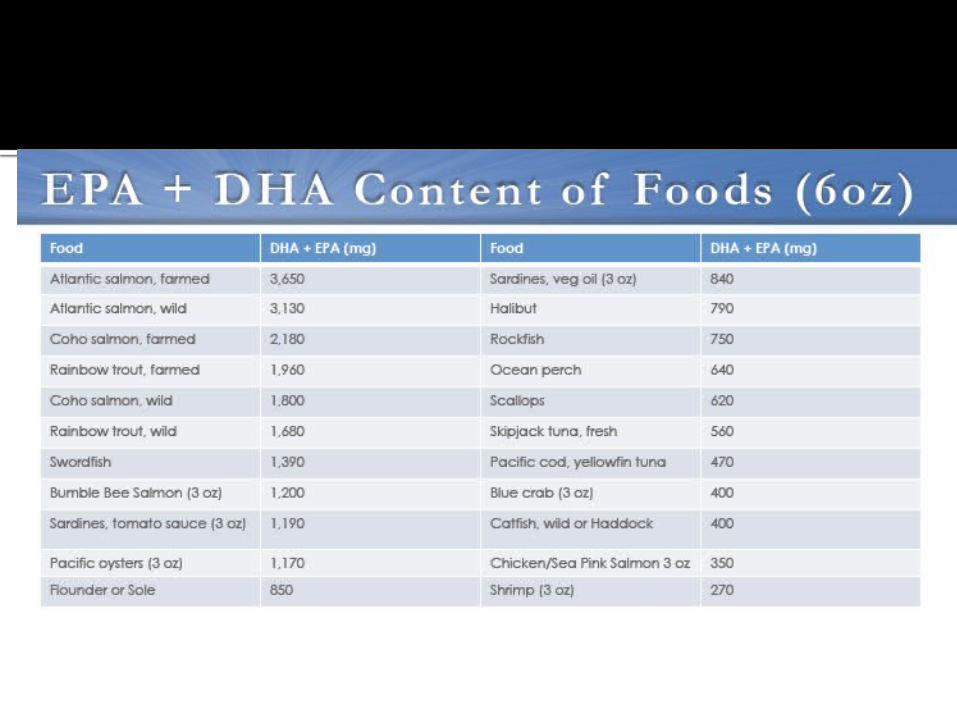

Fish: Friend or foe
Known or likely benefits: eating about 2 grams per week of omega-3 fatty acids in fish, equal to
about one or two servings of fatty fish a week, reduces the chances of dying from heart disease by more than one-third. (1)
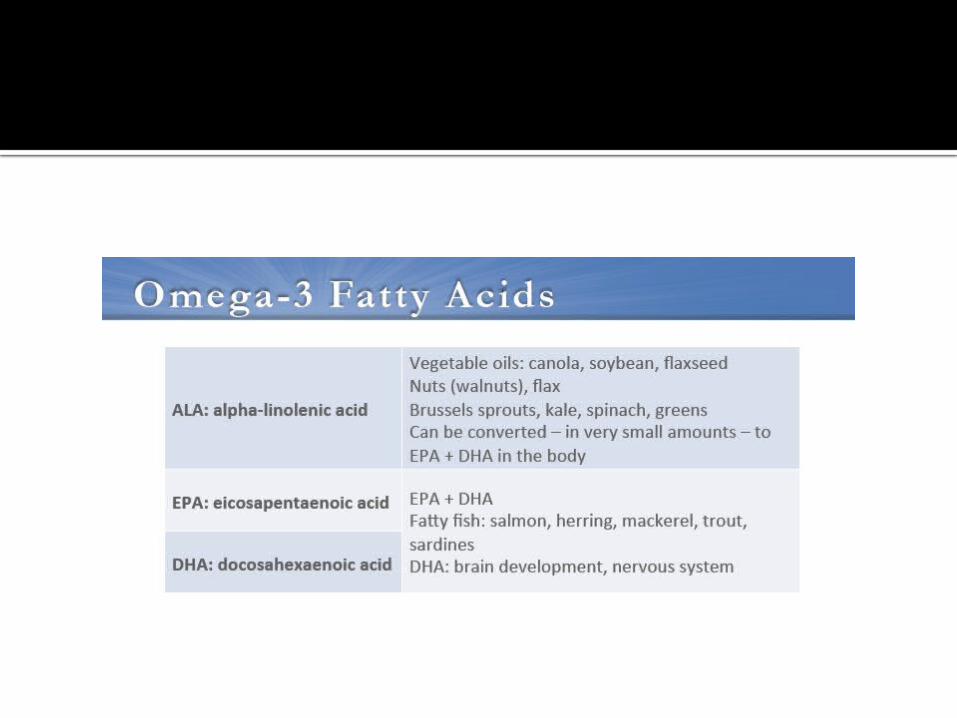
the omega-3 fats in fish are important for optimal development of a baby’s brain and nervous system, and that the children of women who consume lower amounts of fish or omega-3′s during pregnancy and breast-feeding have evidence of delayed brain development.
Possible benefits: Eating fish once or twice a week may also reduce the risk of stroke, depression, Alzheimer’s disease, and other chronic conditions.
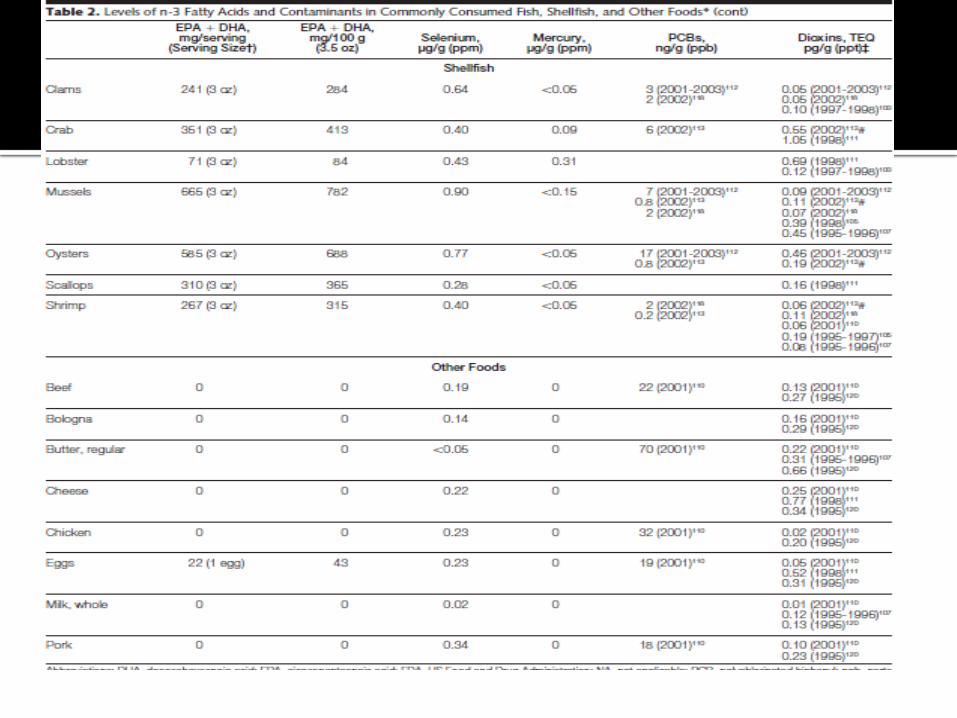
Possible risks: . The contaminants of most concern today are mercury, polychlorinated biphenyls (PCBs), dioxins, and pesticide residues. Very high levels of mercury can damage nerves in adults and disrupt development of the brain and nervous system in a fetus or young child. The effect of the far lower levels of mercury currently found in fish are controversial. They have been linked to subtle changes in nervous system development and a possible increased risk of cardiovascular disease. The case for PCBs and dioxins isn’t so clear. A comprehensive report on the benefits and risks of eating fish compiled by the Institute of Medicine calls the risk of cancer from PCBs “overrated.

Recommendation for fish consumption in pregnancy
Don’t eat shark, swordfish, king mackerel (ayakoora), or tilefish (sometimes called golden bass or golden snapper) because they contain high levels of mercury.
Eat up to 12 ounces (two average meals) a week of a variety of fish and shellfish that are lower in mercury. Shrimp, canned light tuna, salmon, pollock, and catfish are low-mercury fish. Albacore (“white”) tuna has more mercury than canned light tuna. So limit your intake of albacore tuna to once a week. You can find a table of various fish, their omega-3 fatty acid content, and their average load of mercury and other contaminants online in the article by Mozaffarian and Rimm. (1)
Check local advisories about the safety of fish caught by family and friends in your local lakes, rivers, and coastal areas. If no advice is available, eat up to 6 ounces (one average meal) per week of fish you catch from local waters, but don’t consume any other fish during that week.
DASH diet
DASH. In the first DASH trial, which was completed in 1997, half of the 459 participants were assigned to a diet that emphasized fruits, vegetables, and low-fat dairy foods, and that limited red meat, saturated fats, and sweets. The other half got a standard Western diet. All of the participants’ meals were prepared by the DASH kitchen. After eight weeks, the DASH diet reduced systolic blood pressure (the top number of a blood pressure reading) by 11.4 millimeters of mercury (mm Hg) and the diastolic pressure (the bottom number of a blood pressure reading) by 5.5 mm Hg. (4) The second trial looked at the impact of a low-sodium DASH diet. It worked even better. Lower sodium reduced blood pressure whether it was part of the usual U.S. diet or the DASH diet.

Tips to increase fruits and veg intake
Try these tips to fit more fruits and vegetables into your day:
Keep fruit out where you can see it. That way you’ll be more likely to eat it. Keep it out on the counter or in the front of the fridge.
Get some every meal, every day. Try filling half your plate with vegetables or fruit at each meal. Serving up salads, stir fry, or other fruit and vegetable-rich fare makes it easier to reach this goal. Bonus points if you can get some fruits and vegetables at snack time, too.
Explore the produce aisle and choose something new. Variety is the key to a healthy diet. Get out of a rut and try some new fruits and vegetables—include dark green leafy vegetables; yellow, orange, and red fruits and vegetables; cooked tomatoes; and citrus fruits.
Bag the potatoes. Choose other vegetables that are packed with more nutrients and more slowly digested carbs.
Make it a meal. Try some new recipes where vegetables take center stage, such as Tunisian carrot salad and spicy broccolini with red pepper.
Tips for alcohol
1. If you don’t drink, there’s no need to start. For some people—especially pregnant women, people recovering from alcohol addiction, people with a family history of alcoholism, people with liver disease, and people taking one or more medications that interact with alcohol—the risks of drinking outweigh the benefits. There are other ways to boost your heart health and lower your risk of diabetes, such as getting more active, staying at a healthy weight, or eating healthy fats and whole grains.
2. If you do drink, drink in moderation—and choose whatever drink you like. Wine, beer, or spirits—each seems to have the same health benefits as long as moderation’s the word (no more than one drink per day for women, and no more than two drinks per day for men). To read more about whether the type of alcohol consumed has any effect on health, read “Is Wine Fine, or Beer Better?”
3. Take a multivitamin with folic acid. Folic acid is the synthetic form of folate, a B vitamin that may help lower the risk of heart disease and cancers of the colon and breast. Those who drink may benefit the most from getting extra folate, since alcohol moderately depletes our body’s stores. The amount in a standard multivitamin—400 micrograms—is enough, when combined with a healthy diet. To learn more about folate, check out the vitamins section of The Nutrition Source.
4. Ask your doctor about your drinking habits. If you (or your friends) think you may have a problem with drinking, talk to a doctor or other health professional about it. He or she can help.
5. Pick a designated driver. Alcohol and driving do not mix. If you’ve been out drinking cocktails and it’s time to head home, hand your car keys to someone who’s been sipping seltzer all night.