dps antenna verification procedure - transportation.orgshrp2.transportation.org/documents/renewal/3...
TRANSCRIPT

Rich Giessel, Alaska DOT&PFTRB Annual Meeting, January 16, 2019
DPS User Group/TAC Meeting
DPS Antenna Verification Procedure

1. How precise are readings between sensors?2. Will DPS conform to proposed specifications?3. What is important in equipment assembly?4. Is verification data useful for troubleshooting
equipment malfunctions?5. Can antenna verification data be used to
produce post-processing improvements to accuracy and precision?
Why Verify Antennas?

• Proposed AASHTO Specifications for Dielectric Profiling Systems indicate that the Antennas or Sensors on multi-sensor systems should agree with each other within a dielectric value of 0.08 over a polyethylene validation block. Alaska DOT has used an agreement between sensors of 0.12 over an asphalt surface in this presentation.
AASHTO Specifications for DPS

• Setup Field Book• Make certain that antenna check area is
protected by traffic control.
Antenna Verification Setup & Safety


• Set antennas at required spacing (Typically 2’)
Verification Procedure - Step 1
• Mark a base line with 5 marks at the antenna spacing along one side of test area.
Verification Procedure - Step 2
• Layout 5 equal length (12’-36’) parallel lines Perpendicular to the Base line and transverse to the paving direction across one or more newly paved lanes as shown in the next slide.
Verification Procedure - Step 3
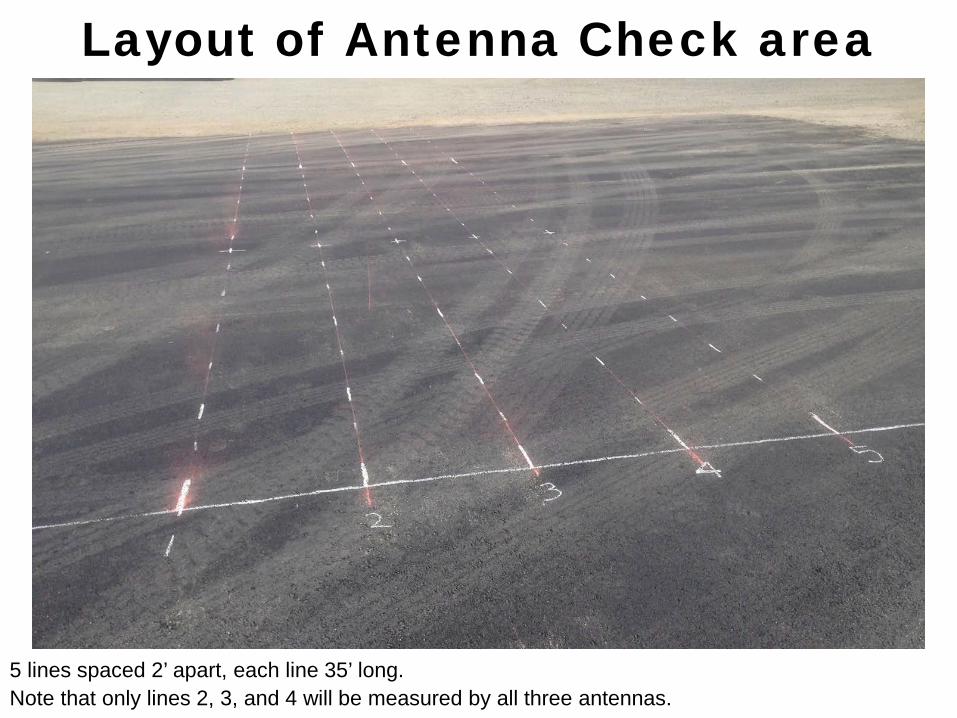
Layout of Antenna Check area
5 lines spaced 2’ apart, each line 35’ long.Note that only lines 2, 3, and 4 will be measured by all three antennas.
• Name a file "Antenna Check" and set offset equal to 0’.
Step 4 - Collecting Data

Collecting Data
Position PaveScan with center antenna right at the marked starting point of Line 1.

• Collect distance file along Line 1. Stop right at the marked end point and save data.
Collecting Data

End Marks for Lines 1-5
Place end marks one foot from paving edge to avoid inclusion of highly irregular readings at pavement edge.

• Increase file offset setting by 2 feet (or the antenna spacing selected for that day).
Collecting Data
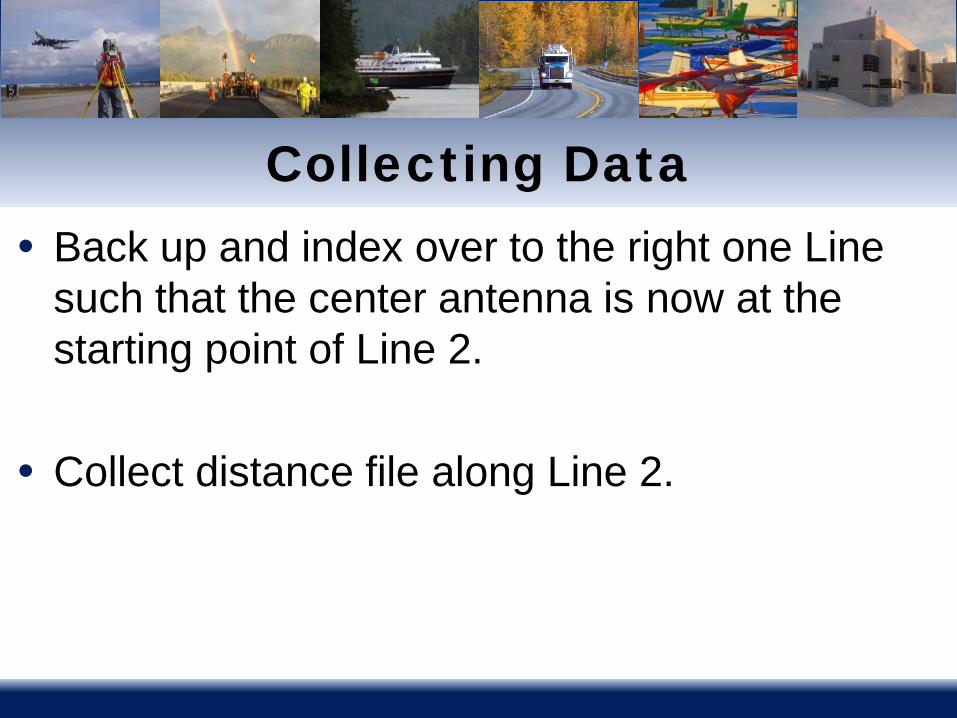
• Back up and index over to the right one Line such that the center antenna is now at the starting point of Line 2.
• Collect distance file along Line 2.
Collecting Data

• Repeat this procedure until center antenna has travelled on Lines 1-5.
• At this point all three antennas will have collected dielectric readings every 0.1’ down the length of Lines 2, 3, 4.
• Average every 5 readings and look at 6” slices of data for ease of viewing.
Collecting Data

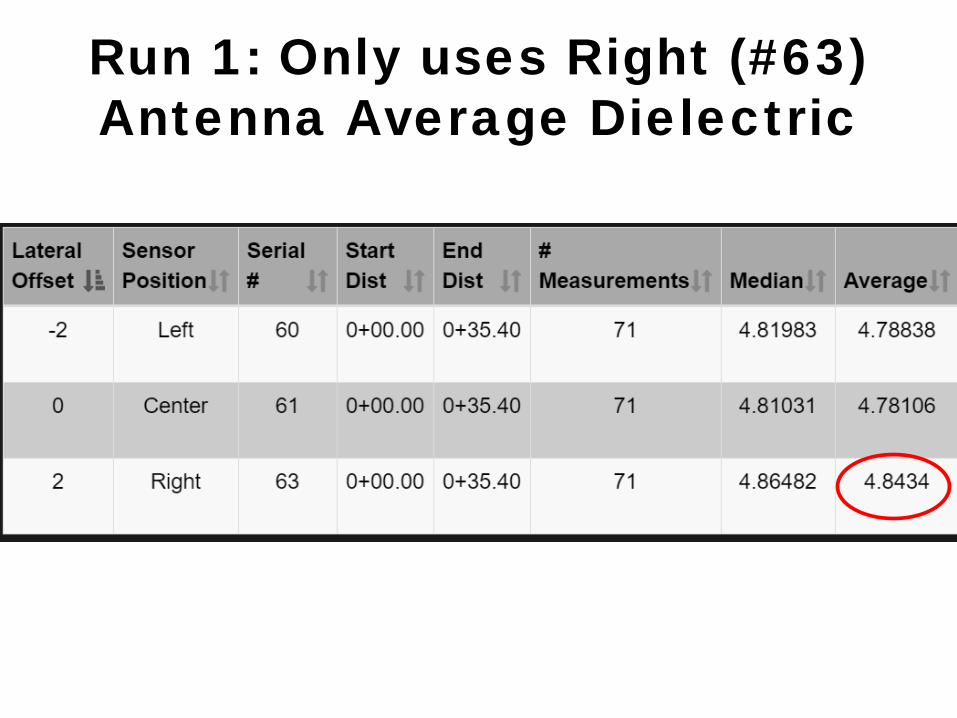
Run 1: Only uses Right (#63) Antenna Average Dielectric

Antenna check: Left - #60 Center - #61 Right - #63 Average ValuesSeptember 5, 2018, 8:15 AMLeft ReferenceOffset (ft): -2 0 2 4 6 8 10
Line 0 Line 1 Line 2 Line 3 Line 4 Line 5 Line 6Run 1 4.84Run 2Run 3Run 4Run 5
LowHighDelta
3 Antenna Overlap lines
Run 1 Data Entry
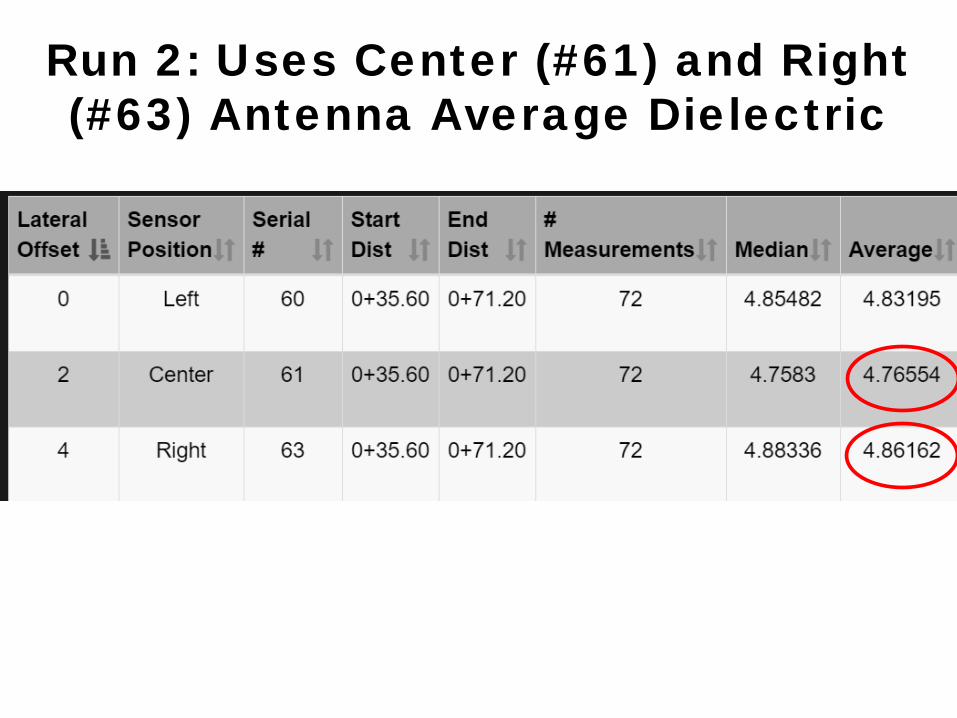
Run 2: Uses Center (#61) and Right (#63) Antenna Average Dielectric

Antenna check: Left - #60 Center - #61 Right - #63 Average ValuesSeptember 5, 2018, 8:15 AMLeft ReferenceOffset (ft): -2 0 2 4 6 8 10
Line 0 Line 1 Line 2 Line 3 Line 4 Line 5 Line 6Run 1 4.84Run 2 4.77 4.86Run 3Run 4Run 5
LowHighDelta
3 Antenna Overlap lines
Run 2 Data Entry

Run 3: Uses Average Dielectric of all three Antennas
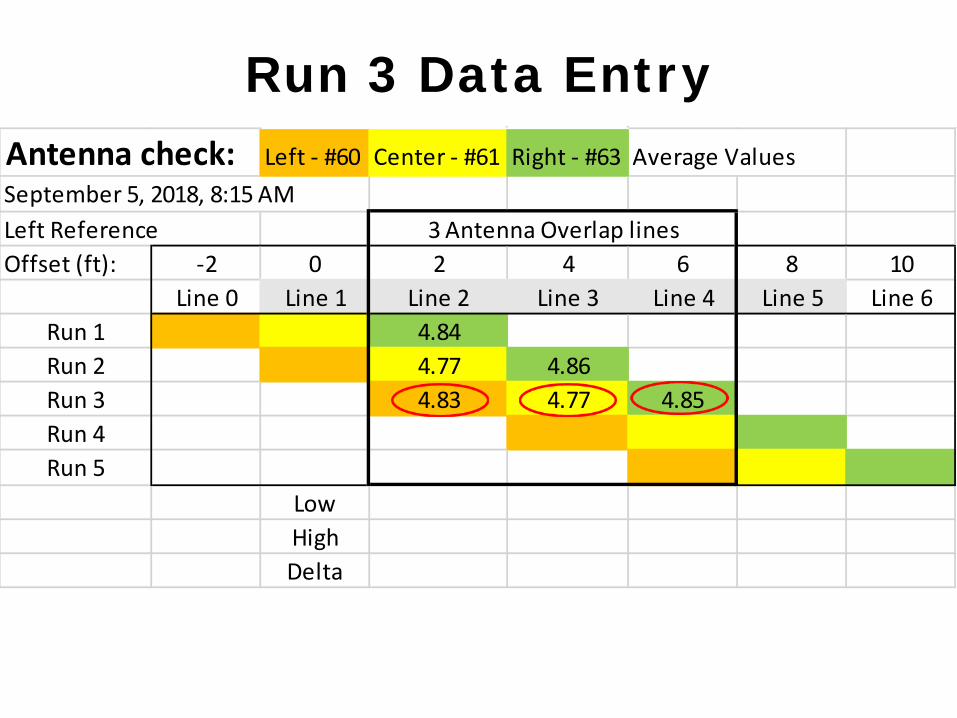
Antenna check: Left - #60 Center - #61 Right - #63 Average ValuesSeptember 5, 2018, 8:15 AMLeft ReferenceOffset (ft): -2 0 2 4 6 8 10
Line 0 Line 1 Line 2 Line 3 Line 4 Line 5 Line 6Run 1 4.84Run 2 4.77 4.86Run 3 4.83 4.77 4.85Run 4Run 5
LowHighDelta
3 Antenna Overlap lines
Run 3 Data Entry
• In walk mode dielectric reading variations among the three antennas should be within 0.12
Analyzing Data

Antenna check: Left - #60 Center - #61 Right - #63September 5, 2018, 8:15 AMAntenna Reference 3 Antenna Overlap linesOffset (ft)--> -2 0 2 4 6 8 10
Line 0 Line 1 Line 2 Line 3 Line 4 Line 5 Line 6Run 1 4.84Run 2 4.77 4.86Run 3 4.83 4.77 4.85Run 4 4.81 4.76Run 5 4.80
Low 4.77 4.77 4.76High 4.84 4.86 4.85Delta 0.08 0.09 0.09
Left - # 60 Lines 2, 3, 4, Average = 4.81Ctr - # 61 Lines 2, 3, 4, Average = 4.77Right - # 63 Lines 2, 3, 4, Average = 4.85
Low 4.77High 4.85
Delta 0.09 PASS < 0.12 is Passing
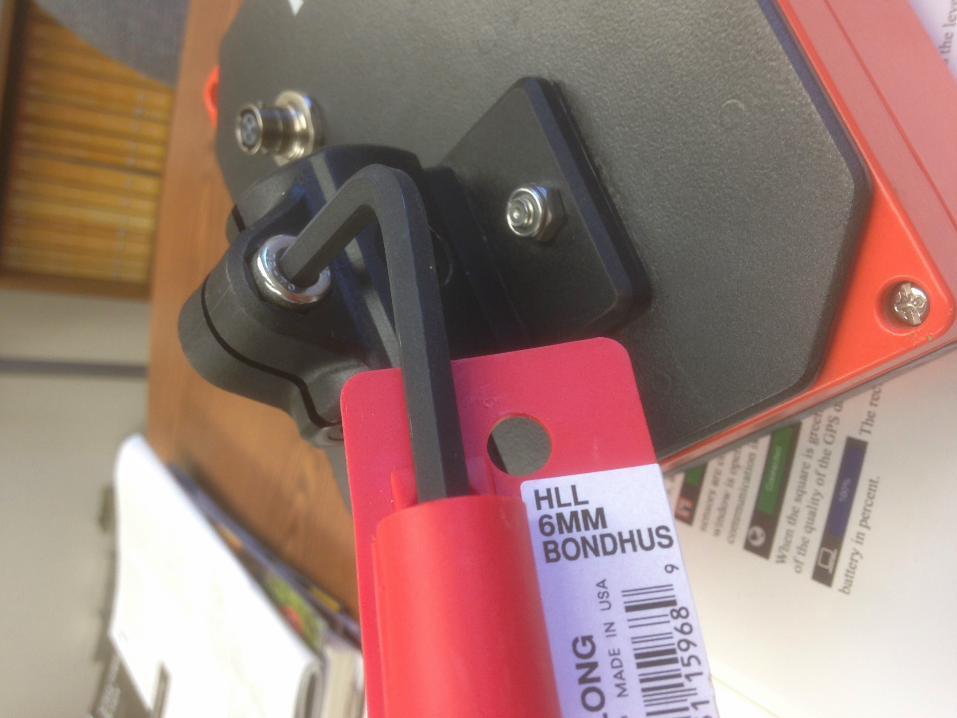
• If variation is greater than 0.12 check that all antenna cables and mounting bolts are tight.
• If loose electrical connections or bolts are found, tighten them and recalibrate the PaveScan RDM with new Air and Metal plate readings.
• Rescan the five lines.
Trouble Shooting


• If the outward Mechanical and electrical connections are sound then there could be an internal problem with the Sensors.
• Here is what to look for in the antenna check runs…
Trouble Shooting 2

Center Antenna Reading Low

Antenna check: Left - #60 Center - #61 Right - #63 Average Values
Left ReferenceOffset (ft): -2 0 2 4 6 8 10
Line 0 Line 1 Line 2 Line 3 Line 4 Line 5 Line 6Run 1 5.85 5.67 5.84Run 2 5.85 5.69 5.92Run 3 5.86 5.73 5.88Run 4 5.90 5.75 5.92Run 5 5.88 5.75 5.89
Low 5.69 5.73 5.75High 5.86 5.92 5.88Delta 0.17 0.19 0.14
Left - # 60 Lines 2, 3, 4, Average = 5.88Ctr - # 61 Lines 2, 3, 4, Average = 5.72Right - # 63Lines 2, 3, 4, Average = 5.88
Low 5.72High 5.88
Delta 0.16 FAIL < 0.12 is Passing
3 Antenna Overlap lines

Center Antenna Reading High

Antenna check: Left - #60 Center - #61 Right - #63 Average Values
Left ReferenceOffset (ft): -2 0 2 4 6 8 10
Line 0 Line 1 Line 2 Line 3 Line 4 Line 5 Line 6Run 1 5.77342 5.81628 5.74772Run 2 5.75366 5.85743 5.77178Run 3 5.79668 6.26623 5.77558Run 4 5.81111 5.91457 5.74399Run 5 5.78530 5.87794 5.74490
Low 5.75 5.77 5.78High 5.86 6.27 5.91Delta 0.11 0.49 0.14
Left - # 60 Lines 2, 3, 4, Average = 5.80Ctr - # 61 Lines 2, 3, 4, Average = 6.01Right - # 63Lines 2, 3, 4, Average = 5.77
Low 5.77High 6.01
Delta 0.25 FAIL < 0.12 is Passing
3 Antenna Overlap lines
Possible Precision Improvements Using the “AKAVAC” Method

Statistics for 10 Check RunsAntenna check: Left - #60 Center - #61 Right - #63 Average Values
(All runs)
Average Max Min RangeLeft - # 60 Lines 2, 3, 4, Average = 4.79 4.84 4.74 0.10Center - # 61 Lines 2, 3, 4, Average = 4.79 4.82 4.76 0.06Right - # 63 Lines 2, 3, 4, Average = 4.84 4.87 4.83 0.04
Low 4.79High 4.84
Delta 0.05 PASS < 0.12 is Passing
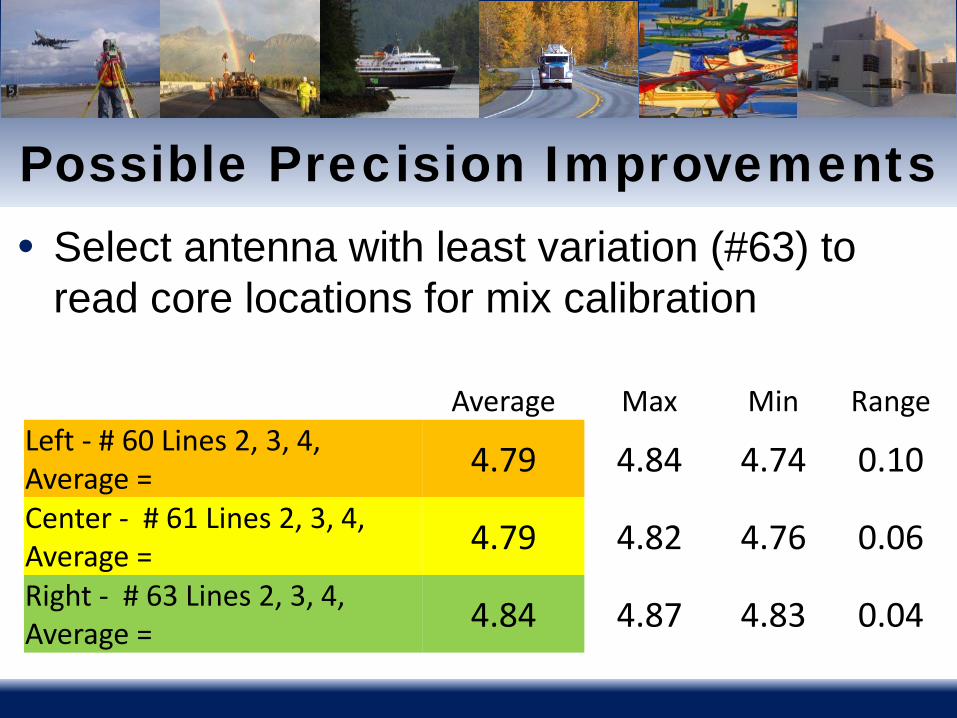
• Select antenna with least variation (#63) to read core locations for mix calibration
Possible Precision Improvements
Average Max Min RangeLeft - # 60 Lines 2, 3, 4, Average = 4.79 4.84 4.74 0.10Center - # 61 Lines 2, 3, 4, Average = 4.79 4.82 4.76 0.06Right - # 63 Lines 2, 3, 4, Average = 4.84 4.87 4.83 0.04

• Correct other two antennas to the calibration antenna
Possible Precision Improvements
Average Correction New
Left - # 60 Lines 2, 3, 4, Average = 4.79 0.05 4.84Ctr - # 61 Lines 2, 3, 4, Average = 4.79 0.05 4.84Right - # 63 Lines 2, 3, 4, Average = 4.84 - 4.84
• Post process data with antenna correction factor to improve accuracy of density mapping
• Note that this correction would only apply for this particular asphalt mix design
Possible Precision Improvements
• In this example we used Antenna #63 as Master
• We could then correct readings from antennas #60 and #61 by adding a dielectric value of 0.05 to all dielectric values collected by these two antennas
Possible Precision Improvements
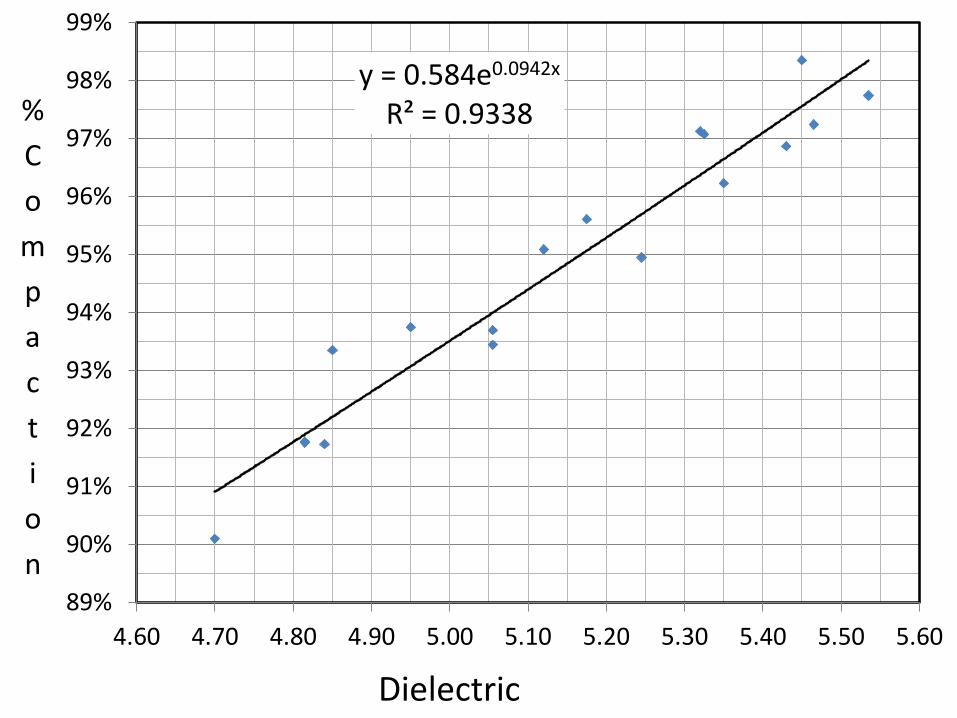
y = 0.584e0.0942x
R² = 0.9338
89%
90%
91%
92%
93%
94%
95%
96%
97%
98%
99%
4.60 4.70 4.80 4.90 5.00 5.10 5.20 5.30 5.40 5.50 5.60
%Compaction
Dielectric

• The calibration graph indicates that a Dielectric correction of 0.05 would improve Compaction correlation between antennas by 0.5% for this asphalt mix with this PaveScan machine.
Possible Precision Improvements
