dplyr use case
TRANSCRIPT

dplyr use caseRomain François
@romain_francois
#satRday/Budapest
romainfrancois

%>%


enjoy(cool(bake(shape(beat(append(bowl(rep("flour", 2), "yeast", "water", "milk", "oil"), "flour", until = "soft"), duration = "3mins"), as = "balls", style = "slightly-flat"), degrees = 200, duration = "15mins"), duration = "5mins"))
bowl(rep("flour", 2), "yeast", "water", "milk", "oil") %>% append("flour", until = "soft") %>% beat(duration = "3mins") %>% shape(as = "balls", style = "slightly-flat") %>% bake(degrees = 200, duration = "15mins") %>% cool(buns, duration = "5mins") %>% enjoy()


tmp <- tempfile( fileext = ".xlsx") download.file("http://bit.ly/2bPaiyU", tmp )
data <- readxl::read_excel(tmp)

All caps column names with spaces> names(data) [1] "DESTINATION" "COMMERCIAL FLAG" "CITY" "REGION" [5] "COUNTRY" "FLIGH DIRECTION" "FLIGHT TYPE" "DATE" [9] "DATE YEAR" "DATE HALF YEAR" "DATE YEAR QUARTER" "DATE YEAR MONTH" [13] "NBR OF PASSENGERS" "CARGO WEIGHT" "NBR OF FLIGHTS" "SEAT CAPACITY"

> unique( data[["COMMERCIAL FLAG"]] ) [1] "Commercial"
> summary( as.factor( data[["REGION"]] ) ) China VH China ZB China ZS Germany ED Germany ET India VA India VI 68 127 3 2160 9 3 1 Japan RJ Russia UI Russia UL Russia UN Russia UR Russia US Russia UU 63 1 167 7 62 59 340 Russia UW Spain GC Spain LE USA KA USA KB USA KC USA KD 6 205 870 4 7 5 19 USA KE USA KI USA KJ USA KM USA KP USA KT USA KW 3 1 114 2 4 2 5 NA's 14520

> data %>% select( starts_with( "DATE") ) # A tibble: 18,837 x 5 DATE DATE YEAR DATE HALF YEAR DATE YEAR QUARTER DATE YEAR MONTH <time> <dbl> <chr> <chr> <chr> 1 2010-11-01 2010 2010H2 2010Q4 201011 2 2010-12-01 2010 2010H2 2010Q4 201012 3 2011-01-01 2011 2011H1 2011Q1 201101 4 2007-05-01 2007 2007H1 2007Q2 200705 5 2011-07-01 2011 2011H2 2011Q3 201107 6 2010-07-01 2010 2010H2 2010Q3 201007 7 2010-04-01 2010 2010H1 2010Q2 201004 8 2012-06-01 2012 2012H1 2012Q2 201206 9 2009-02-01 2009 2009H1 2009Q1 200902 10 2009-10-01 2009 2009H2 2009Q4 200910 # ... with 18,827 more rows

> data %>% + filter( `NBR OF PASSENGERS` == 0 & `CARGO WEIGHT` == 0 ) %>% + group_by( CITY, `DATE YEAR MONTH`, `FLIGH DIRECTION` ) %>% + summarise( flights = sum( `NBR OF FLIGHTS` ) ) %>% + arrange( desc(flights) ) Source: local data frame [2,417 x 4] Groups: CITY, DATE YEAR MONTH [2,023]
CITY DATE YEAR MONTH FLIGH DIRECTION flights <chr> <chr> <chr> <dbl> 1 Timisoara 200911 Incoming 26 2 Arad 200701 Incoming 23 3 Arad 200801 Outgoing 22 4 Cluj Napoca 201110 Incoming 22 5 Arad 200801 Incoming 21 # ...
Empty flights

> data %>%
+ filter( `SEAT CAPACITY` < `NBR OF PASSENGERS` ) %>% + group_by( CITY ) %>% + summarise( + flights = sum( `NBR OF FLIGHTS` ), + passengers = sum( `NBR OF PASSENGERS`), + capacity = sum( `SEAT CAPACITY`) + ) %>% + arrange( desc(flights) ) # A tibble: 8 x 4 CITY flights passengers capacity <chr> <dbl> <dbl> <dbl> 1 Hurghada 32 5229 4665 2 Tenerife Sur 4 760 756 3 Djerba 3 530 510 4 Amsterdam 2 245 241
Empty flights


flights <- data %>% `names<-`( casefold(gsub( " ", "_", names(data))) ) %>% rename( direction = fligh_direction, type = flight_type ) %>% mutate( year = date_year, month = as.numeric(substr(date_year_month, 5, 6)), no_passengers = nbr_of_passengers==0, no_weight = cargo_weight==0 ) %>% group_by( year, month, country, city, direction ) %>% summarise( passengers = sum(nbr_of_passengers), weight = sum(cargo_weight), capacity = sum(seat_capacity), flights = sum(nbr_of_flights), scheduled = sum(nbr_of_flights[type == "Scheduled"] ), non_scheduled = flights - scheduled, flights_no_passengers = sum( nbr_of_flights[no_passengers] ), flights_no_weight = sum( nbr_of_flights[no_weight] ), flights_empty = sum( nbr_of_flights[no_passengers & no_weight]), filling = passengers / capacity ) %>% arrange( year, month, country, city, direction ) %>% ungroup

> glimpse(flights) Observations: 14,772 Variables: 14 $ year <dbl> 2007, 2007, 2007, 2007, 2007, 2007, 2007, 2007, 2007, 2007,... $ month <dbl> 1, 1, 1, 1, 1, 1, 1, 1, 1, 1, 1, 1, 1, 1, 1, 1, 1, 1, 1, 1,... $ country <chr> "Albania", "Albania", "Austria", "Austria", "Azerbaijan", "... $ city <chr> "Tirana", "Tirana", "Wien", "Wien", "Baku", "Brussels", "Br... $ direction <chr> "Incoming", "Outgoing", "Incoming", "Outgoing", "Incoming",... $ passengers <dbl> 2448, 1429, 2530, 3126, 0, 4310, 5362, 2760, 3269, 0, 37, 1... $ weight <dbl> 0, 0, 0, 0, 597393, 598235, 7343, 0, 0, 0, 0, 0, 0, 0, 0, 2... $ capacity <dbl> 4024, 4024, 5684, 5673, 2365, 8951, 8922, 4320, 4320, 50, 5... $ flights <dbl> 44, 44, 91, 90, 15, 95, 87, 24, 24, 1, 1, 24, 24, 3, 3, 68,... $ scheduled <dbl> 44, 44, 91, 89, 15, 95, 87, 24, 24, 0, 0, 24, 24, 0, 0, 68,... $ non_scheduled <dbl> 0, 0, 0, 1, 0, 0, 0, 0, 0, 1, 1, 0, 0, 3, 3, 0, 3, 0, 0, 0,... $ flights_no_passengers <dbl> 0, 0, 0, 1, 15, 0, 0, 0, 0, 1, 0, 0, 0, 0, 0, 0, 0, 0, 0, 0... $ flights_no_weight <dbl> 44, 44, 91, 90, 0, 0, 0, 24, 24, 1, 1, 24, 24, 3, 3, 0, 3, ... $ flights_empty <dbl> 0, 0, 0, 1, 0, 0, 0, 0, 0, 1, 0, 0, 0, 0, 0, 0, 0, 0, 0, 0,...


> places <- with( distinct( flights, city, country ), paste(city, country, sep = ", ") ) > > p <- progress_estimated(length(places)) > coords <- tbl_df( bind_rows( lapply(places, function(place){ + res <- geocode( place )[1, ] + Sys.sleep( .2 ) # otherwise geocode wont let us get all the data + p$tick()$print() + res + }) ) ) |==== | 8% ~2 m remaining
> glimpse(cities) Observations: 484 Variables: 10 $ city <chr> "Mazari Sharif", "Bagram Air Base", "Kabul", "Kandahar", "Tirana... $ country <chr> "Afghanistan", "Afghanistan", "Afghanistan", "Afghanistan", "Alb... $ interpretedPlace <chr> "Mazari Sharif, Afghanistan", "Bagram Airfield, Bagram, Afghanis... $ longitude <dbl> 67.117951, 69.273567, 69.207486, 65.737175, 19.818698, -2.214323... $ latitude <dbl> 36.69262, 34.94448, 34.55535, 31.62887, 41.32755, 31.61825, 22.7... $ xmin <dbl> 67.060633, 69.272218, 68.949509, 65.669574, 19.753568, -2.404461... $ xmax <dbl> 67.235212, 69.274916, 69.445953, 65.830765, 19.882078, -1.352005... $ ymin <dbl> 36.65382, 34.94313, 34.34549, 31.59740, 41.29512, 31.18248, 20.8... $ ymax <dbl> 36.75264, 34.94582, 34.76192, 31.67252, 41.36684, 32.04475, 23.6... $ uncertainty <dbl> 6692, 194, 31670, 7302, 6535, 51589, 150488, 239610, 12129, 1738...


Who went to Budapest in summer 2011 ?

flights %>% filter( direction == "Incoming", month %in% c(7,8), year == 2011 ) %>% group_by( country ) %>% summarise( passengers = sum(passengers), flights = sum(flights) ) %>% arrange( desc(passengers) )
Summer
Goes to Budapest

flights %>% filter( direction == "Incoming", month %in% c(7,8), year == 2011 ) %>% group_by( country ) %>% summarise( passengers = sum(passengers), flights = sum(flights) ) %>% arrange( desc(passengers) )
Who

flights %>% filter( direction == "Incoming", month %in% c(7,8), year == 2011 ) %>% group_by( country ) %>% summarise( passengers = sum(passengers), flights = sum(flights) ) %>% arrange( desc(passengers) )
Summarise
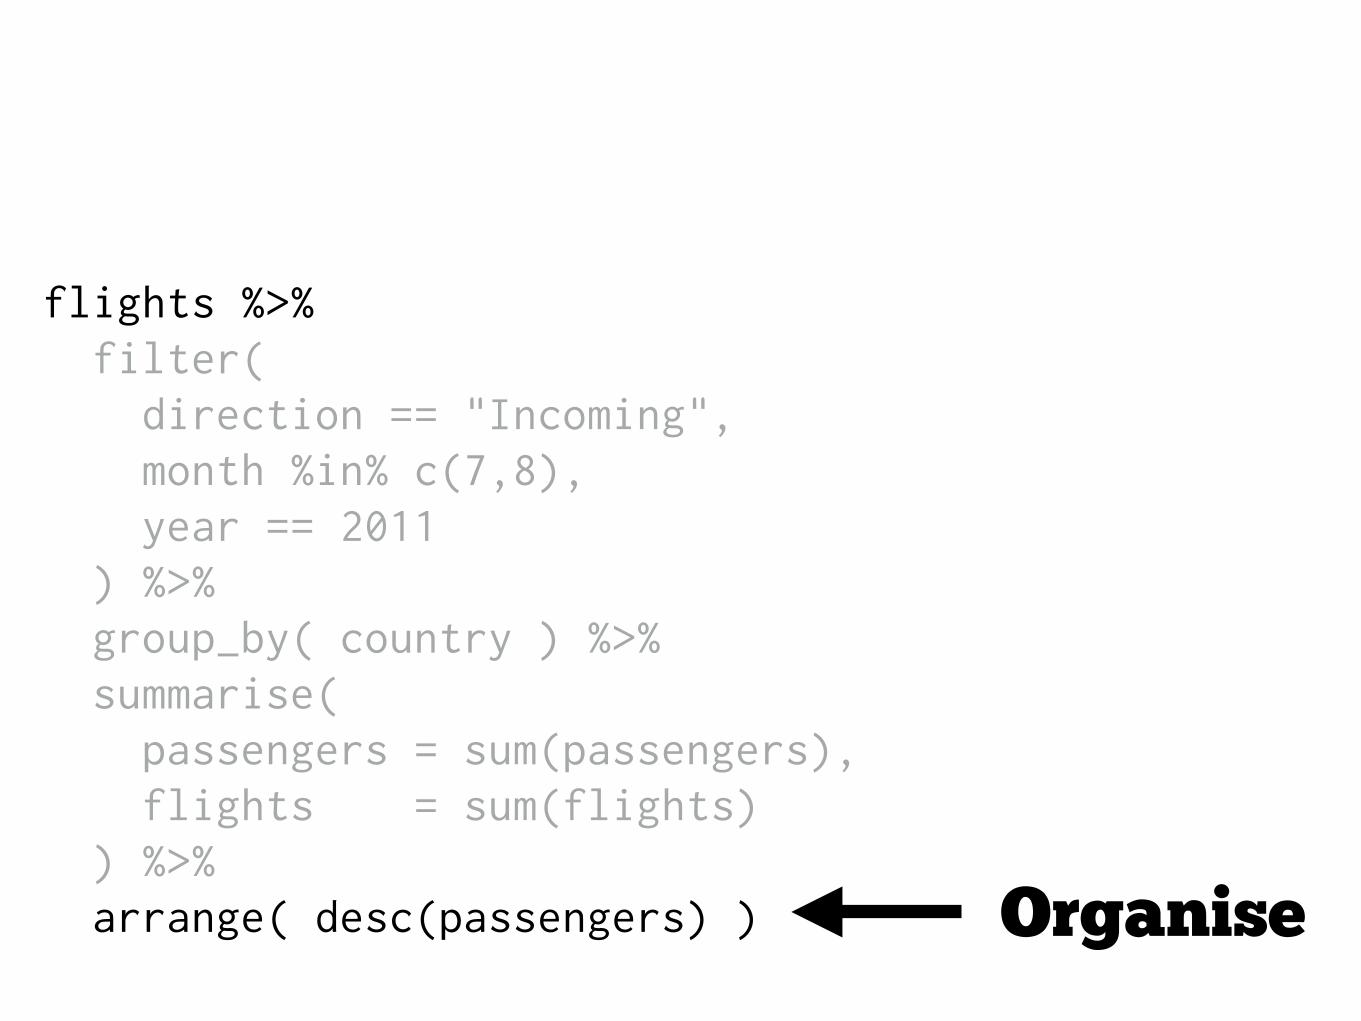
flights %>% filter( direction == "Incoming", month %in% c(7,8), year == 2011 ) %>% group_by( country ) %>% summarise( passengers = sum(passengers), flights = sum(flights) ) %>% arrange( desc(passengers) ) Organise

flights %>% filter( direction == "Incoming", month %in% c(7,8), year == 2011 ) %>% group_by( country ) %>% summarise( passengers = sum(passengers), flights = sum(flights) ) %>% arrange( desc(passengers) ) Organise

When are people leaving Budapest ?

data <- flights %>% filter( direction == "Outgoing" ) %>% mutate( year = as.factor(year), month = factor( month.abb[month], levels = month.abb ) ) %>% group_by( year, month ) %>% summarise( passengers = sum( passengers )) ggplot( data ) + aes( x = month, y = passengers, group = year, color = year ) + geom_line() + geom_point()
Leaving Budapest

data <- flights %>% filter( direction == "Outgoing" ) %>% mutate( year = as.factor(year), month = factor( month.abb[month], levels = month.abb ) ) %>% group_by( year, month ) %>% summarise( passengers = sum( passengers )) ggplot( data ) + aes( x = month, y = passengers, group = year, color = year ) + geom_line() + geom_point()
Collapse #passengers by year/month

data <- flights %>% filter( direction == "Outgoing" ) %>% mutate( year = as.factor(year), month = factor( month.abb[month], levels = month.abb ) ) %>% group_by( year, month ) %>% summarise( passengers = sum( passengers )) ggplot( data ) + aes( x = month, y = passengers, group = year, color = year ) + geom_line() + geom_point()
Make year and month factors

data <- flights %>% filter( direction == "Outgoing" ) %>% mutate( year = as.factor(year), month = factor( month.abb[month], levels = month.abb ) ) %>% group_by( year, month ) %>% summarise( passengers = sum( passengers )) ggplot( data ) + aes( x = month, y = passengers, group = year, color = year ) + geom_line() + geom_point()
viz with ggplot2

When are people leaving Budapest ?

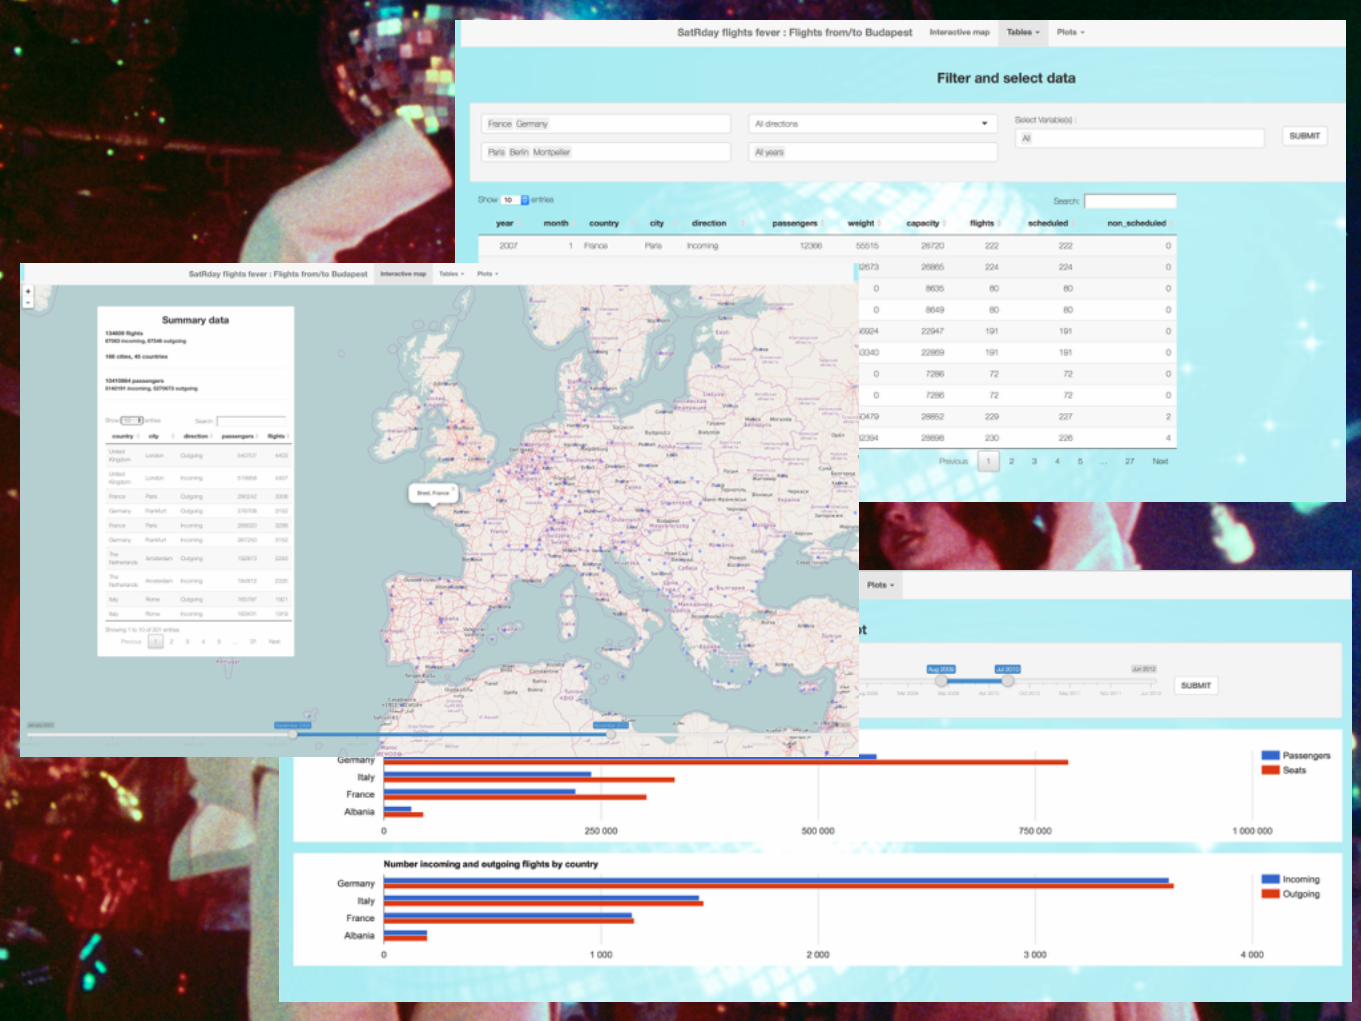
satRday flights feverFlights from/to Budapest
Budapest #satRday dataviz competitionRomain François Cecile Sauder

Questions

Question