downtown nashville retail strategy no: 17302 – downtown nashville retail strategy january 2008...
TRANSCRIPT

January 2008Retail Strategy and Merchandise Mix Plan
Downtown Nashville Retail Strategy

January 2008ERA No: 17302 – Downtown Nashville Retail Strategy
This study and follow-up implementation efforts were made possible through the generosity of:
Marketstreet EnterprisesFifth Third BankRegions Bank
Baker, Donelson, Bearman, Caldwell & Berkowitz, PCBass, Berry & Sims PLC
Crosland TennesseeFirstBank
Waller Lansden Dortch & Davis, LLPGiarratana Development, LLC/Novare Group
SunTrust
AT&TMartha and Bronson Ingram Foundation
NAI Nashville
The Bank of NashvilleVillage Real Estate/Core Development Services
Music City Suites, LLC
Central Parking CorporationFirst Tennessee Foundation
GenescoMDHA - The Metropolitan Development and
Housing AgencyPinnacle Financial Partners
Tower InvestmentsVanderbilt University
Bridgestone Americas Holding, Inc.
Work & Greer, P.C.DZL Management Co., LLC
Harwell Howard Hyne Gabbert & Manner, P.C.Neal & Harwell, PLC
O’Charley’sThe Hermitage Hotel
First Management ServicesGullett, Sanford, Robinson & Martin, PLLC
Nashville Electric Service

1101 Connect i cu t Avenue , NW Su i t e 750
Wash ington , DC 20036
202 .496 . 9870 FAX 202 . 496 . 9877 www. econres . com
Lo s Ange l e s San F ran c i s co Sa n D i ego
Ch i ca go W ash in g ton DC Lond on New Yo rk
Project Report
Nashville Downtown Retail Strategy Prepared for
Nashville Downtown Partnership Nashville, TN Submitted by
Economics Research Associates
January 2008
ERA Project No. 17302

General & Limiting Conditions
Every reasonable effort has been made to ensure that the data contained in this study reflects the most accurate and timely information possible. These data are believed to be reliable. This study is based on estimates, assumptions and other information developed by Economics Research Associates from its independent research effort, general knowledge of the market and the industry, and consultations with the client and its representatives. No responsibility is assumed for inaccuracies in reporting by the client, its agent and representatives or any other data source used in preparing or presenting this study.
No warranty or representation is made by Economics Research Associates that any of the projected values or results contained in this study will actually be achieved.
Possession of this study does not carry with it the right of publication thereof or to use the name of "Economics Research Associates" in any manner without first obtaining the prior written consent of Economics Research Associates. No abstracting, excerpting or summarizing of this study may be made without first obtaining the prior written consent of Economics Research Associates. This report is not to be used in conjunction with any public or private offering of securities or other similar purpose where it may be relied upon to any degree by any person, other than the client, without first obtaining the prior written consent of Economics Research Associates. This study may not be used for purposes other than that for which it is prepared or for which prior written consent has first been obtained from Economics Research Associates.
This study is qualified in its entirety by, and should be considered in light of, these limitations, conditions and considerations.

Economics Research Associates Nashville Retail Strategy Project No. 17302
Report Overview
The Downtown Nashville Executive Summary is summarized here through text and PowerPoint slides with images, graphs, and tables. An Appendix follows with more detail. ERA|Downtown Works (ERA|DW) was hired to outline a Retail Strategy for Downtown Nashville, which includes a Merchandise Mix Plan and a comprehensive Implementation Strategy. ERA|DW defined and assessed the relevant customer markets and their spending patterns. Additionally, ERA|DW performed a Qualitative Assessment of all ground level retailers on the primary retail streets in the Downtown Core. ERA|DW found that the downtown Core is wholly underserved by numerous retail categories, the Gulch has the potential for neighborhood and some destination retail in the long term, and SoBro retail will thrive primarily east of 4th Avenue. Retail recruitment is a long term process and should commence with a focus on the Downtown Core, specifically 4th and 5th Avenue between Church and Union as well as 2nd Avenue. Broadway is in need of storefront and merchandising improvements, as well as a fine tuning of the merchandise mix. Action to enhance design guidelines with regards to storefronts and signage for infill development and renovations, as well as to create programs that facilitate façade improvements will ensure better retail environments in the future. The Executive Summary focuses first on the downtown overview and market assessment and then the merchandising direction for the Gulch, SoBro, and the Downtown Core.

January 2008ERA No: 17302 – Downtown Nashville Retail Strategy
Retail Strategy & Implementation Program
The Nashville Downtown Partnership retained ERA|DW to evaluate retail conditions in downtown Nashville and create a Retail Strategy and Implementation Program
The scope includes:Definition and description of important customer marketsDevelopment of Merchandise Mix Plan, including appropriate mix of retailers and phasing
Commencement of Implementation Program
Project Timeline
Months July – Sept: Data gathering, interviews, strategic assessment
Months Oct – Dec: Executive Summary, merchandise mix plan, retail recruiter, marketing material
Months Jan – June: Implementation

January 2008ERA No: 17302 – Downtown Nashville Retail Strategy
Table of ContentsI. Project Overview and Timeline
II. Downtown Overview and Market Assessment
i. Customer markets defined
ii. Market demographics and psychographics (include from stakeholders)
iii. Existing policies and guidelines (historic guidelines, etc.)
iv. Stakeholder interviews
v. Strengths and challenges for retail
III. The Gulch: Assessment and Merchandise Mix Plan
IV. SoBro: Assessment and Merchandise Mix Plan
V. Downtown Core: Assessment and Merchandise Mix Plan
VI. Implementation

Economics Research Associates Nashville Retail Strategy Project No. 17302
Customer Overview
Understanding the various customer markets is important to developing a merchandise mix plan. ERA|DW defined three critical markets, visitors, employees, and residents and assessed their characteristics.
Employees There are approximately 47,617 employees working in downtown Nashville in approximately 1,402 businesses, organizations, and governmental agencies. Most downtown employees are between 25 and 44 years old (49 percent) and 38 percent are in their peak earning years between 45 and 64. The top employers in 2007 were:
1) State of Tennessee
2) Metropolitan Government of Nashville & Davidson County
3) US Federal Government
4) Lifeway Christian Resources
5) AT & T
6) Nissan North America
7) Nashville Electric Service
8) The Tennessean
9) US Smokeless Tobacco
10) Waller Landsen Dortch & Davis
In 2007, downtown employers and businesses, ranked the need for “retail variety” as one of the top five requested improvements for downtown Nashville. While office workers in the categories above are generally not extravagant spenders, they will contribute significantly to downtown retail expenditures. ERA|DW assessed national employee spending trends through surveys conducted by the International Council of Shopping Centers (ICSC) in 1987 and 2003. This is the most recent survey. On a whole, downtown employees are spending more money and time on after-work dinner and drinks, but are buying less of their lunches out and taking less time to travel to lunch. This trend supports focusing on full service restaurants that serve lunch and dinner as opposed to quick service spots only serving lunch. The ICSC survey found that downtown employees spend approximately $3,100 per year on retail ($1,400) and restaurants ($1,700).

Economics Research Associates Nashville Retail Strategy Project No. 17302
Visitors Nashville is the number one tourist destination in Tennessee; however this includes all destinations in Nashville, such as Gaylord Opryland Hotel, which attracts a significant amount of tourism and conventioneers. The Nashville Convention and Visitors Bureau (CVB) does not track downtown specific visitation, but does track Davidson County visitation at 10.5 million annually. On average visitor trips are 4.7 days and annual per person per trip expenditures are $330. According to the CVB, one third of all visitors are leisure, business, and convention visitors. In downtown there are 2,700 hotel rooms and between 600 and 800 are in the pipe line. The 2007 occupancy rate for downtown Nashville hotels was 75 percent (unchanged from 2006). As a very rough estimate, if the occupancy rate is applied to the number of hotel rooms available per year, the result is approximately 739,000 room nights occupied per year in downtown.
Leisure visitors are the most likely to spend money on retail because they have both the time and [potentially] intention of spending money. In Nashville, most of the leisure visitors visit Broadway and 2nd Avenue, as well as specific destinations, such as the Country Music Hall of Fame. Business visitors primarily spend money on meals out, hotel rooms, transportation, and occasionally retail items. Throughout stakeholder interviews, ERA|DW discovered that business visitors frequent the art galleries on 5th Avenue|Arcade as a destination. Convention visitors also spend money on the same categories, but will likely spend less money than non-convention business visitors on meals out. There are two reasons for this: 1) Business visitors tend to have more flexible expense accounts than convention-goers, 2) Convention centers, generally, seek to retain conventioneers’ food expenditures in the center through catering services.
Residents In Nashville, downtown residential development has experienced extraordinary gains over the past few years. Despite the strongly growing downtown population, the close-in residential market is limited. Current and future retailers must rely on residents in the surrounding trade areas. ERA|DW defined primary, secondary, and tertiary residential trade areas based on 10, 20, and 30 minute drive times. Drive times take into consideration auto access to downtown. This total market area (inclusive 30 minute drive time market) includes approximately 850,000 people. Average household income increases as the distance from downtown increases. ERA|DW utilized ESRI Business Analyst Tapestry information to understand the psychographic characteristics of the residential markets. Psychographics describe the characteristics and lifestyle choices of various demographic segments, such as living preferences, buying trends, preferred activities (i.e. sports, entertainment), eating habits, and more. This information helps determine what types of stores are likely successes and appropriate for the Merchandise Mix Plans. The following psychographic profiles are based on national trends; however, the profiles are attributed to the project area based on census data from the census block groups within each trade area. Overarching categories are referred to as Life Mode groups; Segmentation groups further refine Life Mode groups. Market details are described in the following slides.
January 2008ERA No: 17302 – Downtown Nashville Retail Strategy
Customer Overview
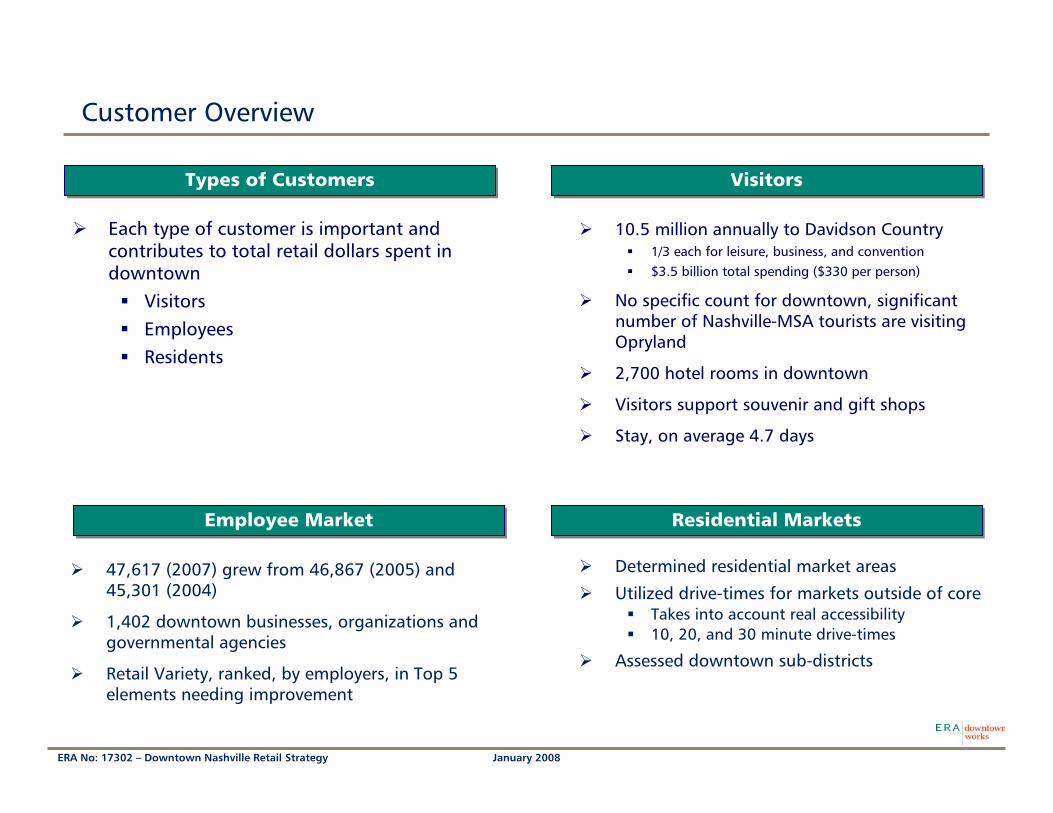
Determined residential market areas
Utilized drive-times for markets outside of coreTakes into account real accessibility 10, 20, and 30 minute drive-times
Assessed downtown sub-districts
VisitorsVisitors
Each type of customer is important and contributes to total retail dollars spent in downtown
VisitorsEmployeesResidents
Types of CustomersTypes of Customers
Residential MarketsResidential MarketsEmployee MarketEmployee Market
10.5 million annually to Davidson Country1/3 each for leisure, business, and convention$3.5 billion total spending ($330 per person)
No specific count for downtown, significant number of Nashville-MSA tourists are visiting Opryland
2,700 hotel rooms in downtown
Visitors support souvenir and gift shops
Stay, on average 4.7 days
47,617 (2007) grew from 46,867 (2005) and 45,301 (2004)
1,402 downtown businesses, organizations and governmental agencies
Retail Variety, ranked, by employers, in Top 5 elements needing improvement
January 2008ERA No: 17302 – Downtown Nashville Retail Strategy
Employees Characteristics Relevant to Retail Spending
Age and GenderAge and Gender
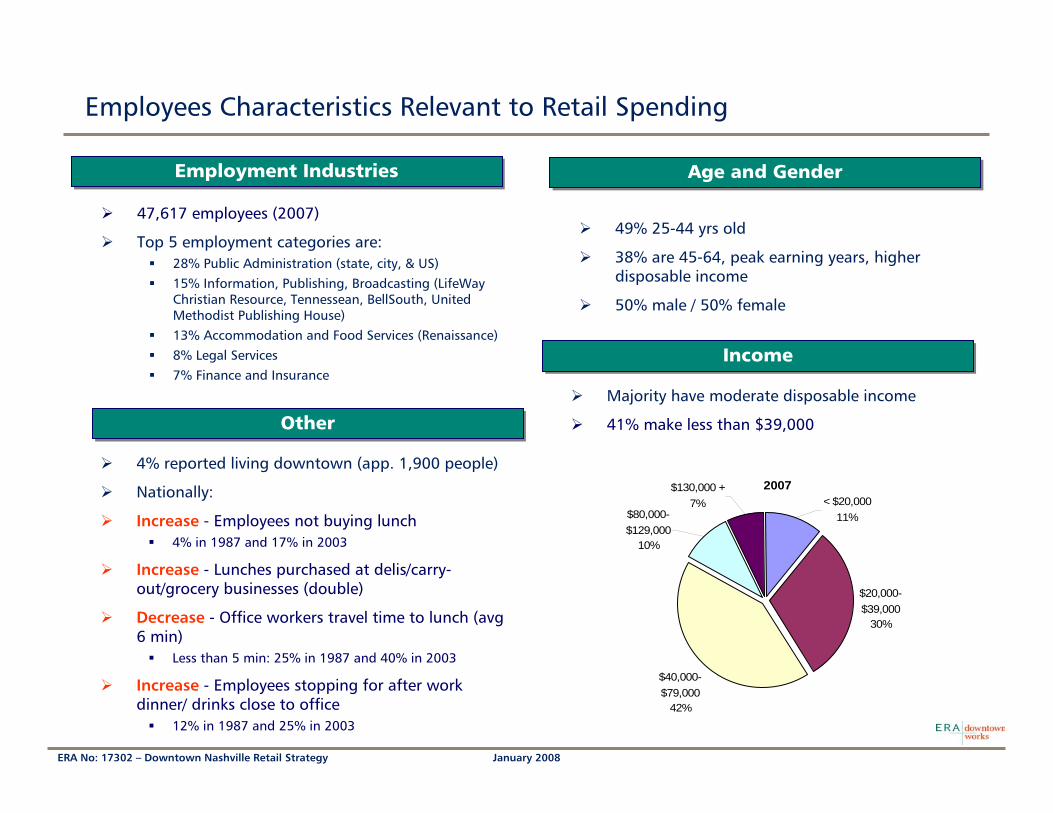
47,617 employees (2007)
Top 5 employment categories are:28% Public Administration (state, city, & US)15% Information, Publishing, Broadcasting (LifeWay Christian Resource, Tennessean, BellSouth, United Methodist Publishing House)13% Accommodation and Food Services (Renaissance)8% Legal Services7% Finance and Insurance
Employment IndustriesEmployment Industries
IncomeIncome
49% 25-44 yrs old
38% are 45-64, peak earning years, higher disposable income
50% male / 50% female
4% reported living downtown (app. 1,900 people)
Nationally:
Increase - Employees not buying lunch 4% in 1987 and 17% in 2003
Increase - Lunches purchased at delis/carry-out/grocery businesses (double)
Decrease - Office workers travel time to lunch (avg 6 min)
Less than 5 min: 25% in 1987 and 40% in 2003
Increase - Employees stopping for after work dinner/ drinks close to office
12% in 1987 and 25% in 2003
OtherOtherMajority have moderate disposable income
41% make less than $39,000
2007
$20,000-$39,000
30%
$40,000-$79,000
42%
< $20,00011%$80,000-
$129,00010%
$130,000 +7%
January 2008ERA No: 17302 – Downtown Nashville Retail Strategy
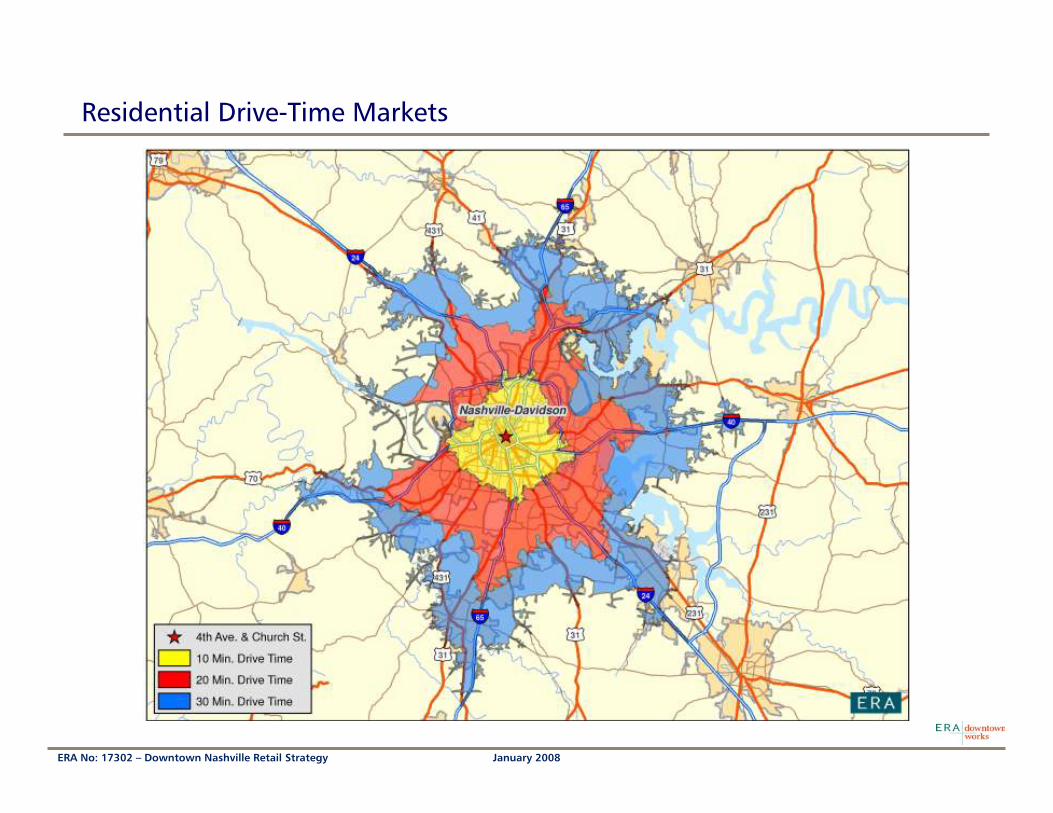
Residential Drive-Time Markets

January 2008ERA No: 17302 – Downtown Nashville Retail Strategy
Residential Markets
Considered Partnership Boundaries
US Census estimates and projectionsEstimated residents on previous growth trends4,300 (2007) and 4,600 (2012)
Current NDP projections (2007)Estimated residents by unit growth3,219 (2007) and 6,024 (2009)
Median age 36
Avg HH IncomeAverage $52,000 (2007) and $64,000 (2012)
DowntownDowntown
Secondary Market (20 min. drive)Secondary Market (20 min. drive)
Tertiary Market (30 min. drive)Tertiary Market (30 min. drive)
Primary Market (10 min. drive)Primary Market (10 min. drive)
221,500 residents (2007) and 224,000 projected (2012)
Median age 34
Average HH Income$57,000 (2007) and $70,000 (2012)
324,400 residents (2007) and 338,400 projected (2012
Median age 37
Average HH Income$79,500(2007) and $97,000 (2012)
297,600 residents (2007) and 343,000 (2012)
Median age 37
Average HH Income$97,300 (2007) and $121,800 (2012)
Primary Market HH Income Distrubution, 2007
0
5,000
10,000
15,000
20,000
25,000
<19,9
99$2
0,00
0-$3
4,99
9$3
5,00
0-$4
4,99
9$4
5,00
0-$5
9,99
9$6
0,00
0-$7
4,99
9$7
5,00
0-$9
9,99
9
$100
,000
-$14
9,99
9
$150
,000
-$19
9,99
9
$200
,000
-$24
9,99
9
$250
,000
-$49
9,99
9>$5
00,0
00
Income
Households

January 2008ERA No: 17302 – Downtown Nashville Retail Strategy
Residential Tapestry Data
Primary Market (10 min. drive)Primary Market (10 min. drive)
Analyzed Life Mode Tapestry groups, which cluster similar lifestyles and life stages
Each Life Mode group has several more specific segmentation categories (65 in whole system)
1st and 3rd largest groups (Metropolis and SoloActs), are potential downtown customers
Metropolis: 2 diverse groupsMetropolitans 10% of totalFavor city living, have active urbane lifestyle75% of those over 25 have college degree or higherMedian income $61,000Metro City Edge 9% of totalHalf work in service related jobs, 9% over 25 have college degree or higher, median income $31,000Primary concern is welfare of children and spend wiselyTend to shop at department stores
Traditional Living, generally less urban desireLargest sub-group is Rustbelt Traditions - 10% of totalMedian income of app. $50,00050/50 white collar and manufacturingFinancially conservativeDo not follow fads, stick with products/services they know
Solo Acts (Very likely urban retail customer)Most are Metro Renters 7% of totalYoung well-educated singles starting professional careersLargely single and renters, spend $ on themselves (clothes, wine and beer, other merchandise)Exercise, read, socialize, travel frequently
Metropolis25%
Solo Acts14%
Senior Styles11%
Scholars & Patriots
3%
High Hopes10%
Global Roots7%
Family Portrait7%
Traditional Living16%
Upscale Avenues2%
Factories & Farms4% High Society
1%
High Society is relevant to retail - smallest groupContains 7 most affluent segments, high disposable incomeCategory grows significantly as market extends (9% and 35% of secondary and tertiary markets)
Categories in orange indicate likely customers for urban retail.
January 2008ERA No: 17302 – Downtown Nashville Retail Strategy
Residential Tapestry Data
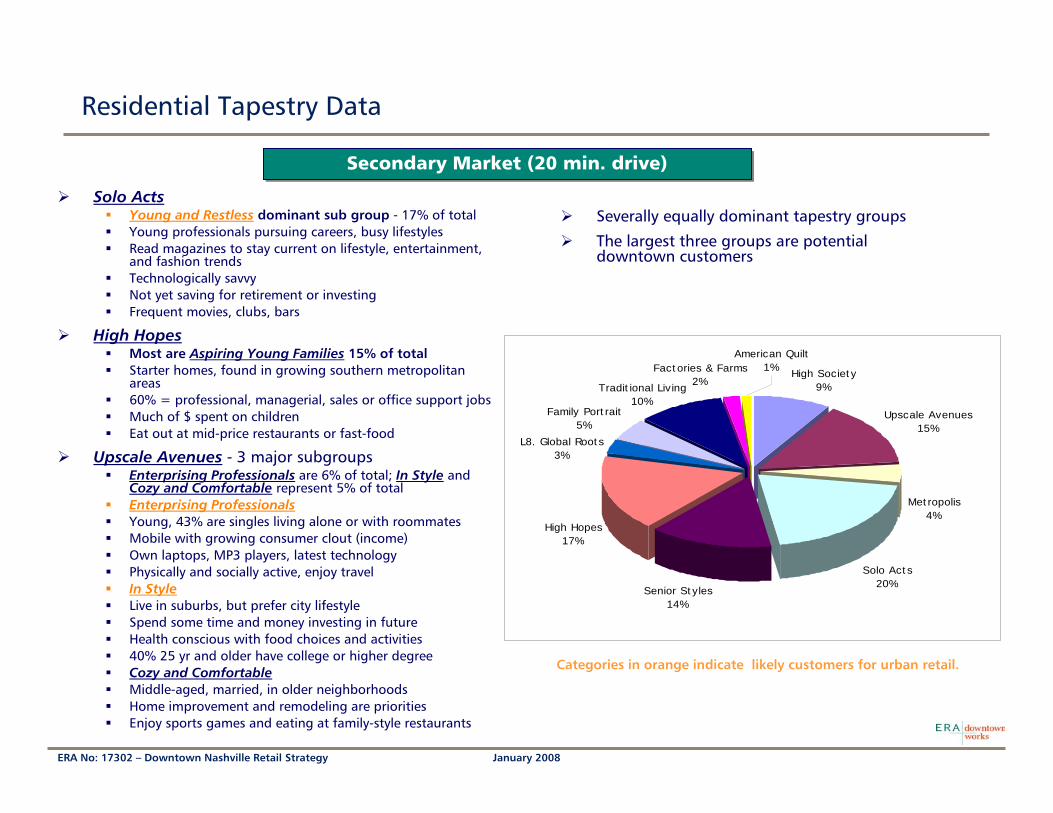
Secondary Market (20 min. drive)Secondary Market (20 min. drive)
Solo ActsYoung and Restless dominant sub group - 17% of totalYoung professionals pursuing careers, busy lifestylesRead magazines to stay current on lifestyle, entertainment, and fashion trendsTechnologically savvyNot yet saving for retirement or investingFrequent movies, clubs, bars
High HopesMost are Aspiring Young Families 15% of totalStarter homes, found in growing southern metropolitan areas60% = professional, managerial, sales or office support jobsMuch of $ spent on childrenEat out at mid-price restaurants or fast-food
Upscale Avenues - 3 major subgroupsEnterprising Professionals are 6% of total; In Style andCozy and Comfortable represent 5% of totalEnterprising ProfessionalsYoung, 43% are singles living alone or with roommatesMobile with growing consumer clout (income)Own laptops, MP3 players, latest technologyPhysically and socially active, enjoy travelIn StyleLive in suburbs, but prefer city lifestyleSpend some time and money investing in futureHealth conscious with food choices and activities40% 25 yr and older have college or higher degreeCozy and ComfortableMiddle-aged, married, in older neighborhoodsHome improvement and remodeling are priorities Enjoy sports games and eating at family-style restaurants
High Society9%
Upscale Avenues15%
Metropolis4%
Solo Acts20%
Senior Styles14%
High Hopes17%
Family Portrait5%
American Quilt1%Factories & Farms
2%Traditional Living
10%
L8. Global Roots3%
Severally equally dominant tapestry groups
The largest three groups are potential downtown customers
Categories in orange indicate likely customers for urban retail.
January 2008ERA No: 17302 – Downtown Nashville Retail Strategy
Residential Tapestry Data
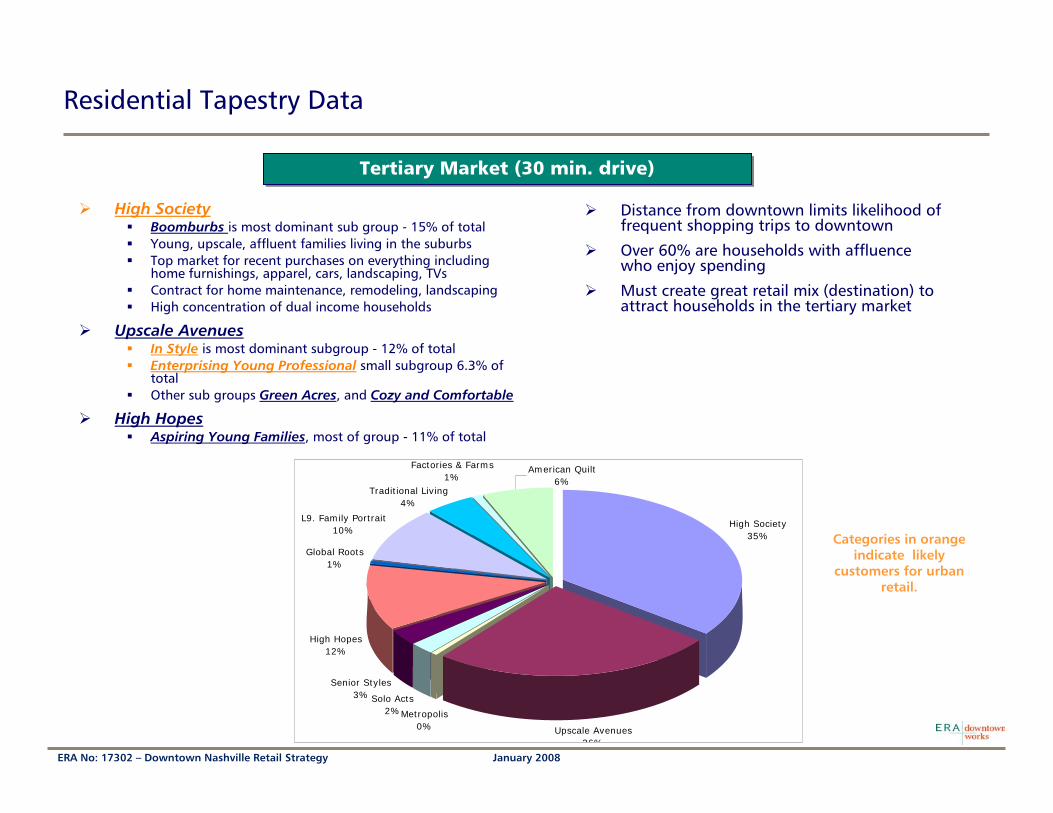
Tertiary Market (30 min. drive)Tertiary Market (30 min. drive)
Distance from downtown limits likelihood of frequent shopping trips to downtown
Over 60% are households with affluence who enjoy spending
Must create great retail mix (destination) to attract households in the tertiary market
High Society35%
Upscale Avenues26%
High Hopes12%
Global Roots1%
L9. Family Portrait10%
American Quilt6%
Factories & Farms1%
Traditional Living4%
Senior Styles3%
Metropolis0%
Solo Acts2%
High SocietyBoomburbs is most dominant sub group - 15% of totalYoung, upscale, affluent families living in the suburbsTop market for recent purchases on everything including home furnishings, apparel, cars, landscaping, TVsContract for home maintenance, remodeling, landscapingHigh concentration of dual income households
Upscale AvenuesIn Style is most dominant subgroup - 12% of totalEnterprising Young Professional small subgroup 6.3% of totalOther sub groups Green Acres, and Cozy and Comfortable
High HopesAspiring Young Families, most of group - 11% of total
Categories in orange indicate likely
customers for urban retail.
Economics Research Associates Nashville Retail Strategy Project No. 17302
Stakeholder Interviews and Strengths and Challenges
Stakeholder interviews are an important part of the Retail Strategy for two reasons: 1) Gain a first hand understanding of the retail market dynamics and factors impacting its successes or failures 2) Share the Retail Strategy and implementation approach to build consensus for its efforts. In the first six months of the process ERA|DW interviewed approximately 25 stakeholders one-on-one. Several common themes emerged and are listed on the following slides. A merchandise mix cannot be implemented, alone, by recruiting retailers. Implementation will succeed if property owners, real estate representatives, city officials, etc. buy-in to the plan and are willing to contribute to its efforts. Stakeholder interviews continue throughout ERA|DW’s year long process. After the Retail Recruiter begins working, stakeholder interviews will help introduce the Recruiter to people he/she will be interacting with on a daily basis. He/she will continue meeting with key stakeholders.
Retail is a dynamic industry that is influenced by many variables. Retail in downtown Nashville is impacted by several strengths and challenges that are outlined below. One of the biggest strengths is Nashville’s strong brand identify and in addition, there is a great buzz about downtown due to all the recent growth. Downtown is underserved by retail so there are great retail opportunities if implemented appropriately. Downtown is fortunate to have organizations that are committed to downtown revitalization, including the Nashville Downtown Partnership, the Metropolitan Development Housing Agency (MDHA), and the Metro Planning Department, as well as the development community. As Nashville continues to grow it is important that these entities work together to ensure that new development does not inhibit retail and that storefronts are configured and located appropriately.

January 2008ERA No: 17302 – Downtown Nashville Retail Strategy
Stakeholder Interviews
Current office tenants not big enough to drive large towers
Need More attractive (full-service) lunch and dinner establishmentsTheater, bookstore, men’s apparel, and upscale contemporary boutiquesBrand namesConvenience goods should not go away
West End to Midtown is increasingly popular residential location for empty nesters downsizing – mid-way from suburbs to downtown core (half step to downtown)
Panhandling MUST stop, major deterrent
2nd Ave after-hours and 18 and older clubs, creating problems
Broadway is almost all out-of-towners, no real place for locals to go in Core
Some concerns about current depth of housing market
Specific developer design guidelines are imperative

January 2008ERA No: 17302 – Downtown Nashville Retail Strategy
Strengths and Challenges for Retail in Downtown Nashville
StrengthsStrengths ChallengesChallenges
Growing downtown residential population
Fledgling arts district
All three markets are well-representedResidentsVisitorsEmployees
Downtown momentum
Significant historic assetsRyman Auditorium (an icon)ArcadePrinters Alley
Music City brand is very well-known and recognized
Country Music Hall of FameBroadway live music
State Capitol
Monolithic office architecture - tower designs extend to pedestrian scale
Office design characteristics do not work for retail
SetbacksLimited transparencyInterior access
Lack of storefront maintenance
Deep ground level retail spaces (approximately 200 ft deep on 2nd Avenue)
Too many gaps, creating passive spaces
Condition of some historic assets (Printers Alley and Arcade)
Arena and Hall of Fame create inactive walls/space on street
Adapting the Convention Center to residential and neighborhood characteristics of SoBro

January 2008ERA No: 17302 – Downtown Nashville Retail Strategy
Development Guidelines and Policies
MDHA & Metro Planning DepartmentMDHA & Metro Planning Department
Great resource for downtown development
Review and approve designs for new development in downtown
Recommendation: Office and residential buildings should be designed so the viability of retail is maximized
Entryways not on primary retail street, but on secondaryNo curb cuts, loading docks, etc. on primary retail street
Recommendation: Not all buildings MUST have retail in the ground floor; however those on primary retail streets should
Recommendation: Assure that, where retail is concerned, ground level and storefront designs are appropriate
Create specific mandatory design parameters for developers that guide how retail storefronts address the streetDesigned by professional retail architectsStorefronts distinguished from each other with design – no storefront systemsMonolithic design of tower not carried to pedestrian scale
Good Bad

January 2008ERA No: 17302 – Downtown Nashville Retail Strategy
Table of Contents
I. Project Over view and Timeline
II. Downtown Overview and Market Assessment
III. The Gulch: Assessment and Merchandise Mix Plan
IV. SoBro: Assessment and Merchandise Mix Plan
V. Downtown Core: Assessment and Merchandise Mix Plan
VI. Implementation
Economics Research Associates Nashville Retail Strategy Project No. 17302
Strategic Assessments and Merchandise Mix Plans
The Gulch The Gulch has evolved into a residential and restaurant hot spot. Its successes are great for downtown and Nashville. According to stakeholder interviews, the restaurants are successful and the residential product is selling well. ERA|DW sees the retail mix following two tracks. One is the continued growth of destination restaurants. It is important to note, that most of the restaurants’ customers are local. It is a good sign that Nashvillians are, increasingly, considering downtown as an option. Often in urban areas, clusters of restaurants function as anchors and catalysts for additional growth, such as retail. The second track is the establishment of neighborhood serving retail and select destination boutiques in the longer term. This retail growth will follow the new residential growth and restaurant anchors. While new urban residents in the Gulch are a captive audience for retail, these immediate residents, alone, will not, support restaurants and retail right now. The population is too small. Hence the creation of destination restaurant clusters and small-scale neighborhood retail is the first step.
SoBro SoBro will be a unique district in the Nashville scene because it has two simultaneous emerging identities with 1) entertainment and tourist destination and 2) office and residential neighborhood developments. While mixtures of uses are one of the most appealing characteristics of urban areas, retail cannot bridge these two emerging identities. Furthermore, retail functions best when contiguous and double – sided (on both sides of street). It is challenging to create a retail environment amidst hotels, convention centers, office buildings, parking lots, and large-scale entertainment buildings (i.e. Sommet Center, Country Music Hall of Fame, and the Schemerhorn). These uses are great for Nashville and will attract potential retail customers to downtown, but their structures are not conducive to retail. Retail will not reach its potential if located directly across from or beside the blank wall of the Country Music Hall of Fame or parking lot for the Sommet Center. In such locations, a cluster of retail can not create the continuity or synergy it needs. For this reason, ERA|DW suggests focusing retail efforts between Broadway and Molloy and 2nd and 3rd Avenues. Additional residential and office developments are slated for this part of SoBro, which will bring more density and customers. Since SoBro is poised for significant infill development (i.e. office and residential, convention center, hotels, etc.), enhanced developer storefront and signage design guidelines will have a worthwhile impact.

January 2008ERA No: 17302 – Downtown Nashville Retail Strategy
The Gulch Merchandising Direction

January 2008ERA No: 17302 – Downtown Nashville Retail Strategy
The Gulch will eventually have a critical mass of retail, approximately the size of a small lifestyle center (@150,000 SF)
Variety of developers building a variety of housingYoung professional to empty nesterHigh-end - Icon and TerrazzoModerate - Velocity with 70% of units below $250k, of which 40% are below $200k - units several hundred SF smaller than other buildingsRental – Griffin Plaza with 150 units, to be completed in 2009, preservation and renovation of historic structures
Approximately 1,600 units existing or under construction –alone not large enough market by retail standards
Developers working to create contiguous retail along 11th
and 12th Avenues – Emerging synergy with existing uses
Successful destination restaurants (i.e. Watermark, Sambuca, etc.)
Customers are 75-85% Nashvillians
Walk-ability (distance and pedestrian experience) between downtown and Gulch hinders access to certain markets
Tourists to CBDDowntown employees (specifically lunch)
Division and 12th Street contiguous concentration of retail, but difficult to connect to 11th and 12th Avenue retail
Retail viability directly linked to occupancy of residential developments, currently planned:
Icon – 25,000 SF Terrazzo – 20,000 SF Velocity – 21,000 SF
Ample parking
City invested $7 million in infrastructure
Restaurants are successful
Strategic AssessmentStrategic Assessment Merchandising DirectionMerchandising Direction
Customers are:Residents living in the new urban dwellings (young professionals and empty nesters)Trade area residents attracted to an urban and eclectic atmosphereSmall amount of visitors (most likely business) and downtown employees
Neighborhood serving retail at base of buildings
Short-term opportunity - Restaurant destination, continue to grow
Long-term opportunity – Small scale retail destinationAs more development comes on line the critical mass of retail will increase
Retail - will work as clusterSmall unique fashion boutiques that function as destinationHome furnishings, (furniture, tabletop, art, paint, etc), Home furnishing showrooms (i.e. fixtures, such as artistic tile work to high-end appliances, such as Viking)GiftsSpaSalonsArt galleries
Food related usesSpecialty food (i.e. prepared foods)Wine-shopRestaurantsCoffee Shops

January 2008ERA No: 17302 – Downtown Nashville Retail Strategy
SoBro Merchandising Direction
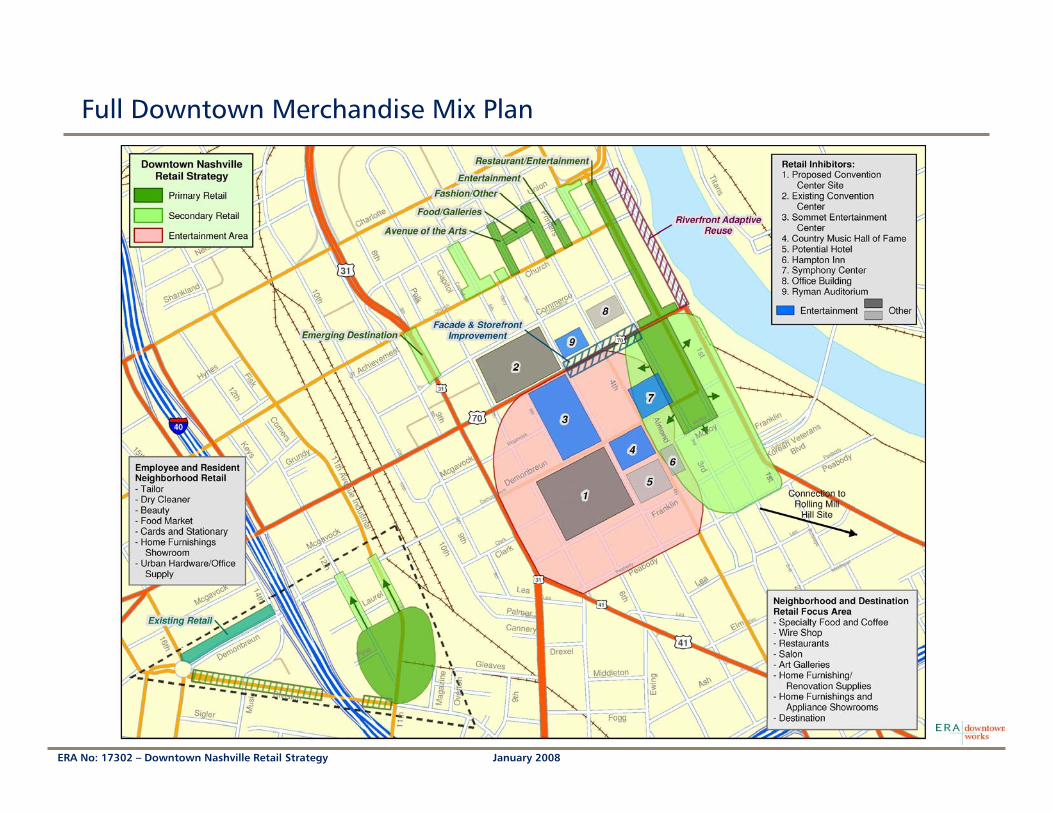
Blue and gray retail inhibitors are large land-users in downtown whose structures are not conducive to retail. They are indicated on the map to convey why retail efforts should be focused in the green Primary and Secondary Retail Area.

January 2008ERA No: 17302 – Downtown Nashville Retail Strategy
SoBro is a multi-faceted downtown district with existing or planned entertainment, hospitality, office, residential and retail uses
Strategic AssessmentStrategic Assessment Merchandising DirectionMerchandising Direction
Access to employment and visitor base in downtown
Employment base is expanding into SoBro with Pinnacle and any other future office developments
Emerging with two identitiesEntertainment/tourist – West of 4th AveResidential/office neighborhood – East of 4th Ave
Opportunity to grow mixed-use neighborhood (residents and office) away from big users (i.e. convention and hospitality uses)
SoBro impacted by location and design of new convention center
New convention center is important to Nashville, greatest impact on hospitality and food and beverage
Opportunity to grow mixed-use neighborhood (residents and office) East of 4th Ave
Retail focus area between:Broadway and Molloy and 2nd and 3rd
Can expand as density and population increases
4th Avenue would be a logical retail connection BUT:Too many uses that create in-active space for retailThese are great uses, but are not advantages for contiguous, double sided retail
Retail usesTailorDry CleanerBeauty (Hair & Nail Salon, Spa)OpticalCards & StationaryHome furnishings & showroomsUrban hardware/office supply
Restaurants
Specialty food markets with prepared food
Recommendation: Activate Convention Center edges with glass and circulation routes – other active uses
Consider clear (non-reflective/tinted) glass Have not found successful retail model in US Convention CentersConvention Centers strive to keep people and revenue insideWhen considering designs and case studies, be sure to assess first hand the success (i.e. sales of retail in convention centers)
Washington DC – Convention Center (2003) retail is unsuccessful
•It took years to lease – still vacancies
•Current tenants are low quality
•Goals to re-invigorate retail across the street still not met
January 2008ERA No: 17302 – Downtown Nashville Retail Strategy
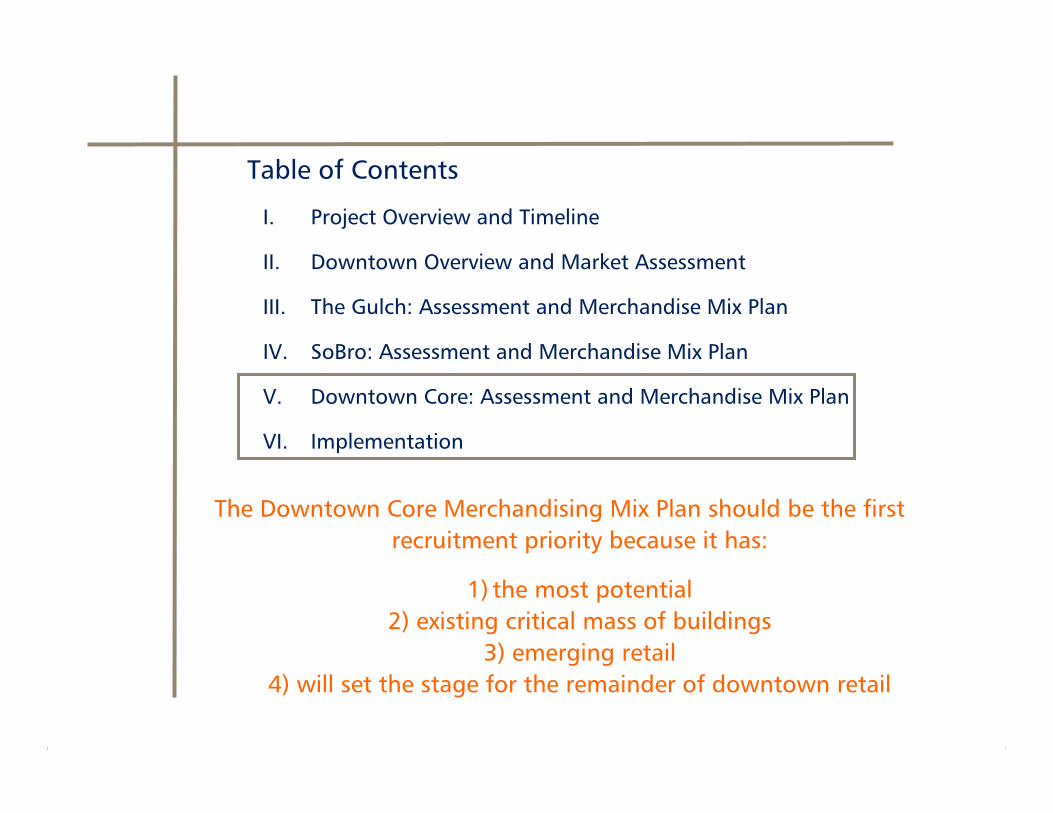
Table of Contents
I. Project Overview and Timeline
II. Downtown Overview and Market Assessment
III. The Gulch: Assessment and Merchandise Mix Plan
IV. SoBro: Assessment and Merchandise Mix Plan
V. Downtown Core: Assessment and Merchandise Mix Plan
VI. Implementation
The Downtown Core Merchandising Mix Plan should be the first recruitment priority because it has:
1) the most potential 2) existing critical mass of buildings
3) emerging retail 4) will set the stage for the remainder of downtown retail

Economics Research Associates Nashville Retail Strategy Project No. 17302
Downtown Core
Qualitative Assessment and Merchandise Mix Plan ERA|DW conducted a Qualitative Assessment (QA) of all street-oriented retailers in the Downtown Core on Broadway, 2nd Avenue between Broadway and Union, and 4th and 5th Avenues between Church and Union. The QA is a storefront and use evaluation that ranks façade, signage, display, maintenance, and interior merchandising. Each category receives a rank between one (poor condition) and four (excellent condition) The document includes commentary and photos as well. The QA informs the Merchandise Mix Plan and is a valuable tool for the Retail Recruiter as the Nashville Downtown Partnership proceeds with implementation. Overall, Broadway was found to have a healthy mix of uses considering it is a tourist destination, but facades need improvement. Second Avenue is the only street that has buildings (two) with the lowest score possible; they were 18 and over nightclubs. Too many of the uses on 2nd Avenue are nighttime clubs. On 4th and 5th Avenues there are opportunities for recruitment. Throughout downtown historic building stock remains; however some buildings are poorly maintained. Detailed tables documenting various uses are included in the Appendix. Most retail categories from men’s apparel to art supplies are underserved in downtown. The following slides display the Merchandise Mix Plan phases and focus as well as describe in further detail specific recruitment targets. The primary focus area for recruitment will be 4th and 5th Avenues between Church and Union Streets and Broadway. Recruitment can expand to wrap corners along Church and Union; however contiguous retail on Church and Union is nearly impossible due to building configuration and design. The potential home furnishings cluster on 8th Avenue is positive, but a connection to 4th and 5th Avenues is challenging. The riverfront along 1st Avenue is an important asset in downtown Nashville and should be recognized, especially as investment occurs elsewhere along the river. While most types of retail are not successful along water, restaurants and cafés can capitalize on views and are excellent target uses. Residential development (town homes) may be another opportunity. ERA|DW recommends exploring the option of dividing buildings between 1st and 2nd Avenues so there are “fronts” on both streets.
Implementation Strategy The most important driver of a successful retail district is retaining and recruiting a mix of retailers that accurately complements existing conditions and customer market preferences. The Retail Recruiter, Nashville Downtown Partnership, and ERA|DW will work together to implement the Merchandise Mix Plans. Retail recruitment takes time and expectations should be realistic. It may be one year before the first deal is made. Part of this process includes meeting with property owners and coordinating a recruitment and retention marketing piece. Successful implementation will require not only retail recruitment, but also strategic policy and infrastructure changes.

January 2008ERA No: 17302 – Downtown Nashville Retail Strategy
Qualitative Assessment - 2nd and Broadway
Storefront structural elements in good condition
Biggest physical challenge is upkeep of facades
Retail represents 22% of street, of which 89% are souvenir shops
Restaurant and entertainment uses represent 59% of street9 restaurants, 6 entertainment venues with food service, and 9 entertainment venues with bare minimum food service (required by TN State)
Restaurant types are very limited
Of entertainment venues 10 have live music (47%)
Only 1 office and 2 retail service uses (good ratio)
Vacancy rate 12%
BroadwayBroadway 2nd Avenue2nd Avenue
Clubs have poorest physical conditions
Primary use on street is office (33%)
Restaurants comprise 24% of street - still limited diversity, primarily American cuisine
Entertainment represent 22% (6 w/ food, 5 w/o food) -two “activity” uses (i.e laser tag, billiards)
Significantly less live music, only 2 (BB Kings and Mulligans Pub), more clubs
Vacancy rate 5%
7
13 14
2
6
8 5
0
5
10
15
20
25
30
0-5 6-10 11-15 16-20Score
SecondBroadway
Score DistributionScore Distribution
Only Broadway has uses (2) that scored 20
Broadway has higher scores than other streets
Only 2nd Ave has uses that scored < 5 -- both are clubs
January 2008ERA No: 17302 – Downtown Nashville Retail Strategy
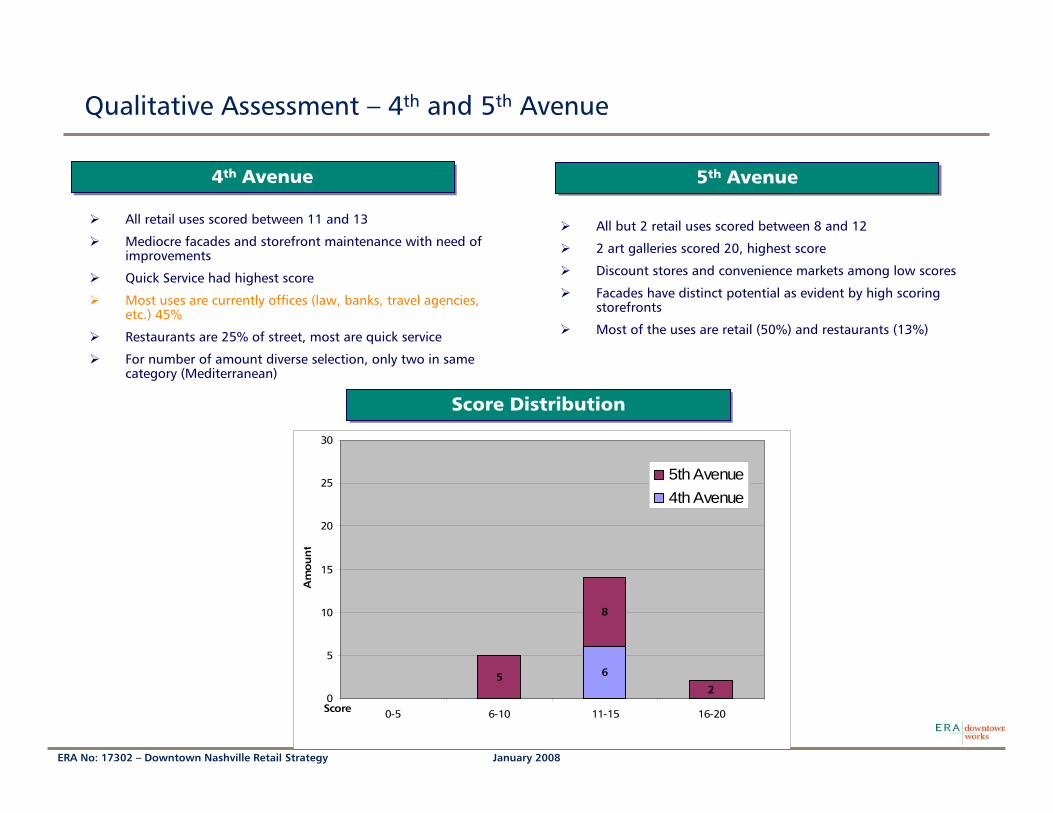
Qualitative Assessment – 4th and 5th Avenue
4th Avenue4th Avenue 5th Avenue5th Avenue
Score DistributionScore Distribution
65
8
20
5
10
15
20
25
30
0-5 6-10 11-15 16-20Score
Am
ou
nt
5th Avenue4th Avenue
All retail uses scored between 11 and 13
Mediocre facades and storefront maintenance with need of improvements
Quick Service had highest score
Most uses are currently offices (law, banks, travel agencies, etc.) 45%
Restaurants are 25% of street, most are quick service
For number of amount diverse selection, only two in same category (Mediterranean)
All but 2 retail uses scored between 8 and 12
2 art galleries scored 20, highest score
Discount stores and convenience markets among low scores
Facades have distinct potential as evident by high scoring storefronts
Most of the uses are retail (50%) and restaurants (13%)

January 2008ERA No: 17302 – Downtown Nashville Retail Strategy
Downtown Core Merchandise Mix Plan

January 2008ERA No: 17302 – Downtown Nashville Retail Strategy
4th Avenue - Fashion4th Avenue - Fashion 5th Avenue of the Arts5th Avenue of the Arts
A central focus for 4th Avenue is fashion
While fashion is a focus, it is not a limitation
Fashion includes a wide range of categoriesMen’s apparel and shoes (prime recruitment target)Women’s apparel and shoesDenim barsJewelry / watchesAccessories (handbags, shawls, etc.)WatchesOptical
Cosmetics (high-end, Blue Mercury/Sephora/Cosmetic Market rather than Sally’s Beauty Supply)
Gift/card/stationary and small office supplies
Reinvigorate Avenue of the Arts
One-of-a-kind opportunity in Nashville
Currently operates as local resident, downtown employee, and business (primarily) visitor destination
Focus recruitment on anything related to the arts
Café’s and coffee shops (in Arcade, too)
Art Galleries (not limited to 2-d paintings)PhotographySculptureHome décor (i.e. unique fabrics, stained glass, pillows, , etc.)
Art and craft suppliesPaints, easels, canvas, brushes, etcSmall office supply
Decorative Paper supply/gift
4th Avenue and 5th Avenue between Church and Union exhibit the most potential for retail improvement and contiguous retail clusters.

January 2008ERA No: 17302 – Downtown Nashville Retail Strategy
Several other areas adjacent to 4th and 5th Avenues impact on the retail strategy and should be recognized
Church StreetChurch Street
The Arcade should not be lost as an asset to downtown
It is part of downtown history and culture
Types of uses are appropriate
Condition is poor
Needs structural, systems, and aesthetic renovation
As retail on 4th Ave. and 5th Ave. becomes healthy, recruitment efforts should wrap corners on Church
Street and Union Street (where possible) and expand to 6th Ave. and 3rd Ave.
On Church Street 1st floor architecture, setbacks, and inactive uses/spaces (i.e. bank buildings, parks,
churches) are all “retail inhibitors.” Great and necessary uses in downtowns, but not on primary retail street
Potential retail services or uses for initial expansion beyond 4th and 5th Street include salons and spas,
restaurants, and retails services, such as café/catering or bakeries (displays goods & activity in window), travel,
florist, design, etc.
8th Ave. around Church and Commerce is emerging as destination retail; however
connection to 4th and 5th Ave. is long term
Why not 7th? Need we say more?
ArcadeArcade
OtherOther

January 2008ERA No: 17302 – Downtown Nashville Retail Strategy
The retail improvement on 2nd Avenue involves recruiting restaurant or retail uses as viable opportunities for spaces that currently have negative influence on the street and downtown Nashville’s identity.
2nd Avenue2nd Avenue
Expansion of late-night (18+) clubs should be thwartedSelect handful are sore spots on the streetAs residential grows in downtown side effects of late-night club will exacerbate and become more controversialDo not cater to or attract the target customer from the defined trade area
Focus on attracting more restaurants to 2nd as clubs are replaced
Lunch and dinner – Full service and sit-downCater to employee and resident population
Italian, French, California-cuisine, etc.
Independent/art movie theaters/bowling alleys are ideal for deep space or arcade/hallway access
Retail opportunitiesGiftSouvenir (closer to Broadway)Electronics (i.e. music/entertainment related)Shift some souvenir apparel to vintage boutique apparel that can cater to tourists and locals
1st Avenue Opportunity1st Avenue Opportunity
Riverfront is a great amenity, but not a retail play
Single deep buildings connect from 2nd Avenue to 1st Avenue
Potential to divide buildings and create entrances on both streets
1st Avenue opportunities lie in restaurant or visitor uses that favor “views” (of the river)
Retailers favor space for merchandise, co-tenancy, and streets with double-sided retail
Printer’s AlleyPrinter’s Alley
Historic street, but last printer left around 1975
Now entertainment street gone awry
Needs extensive and thorough cleaning
Re-evaluation of uses
Upgrade tenancy, but maintain entertainment flair (part of history)
AT & T Switching StationMajor gap in retail along street, interrupts synergyExplore ways to activate ground levelLikely require architectural/design services
January 2008ERA No: 17302 – Downtown Nashville Retail Strategy
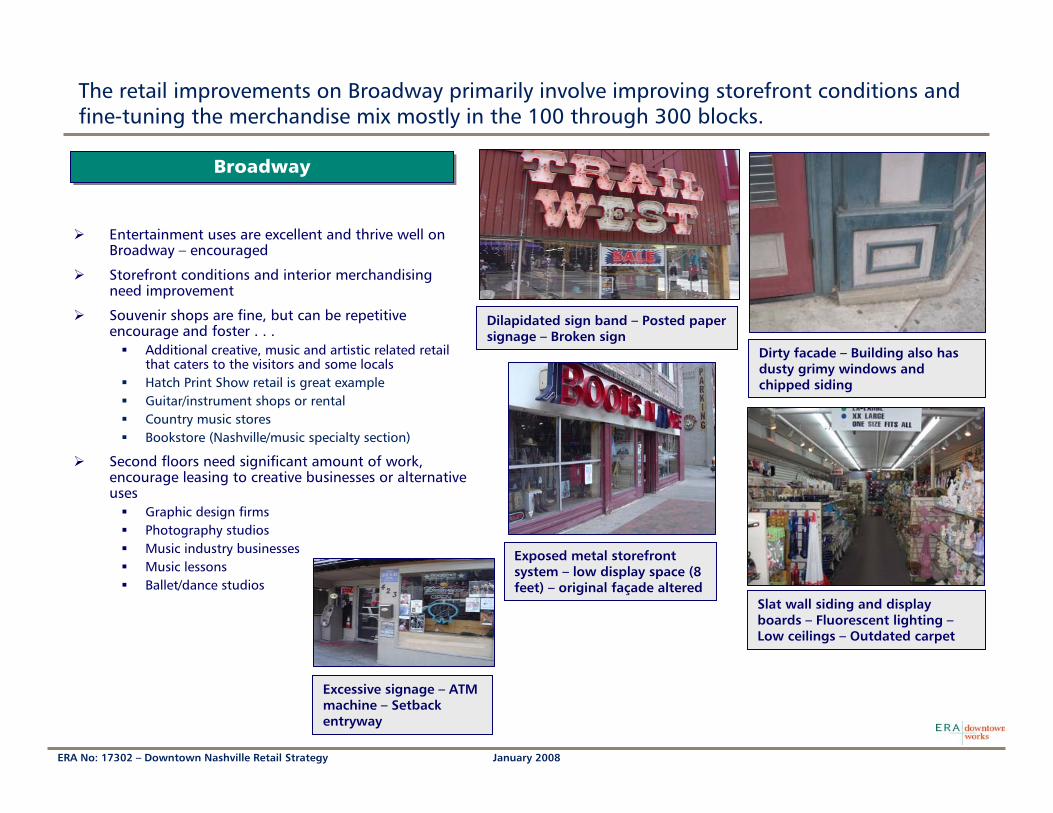
The retail improvements on Broadway primarily involve improving storefront conditions and fine-tuning the merchandise mix mostly in the 100 through 300 blocks.
BroadwayBroadway
Entertainment uses are excellent and thrive well on Broadway – encouraged
Storefront conditions and interior merchandising need improvement
Souvenir shops are fine, but can be repetitive encourage and foster . . .
Additional creative, music and artistic related retail that caters to the visitors and some localsHatch Print Show retail is great exampleGuitar/instrument shops or rentalCountry music storesBookstore (Nashville/music specialty section)
Second floors need significant amount of work, encourage leasing to creative businesses or alternative uses
Graphic design firmsPhotography studiosMusic industry businessesMusic lessonsBallet/dance studios
Slat wall siding and display boards – Fluorescent lighting –Low ceilings – Outdated carpet
Dirty facade – Building also has dusty grimy windows and chipped siding
Excessive signage – ATM machine – Setback entryway
Dilapidated sign band – Posted paper signage – Broken sign
Exposed metal storefront system – low display space (8 feet) – original façade altered
January 2008ERA No: 17302 – Downtown Nashville Retail Strategy
Full Downtown Merchandise Mix Plan

January 2008ERA No: 17302 – Downtown Nashville Retail Strategy
Plans and strategies are important tools, but their effectiveness is minimal without a strong and sustained Implementation Program. January 2008 through June 2008 ERA|DW will jump-start and participate in the implementation of Merchandise Mix Plans
Vacancies and short-term leases are priority opportunity sites for retail recruitment efforts
Downtown is underserved by most retail categories
Full-service restaurants should be welcomed in any location
Retail RecruiterRetail Recruiter
Central component of the Implementation Program
Completed comprehensive hiring processNashville Downtown Partnership employeeCrissy Cassetty – January 2008 start
Non-commissioned based salary
Brings viable prospects to landlords or their real estate representative – Match Maker
Ensure that great prospects are not lost
Work with MDHA/Metro Planning or any other relevant agencies to facilitate store opening
Phase I:Train the Recruiter (Retail 101)
Introduce Recruiter to landlords, brokers, retailers
Commence property/tenant information database
Guide development of marketing piece (ERA|DW and Recruiter)
Phase II:Train the Recruiter (on-the-job)
Participate in training with other Recruiters
Prospect in Nashville & evaluate targets (ERA|DW & Recruiter)
Develop Salesforce database for recruitment targets
Phase III:Follow-up with prospects (visits,
information, tours, etc.)Gradually expand prospecting base as appropriate (i.e. Franklin, Brentwood,
Knoxville, Asheville, Lexington, Louisville, Birmingham)
Tackle challenging landlords

January 2008ERA No: 17302 – Downtown Nashville Retail Strategy
Beyond prospecting for retailers, other action items should be pursued as part of a holistic downtown retail strategy and implementation program.
Enhance Storefront and Signage Design Guidelines for new development and renovationSpecific to appropriate retail design (i.e. display space, entryways, sign bands)
Individual storefronts should be differentiated from storefronts on either side and from floors above
Created by professional retail designer(s)
Mandatory or heavily incentivized
MDHAPartnershipMPO
Approach Arcade ownership with compelling case for improvements
Build consensus and commitment to the Retail Strategy among property owners and stakeholders
Explore (long term) reconfiguration of Church Street office buildings’ ground floors
Institute incentives to facilitate retail revitalization (tenant build-out, façade improvements, building rehabilitation, etc.)
Forgivable Loan programs: St. Louis. MO & Stamford, CT: First round - $250,000 pool with $10,000 - $50,000 forgivable
Loan forgiven over time, but tenant required to pay attention to quality of business operations
Requires commitment from all downtown agencies and private sectors (i.e. banks for loans)
Can dramatically jump-start retail efforts
To have an impact, incentives MUST be strategically disbursed by location and to tenants that fulfill the Merchandise Mix Plan

January 2008ERA No: 17302 – Downtown Nashville Retail Strategy
Downtown Nashville is ready to build upon its downtown successes and add a new dynamic to downtown - retail!
Ultimately the Core will impact the identity and success of the remainder of downtown; while recruitment efforts address all sub-districts in downtown short-term efforts
primarily focus on jump-starting the Core

December 2007ERA No: 17302 – Downtown Nashville Retail Strategy Slide 30
Appendix

December 2007ERA No: 17302 – Downtown Nashville Retail Strategy Slide 31
Detailed Tapestry Life Mode and Segmentation Tables
Name Households % of Total Name Households % of Total Name Households % of TotalHigh Society 791 0.88% High Society 12,391 9.84% High Society 38,893 35.4%
01 Top Rung 302 0.34% 01 Top Rung 2,369 1.88% 02 Suburban Splendor 9,720 8.9%03 Connoisseurs 489 0.55% 02 Suburban Splendor 1,759 1.40% 04 Boomburbs 16,187 14.7%
Upscale Avenues 1,946 2.17% 03 Connoisseurs 5,902 4.69% 06 Sophisticated Squires 6373 5.8%09 Urban Chic 870 0.97% 05 Wealthy Seaboard Suburbs 286 0.23% 07 Exurbanites 6613 6.0%18 Cozy and Comfortable 1,076 1.20% 06 Sophisticated Squires 239 0.19% Upscale Avenues 28,449 25.9%
Metropolis 21,850 24.38% 07 Exurbanites 1,836 1.46% 13 In Style 13,032 11.9%22 Metropolitans 9,381 10.47% Upscale Avenues 20,305 16.12% 16 Enterprising Professionals 6,958 6.3%51 Metro City Edge 8,456 9.44% 09 Urban Chic 401 0.32% 17 Green Acres 5,877 5.4%62 Modest Income Homes 4,013 4.48% 13 In Style 5,756 4.57% 18 Cozy and Comfortable 2,582 2.4%
Solo Acts 12,608 14.07% 16 Enterprising Professionals 7,216 5.73% Metropolis 468 0.4%08 Laptops and Lattes 1,913 2.13% 17 Green Acres 837 0.66% 22 Metropolitans 468 0.4%23 Trendsetters 286 0.32% 18 Cozy and Comfortable 6,095 4.84% Solo Acts 2596 2.4%27 Metro Renters 6,491 7.24% Metropolis 5,698 4.52% 39 Young and Restless 2596 2.4%36 Old and Newcomers 2,438 2.72% 22 Metropolitans 3,841 3.05% Senior Styles 3002 2.7%39 Young and Restless 1,480 1.65% 51 Metro City Edge 1,857 1.47% 14 Prosperous Empty Nesters 1862 1.7%
Senior Styles 9,515 10.62% Solo Acts 27,955 22.19% 29 Rustbelt Retirees 391 0.4%14 Prosperous Empty Nesters 186 0.21% 36 Old and Newcomers 6,704 5.32% 30 Retirement Communities 749 0.7%29 Rustbelt Retirees 3,308 3.69% 39 Young and Restless 21,251 16.87% High Hopes 12783 11.6%30 Retirement Communities 583 0.65% Senior Styles 19,742 15.67% 28 Aspiring Young Families 12529 11.4%57 Simple Living 1,116 1.25% 14 Prosperous Empty Nesters 4,943 3.92% 48 Great Expectations 254 0.2%65 Social Security Set 4,322 4.82% 29 Rustbelt Retirees 3,688 2.93% Global Roots 671 0.6%
Scholars & Patriots 2,661 2.97% 30 Retirement Communities 6,287 4.99% 38 Industrious Urban Fringe 671 0.6%55 College Towns 2,006 2.24% 50 Heartland Communities 329 0.26% L9. Family Portrait 10828 9.9%63 Dorms to Diplomas 655 0.73% 57 Simple Living 3,779 3.00% 12 Up and Coming Families 7755 7.1%
High Hopes 8,813 9.83% 65 Social Security Set 716 0.57% 19 Milk and Cookies 3073 2.8%28 Aspiring Young Families 1,382 1.54% High Hopes 24,135 19.16% Traditional Living 4779 4.4%48 Great Expectations 7,431 8.29% 28 Aspiring Young Families 18,316 14.54% 32 Rustbelt Traditions 1041 0.9%
Global Roots 6,013 6.71% 48 Great Expectations 5,819 4.62% 33 Midlife Junction 3738 3.4%38 Industrious Urban Fringe 935 1.04% L8. Global Roots 4,387 3.48% Factories & Farms 970 0.9%52 Inner City Tenants 4,335 4.84% 52 Inner City Tenants 4,387 3.48% 25 Salt of the Earth 970 0.9%60 City Dimensions 743 0.83% Family Portrait 6,987 5.55% American Quilt 7058 6.4%
Family Portrait 6,547 7.31% 12 Up and Coming Families 1,736 1.38% 26 Midland Crowd 5884 5.4%64 City Commons 6,547 7.31% 19 Milk and Cookies 5,251 4.17% 41 Crossroads 1174 1.1%
Traditional Living 14,060 15.69% Traditional Living 13,839 10.99%24 Main Street, USA 644 0.72% 24 Main Street, USA 725 0.58%32 Rustbelt Traditions 9,306 10.38% 32 Rustbelt Traditions 5,970 4.74%33 Midlife Junction 1,537 1.72% 33 Midlife Junction 6,175 4.90%34 Family Foundations 2,573 2.87% 34 Family Foundations 969 0.77%
Factories & Farms 3,613 4.03% Factories & Farms 2,715 2.16%53 Home Town 3,613 4.03% 25 Salt of the Earth 2,122 1.68%
American Quilt 1,198 1.34% 53 Home Town 593 0.47%41 Crossroads 1,198 1.34% American Quilt 1,659 1.32%
41 Crossroads 1,213 0.96%46 Rooted Rural 446 0.35%
Source: ESRI Business Analyst; Economics Research Associates; 2007
Primary Market (10 Min Drive Time) Secondary Market (20 Min Drive Time) Tertiary Market (30 Min Drive Time)

December 2007ERA No: 17302 – Downtown Nashville Retail Strategy Slide 32
Top Life Mode groups and subsequent key Segmentation groups for each market area
Secondary Market Tapestry Housholds
Category Households % of TotalSolo Acts 27,955 22%
39 Young and Restless 21,251 5%High Hopes 24,135 17%
28 Aspiring Young Families 18,316 16%Upscale Avenues 20,305 4%
16 Enterprising Professionals 7,216 3%13 In Style 5,756 5%18 Cozy and Comfortable 6,095 5%
Source: ESRI Business Analyst; Economics Research Associates; 2007
Tertiary Market Tapestry Housholds
Category Households % of TotalHigh Society 38,893 35%
04 Boomburbs 16,187 15%Upscale Avenues 28,449 26%
13 In Style 13,032 12%16 Enterprising Professionals 6,958 6%
High Hopes 12,783 12%28 Aspiring Young Families 12,529 11%
Source: ESRI Business Analyst; Economics Research Associates; 2007
Primary Market Tapestry Households
Category Households % of TotalMetropolis 21,850 24%
22 Metropolitans 9,381 10%51 Metro City Edge 8,456 9%
Traditional Living 14,060 16%32 Rustbelt Traditions 9,306 10%
Solo Acts 12,608 14%27 Metro Renters 6,491 7%
High Society 791 1%Source: ESRI Business Analyst; Economics Research Associates; 2007

December 2007ERA No: 17302 – Downtown Nashville Retail Strategy Slide 33
Detailed Qualitative Assessment Tables
4th and 5th Avenues Use Breakdown
Category Sub Category # of Stores
% of Total
% of Category
Retail 8 31%Apparel (men) 1 4% 13%Art Gallery 2 8% 25%Convenience 0 0% 0%Discount/Value 2 8% 25%Drugstore 1 4% 13%Gift 1 4% 13%Jewelry 1 4% 13%
Restaurants 7 27%American (Southern) 0 0% 0%Asian 1 4% 14%Deli 1 4% 14%Mediterranean 2 8% 29%Mongolian 1 4% 14%Quick Service 0 0% 0%
Retail Service 1 4%Dry Cleaner 1 4% 100%
Other 4 15%Office 4 15% 100%
Vacant 5 19% 100%
TOTAL 26 100%Source: Economics Research Associates, 2007
Broadway and 2nd Avenues Use Breakdown
Category Sub Category # of Stores
% of Total
% of Category
Retail 23 23%Apparel (women) 1 1% 4.3%Apparel (unisex) 2 2% 8.7%Gift 3 3% 13.0%Music - Related 3 3% 13.0%Shoes 2 2% 8.7%Souvenirs 12 12% 52.2%
Restaurants 21 21%American 9 9% 43%American (Southern) 1 1% 5%Asian 1 1% 5%Bakery/Ice Cream 1 1% 5%Italian 1 1% 5%Mexican 1 1% 5%Quick Service 7 7% 33%
Entertainment 14 14%Bar/Pub 3 3% 21%Club 5 5% 36%Live Music 6 6% 43%
Entertainment w/Food 12 12%
Activity 2 2% 17%Bar 7 7% 58%Live Music 3 3% 25%
Retail Service 3 3%Copies/Mail 1 1% 33%Salon 1 1% 33%Tattoo 1 1% 33%
Other 20 20%Office 17 17% 85%Other 2 2% 10%Residential 1 1% 5%
Vacant 5 5% 100%
TOTAL 98 100%Source: Economics Research Associates, 2007