downsize in 3d, supersize in 1d: effects of dimensionality on … · 2016-11-30 · the obesity...
TRANSCRIPT

1 INSEAD Prof. Pierre Chandon
Downsize in 3D, Supersize in 1D: Effects of Dimensionality on Size
Estimation, Size Choice, and Quantity Discount Expectation
Pierre ChandonNailya Ordabayeva
INSEAD Behavioral Brown Bag SeminarSeptember 25, 2007
Agenda
BackgroundThe obesity epidemicSupersized and downsized portions and packages
Conceptual frameworkThe power law of perceptionEffect of object dimensionality
2 Lab studiesStudy 1: Size estimation Study 2: WTP and debiasing effects of objective size information
2 Field studiesStudy 3: Effects of pack dimensionality on consumers’ supersizing decisionsStudy 4: Effects of pack dimensionality on consumers downsizing decisions
Conclusion
2 INSEAD Prof. Pierre Chandon
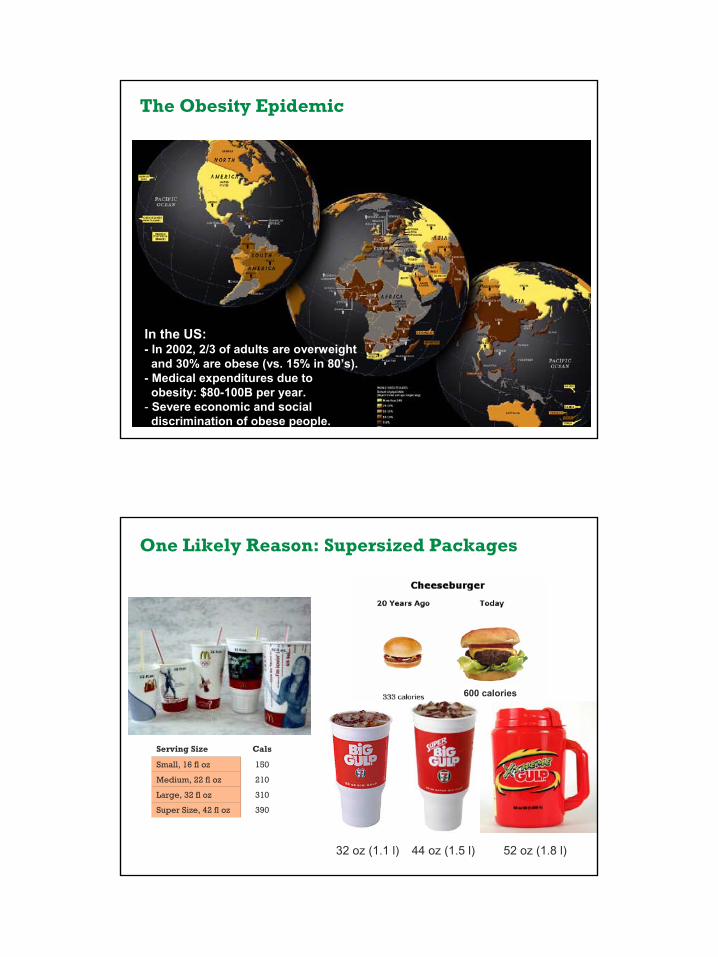
The Obesity Epidemic
In the US:- In 2002, 2/3 of adults are overweight
and 30% are obese (vs. 15% in 80’s). - Medical expenditures due to
obesity: $80-100B per year.- Severe economic and social
discrimination of obese people.
One Likely Reason: Supersized Packages
52 oz (1.8 l) 32 oz (1.1 l) 44 oz (1.5 l)
390Super Size, 42 fl oz
310Large, 32 fl oz
210Medium, 22 fl oz
150Small, 16 fl oz
CalsServing Size
600 calories
3 INSEAD Prof. Pierre Chandon

4 INSEAD Prof. Pierre Chandon
Triple Bypass Burger "Taste Worth Dying For®."
(8,000 calories)
Downsizing to Attract Restrained Eaters and Pre-empt Adverse Regulations
51% of Americans (63% of women) believe that portion sizes in restaurants are too big
Mixed ResultsRuby Tuesday: in 2004 downsizing (pasta, French fries and some entrees) led to 5% sales dip and eventual failure of the strategy after just 5 months. Recovered by offering excess portions.
TGI Friday: 10 entrees sold in portions about 30% smaller and priced about one third less than regular entrees
5 INSEAD Prof. Pierre Chandon
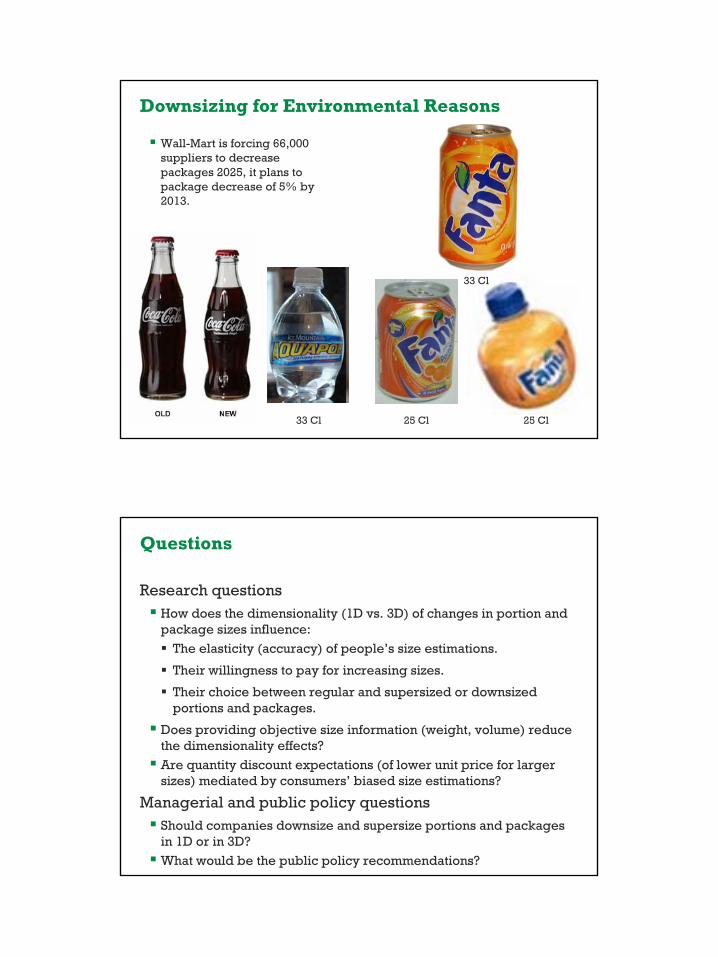
Downsizing for Environmental Reasons
Wall-Mart is forcing 66,000 suppliers to decrease packages 2025, it plans to package decrease of 5% by 2013.
33 Cl
33 Cl
25 Cl 25 Cl
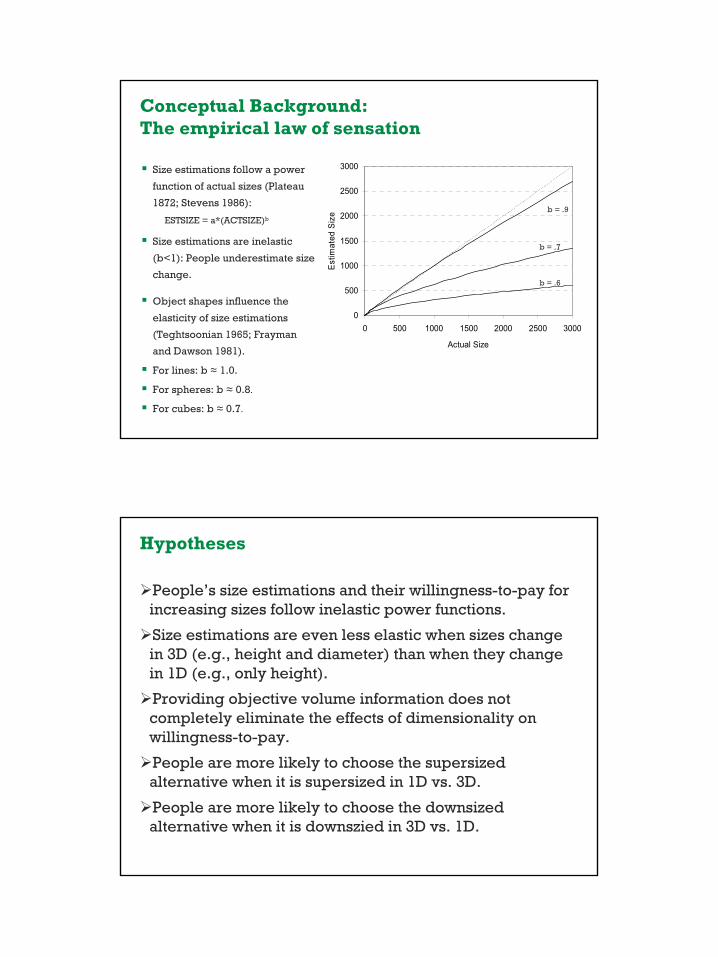
Questions
Research questionsHow does the dimensionality (1D vs. 3D) of changes in portion and package sizes influence:
The elasticity (accuracy) of people’s size estimations.
Their willingness to pay for increasing sizes.
Their choice between regular and supersized or downsized portions and packages.
Does providing objective size information (weight, volume) reduce the dimensionality effects?
Are quantity discount expectations (of lower unit price for larger sizes) mediated by consumers’ biased size estimations?
Managerial and public policy questionsShould companies downsize and supersize portions and packages in 1D or in 3D?
What would be the public policy recommendations?
6 INSEAD Prof. Pierre Chandon
Size estimations follow a power
function of actual sizes (Plateau
1872; Stevens 1986):
ESTSIZE = a*(ACTSIZE)b
Size estimations are inelastic
(b<1): People underestimate size
change.
0
500
1000
1500
2000
2500
3000
0 500 1000 1500 2000 2500 3000
Actual SizeE
stim
ated
Siz
e
Conceptual Background:The empirical law of sensation
b = .7
b = .9
b = .6
Object shapes influence the
elasticity of size estimations
(Teghtsoonian 1965; Frayman
and Dawson 1981).
For lines: b ≈ 1.0.
For spheres: b ≈ 0.8.
For cubes: b ≈ 0.7.
Hypotheses
People’s size estimations and their willingness-to-pay for increasing sizes follow inelastic power functions.
Size estimations are even less elastic when sizes change in 3D (e.g., height and diameter) than when they change in 1D (e.g., only height).
Providing objective volume information does not completely eliminate the effects of dimensionality on willingness-to-pay.
People are more likely to choose the supersizedalternative when it is supersized in 1D vs. 3D.
People are more likely to choose the downsized alternative when it is downszied in 3D vs. 1D.

7 INSEAD Prof. Pierre Chandon
Study 1: Effects of Dimensionality and Size EstimationsGoal
Effect of dimensionality on size estimations of packages that change along 1D vs. 3D.
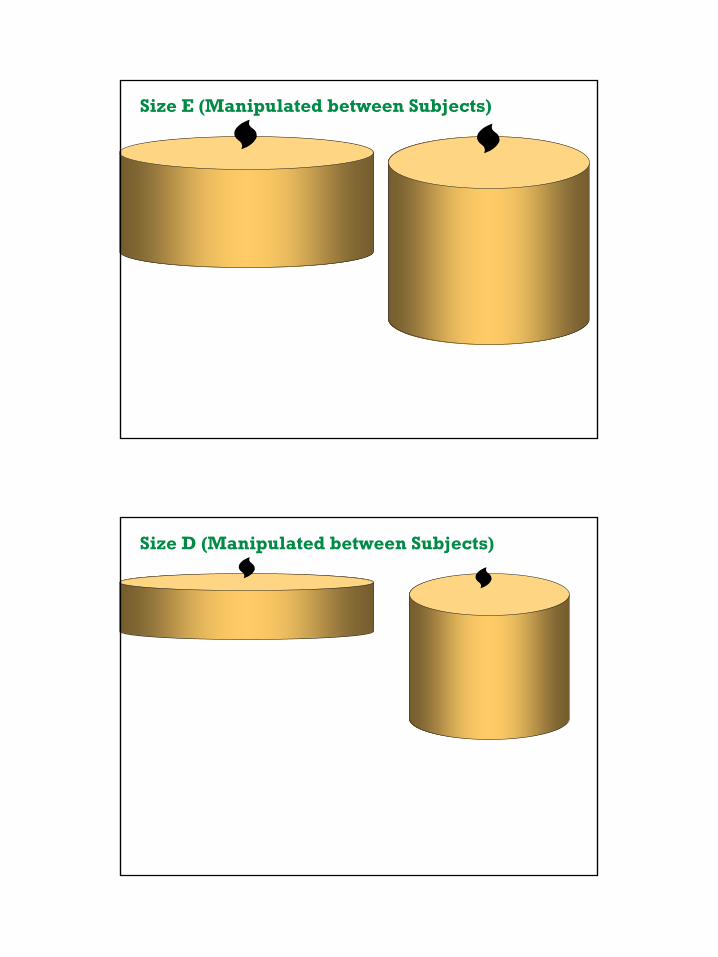
6 x 2 mixed designWithin subjects: 6 sizes (doubling rule: A:50g, B:100g, C:200g, D:400g, E:800g, F:1,600g)
2 dimensionality conditions (between subjects: 1D (height) or 3D(height and diameter).
Procedure60 participants asked to estimate the size (in grams) of 5 increasing sizes of the same candle.
The size of the smallest candle was given (A:50 grams).
Participants saw pictures of the candles.
Size F (Manipulated between Subjects)
8 INSEAD Prof. Pierre Chandon
Size E (Manipulated between Subjects)
Size D (Manipulated between Subjects)

9 INSEAD Prof. Pierre Chandon
Size C (Manipulated between Subjects)
Size B (Manipulated between Subjects)
10 INSEAD Prof. Pierre Chandon
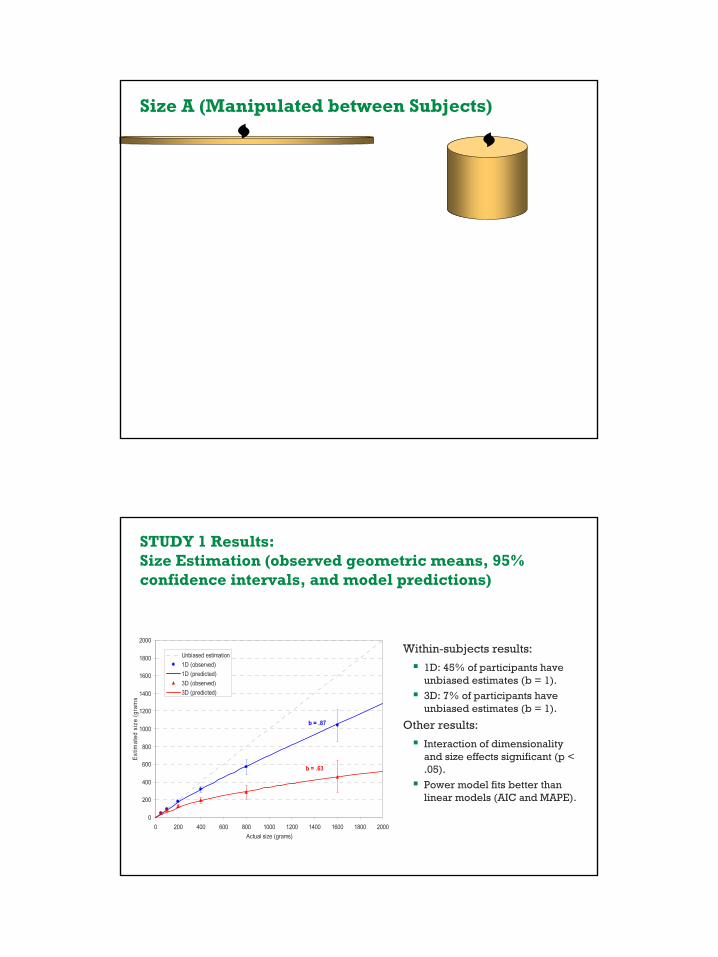
Size A (Manipulated between Subjects)
STUDY 1 Results:Size Estimation (observed geometric means, 95% confidence intervals, and model predictions)
Within-subjects results:
1D: 45% of participants have unbiased estimates (b = 1).
3D: 7% of participants have unbiased estimates (b = 1).
Other results:
Interaction of dimensionality and size effects significant (p < .05).
Power model fits better than linear models (AIC and MAPE).
0
200
400
600
800
1000
1200
1400
1600
1800
2000
0 200 400 600 800 1000 1200 1400 1600 1800 2000Actual size (grams)
Estim
ated
siz
e (g
ram
s
Unbiased estimation1D (observed)1D (predicted)3D (observed)3D (predicted)
b = .87
b = .63

11 INSEAD Prof. Pierre Chandon
STUDY 2: Effects of Dimensionality and Size Information on Size Estimations and WTPGoal
Effect of dimensionality on WTP (due to size estimations?), effect of objective size information, real product representations, products pre-tested for alternative quantity discount explanations
Design
Within subjects: 6 sizes (same as in Study 1).
Between subjects: 2 x 2 with one control condition:
2 within-subjects replications: 2 non-food categories: dishwashing detergent and wool.
3D with size information
1D with size information
Control (size information only)
3D without size information
1D without size information
Procedure
Size and price of Size A were provided.
162 participants provided size and willingness to pay for sizes B to F
Order of dependent variable counterbalanced.
Participants could see and touch the actual products.
Study 2: Selected Stimuli (Sizes A, C, and E)
Dishwashing
powder
Wool
1D Condition 3D Condition
12 INSEAD Prof. Pierre Chandon
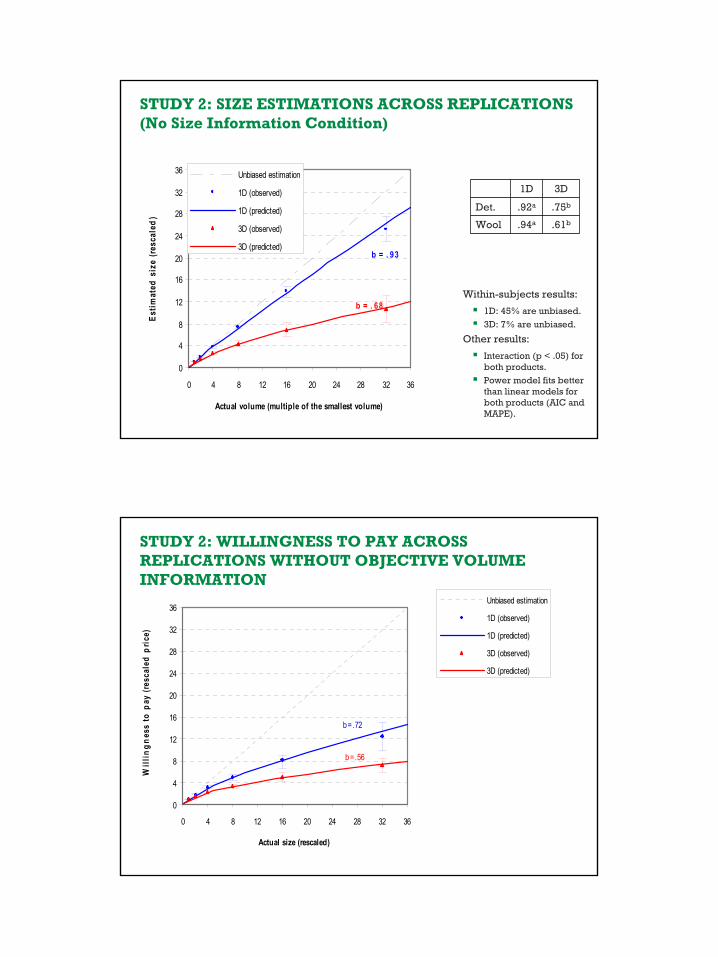
STUDY 2: SIZE ESTIMATIONS ACROSS REPLICATIONS (No Size Information Condition)
.61b.94aWool
.75b.92aDet.
3D1D
Within-subjects results:
1D: 45% are unbiased.
3D: 7% are unbiased.
Other results:
Interaction (p < .05) for both products.
Power model fits better than linear models for both products (AIC and MAPE).
0
4
8
12
16
20
24
28
32
36
0 4 8 12 16 20 24 28 32 36
Actual volume (multiple of the smallest volume)
Estim
ated
siz
e (re
scal
ed)
Unbiased estimation
1D (observed)
1D (predicted)
3D (observed)
3D (predicted)b = . 93
b = . 68
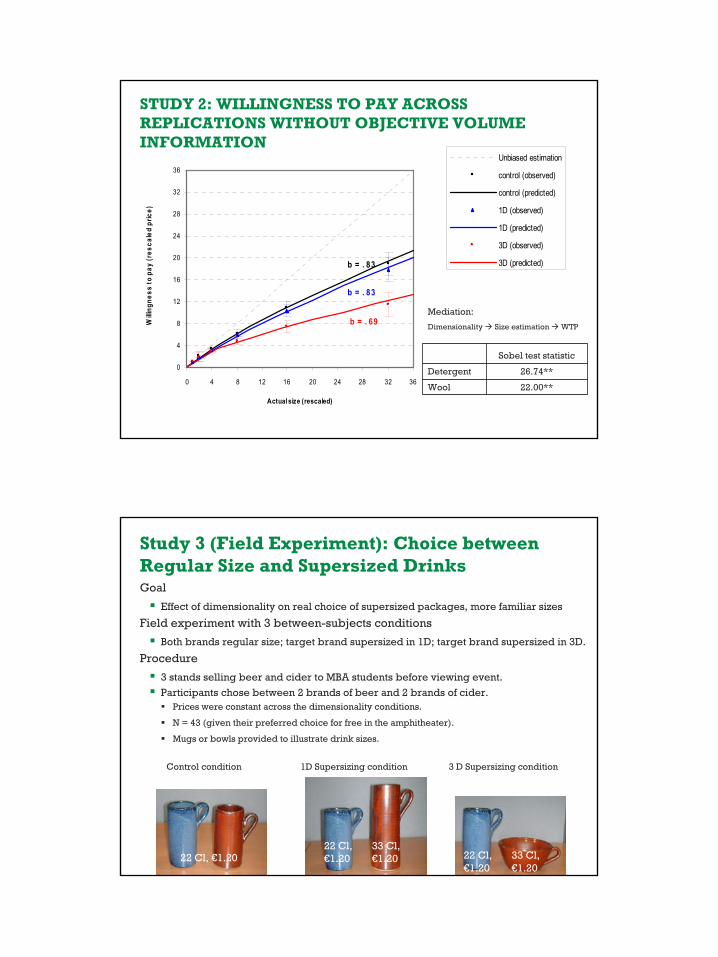
STUDY 2: WILLINGNESS TO PAY ACROSS REPLICATIONS WITHOUT OBJECTIVE VOLUME INFORMATION
0
4
8
12
16
20
24
28
32
36
0 4 8 12 16 20 24 28 32 36
Actual size (rescaled)
Will
ingn
ess
to p
ay (r
esca
led
pric
e)
Unbiased estimation
1D (observed)
1D (predicted)
3D (observed)
3D (predicted)
b = .72
b = .56
13 INSEAD Prof. Pierre Chandon
0
4
8
12
16
20
24
28
32
36
0 4 8 12 16 20 24 28 32 36
Actual size (rescaled)
Willi
ngne
ss to
pay
(res
cale
d pr
ice)
Unbiased estimation
control (observed)
control (predicted)
1D (observed)
1D (predicted)
3D (observed)
3D (predicted)
b = . 83
b = . 69
b = . 83
STUDY 2: WILLINGNESS TO PAY ACROSS REPLICATIONS WITHOUT OBJECTIVE VOLUME INFORMATION
Mediation:
Dimensionality Size estimation WTP
22.00**Wool
26.74**Detergent
Sobel test statistic
Study 3 (Field Experiment): Choice between Regular Size and Supersized DrinksGoal
Effect of dimensionality on real choice of supersized packages, more familiar sizes
Field experiment with 3 between-subjects conditions
Both brands regular size; target brand supersized in 1D; target brand supersized in 3D.
Procedure
3 stands selling beer and cider to MBA students before viewing event.
Participants chose between 2 brands of beer and 2 brands of cider.Prices were constant across the dimensionality conditions.
N = 43 (given their preferred choice for free in the amphitheater).
Mugs or bowls provided to illustrate drink sizes.
Control condition 1D Supersizing condition 3 D Supersizing condition
22 Cl, €1.2022 Cl, €1.20
33 Cl, €1.20 22 Cl,
€1.2033 Cl, €1.20
14 INSEAD Prof. Pierre Chandon
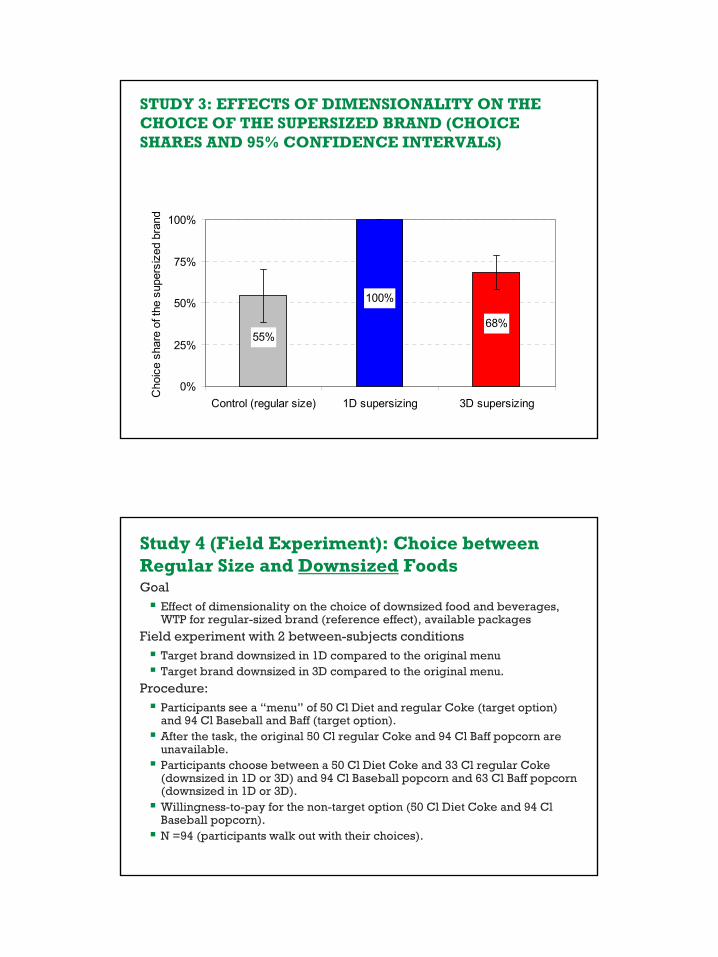
STUDY 3: EFFECTS OF DIMENSIONALITY ON THE CHOICE OF THE SUPERSIZED BRAND (CHOICE SHARES AND 95% CONFIDENCE INTERVALS)
68%55%
100%
0%
25%
50%
75%
100%
Control (regular size) 1D supersizing 3D supersizing
Cho
ice
shar
e of
the
supe
rsiz
ed b
rand
GoalEffect of dimensionality on the choice of downsized food and beverages, WTP for regular-sized brand (reference effect), available packages
Field experiment with 2 between-subjects conditionsTarget brand downsized in 1D compared to the original menuTarget brand downsized in 3D compared to the original menu.
Procedure:Participants see a “menu” of 50 Cl Diet and regular Coke (target option) and 94 Cl Baseball and Baff (target option).After the task, the original 50 Cl regular Coke and 94 Cl Baff popcorn are unavailable.Participants choose between a 50 Cl Diet Coke and 33 Cl regular Coke (downsized in 1D or 3D) and 94 Cl Baseball popcorn and 63 Cl Baff popcorn (downsized in 1D or 3D).Willingness-to-pay for the non-target option (50 Cl Diet Coke and 94 ClBaseball popcorn).N =94 (participants walk out with their choices).
Study 4 (Field Experiment): Choice between Regular Size and Downsized Foods

15 INSEAD Prof. Pierre Chandon
Study 4 (Field Study): Stimuli
Original menu (to set expectations, no choice recorded)
1D downsizing condition 3D downsizing condition
50 Cl, €.80
50 Cl, €.60
50 Cl, €.80
33 Cl, €.60 50 Cl,
€.8033 Cl, €.60
STUDY 4: EFFECTS OF DIMENSIONALITY ON THE CHOICE OF THE DOWNSIZED BRAND AND THE WILLINGNESS-TO-PAY FOR THE REGULAR-SIZED BRAND
48%
69%
€ 1.10
€ .86
0%
25%
50%
75%
100%
1D dow nsizing 3D dow nsizing 1D dow nsizing 3D dow nsizing
Choice of the dow nsized brand Willingness-to-pay for theregular-size brandC
hoic
e sh
are
of th
e do
wns
ized
bra
nd
.00 €
.30 €
.60 €
.90 €
1.20 €
16 INSEAD Prof. Pierre Chandon
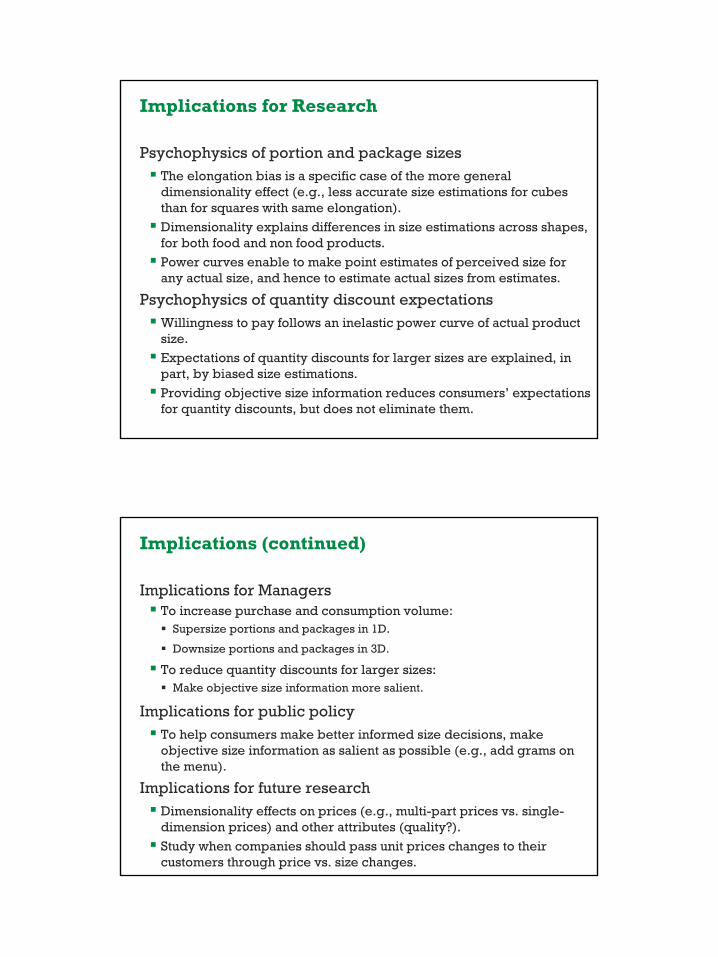
Implications for Research
Psychophysics of portion and package sizesThe elongation bias is a specific case of the more general dimensionality effect (e.g., less accurate size estimations for cubes than for squares with same elongation).
Dimensionality explains differences in size estimations across shapes, for both food and non food products.
Power curves enable to make point estimates of perceived size for any actual size, and hence to estimate actual sizes from estimates.
Psychophysics of quantity discount expectationsWillingness to pay follows an inelastic power curve of actual product size.
Expectations of quantity discounts for larger sizes are explained, in part, by biased size estimations.
Providing objective size information reduces consumers’ expectations for quantity discounts, but does not eliminate them.
Implications (continued)
Implications for ManagersTo increase purchase and consumption volume:
Supersize portions and packages in 1D.
Downsize portions and packages in 3D.
To reduce quantity discounts for larger sizes:Make objective size information more salient.
Implications for public policyTo help consumers make better informed size decisions, make objective size information as salient as possible (e.g., add grams on the menu).
Implications for future researchDimensionality effects on prices (e.g., multi-part prices vs. single-dimension prices) and other attributes (quality?).
Study when companies should pass unit prices changes to their customers through price vs. size changes.

17 INSEAD Prof. Pierre Chandon
Future Research
Magnitude production instead of magnitude estimation
Consumption of harmful products
Field study of quantity discounts in stores
Effect of dimensionality of attributes (e.g. prices) on choice and WTP