downloaded from on october 29
TRANSCRIPT

Ambulatory blood pressure adds littleto Framingham Risk Score for theprimary prevention of cardiovasculardisease in older men: secondaryanalysis of observational study data
Katy J L Bell,1,2 Elaine Beller,1 Johan Sundström,3 Kevin McGeechan,2
Andrew Hayen,3 Les Irwig,2 Bruce Neal,5 Paul Glasziou1
To cite: Bell KJL, Beller E,Sundström J, et al.Ambulatory blood pressureadds little to FraminghamRisk Score for the primaryprevention of cardiovasculardisease in older men:secondary analysis ofobservational study data.BMJ Open 2014;4:e006044.doi:10.1136/bmjopen-2014-006044
▸ Prepublication history forthis paper is available online.To view these files pleasevisit the journal online(http://dx.doi.org/10.1136/bmjopen-2014-006044).
Received 4 July 2014Accepted 11 August 2014
For numbered affiliations seeend of article.
Correspondence toDr Katy J L Bell;[email protected]
ABSTRACTObjective: To determine the incremental value ofambulatory blood pressure (BP) in predictingcardiovascular risk when the Framingham Risk Score(FRS) is known.Methods: We included 780 men withoutcardiovascular disease from the Uppsala LongitudinalStudy of Adult Men, all aged approximately 70 years atbaseline. We first screened ambulatory systolic BP(ASBP) parameters for their incremental value byadding them to a model with 10-year FRS. For the bestASBP parameter we estimated HRs and changes indiscrimination, calibration and reclassification. We alsoestimated the difference in the number of men startedon treatment and in the number of men protectedagainst a cardiovascular event.Results: Mean daytime ASBP had the highestincremental value; adding other parameters did not yieldfurther improvements. While ASBP was an independentrisk factor for cardiovascular disease, addition to FRSled to only small increases to the overall model fit,discrimination (a 1% increase in the area under thereceiver operating characteristic (ROC) curve),calibration and reclassification. We estimated that forevery 10 000 men screened with ASBP, 141 fewerwould start a new BP-lowering treatment (95% CI 62 to220 less treated), but this would result in7 fewer cardiovascular events prevented over thesubsequent 10 years (95% CI 21 fewer eventsprevented to 7 more events prevented).Conclusions: In addition to a standard cardiovascularrisk assessment it is not clear that ambulatory BPmeasurement provides further incremental value. Theclinical role of ambulatory BP requires ongoing carefulconsideration.
INTRODUCTIONThere is increasing interest in measuringpatients’ ambulatory blood pressure (BP), bothto confirm a diagnosis of hypertension and tomonitor response to treatment. For example,the UK’s National Institute for Health and
Care Excellence (NICE) 2011 guidelines onhypertension recommend the use of ambula-tory BP measurement to confirm the diagnosisof hypertension in all patients using the meanof measurements taken during waking hours.1
Ambulatory BP monitoring (ABPM) uses mea-surements made by an automated device over a24 h period and has a number of potentialadvantages. There is less likely to be ‘white coathypertension’ where BP is raised because thepatient is anxious about the measurement andthe ‘usual’ BP level is more accurately esti-mated by averaging several measurements over1 day. In addition, the within-day variability ofthe patient’s BP is able to be estimated becausemultiple measurements are taken. The amountof BP variability and the presence of BP thatdoes not decrease at night (non-dipping)appear to be independent risk factors for car-diovascular disease (CVD).2 3 If BP alone isconsidered (separate to other cardiovascularrisk factors), then ambulatory BP measure-ments are better at predicting CVD than clinicmeasurements.4–9
Strengths and limitations of this study
▪ Strengths include the high event rate and goodprecision for our estimates, reliable ascertainmentof outcomes with minimal losses to follow-up,relatively untreated population rigorous statisticalanalysis and clinically relevant results
▪ Limitations include an older age all male popula-tion who were all very close in age, home advan-tage to ambulatory systolic blood pressure (ASBP)in the models, assumption of 20% risk reductionwith treatment. In combination these limitationsmean our estimates are ‘best case’ estimates forthis population, and the incremental value of ASBPmay be even lower in other populations.
Bell KJL, et al. BMJ Open 2014;4:e006044. doi:10.1136/bmjopen-2014-006044 1
Open Access Research
group.bmj.com on October 29, 2014 - Published by http://bmjopen.bmj.com/Downloaded from

In parallel, clinical guidelines are increasingly recom-mending that the decision to start therapy to lower BP bebased at least partly on the individual’s overall absoluterisk of CVD10–15 using risk prediction scores such as theFramingham equation,16 rather than just considering theBP level alone. Other CVD risk equations includePROCAM,17 SCORE,18 ASSIGN19 and QRisk.20 Theserisk scores incorporate information about the individual’sgender, age, total cholesterol, high-density lipoprotein(HDL) cholesterol, diabetes and smoking status in add-ition to systolic BP (SBP) to arrive at their absolute risk ofa cardiovascular event within the next 5–10 years.21
Ambulatory BP measurements are only likely to be takenafter an initial BP screening in the clinic.22 Therefore, toproperly assess the value of ambulatory BP measurement,we need to estimate the incremental value in predictingcardiovascular disease, above and beyond risk predictionthat includes clinic BP measurement.There is some evidence that adding ambulatory SBP
(ASBP) values to clinic SBP, but ignoring other riskfactors, significantly improves the prediction of indivi-duals’ cardiovascular risk.23 Other evidence suggests thatadditional measurements of clinic SBP only marginallyadd to a single clinic SBP measurement when this iscombined with traditional risk factors in the predictionof an individual’s cardiovascular risk.24 The incrementalvalue of ASBP above and beyond risk scores based onthe Framingham equation is unknown.We aimed to estimate the incremental value of ambu-
latory BP measurement to 10-year cardiovascular riskscores based on the 2008 Framingham equation.16 Wetested ambulatory BP measures representing the averageand the variability of BP (see Methods section, statisticalanalysis for details).
METHODSStudy design and sampleWe used data from the Uppsala Longitudinal Study ofAdult Men (ULSAM). The methods for this study havebeen described previously.25 Briefly, ULSAM is an ongoinglongitudinal epidemiological study based on all availablemen born between 1920 and 1924 in Uppsala county,Sweden. The current paper uses baseline data from theage 70 survey which was conducted during 1991–1995. Ofthe original 1681, 1221 men in the ULSAM study whowere still alive and residing in Uppsala took part in the age70 reinvestigations. Of these, 835 men were free of CVD atbaseline and a total of 780 men (93.4%) had valid data for24 h ASBP and all Framingham covariates (age, total chol-esterol, HDL cholesterol, clinic SBP, smoking status, dia-betes status, BP-lowering treatment).At baseline, approximately 9% and 35% were on lipid
and BP-lowering treatment, respectively.
Measurement of risk factorsTwenty-four hour ASBPs were recorded usingAccutracker 2 equipment (Suntech Medical Instruments
Inc, Morrisville, North Carolina, USA). The device wasattached to the patient’s non-dominant arm by a skilledlaboratory technician, and BP recordings were madeevery 20 min for 24-h starting at 1100 h. SBP data wereedited by omitting all readings of zero and >270 and<80 mm Hg, and all readings where the differencebetween SBP and diastolic BP was less than 10 mm Hg.Short fixed clocktime intervals were used, definingdaytime as 10:00 to 20:00 and night-time as midnight to06:00 as previously suggested.26 The median number ofdaytime measurements available for analysis per manwas 30 (IQR 25–33, five men had less than 14measurements).Clinic BP was measured in the right arm of supine
patients with a sphygmomanometer using the appropri-ate cuff size; recordings were made to the nearest2 mm Hg twice after 10 min rest, and the mean of thetwo measurements was used for the analyses. Serumtotal and HDL cholesterol levels were determined withstandardised enzymatic methods. Cigarette smokingstatus was ascertained through interview reports.Diabetes was defined by applying 1985 WHO criteria tofasting glucose and oral glucose tolerance test.BP-lowering treatment was determined using aquestionnaire.
Follow-up and outcome eventsThe population was followed for up to 17.3 years sincethe start of the investigation at age 70 years. The medianfollow-up period was 14 years (IQR 6.6–15.5 years). Endof follow-up was at the first of: cardiovascular event, lossto follow-up, last follow-up visit.Outcome variables were defined using data from the
Swedish Hospital Discharge and Cause of DeathRegistries. Cardiovascular morbidity was defined as acomposite end point, including death or first hospitalisa-tion from coronary heart disease (ICD-9 codes 410–414,or ICD-10 codes I20–I25) and stroke (ICD-9 codes 431–436, or ICD-10 codes I61–I66). A quality control studyby the Swedish centres of the WHO MONICA study pre-viously showed good agreement between official routinemortality statistics and registration of myocardialinfarction.27
Statistical analysisWe used Cox proportional hazard models for analysis.The proportional hazards and linearity assumptionswere tested for each covariate and found to hold.We applied a log transformation to all ASBP variables
for consistency with the Framingham risk equation. Weincluded these in the models as continuous variables.Framingham Risk Scores (FRS) were calculated usingthe published equation for 10-year risk.16
Descriptive statistics were performed for traditionalrisk factors and calculated FRS and unadjusted HRs esti-mated. We built a base model for comparison whichincluded only FRS. We then screened a number of dif-ferent ambulatory BP measures for incremental
2 Bell KJL, et al. BMJ Open 2014;4:e006044. doi:10.1136/bmjopen-2014-006044
Open Access
group.bmj.com on October 29, 2014 - Published by http://bmjopen.bmj.com/Downloaded from
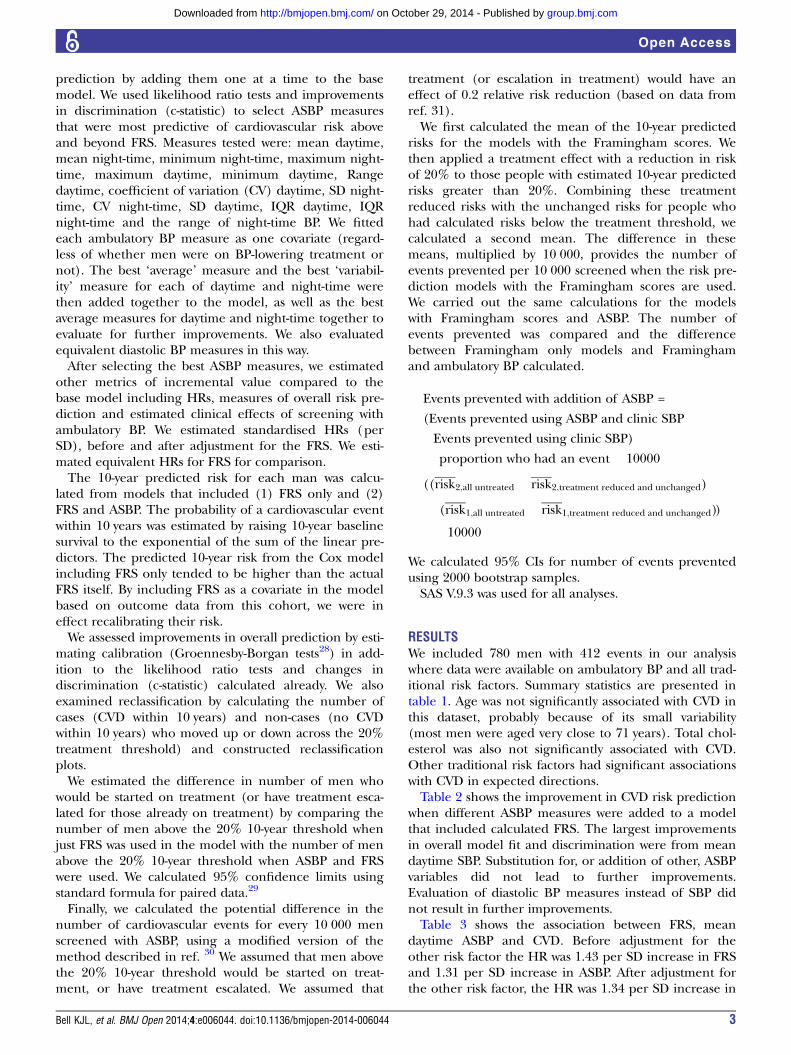
prediction by adding them one at a time to the basemodel. We used likelihood ratio tests and improvementsin discrimination (c-statistic) to select ASBP measuresthat were most predictive of cardiovascular risk aboveand beyond FRS. Measures tested were: mean daytime,mean night-time, minimum night-time, maximum night-time, maximum daytime, minimum daytime, Rangedaytime, coefficient of variation (CV) daytime, SD night-time, CV night-time, SD daytime, IQR daytime, IQRnight-time and the range of night-time BP. We fittedeach ambulatory BP measure as one covariate (regard-less of whether men were on BP-lowering treatment ornot). The best ‘average’ measure and the best ‘variabil-ity’ measure for each of daytime and night-time werethen added together to the model, as well as the bestaverage measures for daytime and night-time together toevaluate for further improvements. We also evaluatedequivalent diastolic BP measures in this way.After selecting the best ASBP measures, we estimated
other metrics of incremental value compared to thebase model including HRs, measures of overall risk pre-diction and estimated clinical effects of screening withambulatory BP. We estimated standardised HRs (perSD), before and after adjustment for the FRS. We esti-mated equivalent HRs for FRS for comparison.The 10-year predicted risk for each man was calcu-
lated from models that included (1) FRS only and (2)FRS and ASBP. The probability of a cardiovascular eventwithin 10 years was estimated by raising 10-year baselinesurvival to the exponential of the sum of the linear pre-dictors. The predicted 10-year risk from the Cox modelincluding FRS only tended to be higher than the actualFRS itself. By including FRS as a covariate in the modelbased on outcome data from this cohort, we were ineffect recalibrating their risk.We assessed improvements in overall prediction by esti-
mating calibration (Groennesby-Borgan tests28) in add-ition to the likelihood ratio tests and changes indiscrimination (c-statistic) calculated already. We alsoexamined reclassification by calculating the number ofcases (CVD within 10 years) and non-cases (no CVDwithin 10 years) who moved up or down across the 20%treatment threshold) and constructed reclassificationplots.We estimated the difference in number of men who
would be started on treatment (or have treatment esca-lated for those already on treatment) by comparing thenumber of men above the 20% 10-year threshold whenjust FRS was used in the model with the number of menabove the 20% 10-year threshold when ASBP and FRSwere used. We calculated 95% confidence limits usingstandard formula for paired data.29
Finally, we calculated the potential difference in thenumber of cardiovascular events for every 10 000 menscreened with ASBP, using a modified version of themethod described in ref. 30 We assumed that men abovethe 20% 10-year threshold would be started on treat-ment, or have treatment escalated. We assumed that
treatment (or escalation in treatment) would have aneffect of 0.2 relative risk reduction (based on data fromref. 31).We first calculated the mean of the 10-year predicted
risks for the models with the Framingham scores. Wethen applied a treatment effect with a reduction in riskof 20% to those people with estimated 10-year predictedrisks greater than 20%. Combining these treatmentreduced risks with the unchanged risks for people whohad calculated risks below the treatment threshold, wecalculated a second mean. The difference in thesemeans, multiplied by 10 000, provides the number ofevents prevented per 10 000 screened when the risk pre-diction models with the Framingham scores are used.We carried out the same calculations for the modelswith Framingham scores and ASBP. The number ofevents prevented was compared and the differencebetween Framingham only models and Framinghamand ambulatory BP calculated.
Events prevented with addition of ASBP =
(Events prevented using ASBP and clinic SBP
�Events prevented using clinic SBP)
� proportion who had an event � 10000
((risk2;all untreated � risk2;treatment reduced and unchanged)
� (risk1;all untreated � risk1;treatment reduced and unchanged))
� 10000
We calculated 95% CIs for number of events preventedusing 2000 bootstrap samples.SAS V.9.3 was used for all analyses.
RESULTSWe included 780 men with 412 events in our analysiswhere data were available on ambulatory BP and all trad-itional risk factors. Summary statistics are presented intable 1. Age was not significantly associated with CVD inthis dataset, probably because of its small variability(most men were aged very close to 71 years). Total chol-esterol was also not significantly associated with CVD.Other traditional risk factors had significant associationswith CVD in expected directions.Table 2 shows the improvement in CVD risk prediction
when different ASBP measures were added to a modelthat included calculated FRS. The largest improvementsin overall model fit and discrimination were from meandaytime SBP. Substitution for, or addition of other, ASBPvariables did not lead to further improvements.Evaluation of diastolic BP measures instead of SBP didnot result in further improvements.Table 3 shows the association between FRS, mean
daytime ASBP and CVD. Before adjustment for theother risk factor the HR was 1.43 per SD increase in FRSand 1.31 per SD increase in ASBP. After adjustment forthe other risk factor, the HR was 1.34 per SD increase in
Bell KJL, et al. BMJ Open 2014;4:e006044. doi:10.1136/bmjopen-2014-006044 3
Open Access
group.bmj.com on October 29, 2014 - Published by http://bmjopen.bmj.com/Downloaded from

FRS and 1.20 per SD increase in ASBP, demonstratingthat both were independent risk factors, but FRS was thestronger predictor of the two.Table 4 summarises the small improvements in overall
risk prediction for an individual when mean daytimeASBP was added to calculated FRS in the risk model (ie,where there is one new test that combines FRS andASBP). The overall calibration was better when ASBPwas added to FRS, but the actual number of eventsobserved vs predicted for each risk decile (used in theGronnesby test) appeared similar for both models (seefigure 1A, B). The very small improvements in
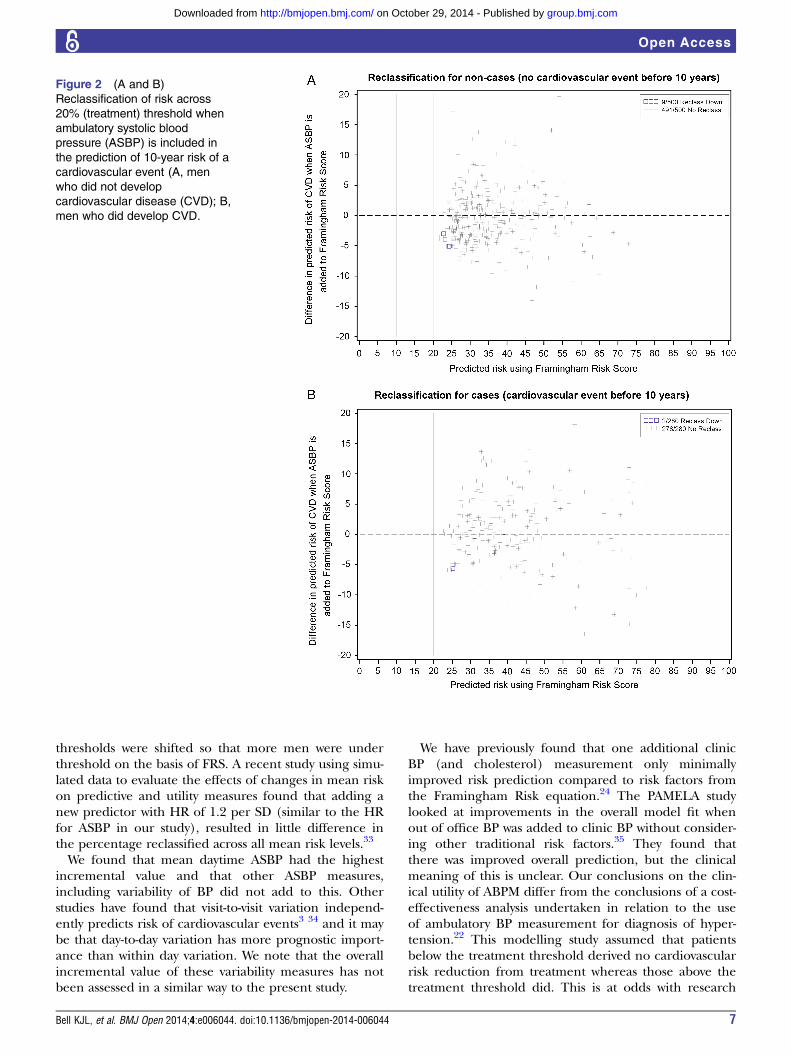
reclassification are illustrated in figure 2A, B: most menwere not reclassified downwards or upwards across thetreatment threshold when ASBP was used as well as FRS.There would have been no change in the recommenda-tion of treatment for 98.2% (491/500) of men who didnot have an event within 10 years and 99.3% (278/280)of men who did have an event within 10 years. Thesepercentages were the same when Kaplan-Meier life tableestimates were used and allowance made for censoring(70 men without CVD died of other causes before10 years). Figure 2A shows that of the 500 men who didnot have a cardiovascular event, 9 were correctly
Table 1 Summary data for traditional cardiovascular risk factors and ambulatory systolic BP
Characteristic
Summary
measure*
Unadjusted
HR per SD
Age (years) 71.1 (0.77) 1.04 (0.94 to 1.15)
Total cholesterol (mmol/L) 5.7 (1.3) 0.97 (0.88 to 1.07)
HDL cholesterol (mmol/L) 1.3 (0.43) 0.87 (0.79 to 0.97)
BP treatment 210/780 [26.9] 1.85 (1.51 to 2.27)
Smoking 166/780 [21.2] 1.52 (1.21 to 1.91)
Diabetes 80/780 [10.2] 1.59 (1.19 to 2.10)
Office systolic BP (mm Hg) 146 (26) 1.31 (1.19 to 1.44)
10-year FRS 0.37 (0.22) 1.46 (1.32 to 1.62)
10-year FRS>20% 733/780 [94.0] 1.75 (1.07 to 2.84)
Subsequent CVD events 412/780 [52.7]
*Values are median (IQR) or n [%].BP, blood pressure; CVD, cardiovascular disease; FRS, Framingham Risk Score; HDL, high-density lipoprotein.
Table 2 Impact of adding ambulatory systolic BP measures to 10-year Framingham CVD risk
Ambulatory BP
measure added to
base model*
Improvement
in overall fit
(likelihood ratio
test, p value)
Improvement
in discrimination
(c-statistic)
One ABPM covariate
Mean daytime SBP 0.0006 0.011
Mean night-time SBP 0.0008 0.007
Minimum night-time SBP 0.003 0.003
Maximum night-time SBP 0.009 0.003
Maximum daytime SBP 0.04 0.003
Minimum daytime SBP 0.11 0.003
CV daytime SBP 0.39 –
SD night-time SBP 0.41 –
SD daytime SBP 0.60 –
Range daytime SBP 0.62 –
IQR daytime SBP 0.62 –
IQR night-time SBP 0.74 –
CV night-time SBP 0.74 –
Range night-time SBP 0.76 –
Two ABPM covariates
Mean daytime SBP and mean night-time SBP 0.0008 0.010
Mean night-time SBP+minimum night-time SBP 0.004 0.007
Mean daytime SBP+maximum daytime SBP 0.003 0.010
Ratio mean daytime SBP to mean night-time SBP 0.32 –
*Reference model: Framingham 10-year risk score.ABPM, ambulatory blood pressure monitoring; BP, blood pressure; CVD cardiovascular disease; SBP, systolic blood pressure.
4 Bell KJL, et al. BMJ Open 2014;4:e006044. doi:10.1136/bmjopen-2014-006044
Open Access
group.bmj.com on October 29, 2014 - Published by http://bmjopen.bmj.com/Downloaded from

reclassified downwards when ASBP was included in themodel (including one man who died at just over8.5 years of follow-up). None were incorrectly reclassifiedupwards when ASBP was included in the model.Figure 2B shows that of the 280 men who did have a car-diovascular event, 2 were incorrectly reclassified down-wards and none correctly reclassified upwards whenASBP was included in the model.Using a risk model with just FRS, we estimated that for
every 10 000 men screened with ASBP, all 10 000 wouldbe treated and 723 cardiovascular events prevented(95% CI 650 to 796 events prevented). Using a riskmodel that combines FRS and ASBP, 9859 would betreated (95% CI 9776 to 9942 treated) and 715 cardio-vascular events prevented (95% CI 635 to 795 eventsprevented). Using FRS and ASBP, 141 fewer men wouldbe treated (95% CI 58 to 224 less treated) and 7 fewerevents prevented (95% CI 20 fewer events prevented to6 more events prevented).
DISCUSSIONOur analysis of data from the ULSAM found that 24-hABPM added little to the CVD risk prediction of theFRS. The addition of mean daytime ASBP might lead tofewer men started on treatment, but this may be at theexpense of fewer cardiovascular events prevented. Theestimated size of these differences is small, and the clin-ical significance unclear: for every 10 000 men screenedwith ASBP, approximately 141 fewer men would be
started on treatment (95% CI 58 to 224 less treated) but7 fewer cardiovascular events would be prevented (95%CI 20 fewer events prevented to 6 more eventsprevented).Our study has several strengths. The underlying
methods used in the ULSAM study are robust. Althoughthis is a modestly sized study, the event rate was high andhence our estimates had good precision. The studypopulation was recruited prior to widespread use ofstatins and with a relatively low use of BP-lowering drugswhich means it is an appropriate population for under-standing prognosis in an untreated population. Therewere minimal exclusions due to missing data on riskfactors (less than 7% of men were missing data onambulatory BP or one of the FRS covariates). There wasreliable ascertainment of outcomes with minimal lossesto follow-up. We used rigorous statistical analysis usingmethods that allow interpretation of the clinical signifi-cance of results.There are also some limitations to our study. Our
study population consisted of men over the age of65 years and most were at high risk of a cardiovascularevent. At the same time, the men in our study were allvery close in age which meant that age was not a signifi-cant predictor in this study. In populations without agerestriction, age is the most powerful predictor of cardio-vascular risk. There is also evidence that the FRS is lessaccurate for older age groups, and this may have alsocaused ambulatory BP to have had more effect in ourstudy than in younger populations. We used the FRS asthe initial predictor for our models but this will result ina ‘home’ advantage to ASBP (where the contributionwas decided by the data) over traditional risk factorsincluding clinic BP (where the contribution is fixed asdecided by the Framingham Risk equation, which maynot be ideal for this data set). We assumed that treat-ment to lower BP resulted in a 20% reduction in risk ofa cardiovascular event.31 The risk reduction may be lessfor escalation of treatment (for patients who werealready on some treatment at baseline or were startedon treatment during follow-up). However, if cholesterol-lowering effects are also considered,32 there is a
Table 3 Associations between FRS, ASBP and
cardiovascular disease
Association HR per SD (95% CI)
FRS, unadjusted 1.43 (1.30 to 1.57)
FRS, adjusted for ASBP* 1.34 (1.22 to 1.48)
ASBP, unadjusted 1.33 (1.21 to 1.46)
ASBP adjusted for FRS* 1.21 (1.10 to 1.34)
*Adjusted predictions, allowing for effects of FRS and ASBP.BP, blood pressure; FRS, 10-year Framingham Risk Score; ASBP,mean daytime ambulatory systolic blood pressure.
Table 4 Improvements in the overall prediction of an individual’s cardiovascular risk and effects on treatment and
cardiovascular events when mean daytime ASBP is added to FRS
Overall model
fit (LRT)
Discrimination
(change in
c-statistic)
Calibration
(p value) Reclassification* Treatment CVD events
Χ2=12.29,1df,
p=0.0006
0.011 0.27 (FRS)
vs 0.54
(FRS+ASBP)
1.8% (9/500)
non-cases correctly
classified downwards
141 less treated per
10 000 men
screened with ASBP
(95% CI 58 to 224
less treated)
7 fewer events prevented
per 10 000 men screened
with ASBP (95% CI 20
fewer events prevented to
6 more events prevented)
0.7% (2/280) cases
incorrectly classified
downwards
*Adjusting for censoring using Kaplan–Meier life table estimates did not change per cent estimates for reclassification.ASBP, ambulatory systolic blood pressure; CVD, cardiovascular disease; FRS, Framingham Risk Score; LRT, likelihood ratio test.
Bell KJL, et al. BMJ Open 2014;4:e006044. doi:10.1136/bmjopen-2014-006044 5
Open Access
group.bmj.com on October 29, 2014 - Published by http://bmjopen.bmj.com/Downloaded from

significantly larger risk reduction with treatment, whichwould more than offset this. On balance, even moreevents would be prevented in the FRS alone model rela-tive to the FRS and ASBP one. We based our estimationsof treatment effect on the assumption of one cardiovas-cular risk assessment, but this may be repeated before10 years, which would be likely to lead to more patientscrossing the treatment threshold with ASBP and evensmaller difference in reclassification. Also, participantsbelow the absolute risk threshold who have elevated BPmay still be started on treatment, meaning less of a dif-ference in numbers started on treatment and events pre-vented. Finally, it is likely that not all people above thethreshold would be offered and accept treatment to
lower cardiovascular risk; again, this would lessen the dif-ference in treatment and events prevented between thetwo risk models.In combination, these factors mean that our estimates
are ‘best-case’ estimates for this population and theincremental value of ASBP may be even lower in otherpopulations, including younger populations and women.The generalisability of these estimates is further sup-ported by the fact that (1) Ambulatory BP did just asbadly on the performance measures that were notlooking at movement across treatment threshold, such aschange in c-statistic and likelihood ratio and (2) the riskplots in figure 2A, B suggest that adding ambulatory BPmay still have little effect on reclassification even if
Figure 1 (A and B) Calibration
graph showing observed and
predicted number of
cardiovascular events within
10 years, in each decile of the
risk score (A, FRS only; B, FRS
and ASBP). ASBP, ambulatory
systolic blood pressure; FRS,
Framingham Risk Score.
6 Bell KJL, et al. BMJ Open 2014;4:e006044. doi:10.1136/bmjopen-2014-006044
Open Access
group.bmj.com on October 29, 2014 - Published by http://bmjopen.bmj.com/Downloaded from
thresholds were shifted so that more men were underthreshold on the basis of FRS. A recent study using simu-lated data to evaluate the effects of changes in mean riskon predictive and utility measures found that adding anew predictor with HR of 1.2 per SD (similar to the HRfor ASBP in our study), resulted in little difference inthe percentage reclassified across all mean risk levels.33
We found that mean daytime ASBP had the highestincremental value and that other ASBP measures,including variability of BP did not add to this. Otherstudies have found that visit-to-visit variation independ-ently predicts risk of cardiovascular events3 34 and it maybe that day-to-day variation has more prognostic import-ance than within day variation. We note that the overallincremental value of these variability measures has notbeen assessed in a similar way to the present study.
We have previously found that one additional clinicBP (and cholesterol) measurement only minimallyimproved risk prediction compared to risk factors fromthe Framingham Risk equation.24 The PAMELA studylooked at improvements in the overall model fit whenout of office BP was added to clinic BP without consider-ing other traditional risk factors.35 They found thatthere was improved overall prediction, but the clinicalmeaning of this is unclear. Our conclusions on the clin-ical utility of ABPM differ from the conclusions of a cost-effectiveness analysis undertaken in relation to the useof ambulatory BP measurement for diagnosis of hyper-tension.22 This modelling study assumed that patientsbelow the treatment threshold derived no cardiovascularrisk reduction from treatment whereas those above thetreatment threshold did. This is at odds with research
Figure 2 (A and B)
Reclassification of risk across
20% (treatment) threshold when
ambulatory systolic blood
pressure (ASBP) is included in
the prediction of 10-year risk of a
cardiovascular event (A, men
who did not develop
cardiovascular disease (CVD); B,
men who did develop CVD.
Bell KJL, et al. BMJ Open 2014;4:e006044. doi:10.1136/bmjopen-2014-006044 7
Open Access
group.bmj.com on October 29, 2014 - Published by http://bmjopen.bmj.com/Downloaded from

showing a similar relative risk reduction withBP-lowering treatment for individuals irrespective oftheir pretreatment BP (down to a SBP of 110, belowwhich data become sparse).31
Our findings need validation in other data sets, in par-ticular populations including women, younger peopleand a wider range in age. We need to compare theincremental value of ASBP with that of home BP meas-urement. Future research may also assess the incremen-tal effects of ASBP and home BP measurements on theshort term measurement variability of risk scores.In summary, the incremental value of ASBP above FRS
appears to be at most small, at least in older men. Whileselective use is reasonable, we question the recommen-dation for universal assessment of all those being consid-ered for use of BP-lowering therapy. FRS scores aloneare sufficient to decide on the need for starting BP andcholesterol-lowering therapy.
Author affiliations1Centre for Research into Evidence Based Practice (CREBP), Bond University,Gold Coast, Queensland, Australia2Screening and Diagnostic Test Evaluation Program (STEP), School of PublicHealth, University of Sydney, Sydney, New South Wales, Australia3Department of Medical Sciences, Uppsala University Hospital, Uppsala,Sweden4School of Public Health and Community Medicine, The University of NewSouth Wales, Sydney, New South Wales, Australia5George Institute for International Health, Royal Prince Alfred Hospital,University of Sydney, Sydney, New South Wales, Australia
Contributors KJLB contributed to the concept and design, analysis,interpretation of data, was responsible for drafting and revising themanuscript and is guarantor for the study. EB and KMG contributed to theanalysis of the data, interpretation of data and revising the manuscript. JSfacilitated access to the data, contributed to interpretation of data and revisionof the manuscript. AH contributed to interpretation of data and revision of themanuscript. LI, BN and PG contributed to the concept and design,interpretation of data, revision of the manuscript.
Funding The authors have received funding from the Australian NationalHealth and Medical Research Council (Program Grant No 633003, EarlyCareer Fellowship No. APP1013390).
Competing interests None.
Provenance and peer review Not commissioned; externally peer reviewed.
Data sharing statement No additional data are available.
Open Access This is an Open Access article distributed in accordance withthe Creative Commons Attribution Non Commercial (CC BY-NC 4.0) license,which permits others to distribute, remix, adapt, build upon this work non-commercially, and license their derivative works on different terms, providedthe original work is properly cited and the use is non-commercial. See: http://creativecommons.org/licenses/by-nc/4.0/
REFERENCES1. National Institute for Health and Clinical Excellence. Hypertension:
clinical management of primary hypertension in adults [clinicalguideline 127]. 2011 [Jan 2012]. http://www.nice.org.uk/CG127
2. Rothwell PM. Limitations of the usual blood-pressure hypothesis andimportance of variability, instability, and episodic hypertension.Lancet 2010;375:938–48.
3. Rothwell PM, Howard SC, Dolan E, et al. Prognostic significance ofvisit-to-visit variability, maximum systolic blood pressure, andepisodic hypertension. Lancet 2010;375:895–905.
4. Clement DL, De Buyzere ML, De Bacquer DA, et al. Prognosticvalue of ambulatory blood-pressure recordings in patients with
treated hypertension.[see comment]. N Engl J Med2003;348:2407–15.
5. Dolan E, Stanton A, Thijs L, et al. Superiority of ambulatory overclinic blood pressure measurement in predicting mortality: the Dublinoutcome study.[see comment]. Hypertension 2005;46:156–61.
6. Hansen TW, Kikuya M, Thijs L, et al. Prognostic superiority ofdaytime ambulatory over conventional blood pressure in fourpopulations: a meta-analysis of 7,030 individuals.[see comment].J Hypertens 2007;25:1554–64.
7. Fagard RH, Van Den Broeke C, De Cort P. Prognostic significanceof blood pressure measured in the office, at home and duringambulatory monitoring in older patients in general practice. J HumHypertens 2005;19:801–7.
8. Bobrie G, Chatellier G, Genes N, et al. Cardiovascular prognosis of“masked hypertension” detected by blood pressureself-measurement in elderly treated hypertensive patients. JAMA2004;291:1342–9.
9. Ohkubo T, Imai Y, Tsuji I, et al. Home blood pressure measurementhas a stronger predictive power for mortality than does screeningblood pressure measurement: a population-based observation inOhasama, Japan. J Hypertens 1998;16:971–5.
10. National Vascular Disease Prevention Alliance. Guidelines for theassessment and management of absolute cardiovascular diseaserisk. 2012. http://strokefoundation.com.au/health-professionals/clinical-guidelines/guidelines-for-the-assessment-and-management-of-absolute-cvd-risk/
11. New Zealand Guideline Group. The assessment and managementof cardiovascular risk 2003 [23 March 2009]. http://www.nzgg.org.nz
12. Joint British Societies. JBS 2: Joint British Societies’ guidelines onprevention of cardiovascular disease in clinical practice. Heart2005;91:v1–52.
13. Scottish Intercollegiate Guidelines Network. Risk estimation and theprevention of cardiovascular disease: a national clinical guidelineEdinburgh 2007. http://www.sign.ac.uk/pdf/sign97.pdf
14. World Health Organisation. Prevention of cardiovascular disease:guidelines for assessment and management of cardiovascular risk2007.
15. Mancia G, Fagard R, Narkiewicz K, et al.; Task Force Members.2013 ESH/ESC Guidelines for the management of arterialhypertension: the Task Force for the management of arterialhypertension of the European Society of Hypertension (ESH) and ofthe European Society of Cardiology (ESC). Eur Heart J 2013;34:2159–219.
16. D’Agostino RB, Vasan RS, Pencina MJ, et al. Generalcardiovascular risk profile for use in primary care The FraminghamHeart Study. Circulation 2008;117:743–53.
17. Assmann G, Cullen P, Schulte H. Simple scoring scheme forcalculating the risk of acute coronary events based on the 10-yearfollow-up of the Prospective Cardiovascular Münster (PROCAM)Study. Circulation 2002;105:310–15.
18. Conroy RM, Pyorala K, Fitzgerald AP, et al. Estimation of ten-yearrisk of fatal cardiovascular disease in Europe: the SCORE project.Eur Heart J 2003;24:987–1003.
19. Woodward M, Brindle P, Tunstall-Pedoe H. Adding social deprivationand family history to cardiovascular risk assessment: the ASSIGNscore from the Scottish Heart Health Extended Cohort (SHHEC).Heart 2007;93:172–6.
20. Hippisley-Cox J, Coupland C, Vinogradova Y, et al. Derivationand validation of QRISK, a new cardiovascular disease risk scorefor the United Kingdom: prospective open cohort study. BMJ2007;335:136.
21. Jackson R, Lawes C, Bennet D, et al. Treatment with drugs to lowerblood pressure and blood cholesterol based on an individual’sabsolute cardiovascular risk. Lancet 2005;365:434–41.
22. Lovibond K, Jowett S, Barton P, et al. Cost-effectiveness of optionsfor the diagnosis of high blood pressure in primary care: a modellingstudy. Lancet 2011;378:1219–30.
23. Sega R, Facchetti R, Bombelli M, et al. Prognostic value ofambulatory and home blood pressures compared with office bloodpressure in the general population: follow-up results from thePressioni Arteriose Monitorate e Loro Associazioni (PAMELA) study.[see comment]. Circulation 2005;111:1777–83.
24. Bell K, Hayen A, McGeechan K, et al. Effects of additional bloodpressure and lipid measurements on the prediction of cardiovascularrisk. Eur J Cardiovasc Prev Rehabil 2012;19:1474–85.
25. Ingelsson E, Bjorklund-Bodegard K, Lind L, et al. Diurnal bloodpressure pattern and risk of congestive heart failure. Jama2006;295:2859–66.
26. Staessen JA, Bieniaszewski L, O’Brien E, et al. Nocturnal bloodpressure fall on ambulatory monitoring in a large internationaldatabase. Hypertension 1997;29:30–9.
8 Bell KJL, et al. BMJ Open 2014;4:e006044. doi:10.1136/bmjopen-2014-006044
Open Access
group.bmj.com on October 29, 2014 - Published by http://bmjopen.bmj.com/Downloaded from

27. Tunstall-Pedoe H, Kuulasmaa K, Amouyel P, et al. Myocardialinfarction and coronary deaths in the World Health OrganizationMONICA Project. Registration procedures, event rates, andcase-fatality rates in 38 populations from 21 countries in fourcontinents. Circulation 1994;90:583–612.
28. May S, Hosmer DW. A simplified method of calculating an overallgoodness-of-fit test for the Cox proportional hazards model. LifetimeData Anal 1998;4:109–20.
29. Gardner MJ, Altman DG. Confidence intervals rather than P values:estimation rather than hypothesis testing. BMJ (Clin Res Ed)1986;292:746–50.
30. Austin PC. Absolute risk reductions and numbers needed to treatcan be obtained from adjusted survival models for time-to-eventoutcomes. J Clin Epidemiol 2010;63:46–55.
31. Law M, Morris J, Wald N. Use of blood pressure lowering drugs inthe prevention of cardiovascular disease: meta-analysis of 147
randomised trials in the context of expectations from prospectiveepidemiological studies. BMJ 2009;338:b1665.
32. Taylor F, Huffman MD, Macedo AF, et al. Statins for the primaryprevention of cardiovascular disease. Cochrane Database Syst Rev2013;1:CD004816.
33. McGeechan K, Macaskill P, Irwig L. An assessment of the relationshipbetween clinical utility and predictive ability measures and the impact ofmean risk in the population. BMC Med Res Methodol 2014;14:86.
34. Hata J, Arima H, Rothwell PM, et al. Effects of visit-to-visitvariability in systolic blood pressure on macrovascular andmicrovascular complications in patients with type 2 diabetesmellitus: the ADVANCE trial. Circulation 2013;128:1325–34.
35. Mancia G, Facchetti R, Bombelli M, et al. Long-term risk of mortalityassociated with selective and combined elevation in office, home,and ambulatory blood pressure.[see comment]. Hypertension2006;47:846–53.
Bell KJL, et al. BMJ Open 2014;4:e006044. doi:10.1136/bmjopen-2014-006044 9
Open Access
group.bmj.com on October 29, 2014 - Published by http://bmjopen.bmj.com/Downloaded from

study datamen: secondary analysis of observational prevention of cardiovascular disease in olderFramingham Risk Score for the primary Ambulatory blood pressure adds little to
Andrew Hayen, Les Irwig, Bruce Neal and Paul GlasziouKaty J L Bell, Elaine Beller, Johan Sundström, Kevin McGeechan,
doi: 10.1136/bmjopen-2014-0060442014 4: BMJ Open
http://bmjopen.bmj.com/content/4/9/e006044Updated information and services can be found at:
These include:
References #BIBLhttp://bmjopen.bmj.com/content/4/9/e006044
This article cites 30 articles, 12 of which you can access for free at:
Open Access
http://creativecommons.org/licenses/by-nc/4.0/non-commercial. See: provided the original work is properly cited and the use isnon-commercially, and license their derivative works on different terms, permits others to distribute, remix, adapt, build upon this workCommons Attribution Non Commercial (CC BY-NC 4.0) license, which This is an Open Access article distributed in accordance with the Creative
serviceEmail alerting
box at the top right corner of the online article. Receive free email alerts when new articles cite this article. Sign up in the
CollectionsTopic Articles on similar topics can be found in the following collections
(246)Evidence based practice (335)Cardiovascular medicine
Notes
http://group.bmj.com/group/rights-licensing/permissionsTo request permissions go to:
http://journals.bmj.com/cgi/reprintformTo order reprints go to:
http://group.bmj.com/subscribe/To subscribe to BMJ go to:
group.bmj.com on October 29, 2014 - Published by http://bmjopen.bmj.com/Downloaded from