downloaded from jnm.snmjournals.org by on november 4, 2016 ... · the mean baseline parameters...
TRANSCRIPT

1
Can studies of neuroinflammation in a TSPO genetic subgroup (HAB or MAB) be applied to the entire AD cohort?
Running title: Does TSPO genotypes associated with AD?
Zhen Fan1, Denise Harold2, Giuseppe Pasqualetti1, Julie Williams2, David J Brooks1,3, Paul Edison1,2 : Alzheimer's Disease Neuroimaging Initiative4
1-Neurology Imaging Unit, Imperial College London, Hammersmith Campus, London, UK
2- MRC Centre for Neuropsychiatric Genetics and Genomics, Cardiff University, Cardiff, UK
3- Department of Nuclear Medicine, Aarhus University, Denmark
4- The data used in the preparation of this article were obtained from the Alzheimer ’s Disease Neuroimaging Initiative database (adni.loni.ucla.edu)
Corresponding author:
Dr Paul Edison, MBBS, MRCP, MPhil, PhD, CCT, FRCPI
Neurology Imaging Unit, Imperial College London, 1st Floor B Block, Hammersmith Hospital Campus, Du Cane Road, London, W12 0NN
Tel: +442033133725
Fax: +442033134320
E-mail: [email protected]
First Author
Miss Zhen Fan, MSc (PhD student). Address as above
E-mail: [email protected]
Word count:
Title characters: 108
Abstract: 348
Total word count = 2765
References: 31, Figures: 4, Tables: 6
Financial support:
This research was supported by Alzheimer’s Research UK.
Journal of Nuclear Medicine, published on April 3, 2015 as doi:10.2967/jnumed.114.149443 Journal of Nuclear Medicine, published on April 3, 2015 as doi:10.2967/jnumed.114.149443by on November 4, 2016. For personal use only. jnm.snmjournals.org Downloaded from
2
ABSTRACT:
Rationale: Neuroinflammation plays a significant role in Alzheimer’s disease (AD), and TSPO PET imaging allows us to quantify this process. However, the binding of second generation TSPO tracers depends on the TSPO genotype coded by the rs6971 single nucleotide polymorphism (SNP), with 40-50% increase in BP in high affinity (HAB) compared to mixed affinity (MAB) binders; while low affinity binders (LAB) are unsuitable for evaluation. Hence several studies are either using HAB alone or HAB and MAB subjects. To translate the findings of neuroinflammation studies to the entire population, it is crucial to establish the influence of TSPO genotypes on AD. Here we investigated whether different TSPO genotypes influence their cognitive function, amyloid load and disease progression over time.
Methods: We evaluated 798 subjects (225 normal, 388 MCI and 185 AD subjects) at baseline and during follow-up from ADNI cohort. All subjects were screened for TSPO genotype and underwent detailed clinical and neuropsychological assessments yearly for four years. 291255 subjects also hadT1, T2 MRI and amyloid PET with 11C-PIB or 18F-Florbetapir.
Results: We have demonstrated that all TSPO binding groups (HAB, MAB, and LAB) have same level of amyloid load in AD and MCI subjects. We have also demonstrated that the prevalence of HAB is 50.3%, MAB is 41.2% and 8.5% for LAB, without statistical difference among AD, MCI and control groups. During longitudinal follow up, mean change of neuropsychometric test scores of MMSE, ADAS Cog 11, ADAS MOD, and GDS over time were similar in AD and MCI subjects among three TSPO binding groups. The analysis of the covariates showed that diagnostic group (normal, MCI, AD), ApoE4 status, and gender had a significant effect on ADAS MOD decline (>3 points of the scale) but not age or TSPO genotype.
Conclusion: This study suggests that information obtained from evaluating a subgroup of AD or MCI subject using second generation TSPO tracers could be translated to the entire AD and MCI population. This will allow us to study lower numbers of AD subjects in evaluating new anti-neuroinflammatory/anti-microglial agents in intervention studies, and in observational studies evaluating the role of neuroinflammation.
Keywords:Alzheimer’sDisease, TSPO, MCI, cognitive function, PET study
by on November 4, 2016. For personal use only. jnm.snmjournals.org Downloaded from
3
INTRODUCTION
Neuroinflammation plays a significant role in Alzheimer’s disease (AD) and other neurodegenerative diseases. Studies are evaluating the influence of neuroinflammation on neurodegeneration, and therapeutic agents against these targets are still under clinical evaluation to prevent neurodegeneration in AD 1. Before commencing on a large phase 3 study, it is essential to determine whether these agents can suppress brain inflammation. Neuroinflammation is characterised by an increase of 18 kDatranslocator protein (TSPO) expression, and is assessed in vivo by the use of TSPO PET (Positron Emission Tomography). The TSPO overexpression following microglial activation2, can be imaged via binding of PET ligands such as 11C-(R)-PK11195 (1-[2-chlorophenyl]-Nmethyl-N-[1-methyl-propyl]-3-isoquinoline carboxamide). It is shown that AD subjects and a proportion of MCI subjects show a 20–35% increase in microglial activation in frontal, temporal, parietal, occipital and cingulate cortices (p<0.05) 3-6. Currently, several second generation of TSPO ligands (11C-PBR28, 11C-DPA713, and 18F-GE180) 7-9 have been developed with the aim of achieving higher affinity and better signal-to-noise ratio than 11C-(R)-PK11195 PET. However, their uptake is dependent on TSPO phenotypes: high affinity binders (HAB), low affinity binders (LAB) and mixed affinity binders (MAB) 10, 11; with 40-50% increase in binding potential in high affinity (HAB) compared to mixed affinity (MAB) binders, while low affinity binders (LAB) are unsuitable for evaluation. It is now clear that a non-synonymous polymorphism of TSPO, coded by the rs6971 single nucleotide polymorphism (SNP) affects the binding affinity of these tracers10, 11. This SNP in exon 4 of the TSPO gene causes an alanine-to-threonine substitution in position 147. The Ala/Ala TSPO genotype (wild-type) results in HAB, while the Ala/Thr results in MAB, and Thr/Thr results in LAB. The MAB have 40-50% lower binding potential for TSPO than HAB 10-12. Due to the lack of binding in LAB, they are unsuitable for evaluation. Hence, several studies are evaluating only HAB subjects in natural progression and intervention studies. Apart from the binding of the PET tracer, TSPO gene mutation has been previously associated to functional alteration resulting in the reduction of peripheral lymphocyte allopregnanolone production13. Given that neurosteroids such as allopregnanolone may play a role in neuronal survival, favouring neurogenesis and preventing apoptosis 14, it is important to establish whether there is a link between 147/Thr TSPO genotype and AD development and progression, especially if TSPO genotypes will become a discriminating factor for selecting AD patients for neuroinflammation studies. To date, no study has evaluated the clinical impact of TSPO genotypes on AD. If the amyloid load and deterioration of cognitive function (clinical progression) were similar in the three TSPO subgroups of AD and MCI subjects, information obtained from HABs alone could then be generalised to all AD or MCI patients. Here we hypothesised that the distribution of amyloid deposition and the progression of disease would be the same in all TSPO subgroups within the same diagnostic group. In the present study, we investigated the influence of different TSPO genotypes on amyloid load and neuropsychometric performance at baseline and during follow-up in AD, MCI and healthy control subjects.
MATERIALS AND METHODS
by on November 4, 2016. For personal use only. jnm.snmjournals.org Downloaded from

4
Our study population was drawn from the ADNI database (www.loni.ucla.edu/ADNI). The institutional review board (IRB) approved this study and all subjects signed a written informed consent. A subset of 798 ADNI subjects were selected, and was genotyped with TSPO rs6971 as a part of this study..This comprised 225 normal, 388 MCI and 185 AD subjects. MCI subjects were enrolled if they had MMSE scores between 24-30 (inclusive)(for more details see ADNI website. Participants underwent apolipoprotein E (ApoE) genotyping and were monitored longitudinally at 6- to 12-month intervals for cognitive function with multiple cognitive tests including the Mini Mental State Examination (MMSE) and Alzheimer Disease Assessment Scales (ADAS cognitive, ADAS-Cog; and modified, ADAS-MOD, Clinical Dementia Rating (GDR) and Geriatric Depression Scale (GDS). Among the cohort of 798 subjects, 255 subjects had T1 and T2 weighted MRI and PET evaluation for amyloid burden. 188 subjects enrolled had 18F-Florbetapir15 and 67 subjects had 11C-PIB PET 16.
Image Analysis
A complete description of MRI and amyloid data acquisition is available on the ADNI website (http://www.adni-info.org/Scientists/ADNIStudyProcedures.aspx). Image analysis was done as described previously with Statistical Parametric Mapping 8 using MRI for creating the object map17. A threshold for amyloid positivity of 1.36 and 1.4 for the mean cortical ROIs normalised to cerebellar SUVR was used based on the range of control in previous studies for 18F-Florbetapir and 11C-PIB, respectively 18-20.
Genetics
Individuals were genotyped using the Illumina 610-quad array, as described in Saykin et al, 2010. No quality control had been performed on the publicly available ADNI Genome-wide association study (GWAS) dataset, therefore the data were subjected to QC-filtering prior to analysis. This included retaining individuals with missing genotype rates < 0.05, with mean autosomal heterozygosity between 0.30 and 0.36, and with mean X-chromosome heterozygosity either <0.02 for males, or between 0.28 and 0.42 for females.
Statistical Analysis
Statistical analysis was performed using SPSS Statistics 21.0. Effects of demographic variables were evaluated with factorial ANOVA. Associations between groups were evaluated using Pearson correlation analysis. A two-sample t-test for continuous variables and chi-squared test for categorical variables were used to compare baseline variables. Kaplan-Meyer survival analysis was done using ADAS-MOD increase of >3as the significant cognitive decline event21. Log-Rank Mantel Cox test was used to compare survival curves for each genotype. Cox proportional hazards regression was used to identify baseline variables, which were associated with cognitive decline. The sample size of our cohort was sufficient to warrant a power of regression analysis more than 90% with an alpha error of 0.05.
RESULTS
by on November 4, 2016. For personal use only. jnm.snmjournals.org Downloaded from

5
Detailed demographic data and baseline parameters are given in Table 1. The mean age of the entire cohort was 75.3 years (±6.8) while the mean age of the control, MCI and AD groups were 75.9 (±5.0), 74.8 (±7.3) and 75.4 (±7.5), respectively. No statistically significant differences were observed in the 3 groups with respect to the age (p>>0.05).
Baseline data
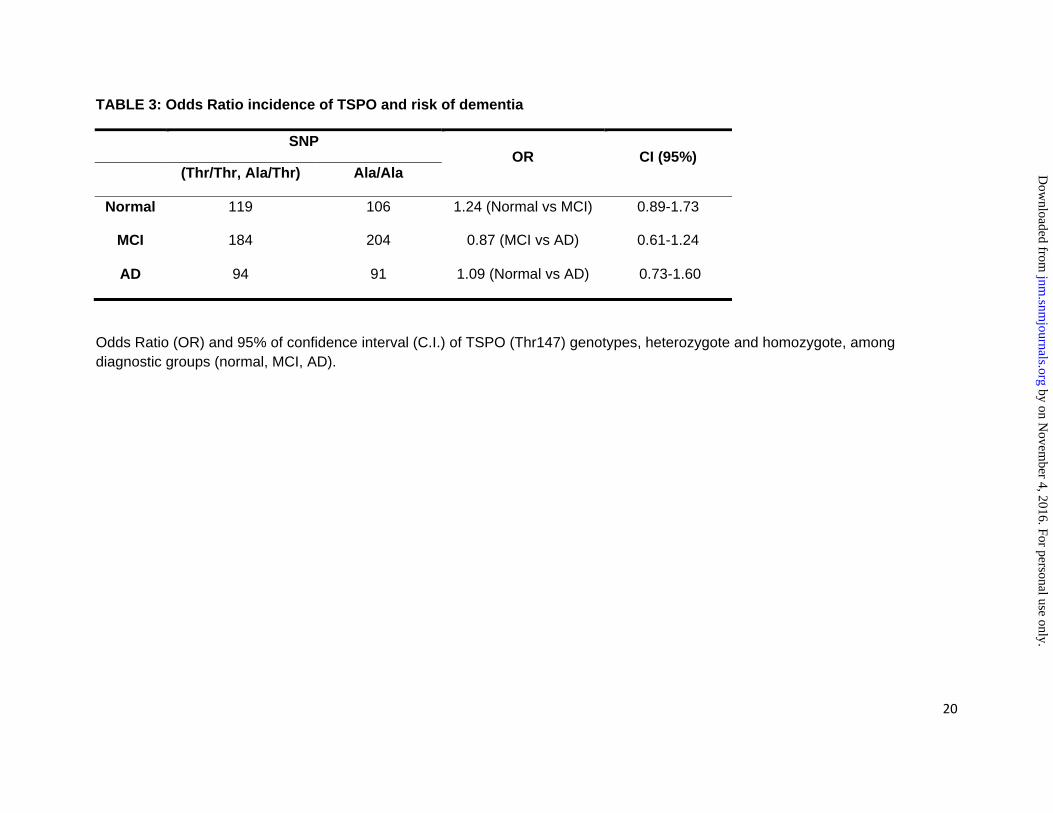
The prevalence of genotypes among diagnostic groups is reported in Table 2. With the chi-squared test, no difference was observed in the prevalence of these genotypes among AD, MCI and control groups (p=0.691). The prevalence of the Thr allele (both in homozygotes and in heterozygotes) is reported in Table 3. There was no statistical difference in prevalence of the Thr allele among groups (p>>0.05): the odds ratio and confidence intervals (CI) at 95% were 1.24 (0.89-1.73) for control vs MCI groups, 0.87 (0.61-1.24) for MCI vs AD groups, and 1.09 (0.73-1.60) for control vs AD groups.
The mean baseline parameters clustered by TSPO genotypes are reported in Table 4. No differences were found in terms of sex, age, MMSE, ADAS-Cog, ADAS-MOD, and GDS among the different TSPO genotypes (p>>0.05) (Figure 1).255 subjects had amyloid scans, and this subgroup did not significantly differ from therest of thecohort in sex and age even when stratified for both diagnostic groups and TSPO genotypes. There was no difference in the prevalence of TSPO genotypes in the amyloid subgroup. Within the same diagnosis group, similar distributions of amyloid deposition in Thr/Thr, Ala/Thr and Ala/Ala were found. Examples of individual parametric images of amyloid deposition among diagnostic groups and TSPO genotypes are shown in Figure 2.
As anticipated, a significant difference in the prevalence of subjects with the ApoE4 genotype was found among groups (p<0.001): patients with AD presented the greatest percentage of ApoE4 (17.9%) followed by MCI (12.4%). 84.2% AD and63.5% MCI patients were amyloid-positive while 31.3% of controls were amyloid positive (p<0.01).TSPO genotypes did not correlate with ApoE4 genotypes. At baseline, as expected, a significant difference was demonstrated between diagnostic groups in MMSE, ApoE4, amyloid status, ADAS-Cog and ADAS-MOD, CDRs and GDS (p<0.01) (Table 1).
Longitudinal data
The mean decline of MMSE at 36 months among the diagnostic groups was -0.08 (±0.60), -0.62 (±2.05), -1.16 (±1.88) for normal, MCI and AD subjects, respectively (p<0.05). The mean annual decline of ADAS-Cog and ADAS-MOD in the three diagnostic group was 0.13 (±1.23), 0.99 (±2.68) and 2.45 (±5.63) and 0.23 (±1.8), 1.20 (±3.1) and 1.05 (±8.6) for normal, MCI and AD subjects, respectively (for each scale p<0.05). No statistical differences (p>0.05) were found among different genotypes in the diagnostic groups (normal, MCI, and AD) in terms of MMSE, ADAS-Cog, ADAS-MOD mean annual decline as shown in Figure 3. No statistical differences in mean variation of GDS (p>0.05) were found among different TSPO genotypes. The prevalence of HAB was 50.3%, MAB was 41.2% and 8.5% for LAB, without statistical difference among the AD, MCI and control cohorts.
by on November 4, 2016. For personal use only. jnm.snmjournals.org Downloaded from

6
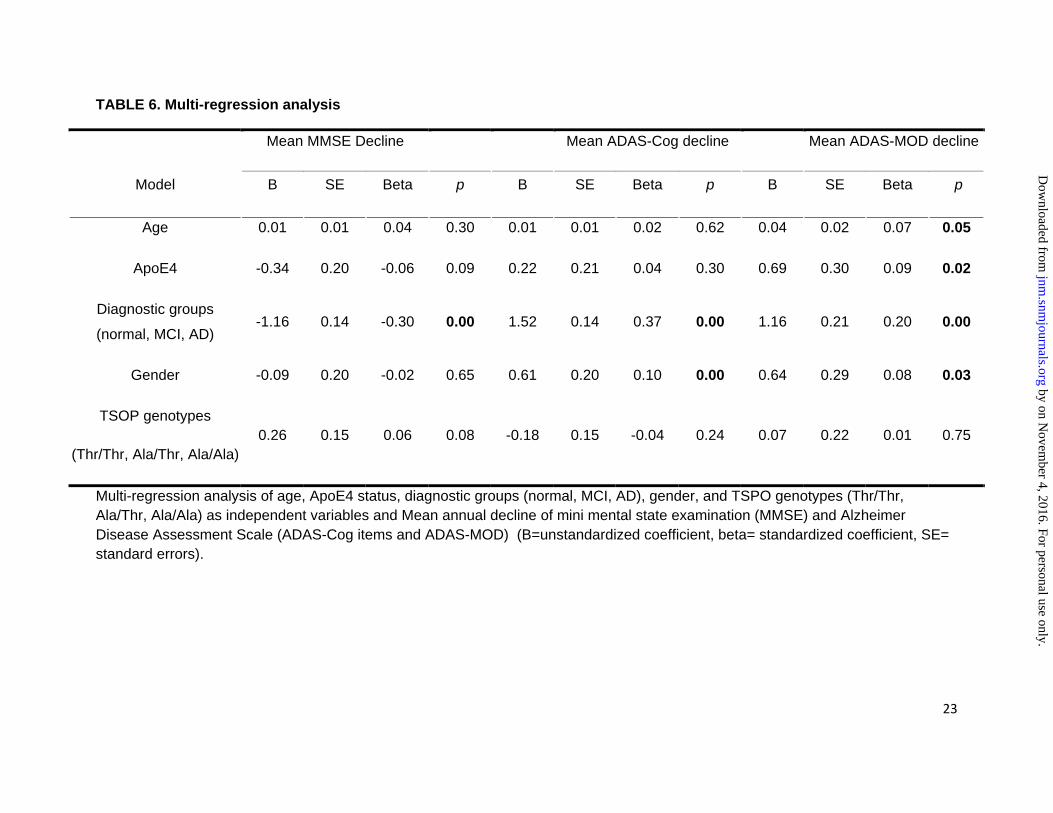
The linear regression analyses of the TSPO genotypes and the mean annual decline of MMSE, ADAS-Cog and ADAS-MOD are reported in Table 5.The multi-regression analysis of mean annual decline of MMSE, ADAS-Cog and ADAS-MOD are showed in Table 6. The TSPO genotype was not associated with the mean decline of MMSE, ADAS-Cog and ADAS-MOD. The mean annual decline of ADAS-MOD was significantly correlated to age, presence of ApoE4, diagnostic group (normal, MCI and AD) and gender. The survival analysis of ADAS-MOD changes (>3 points of the scale) performed in the entire population stratified for genotypes did not reveal any significant differences (p>>0.05) with Mantel-Cox test (Figure 4). The analysis of the covariates showed a significant effect on ADAS-MOD (>3 points of the scale) only for diagnostic groups (normal, MCI and AD), ApoE4 and gender (p<0.05) but did not show any effect on age and TSPO genotypes.Mantel-Cox test including TSPO genotypes as covariate in 134 amyloid positive subjects did not reveal any significant association (H.R. 1.01C.I.95% 0.71-1.32 0.80-1.30, p=0.92). Repeat analysis adjusting for the presence of ApoE4 did not improve the results of TSPO genotypes (ApoE4 association showed a trend incognitive decline even if it did not reach the statistical significance H.H. 1.26 C.I. 95% 0.99-1.60, p=0.06).
DISCUSSION
This is the first study to evaluate the influence of TSPO genotypes on the clinical phenotypes of AD and disease progression. Here we demonstrated for the first time that the pathological features, clinical phenotypes and rate of cognitive decline in AD and MCI are similar in three TSPO subgroups. This finding is of clinical relevance considering the increasing interest in the role of microglia/neuroinflammation in AD pathophysiology that has led to development of several novel TSPO radiotracers aimed at improving the understanding of the disease process, improving the diagnosis, and obtaining a marker of disease progression 5, 11, 22. In order to make the assessments more robust, some studies have chosen only to use subjects who are high affinity TSPO binders, representing around 50% of Caucasians 12. This approach will result in a selection bias of patients. Moreover, if changes in levels of microglial activation are to be used as a surrogate endpoint in future interventional AD trials, 50% of subjects could not be enrolled on the basis of their TSPO genotype. Our data suggest that evaluating a subgroup of AD subjects with HAB will still allow their clinical and amyloid PET results to be translated to the rest of the AD patients; andconsidering the sample size in this cohort we can conclude that this finding is robust. Amyloid burden, although measured with two different methods and multiple cameras, was prevalent in the three diagnostic groups at a level consistent with the literature 23. Additionally, the prevalence of ApoE4 was the same among the three TSPO subgroups in AD, MCI and control subjects. The prevalence of three TSPO phenotypes in AD and MCI was consistent with the prevalence of the TSPO phenotypes in the general population: 49% for HAB, 9% for LAB, and 42% for MAB 10, 12.
Longitudinal analysis has been addressed with two different methods in order to improve the quality of the data. We firstly analysed the data using linear regression with mean decline over time of the cognitive test scores (MMSE and ADAS-Cog and ADAS-MOD) as the parameter
by on November 4, 2016. For personal use only. jnm.snmjournals.org Downloaded from
7
estimates, and TSPO genotypes as the as dependent variable. We also performed a multi-regression analysis with survival function using several independent variables to assess whether other factors (age, ApoE4, gender, diagnostic groups) could better explain cognitive decline. Consistent with baseline analysis, the regression analyses confirmed that the rate of cognitive decline was similar over time (up to 36 months) between genotypes and supported by similar mean annual decline in change of ADAS-Cog and ADAS-MOD score or MMSE. The multi-regression analysis showed similar results within diagnostic groups with different TSPO genotypes and, interestingly, for the ADAS-MOD, mean annual decline showed an inverse correlation with the age, as previous reported by Holland et al. 24. The Kaplan-Mayer analysis confirmed baseline and linear regression analysis results. The covariate analysis revealed that a significant association existed only between ADAS-MOD increase (>3 points), diagnostic group (MCI, AD, control), ApoE4 status, and gender. There were inconsistencies in the literature regarding the gender differences and the annual rate of cognitive decline, but it has been suggested that men (with larger brain volume) have higher cognitive reserve to withstand more insult (pathological changes) compared to woman25, which is in agreement with our finding.The latter findings have already been published and were not the objective of this study 26-28. Finally, even if underpowered, the sub-analysis of TSPO genotypes and the hazards of cognitive worsening in amyloid positive subject did not show any significant correlation also after adjusting for ApoE4 homozygotes presence thus suggesting that TSPO genotypes seems not to have any significant interaction with amyloid deposition.
11C-PBR28 has 80-fold higher affinity for TSPO than thefirst generation TSPO tracer, 11C-PK11195. 11C-(R)-PK11195 has significantly lower signal-to-noise ratio compared to 11C-PBR2829. However, it was found that patients exhibited different binding affinities for TSPO, falling into high affinity, low affinity, or mixed affinity binder groups 29. This variability in binding affects modelling of radioligand binding as a proxy for microglial activation, to the extent where some studies have chosen only to use high affinity binders to make their analysis more robust. Another second-generation ligand is11C-DAA1106, which has much higher affinity for TSPO than 11C-(R)-PK11195, is also influenced by TSPO polymorphisms 30. As more and more TSPO tracers are being used to evaluate neuroinflammation, our results demonstrating that TSPO genotype did not influence the amyloid pathology or disease progression in AD is very relevant in evaluating AD patients with second generation TSPO tracers.
At molecular level, the TSPO protein is involved in steroidogenic cells controlling the uptake of cholesterol and thus the synthesis of neuroactive steroids 31. Allopregnanolone, an endogenous neurosteroid synthesised in the central and peripheral nervous systems in myelinating glial cells, astrocytes, and several neuronal cell types, declines with age and neurodegenerative disease 14. Costa et al. demonstrated that the TSPO Ala147Thr spontaneous amino acid substitution within TSPO is able to affect pregnenolone production in a peripheral cell model, represented by circulating lymphomonocytes13. However, it is not known to what extent Thr 147 TSPO genotype could affect neurosteroidsynthetis such as allopregnanole at CNS level, and whether it could play a role in neurodegenerative pathophysiology. Considering our data, it seems very unlikely that Thr 147 TSPO genotype could affect the course of AD.
by on November 4, 2016. For personal use only. jnm.snmjournals.org Downloaded from

8
Considering the number of subjects analysed in our study at baseline and during follow-up, it seems very unlikely that Thr 147 TSPO genotype could affect the course of the disease in AD. A possible limitation of our study is the limited time of follow-up. However, it is reasonably long given the AD patient life span (a mean of 10 years) and the annual rate of conversion of MCI to AD (10-15%). One could argue that, for novel therapeutic targets, the influence of genotype is still unknown. However, unless new potential treatments will interfere with TSPO genotypes and cholesterol metabolism, it is very unlikely this will have an effect. Even though we have not evaluated the influence of HAB, MAB, and LAB in other neurodegenerative diseases, it is unlikely that this difference in binding is going to be clinically significant in other conditions.
CONCLUSION
In conclusion, we have demonstrated that all binding groups (HAB, MAB, and LAB) have the same level of amyloid deposition in AD and MCI subjects. The rate of cognitive decline was also similar in the three TSPO subgroups of AD and MCI subjects. We have demonstrated that the prevalence of HAB was 50.3%, while MAB was 41.2% and 8.5% for LAB in AD, MCI and control subjects. This implies that any information about the AD process or effects of intervention explored in a subgroup of high affinity or mixed affinity binder subjects using second generation TSPO could be translated to the whole AD or MCI population. This will allow us to study lower numbers of AD subjects in evaluating new anti-neuroinflammatory/anti-microglial agents in intervention studies, and in observational studies evaluating the role of neuroinflammation.
CONFLICT OF INTEREST
Fan Z: Nothing to disclose
Harold D: Nothing to disclose
Pasqualetti G: Received funding from University of Pisa and from PAIM (Pisa, Italy) and Italian Society of Pharmacology for research travel cost
Williams J: Nothing to disclose
Brooks, DJ: Professor Brooks was also the chief medical officer for GE healthcare, and he has received consultancy fees/honoraria from the following: Acadia Pharmaceuticals Inc, Amsterdam Molecular Therapeuctics BV, AstraZeneca, BiogeIdec, NeuroNova AB, Eli Lilly and Company, Medtronic Inc, Shire Pharmaceuticals Inc, Synosia Therapeutics AG, GlaxoSmith Kline, UBC Biosciences Inc, Veralis (R&D) limited, Genentech Inc, Navidea.
Edison P: Received grant funding from Medical Research Council, UK, Alzheimer’s Research, UK, Alzheimer’s Society, UK, Novo Nordisk, and GE Healthcare.
by on November 4, 2016. For personal use only. jnm.snmjournals.org Downloaded from

9
ACKNOWLEDGEMENT
This research was supported by Alzheimer’s Research UK.
by on November 4, 2016. For personal use only. jnm.snmjournals.org Downloaded from
10
REFERENCES
1. Lyman M, Lloyd DG, Ji X, Vizcaychipi MP, Ma D. Neuroinflammation: the role and consequences.
Neurosci Res. 2014;79:1‐12.
2. Nothdurfter C, Baghai TC, Schule C, Rupprecht R. Translocator protein (18 kDa) (TSPO) as a
therapeutic target for anxiety and neurologic disorders. European archives of psychiatry and
clinical neuroscience. 2012;262 Suppl 2:S107‐112.
3. Edison P, Archer HA, Hinz R, et al. Amyloid, hypometabolism, and cognition in Alzheimer
disease: an [11C]PIB and [18F]FDG PET study. Neurology. 2007;68:501‐508.
4. Schuitemaker A, Kropholler MA, Boellaard R, et al. Microglial activation in Alzheimer's disease:
an (R)‐[(1)(1)C]PK11195 positron emission tomography study. Neurobiol Aging. 2013;34:128‐
136.
5. Edison P, Archer HA, Gerhard A, et al. Microglia, amyloid, and cognition in Alzheimer's disease:
An [11C](R)PK11195‐PET and [11C]PIB‐PET study. Neurobiol Dis. 2008;32:412‐419.
6. Okello A, Koivunen J, Edison P, et al. Conversion of amyloid positive and negative MCI to AD over
3 years: an 11C‐PIB PET study. Neurology. 2009;73:754‐760.
7. Guo Q, Owen DR, Rabiner EA, Turkheimer FE, Gunn RN. Identifying improved TSPO PET imaging
probes through biomathematics: the impact of multiple TSPO binding sites in vivo. NeuroImage.
2012;60:902‐910.
8. Venneti S, Lopresti BJ, Wang G, et al. A comparison of the high‐affinity peripheral
benzodiazepine receptor ligands DAA1106 and (R)‐PK11195 in rat models of neuroinflammation:
implications for PET imaging of microglial activation. Journal of neurochemistry. 2007;102:2118‐
2131.
9. Wadsworth H, Jones PA, Chau WF, et al. [(1)(8)F]GE‐180: a novel fluorine‐18 labelled PET tracer
for imaging Translocator protein 18 kDa (TSPO). Bioorg Med Chem Lett. 2012;22:1308‐1313.
by on November 4, 2016. For personal use only. jnm.snmjournals.org Downloaded from
11
10. Yoder KK, Nho K, Risacher SL, Kim S, Shen L, Saykin AJ. Influence of TSPO genotype on 11C‐
PBR28 standardized uptake values. J Nucl Med. 2013;54:1320‐1322.
11. Owen DR, Yeo AJ, Gunn RN, et al. An 18‐kDa translocator protein (TSPO) polymorphism explains
differences in binding affinity of the PET radioligand PBR28. J Cereb Blood Flow Metab.
2012;32:1‐5.
12. Kreisl WC, Jenko KJ, Hines CS, et al. A genetic polymorphism for translocator protein 18 kDa
affects both in vitro and in vivo radioligand binding in human brain to this putative biomarker of
neuroinflammation. J Cereb Blood Flow Metab. 2013;33:53‐58.
13. Costa B, Pini S, Gabelloni P, et al. The spontaneous Ala147Thr amino acid substitution within the
translocator protein influences pregnenolone production in lymphomonocytes of healthy
individuals. Endocrinology. 2009;150:5438‐5445.
14. Irwin RW, Brinton RD. Allopregnanolone as regenerative therapeutic for Alzheimer's disease:
translational development and clinical promise. Progress in neurobiology. 2014;113:40‐55.
15. Villemagne VL, Mulligan RS, Pejoska S, et al. Comparison of 11C‐PiB and 18F‐florbetaben for
Abeta imaging in ageing and Alzheimer's disease. European journal of nuclear medicine and
molecular imaging. 2012;39:983‐989.
16. Villemagne VL, Pike K, Pejoska S, et al. 11C‐PiB PET ABri imaging in Worster‐Drought syndrome
(familial British dementia): a case report. J Alzheimers Dis. 2010;19:423‐428.
17. Edison P, Carter SF, Rinne JO, et al. Comparison of MRI based and PET template based
approaches in the quantitative analysis of amyloid imaging with PIB‐PET. Neuroimage.
2013;70:423‐433.
18. Teipel S, Heinsen H, Amaro E, Jr., et al. Cholinergic basal forebrain atrophy predicts amyloid
burden in Alzheimer's disease. Neurobiology of aging. 2014;35:482‐491.
by on November 4, 2016. For personal use only. jnm.snmjournals.org Downloaded from
12
19. Devanand DP, Mikhno A, Pelton GH, et al. Pittsburgh compound B (11C‐PIB) and
fluorodeoxyglucose (18 F‐FDG) PET in patients with Alzheimer disease, mild cognitive
impairment, and healthy controls. Journal of geriatric psychiatry and neurology. 2010;23:185‐
198.
20. Landau SM, Lu M, Joshi AD, et al. Comparing positron emission tomography imaging and
cerebrospinal fluid measurements of beta‐amyloid. Annals of neurology. 2013;74:826‐836.
21. Schrag A, Schott JM, Alzheimer's Disease Neuroimaging I. What is the clinically relevant change
on the ADAS‐Cog? Journal of neurology, neurosurgery, and psychiatry. 2012;83:171‐173.
22. Fiala M, Veerhuis R. Biomarkers of inflammation and amyloid‐beta phagocytosis in patients at
risk of Alzheimer disease. Experimental gerontology. 2010;45:57‐63.
23. Quigley H, Colloby SJ, O'Brien JT. PET imaging of brain amyloid in dementia: a review. Int J
Geriatr Psychiatry. 2011;26:991‐999.
24. Holland D, Desikan RS, Dale AM, McEvoy LK, Alzheimer's Disease Neuroimaging I. Rates of
decline in Alzheimer disease decrease with age. PloS one. 2012;7:e42325.
25. Mielke MM, Vemuri P, Rocca WA. Clinical epidemiology of Alzheimer's disease: assessing sex
and gender differences. Clinical epidemiology. 2014;6:37‐48.
26. Tschanz JT, Corcoran CD, Schwartz S, et al. Progression of cognitive, functional, and
neuropsychiatric symptom domains in a population cohort with Alzheimer dementia: the Cache
County Dementia Progression study. The American journal of geriatric psychiatry : official
journal of the American Association for Geriatric Psychiatry. 2011;19:532‐542.
27. Ward A, Crean S, Mercaldi CJ, et al. Prevalence of apolipoprotein E4 genotype and homozygotes
(APOE e4/4) among patients diagnosed with Alzheimer's disease: a systematic review and meta‐
analysis. Neuroepidemiology. 2012;38:1‐17.
by on November 4, 2016. For personal use only. jnm.snmjournals.org Downloaded from

13
28. Paradise M, Cooper C, Livingston G. Systematic review of the effect of education on survival in
Alzheimer's disease. International psychogeriatrics / IPA. 2009;21:25‐32.
29. Kreisl WC, Fujita M, Fujimura Y, et al. Comparison of [(11)C]‐(R)‐PK 11195 and [(11)C]PBR28, two
radioligands for translocator protein (18 kDa) in human and monkey: Implications for positron
emission tomographic imaging of this inflammation biomarker. Neuroimage. 2010;49:2924‐
2932.
30. Maeda J, Suhara T, Zhang MR, et al. Novel peripheral benzodiazepine receptor ligand
[11C]DAA1106 for PET: an imaging tool for glial cells in the brain. Synapse. 2004;52:283‐291.
31. Rupprecht R, Papadopoulos V, Rammes G, et al. Translocator protein (18 kDa) (TSPO) as a
therapeutic target for neurological and psychiatric disorders. Nature reviews Drug discovery.
2010;9:971‐988.
by on November 4, 2016. For personal use only. jnm.snmjournals.org Downloaded from
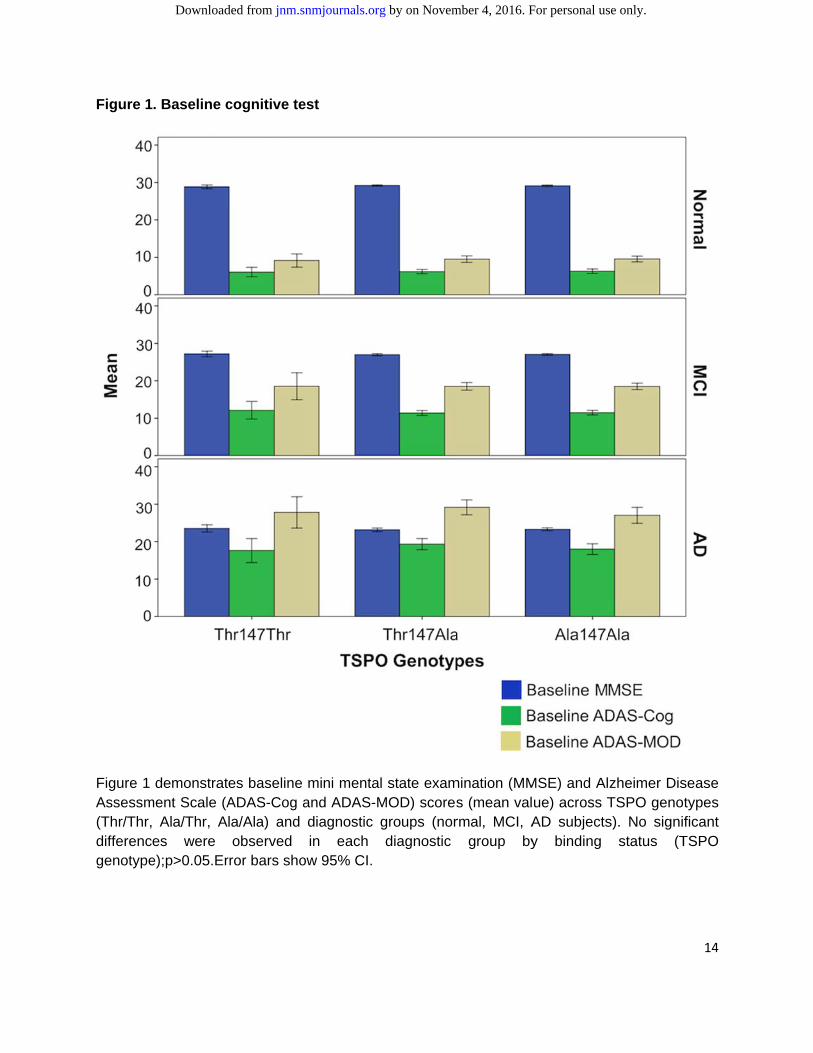
Figure 1
Figure 1 Assessm(Thr/Thr,differencgenotype
. Baseline c
demonstratment Scale (A
Ala/Thr, Aes were
e);p>0.05.Er
cognitive te
es baseline ADAS-Cog ala/Ala) and observed
rror bars sho
est
mini mentaand ADAS-Mdiagnostic in each
ow 95% CI.
l state examMOD) scoresgroups (nordiagnostic
mination (MMs (mean valrmal, MCI, A
group by
MSE) and Alue) across TAD subjectsy binding
zheimer DisTSPO genots). No signif
status (T
14
sease types ficant
TSPO
by on November 4, 2016. For personal use only. jnm.snmjournals.org Downloaded from
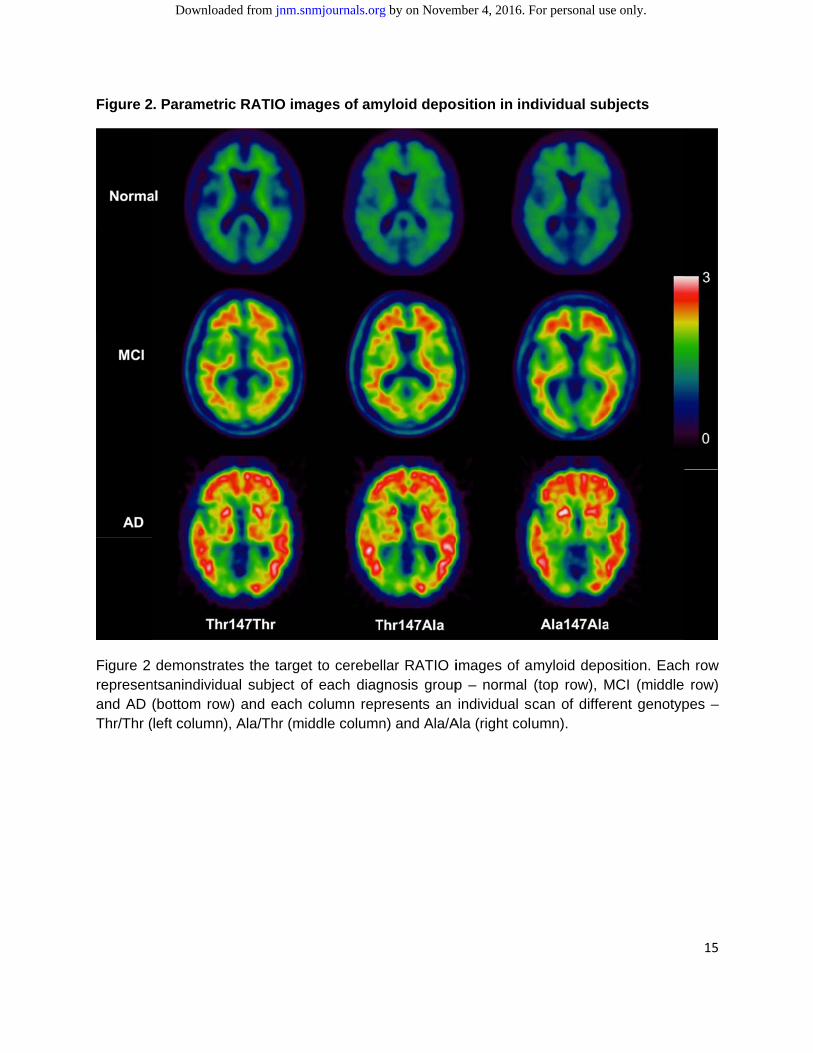
Figure 2
Figure 2 represenand AD Thr/Thr (
. Parametri
demonstratntsanindividu(bottom row(left column)
c RATIO im
tes the targeual subject ow) and each
, Ala/Thr (m
mages of am
et to cerebeof each diagcolumn repiddle column
myloid depo
llar RATIO ignosis grouppresents an n) and Ala/A
osition in ind
images of ap – normal individual sc
Ala (right colu
dividual sub
myloid depo(top row), Mcan of differumn).
bjects
osition. EachMCI (middle rent genotyp
15
h row row)
pes –
by on November 4, 2016. For personal use only. jnm.snmjournals.org Downloaded from
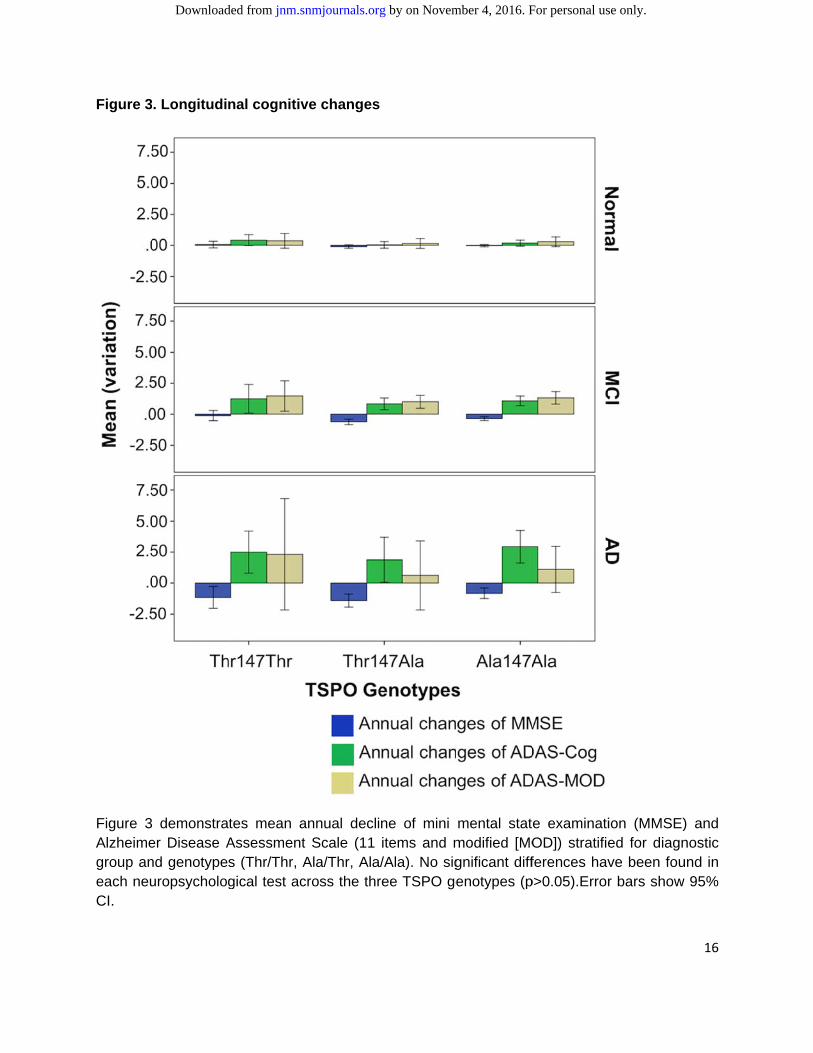
Figure 3
Figure 3Alzheimegroup aneach neuCI.
. Longitudi
demonstraer Disease And genotypeuropsycholog
nal cognitiv
tes mean aAssessments (Thr/Thr, Agical test ac
ve changes
annual declit Scale (11 Ala/Thr, Ala/cross the thr
ne of mini items and m/Ala). No sigree TSPO ge
mental statmodified [MOgnificant diffenotypes (p
e examinatiOD]) stratifieferences hav
p>0.05).Error
ion (MMSE)ed for diagnve been four bars show
16
) and nostic und in 95%
by on November 4, 2016. For personal use only. jnm.snmjournals.org Downloaded from

Figure 4
Figure 4AssessmTSPO ge
4. Survival a
demonstrament Scale menotypes.mo
analysis
tes Kaplan-modified (MOo= months.
Mayer curveOD) increas
es of the suse >3.0 ove
urvival analer time of th
ysis of Alzhe three coh
heimer’s Dishorts stratifie
17
sease ed by
by on November 4, 2016. For personal use only. jnm.snmjournals.org Downloaded from

18
TABLE 1: Demography
Group Number Sex
(male%)
Age, Year
(SD)
%Amyloid+
(number of
subjects)
ApoE4 MMSE ADAS-
Cog
ADAS-
MOD GDRs GDS
Normal 225 52.0 76(±5.0) 31%(99) 1.8 29(±1) 6.2(±3) 9(±4.1) 0.0(0.0) 0.8(1.1)
MCI 388 63.9 75(±7.3) 64%(137) 12.4 27(±1.8) 12(±4.4) 18(±6.6) 0.49
(0.02) 1.6(1.4)
AD 185 52.9 75(±7.5) 84%(19) 17.9 23(±2.0) 18(±6.7) 28(±9.5) 0.74
(0.25) 1.6(1.4)
Total 798 57.4 75(±6.8) 255 10.6 26(±2.7) 11(±6.4) 18(±9.5) 0.41
(0.30) 1.3(1.4)
p<0.01 ns p<0.01 p<0.01 p<0.01 p<0.01 p<0.01 p<0.01 p<0.01
Table 1 shows the demographic details at the baseline, along with scores of MMSE, ADAS-Cog, ADAS-MOD, GDRs and GDS.
Please see the text for details of the amyloid positivity. ApoE4 denotes ApoE4/ApoE4 homozygous. ns: not significant.* The amyloid
PET scan was performed only in 255 patients and the percentage reported was calculated in this subgroup.
by on Novem
ber 4, 2016. For personal use only. jnm
.snmjournals.org
Dow
nloaded from

19
TABLE 2: Prevalence of the TSPO genotypes
SNP
Thr/Thr Ala/Thr Ala/Ala Total
NORMAL 21(9.3) 98(43.6) 106(47.1) 225
MCI 28(7.2) 156(40.2) 204(52.6) 388
AD 19(10.3) 75(40.5) 91(49.2) 185
Total 68(8.5) 329(41.2) 401(50.3) 798
Pearson Chi-Square P=0.570
Prevalence of the three TSPO (Thr/Thr, Ala/Thr, Ala/Ala) genotypes among the diagnostic groups (normal, MCI, AD) and Pearson chi-squared test results.
by on Novem
ber 4, 2016. For personal use only. jnm
.snmjournals.org
Dow
nloaded from
20
TABLE 3: Odds Ratio incidence of TSPO and risk of dementia
SNP
OR CI (95%)
(Thr/Thr, Ala/Thr) Ala/Ala
Normal 119 106 1.24 (Normal vs MCI) 0.89-1.73
MCI 184 204 0.87 (MCI vs AD) 0.61-1.24
AD 94 91 1.09 (Normal vs AD) 0.73-1.60
Odds Ratio (OR) and 95% of confidence interval (C.I.) of TSPO (Thr147) genotypes, heterozygote and homozygote, among diagnostic groups (normal, MCI, AD).
by on Novem
ber 4, 2016. For personal use only. jnm
.snmjournals.org
Dow
nloaded from

21
TABLE 4.General characteristics of the three TSPO cohorts at baseline.
TSPO genotypes
Number Sex (%)
Age, Year (SD)
%Amyloid+ (tot. number)
ApoE4 MMSE ADAS-
Cog ADAS-MOD
GDRs GDS
Thr147Thr 68 60.2 76.6(6.1) 62.5(24) 16.2 26.7(2.7) 11.8(7.0) 18.2(10.5) 0.41(0.32) 1.5(1.5)
Ala147Thr 329 56.2 75.2(6.7) 52.2(113) 8.5 26.8(2.7) 11.7(6.5) 18.3(9.6) 0.40(0.30 1.3(1.3)
Ala147Ala 401 59.1 75.2(7.0) 50.8(118) 11.5 26.7(2.6) 11.6(6.3) 18.1(9.2) 0.42(0.29) 1.5(1.4)
Total 798 58.0 75.3(6.8) 52.5(255) 10.7 26.7(2.7) 11.6(6.4) 18.1(9.5) 0.41(0.30) 1.4(1.4)
p>>0.05 p>>0.05 p>>0.05 p>0.05 p>>0.05 p>>0.05 p>>0.05 p>>0.05 p>0.05
Table 1 shows the demographic details at the baseline, along with scores of MMSE, ADAS-Cog, ADAS-MOD, GDRs and GDS. Please see the text for details of the amyloid positivity. ApoE4 denotes ApoE4/ApoE4 homozygous. ns: not significant.* The amyloid PET scan was performed only in 255 patients and the percentage reported was calculated in this subgroup.
by on Novem
ber 4, 2016. For personal use only. jnm
.snmjournals.org
Dow
nloaded from

22
TABLE 5. Regression analysis of TSPO genotypes and mean annual decline of cognitive function
Dependent variable Independent variable
(TSPO Genotypes) B SE Beta p
Mean MMSE decline Thr/Thr, Ala/Thr, Ala/Ala 0.23 0.15 0.054 0.13
Mean ADAS -Cog change Thr/Thr, Ala/Thr, Ala/Ala -0.16 0.16 -.035 0.32
Mean ADAS-MOD change Thr/Thr, Ala/Thr, Ala/Ala 0.09 0.230 0.01 0.70
B=unstandardized coefficient, SE= standard errors, Beta= standardized coefficient.
by on Novem
ber 4, 2016. For personal use only. jnm
.snmjournals.org
Dow
nloaded from
23
TABLE 6. Multi-regression analysis
Mean MMSE Decline
Mean ADAS-Cog decline
Mean ADAS-MOD decline
Model B SE Beta p B SE Beta p B SE Beta p
Age 0.01 0.01 0.04 0.30 0.01 0.01 0.02 0.62 0.04 0.02 0.07 0.05
ApoE4 -0.34 0.20 -0.06 0.09 0.22 0.21 0.04 0.30 0.69 0.30 0.09 0.02
Diagnostic groups
(normal, MCI, AD) -1.16 0.14 -0.30 0.00 1.52 0.14 0.37 0.00 1.16 0.21 0.20 0.00
Gender -0.09 0.20 -0.02 0.65 0.61 0.20 0.10 0.00 0.64 0.29 0.08 0.03
TSOP genotypes
(Thr/Thr, Ala/Thr, Ala/Ala) 0.26 0.15 0.06 0.08 -0.18 0.15 -0.04 0.24 0.07 0.22 0.01 0.75
Multi-regression analysis of age, ApoE4 status, diagnostic groups (normal, MCI, AD), gender, and TSPO genotypes (Thr/Thr, Ala/Thr, Ala/Ala) as independent variables and Mean annual decline of mini mental state examination (MMSE) and Alzheimer Disease Assessment Scale (ADAS-Cog items and ADAS-MOD) (B=unstandardized coefficient, beta= standardized coefficient, SE= standard errors).
by on Novem
ber 4, 2016. For personal use only. jnm
.snmjournals.org
Dow
nloaded from

Doi: 10.2967/jnumed.114.149443Published online: April 3, 2015.J Nucl Med. ZHEN FAN, Denise Harold, Giuseppe Pasqualetti, Julie Williams, David James Brooks and Paul Edison applied to the entire AD cohort?Can studies of neuroinflammation in a TSPO genetic subgroup (HAB or MAB) be
http://jnm.snmjournals.org/content/early/2015/04/01/jnumed.114.149443This article and updated information are available at:
http://jnm.snmjournals.org/site/subscriptions/online.xhtml
Information about subscriptions to JNM can be found at:
http://jnm.snmjournals.org/site/misc/permission.xhtmlInformation about reproducing figures, tables, or other portions of this article can be found online at:
and the final, published version.proofreading, and author review. This process may lead to differences between the accepted version of the manuscript
ahead of print area, they will be prepared for print and online publication, which includes copyediting, typesetting,JNMcopyedited, nor have they appeared in a print or online issue of the journal. Once the accepted manuscripts appear in the
. They have not beenJNM ahead of print articles have been peer reviewed and accepted for publication in JNM
(Print ISSN: 0161-5505, Online ISSN: 2159-662X)1850 Samuel Morse Drive, Reston, VA 20190.SNMMI | Society of Nuclear Medicine and Molecular Imaging
is published monthly.The Journal of Nuclear Medicine
© Copyright 2015 SNMMI; all rights reserved.
by on November 4, 2016. For personal use only. jnm.snmjournals.org Downloaded from