
Stratified Analysis for the Control
of Confounding
Zuber D. Mulla

Review
Case Control
Exposed A B
Not
exposed C D

Review
Odds ratio = A D / B C

Alternative Explanations
• Chance
• Bias
• Confounding
See: Hennekens CH, Buring JE. Epidemiology in Medicine.
Boston: Little, Brown and Company, 1987.
What is Confounding?
• A mixing of the effect of the
exposure under study on the
disease with that of a third factor

Confounder
• A factor which is associated with
the exposure variable, and
independent of the exposure, is
related to the outcome/disease
(that is, it’s a risk factor for the
outcome)

Example 1
• Study finds that coffee drinkers are
more likely to have a heart attack in the
next year than those who don’t drink
coffee. But what if those coffee drinkers
were more likely to be smokers than
those who didn’t drink coffee? Was the
association between coffee consumption
and the risk of heart attacks confounded
by smoking?

Example 2
• Study finds that adults in Town A have a higher
incidence of some cancer than adults in nearby Town
B. Town A has a toxic waste dump. Can we blame the
excess risk of this particular cancer in Town A on
exposure to the toxic waste dump?
• What if Town A is a retirement town with an average
age of 85 years while Town B’s average age is 20
years? Older individuals have a higher risk of several
malignancies versus younger individuals.
• Maybe the association between geographical location
and cancer risk is confounded by age!

Interrelationship
EXPOSURE (E) DISEASE (D)
CONFOUNDING FACTOR (CF)

The Potential Confounder
Cannot be a Variable that is on
the Causal Pathway
E ? CF D

Popular Methods to Control
for Confounding
• Randomization
• Matching
• Restriction
• Multivariate modeling
• Stratified analysis

Stratified Analysis
• A technique to control
confounding in the analysis of a
study that involves the evaluation
of the association within
homogeneous categories or strata
of the confounding variable.

Stratified Analysis
• Let’s say Gender was a
confounder
• Calculate odds ratio (OR) for men
and women separately

Stratified Analysis
• Both ORs would be unconfounded
by gender since there is NO
VARIABILITY of the
confounding variable within each
stratum

Stratification
• Stratify on the confounder
• Examine stratum-specific ORs
• Examine crude (overall) OR
Stratification
• If stratum-specific ORs are similar
to one another…
• but different than the crude OR,
then you may have confounding

Stratification (cont.)
• If confounding present, calculate a
summary measure of association:
Mantel-Haenszel OR

Mantel-Haenszel Odds Ratio
• An unconfounded measure of
association
• It’s a weighted average of the
stratum-specific ORs

History
• Nathan Mantel and William Haenszel
• “Statistical Aspects of the Analysis of Data from Retrospective Studies of Disease”
• Journal of the National Cancer Institute, 1959; 22: 719 - 748

History
• Very famous paper!
• Highly cited paper in the
scientific literature

Mantel-Haenszel (M-H) Odds Ratio
( AD / T ) / ( BC / T )
• M-H formula not affected by zero cell entries
• It will give a consistent estimate of the Common Odds Ratio even with large numbers of small strata

Mantel-Haenszel Odds Ratio
• Is this association, after adjusting for
confounding, likely due to random
chance?
• Mantel-Haenszel chi-square & test-
based CI, etc.

Mantel-Haenszel Odds Ratio
• More on interval estimation later…

A mathematical definition of
confounding
• The crude (unadjusted) measure of
association does not equal the
adjusted measure of association:
Crude OR Adjusted OR
• Change-in-estimate method, say 10%
rule

A mathematical definition of
confounding (continued)
• If the adjusted OR deviates from the
crude OR by more than 10% then
some researchers would say that
confounding is present
• Reference: Greenland S. Modeling and variable
selection in epidemiologic analysis. Am J Public
Health 1989; 79: 340-349.

Change-in-Estimate Method Using a 10% Change
Crude OR = 1.50
10% of 1.50 is 0.15
1.50 + 0.15 is 1.65 and 1.50 – 0.15 is 1.35
If adjusted OR <1.35 or >1.65 then
control for that variable

IMPORTANT!
• Assessment of confounding not a
statistical issue
• Don’t examine p-values to see if there
is a statistically-significant association
between E and C, or C and D

IMPORTANT!
• Statistical significance is a function of
–Strength of the association / Difference
–Sample size!!!
(see Hennekens and Buring, Epidemiology in Medicine)

The presence or absence of
confounding should not be assessed
using a statistical test
• A large sample size can easily result
in a statistically significant
association between the C and E or
the C and the D even though there is
no confounding (see Hennekens and
Buring, Epidemiology in Medicine)

The presence or absence of
confounding should not be assessed
using a statistical test
• “On the other hand, even strong
associations that could produce
confounding of substantial
epidemiologic importance may fail to
reach statistical significance with a
small sample size.” – Hennekens and
Buring, Epidemiology in Medicine

Confounding Appears to be
Present
• Stratum One: OR = 2.23
• Stratum Two: OR= 2.45
• Crude (Overall) OR = 1.20

Confounding Not Present
• Stratum One: OR = 2.23
• Stratum Two: OR= 2.45
• Crude (Overall) OR = 2.19

Positive Confounding
• Confounding away from the null
value, either towards 0 or +∞
• Crude OR = 3.00
• Adjusted OR = 2.00
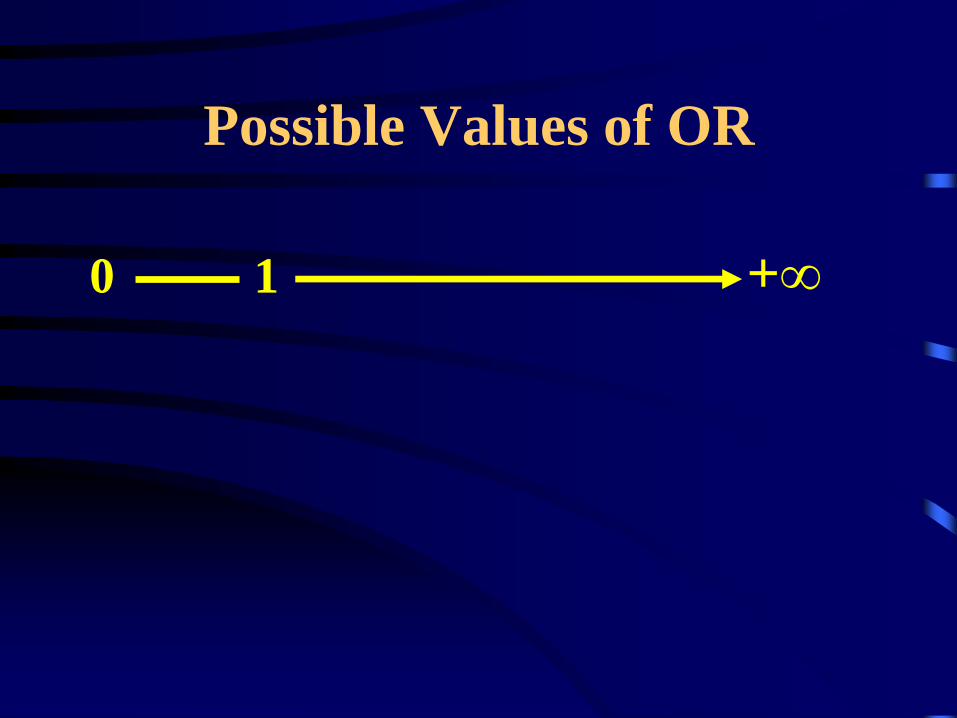
Possible Values of OR
0 1 +∞

Confounding away from the null: start at
the adjusted measure and move your finger
towards the unadjusted (crude) value.
If your finger moved away from 1 (which is
the null value for ORs) then positive
confounding was present. (The figure below isn’t
drawn to scale.)
+∞
0 1 2 3

Another Example of Positive
Confounding
• Crude OR = 0.10
• Adjusted OR = 0.80

Away from the Null
0 1 +∞

Negative Confounding
• Confounding towards the null
value, which is 1, the value of “no
association”

Negative Confounding
• Crude OR = 1.50
• Adjusted OR = 3.00

Negative Confounding
• Crude OR = 0.80
• Adjusted OR = 0.20
Salmonellosis Example
(Adapted from the hepatitis A example
from Gregg, Field Epidemiology, 1st
edition, 1996)
• Hypothetical outbreak of Salmonella
infections among students
• Food consumption questionnaire
administered to 50 students with
salmonellosis, and to 50 healthy students

Example (continued)
• Only two food items had elevated
ORs which were statistically
significant
• Elevated ORs may indicate potential
culprits

• The two suspects:
–Milk
–Donuts

2 x2 Table for Milk:
OR=3.9, p=0.0002
Case Control
Had Milk 37 21 58
No Milk 13 29 42
50 50 100

2 x2 Table for Donuts:
OR=6.0, p=0.0001
Case Control
Ate Donuts 40 20 60
No Donuts 10 30 40
50 50 100

• Donuts were often consumed with
milk!
• How do you tease apart the effect
of each food item?

Association between Donuts and
Salmonellosis Stratified by Milk:
DRANK MILK stratum
Case Control
Ate Donut 36 18
No Donut 1 3
OR = 6.0

Association between Donuts and
Salmonellosis Stratified by Milk:
DID NOT DRINK MILK stratum
Case Control
Ate Donut 4 2
No Donut 9 27
OR = 6.0

Association between Milk and
Salmonellosis Stratified by Donuts:
ATE DONUT stratum
Case Control
Had Milk 36 18
No Milk 4 2
OR = 1.0

Association between Milk and
Salmonellosis Stratified by Donuts:
DID NOT EAT DONUT stratum
Case Control
Had Milk 1 3
No Milk 9 27
OR = 1.0

Exposure: Donut
Potential Confounder: Milk
• Stratum One: OR = 6.0
• Stratum Two: OR= 6.0
• Crude (Overall) OR = 6.0
• Conclusion: No confounding by Milk

Exposure: Milk
Potential Confounder: Donut
• Stratum One: OR = 1.0
• Stratum Two: OR= 1.0
• Crude (Overall) OR = 3.93
• Conclusion: Confounding by Donut

Culprit: Donuts
Another way to look at it...

ORs for the Outcome of
Salmonellosis
• Crude Donut OR = 6.00
• Mantel-Haenszel Donut OR,
adjusted for Milk = 6.0

ORs for the Outcome of
Salmonellosis
• Crude Milk OR = 3.9
• Mantel-Haenszel Milk OR,
adjusted for Donuts = 1.0


