Zoo & AquAriumrevenue Center & Animal interaction report
August 2012


Market & Feasibility Advisors, LLC One South Dearborn, Suite 2100, Chicago, IL 60603 (312) 212-4451 www.mfallc.com 1
Zoo & Aquarium Revenue Center & Animal Interaction Report – August 2012
table of ContentsIntroduction ...................................................................................2
Big Picture Data for Context .....................................................4
Admission Prices ...........................................................................7
Membership ...................................................................................9
Parking ..........................................................................................12
Rides ...............................................................................................12
Water Play and Water Park Areas .........................................21
Special Events Space ................................................................22
Meeting Space ............................................................................23
Restaurants ..................................................................................23
Temporary Exhibits ...................................................................25
Theaters ........................................................................................25
Gift Shops .....................................................................................26
Animal Shows .............................................................................26
Stroller/Wagon Rental .............................................................27
Public or Privately Owned ......................................................28
Websites .......................................................................................28
Market & Feasibility Advisors, LLC
2 OneSouthDearborn,Suite2100,Chicago,IL60603•(312)212-4451•www.mfallc.com
Zoo & Aquarium Revenue Center & Animal Interaction Report – August 2012
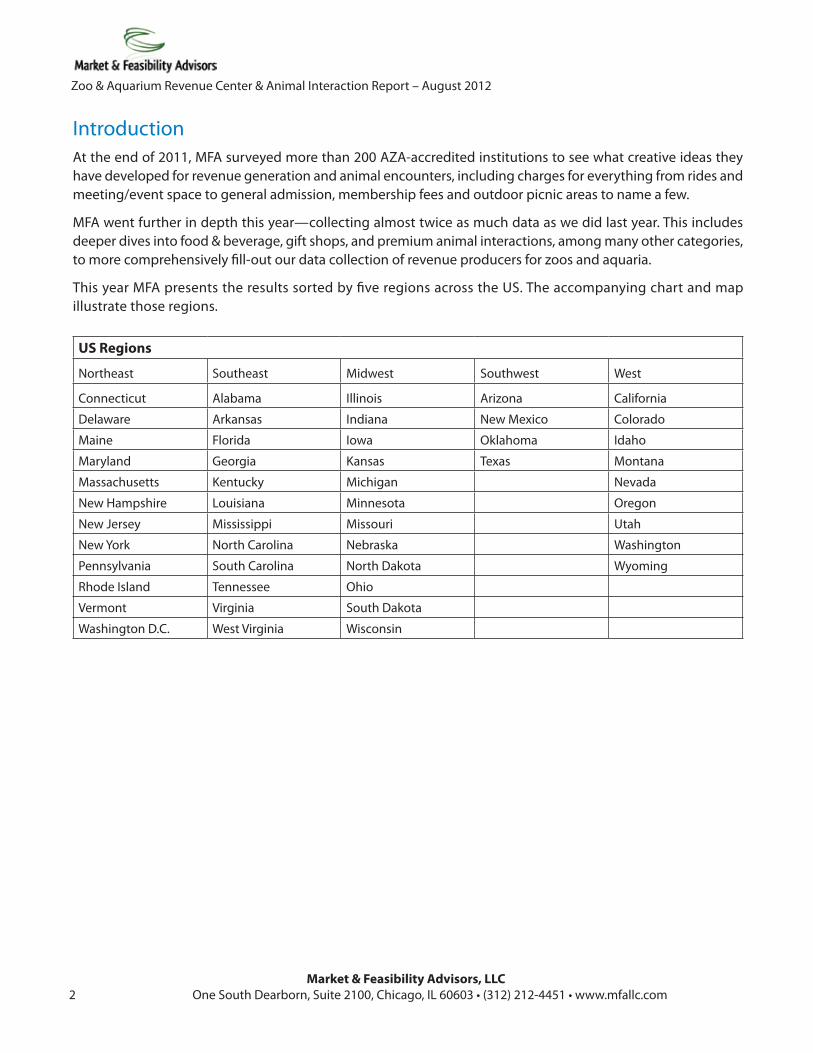
IntroductionAt the end of 2011, MFA surveyed more than 200 AZA-accredited institutions to see what creative ideas they have developed for revenue generation and animal encounters, including charges for everything from rides and meeting/event space to general admission, membership fees and outdoor picnic areas to name a few.
MFA went further in depth this year—collecting almost twice as much data as we did last year. This includes deeper dives into food & beverage, gift shops, and premium animal interactions, among many other categories, to more comprehensively fill-out our data collection of revenue producers for zoos and aquaria.
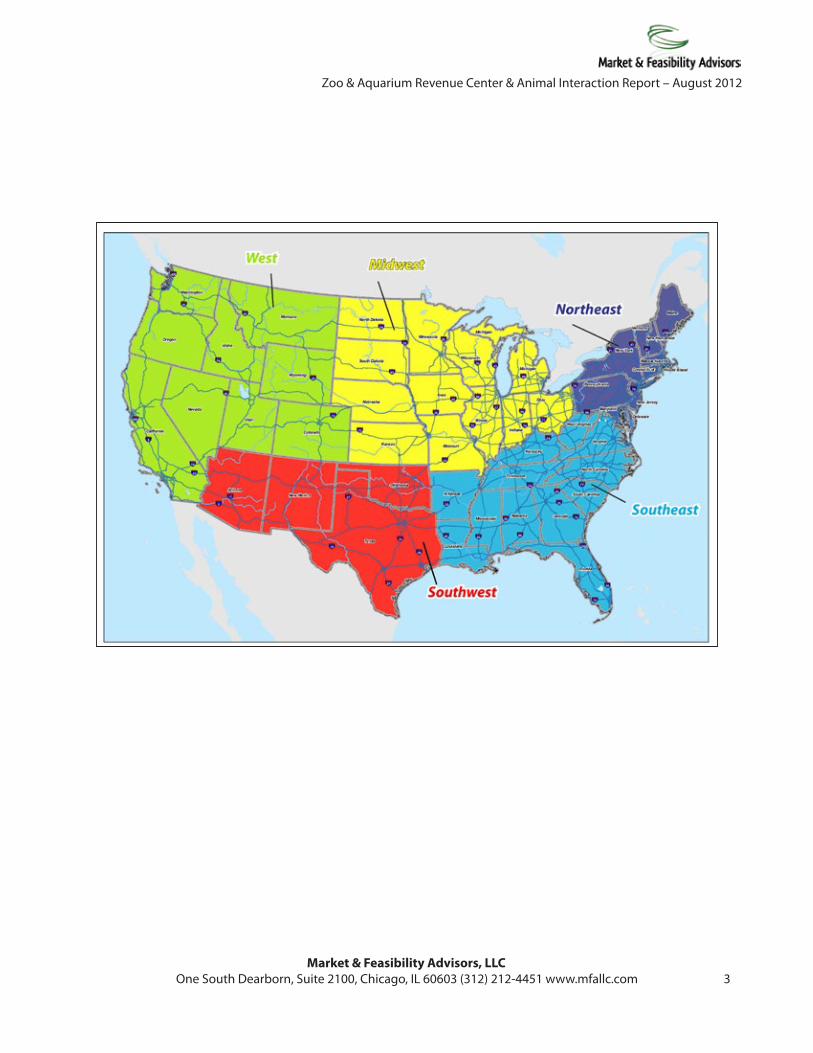
This year MFA presents the results sorted by five regions across the US. The accompanying chart and map illustrate those regions.
US Regions
Northeast Southeast Midwest Southwest West
Connecticut Alabama Illinois Arizona California
Delaware Arkansas Indiana New Mexico Colorado
Maine Florida Iowa Oklahoma Idaho
Maryland Georgia Kansas Texas Montana
Massachusetts Kentucky Michigan Nevada
New Hampshire Louisiana Minnesota Oregon
New Jersey Mississippi Missouri Utah
New York North Carolina Nebraska Washington
Pennsylvania South Carolina North Dakota Wyoming
Rhode Island Tennessee Ohio
Vermont Virginia South Dakota
Washington D.C. West Virginia Wisconsin
Market & Feasibility Advisors, LLC One South Dearborn, Suite 2100, Chicago, IL 60603 (312) 212-4451 www.mfallc.com 3
Zoo & Aquarium Revenue Center & Animal Interaction Report – August 2012
Market & Feasibility Advisors, LLC
4 OneSouthDearborn,Suite2100,Chicago,IL60603•(312)212-4451•www.mfallc.com
Zoo & Aquarium Revenue Center & Animal Interaction Report – August 2012
This report presents and summarizes many of MFA’s findings from analysis of MFA’s zoo/aquarium database.
If you have not yet heard of MFA, we are a recession era start-up with some very experienced consultants. They have worked with zoos as varied as Chicago’s Brookfield, San Antonio, Brevard, Audubon, Miami and Akron. We would be happy to discuss any thoughts or questions you may have about the topics addressed below. To reach Dan Martin, Managing Principal, please call 312.933.7898 or email him at [email protected]. Our website is www.mfallc.com.
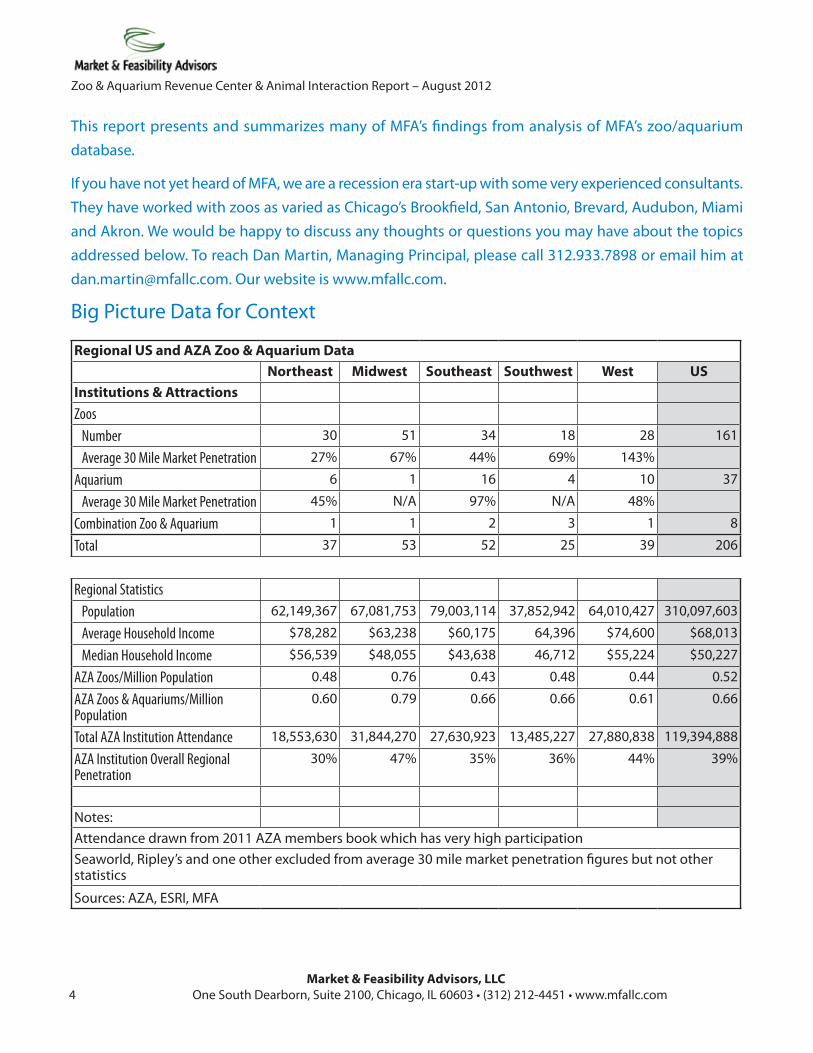
Big Picture Data for Context
Regional US and AZA Zoo & Aquarium DataNortheast Midwest Southeast Southwest West US
Institutions & AttractionsZoos Number 30 51 34 18 28 161
Average 30 Mile Market Penetration 27% 67% 44% 69% 143%
Aquarium 6 1 16 4 10 37
Average 30 Mile Market Penetration 45% N/A 97% N/A 48%
Combination Zoo & Aquarium 1 1 2 3 1 8
Total 37 53 52 25 39 206
Regional Statistics Population 62,149,367 67,081,753 79,003,114 37,852,942 64,010,427 310,097,603
Average Household Income $78,282 $63,238 $60,175 64,396 $74,600 $68,013
Median Household Income $56,539 $48,055 $43,638 46,712 $55,224 $50,227
AZA Zoos/Million Population 0.48 0.76 0.43 0.48 0.44 0.52
AZA Zoos & Aquariums/Million Population
0.60 0.79 0.66 0.66 0.61 0.66
Total AZA Institution Attendance 18,553,630 31,844,270 27,630,923 13,485,227 27,880,838 119,394,888
AZA Institution Overall Regional Penetration
30% 47% 35% 36% 44% 39%
Notes:Attendance drawn from 2011 AZA members book which has very high participationSeaworld, Ripley’s and one other excluded from average 30 mile market penetration figures but not other statistics
Sources: AZA, ESRI, MFA
Market & Feasibility Advisors, LLC One South Dearborn, Suite 2100, Chicago, IL 60603 (312) 212-4451 www.mfallc.com 5
Zoo & Aquarium Revenue Center & Animal Interaction Report – August 2012
MFA can make the following observations after ana-lyzing the data on page 4.
• Western region zoos have a much higher mar-ket penetration rate than zoos in the other re-gions—a remarkable 143% of the population in a 30-mile ring around their locations. Southwestern and Midwestern zoos come in a distant second and third with 69% and 67% respectively. The Southeastern average is still lower, at 44%, and the Northeastern regional average was a very distant fifth at 27%.
• The Southeast leads the US in the number of aquaria with 16—about 40% of all US aquaria. The Western region is second with 10.
• Excluding tourist destination aquaria like Ripley’s in Myrtle Beach and the North Carolina state-owned aquaria in the small coastal tourist cities the Southeastern aquaria lead in market penetration also.
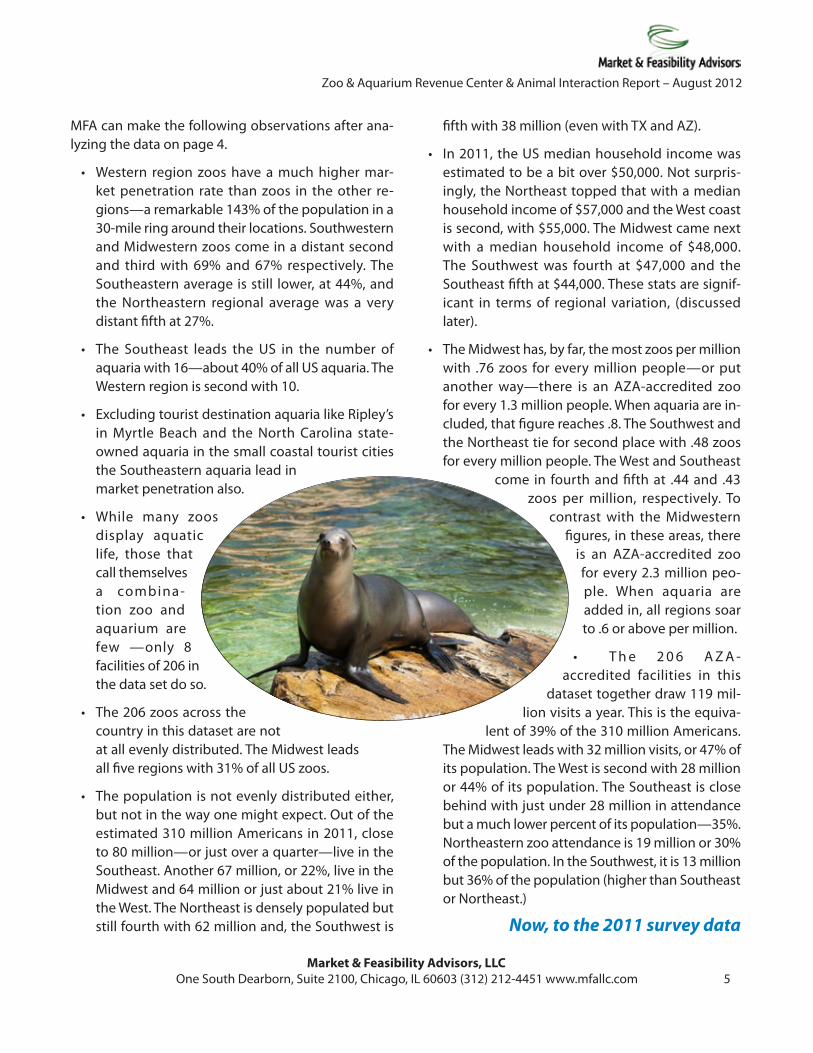
• While many zoos display aquatic life, those that call themselves a combina-tion zoo and aquarium are few —only 8 facilities of 206 in the data set do so.
• The 206 zoos across the country in this dataset are not at all evenly distributed. The Midwest leads all five regions with 31% of all US zoos.
• The population is not evenly distributed either, but not in the way one might expect. Out of the estimated 310 million Americans in 2011, close to 80 million—or just over a quarter—live in the Southeast. Another 67 million, or 22%, live in the Midwest and 64 million or just about 21% live in the West. The Northeast is densely populated but still fourth with 62 million and, the Southwest is
fifth with 38 million (even with TX and AZ).
• In 2011, the US median household income was estimated to be a bit over $50,000. Not surpris-ingly, the Northeast topped that with a median household income of $57,000 and the West coast is second, with $55,000. The Midwest came next with a median household income of $48,000. The Southwest was fourth at $47,000 and the Southeast fifth at $44,000. These stats are signif-icant in terms of regional variation, (discussed later).
• The Midwest has, by far, the most zoos per million with .76 zoos for every million people—or put another way—there is an AZA-accredited zoo for every 1.3 million people. When aquaria are in-cluded, that figure reaches .8. The Southwest and the Northeast tie for second place with .48 zoos for every million people. The West and Southeast
come in fourth and fifth at .44 and .43 zoos per million, respectively. To
contrast with the Midwestern figures, in these areas, there
is an AZA-accredited zoo for every 2.3 million peo-ple. When aquaria are added in, all regions soar to .6 or above per million.
• T h e 2 0 6 A Z A -accredited facilities in this
dataset together draw 119 mil-lion visits a year. This is the equiva-
lent of 39% of the 310 million Americans. The Midwest leads with 32 million visits, or 47% of its population. The West is second with 28 million or 44% of its population. The Southeast is close behind with just under 28 million in attendance but a much lower percent of its population—35%. Northeastern zoo attendance is 19 million or 30% of the population. In the Southwest, it is 13 million but 36% of the population (higher than Southeast or Northeast.)
Now, to the 2011 survey data
Market & Feasibility Advisors, LLC
6 OneSouthDearborn,Suite2100,Chicago,IL60603•(312)212-4451•www.mfallc.com
Zoo & Aquarium Revenue Center & Animal Interaction Report – August 2012
The headlines from this year’s report are:• The regional analysis shows sharp differences in market penetration and the distribution of zoos and aquaria
nationally.
• Admission prices took a surprisingly sharp turn upward.
• Some attraction sectors have tended toward convergence but not zoos and aquaria. Ticket pricing still seems remarkably varied and not necessarily related to the quality or duration of the experience.
• Individual memberships still seem high and the average cost of a family membership actually went down.
• Parking is still free at 66% of the facilities. An especially high number of zoos rely on street parking.
• 60% of all facilities had rides, a notable increase since last year’s 53%. Trains lead the way with 40% of all facilities but carousels are a close second at 37%. A small but growing number of zoos have clusters of rides. The average train ticket didn’t move much but apparently more than a handful of zoos are now charging for some trains that were once free - pretty brave.
• Zip lines have become very popular. We profile places that now have them.
• The opportunities for animal interactions continue to increase. This year we treat general audience and premium ones separately. You can now ride a camel coast-to-coast as we look at the 25 zoos that offer camel rides.
• Water play areas continue to spread: some 38 zoos and aquaria offer them.
• A growing number of places now offer a covered outdoor space and the number of indoor rental spaces increased so sharply that we think some zoos must have pressed some old underused spaces into service.
• In the restaurant category, there has been a notable increase to 26 restaurants with table service.
• The number of facilities staying open past 6pm in the summer is up to 38.
• Just over half of the 114 theaters in the facilities are amphitheaters.
• Traveling attractions remain popular with the average charge now at $3.21. The Southwest seems to have fewer, on average, than the rest of the country.
• Just over a third of all facilities had animal shows—and all but a few are free.
• Gift shops are almost universal (96%) but carts are comparatively rare with only 13 facilities saying that they have them.
• There are still some bugs to work out with stroller, wheelchair, and ECV rental. Not many places allow ad-vance reservations.
• Ownership has changed. Of the 137 facilities that we found that are publicly owned—59 are now privately run (including non-profits).
Market & Feasibility Advisors, LLC One South Dearborn, Suite 2100, Chicago, IL 60603 (312) 212-4451 www.mfallc.com 7
Zoo & Aquarium Revenue Center & Animal Interaction Report – August 2012
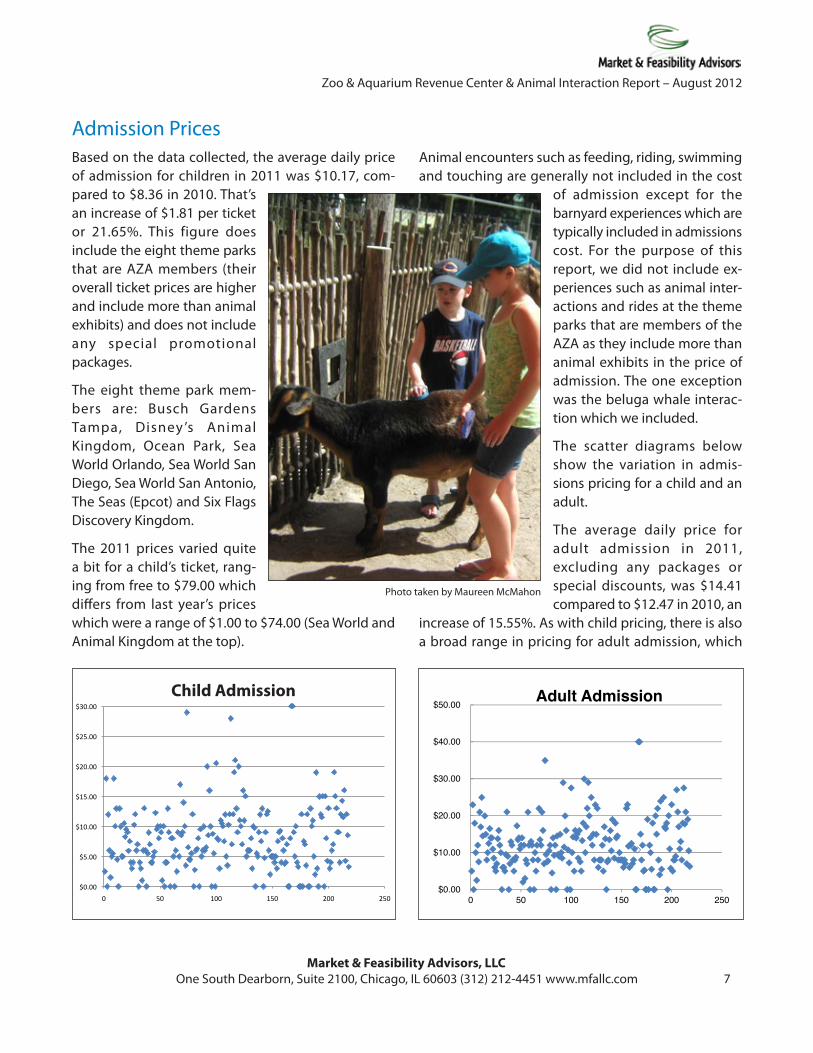
Admission PricesBased on the data collected, the average daily price of admission for children in 2011 was $10.17, com-pared to $8.36 in 2010. That’s an increase of $1.81 per ticket or 21.65%. This figure does include the eight theme parks that are AZA members (their overall ticket prices are higher and include more than animal exhibits) and does not include any special promotional packages.
The eight theme park mem-bers are: Busch Gardens Tampa, Disney ’s Animal Kingdom, Ocean Park, Sea World Orlando, Sea World San Diego, Sea World San Antonio, The Seas (Epcot) and Six Flags Discovery Kingdom.
The 2011 prices varied quite a bit for a child’s ticket, rang-ing from free to $79.00 which differs from last year’s prices which were a range of $1.00 to $74.00 (Sea World and Animal Kingdom at the top).
Animal encounters such as feeding, riding, swimming and touching are generally not included in the cost
of admission except for the barnyard experiences which are typically included in admissions cost. For the purpose of this report, we did not include ex-periences such as animal inter-actions and rides at the theme parks that are members of the AZA as they include more than animal exhibits in the price of admission. The one exception was the beluga whale interac-tion which we included.
The scatter diagrams below show the variation in admis-sions pricing for a child and an adult.
The average daily price for adult admission in 2011, excluding any packages or special discounts, was $14.41 compared to $12.47 in 2010, an
increase of 15.55%. As with child pricing, there is also a broad range in pricing for adult admission, which
$0.00
$10.00
$20.00
$30.00
$40.00
$50.00
0 50 100 150 200 250
Adult Admission
$0.00
$5.00
$10.00
$15.00
$20.00
$25.00
$30.00
0 50 100 150 200 250
Photo taken by Maureen McMahon
Child Admission
Market & Feasibility Advisors, LLC
8 OneSouthDearborn,Suite2100,Chicago,IL60603•(312)212-4451•www.mfallc.com
Zoo & Aquarium Revenue Center & Animal Interaction Report – August 2012
ranges from free to $85.00 (the Sea Worlds and Animal Kingdom). The adult daily admission cost doesn’t gen-erally include animal encounters but will often include barnyard or children’s zoo experiences in the cost. A sneak peak at data for the coming year shows the upward pricing trends continuing.
Almost 78% of zoos offer some type of senior citizen discount on admission with the qualifying age averag-ing 62.6 years. In these times, we are curious about the 22% that somehow get away with no senior discount.
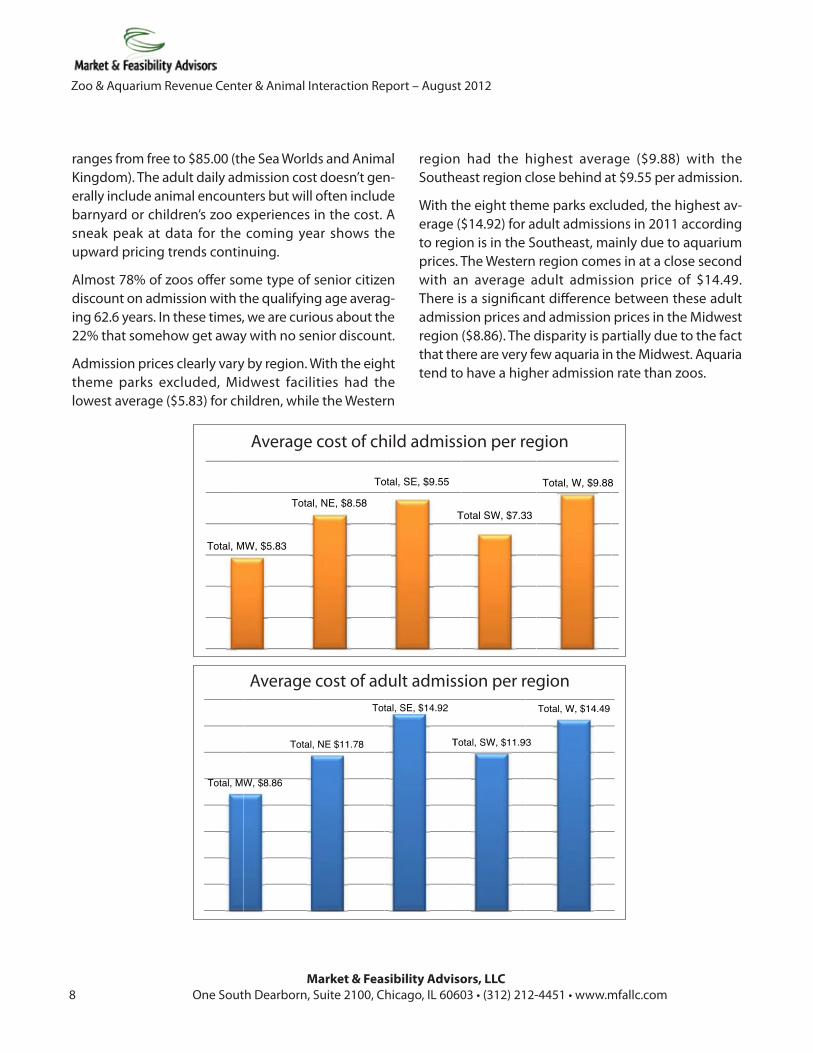
Admission prices clearly vary by region. With the eight theme parks excluded, Midwest facilities had the lowest average ($5.83) for children, while the Western
region had the highest average ($9.88) with the Southeast region close behind at $9.55 per admission.
With the eight theme parks excluded, the highest av-erage ($14.92) for adult admissions in 2011 according to region is in the Southeast, mainly due to aquarium prices. The Western region comes in at a close second with an average adult admission price of $14.49. There is a significant difference between these adult admission prices and admission prices in the Midwest region ($8.86). The disparity is partially due to the fact that there are very few aquaria in the Midwest. Aquaria tend to have a higher admission rate than zoos.
Total, MWW, $8.86
Total,
Average
NE $11.78
Tot
Cost of Adu
tal, SE, $14.92
T
ult Admissio
Total, SW, $11.9
on per Regio
93
Total, W, $14
on
4.49
Average cost of adult admission per region
Total, MMW, $5.83
Tota
Averag
l, NE, $8.58
Tot
ge Child Ad
tal, SE, $9.55
T
mission Co
Total SW, $7.33
ost per Reg
Total, W, $9.88
ion
8
Average cost of child admission per region
Market & Feasibility Advisors, LLC One South Dearborn, Suite 2100, Chicago, IL 60603 (312) 212-4451 www.mfallc.com 9
Zoo & Aquarium Revenue Center & Animal Interaction Report – August 2012
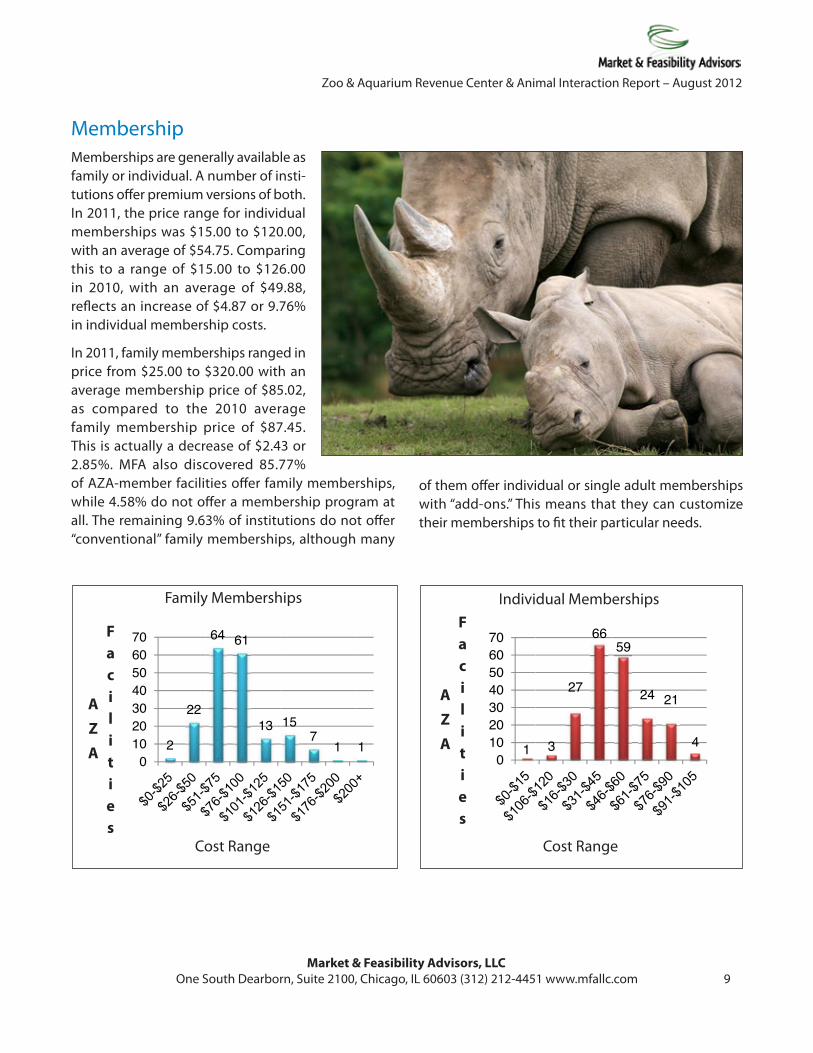
MembershipMemberships are generally available as family or individual. A number of insti-tutions offer premium versions of both. In 2011, the price range for individual memberships was $15.00 to $120.00, with an average of $54.75. Comparing this to a range of $15.00 to $126.00 in 2010, with an average of $49.88, reflects an increase of $4.87 or 9.76% in individual membership costs.
In 2011, family memberships ranged in price from $25.00 to $320.00 with an average membership price of $85.02, as compared to the 2010 average family membership price of $87.45. This is actually a decrease of $2.43 or 2.85%. MFA also discovered 85.77% of AZA-member facilities offer family memberships, while 4.58% do not offer a membership program at all. The remaining 9.63% of institutions do not offer “conventional” family memberships, although many
AZA
Facilities
F
2
22
010203040506070
Cos
Family M64 61
13
st Range
Member
157
1
ships
1
AZA
Facilities
10
10203040506070
C
Indivi
3
27
66
Cost Ran
dual Mem
59
24 21
nge
mbership
4
psIndividual Memberships
Cost Range
AZA
Facilities
AZA
Facilities
F
2
22
010203040506070
Cos
Family M64 61
13
st Range
Member
157
1
ships
1
AZA
Facilities
10
10203040506070
C
Indivi
3
27
66
Cost Ran
dual Mem
59
24 21
nge
mbership
4
psFamily Memberships
Cost Range
AZA
Facilities
of them offer individual or single adult memberships with “add-ons.” This means that they can customize their memberships to fit their particular needs.
Market & Feasibility Advisors, LLC
10 OneSouthDearborn,Suite2100,Chicago,IL60603•(312)212-4451•www.mfallc.com
Zoo & Aquarium Revenue Center & Animal Interaction Report – August 2012
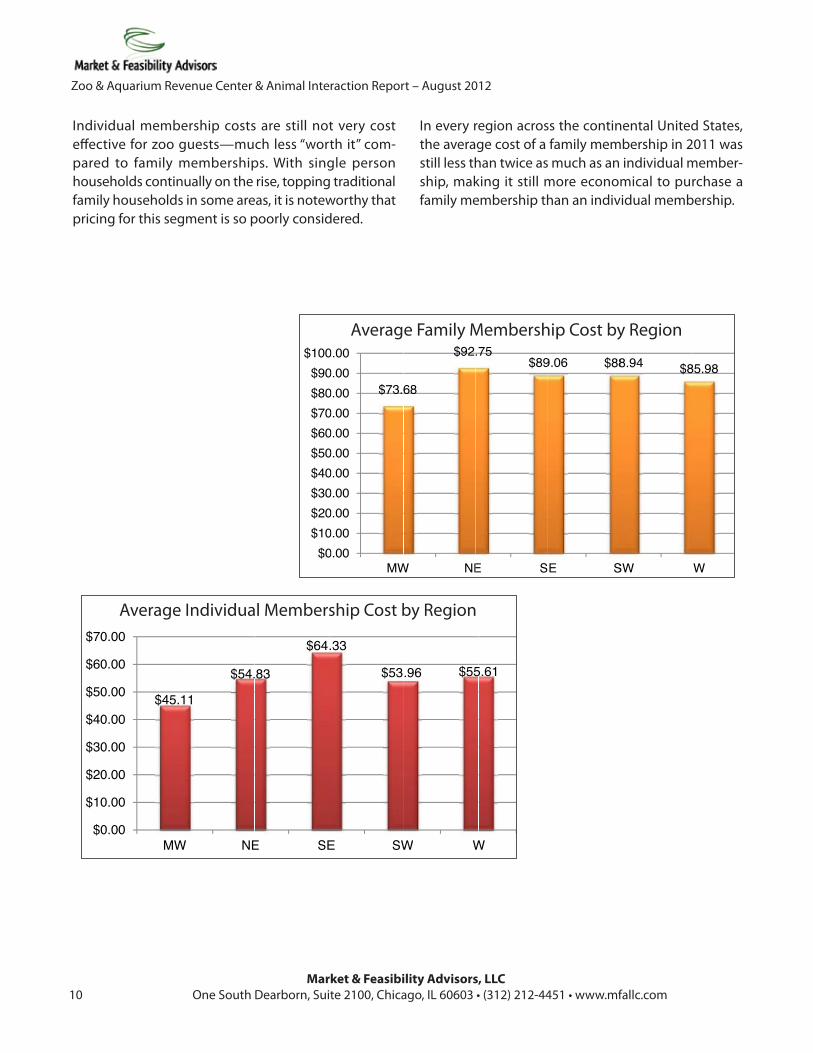
Individual membership costs are still not very cost effective for zoo guests—much less “worth it” com-pared to family memberships. With single person households continually on the rise, topping traditional family households in some areas, it is noteworthy that pricing for this segment is so poorly considered.
In every region across the continental United States, the average cost of a family membership in 2011 was still less than twice as much as an individual member-ship, making it still more economical to purchase a family membership than an individual membership.
$0
$10
$20
$30
$40
$50
$60
$70
$45.
0.00
0.00
0.00
0.00
0.00
0.00
0.00
0.00
MW
Avera
11
$54.
W NE
age Individ
.83
$64
E SE
ual Membe
.33
$53
E SW
ership Cos
.96 $55
W W
st by Regio
5.61
W
onAverage Individual Membership Cost by Region
$0$10$20$30$40$50$60$70$80$90
$100
$73.6
.00
.00
.00
.00
.00
.00
.00
.00
.00
.00
.00
MW
F
68
$92
W NE
amily Mem.75
$89
E S
mbership C
9.06 $88
E S
Cost by Reg
8.94 $8
SW
gion
85.98
W
Average Family Membership Cost by Region

Market & Feasibility Advisors, LLC One South Dearborn, Suite 2100, Chicago, IL 60603 (312) 212-4451 www.mfallc.com 11
Zoo & Aquarium Revenue Center & Animal Interaction Report – August 2012
MFA analyzed the data once again on 174 institutions that offer traditional family memberships and their average number of visits of 1.5 adults and 2.0 children. On average, the price of a family membership equals the price that would be paid for 2.82 visits, while the median of visits included is 2.44. Comparing the 2011
data with 2010 indicates no significant change. Once again, 53% of institutions fall in the two to three vis-its—per membership category.
The table below shows the distribution of institutions across an array of visit intervals for 2010 and 2011.
Institutional Distribution of Visits/Family Membership
(Visits = 1.5 Adult & 2.0 Child Admissions)
Distribution Summary Distribution
Visits Institutions Visits Institutions
2010 2011 2010 2011Less than 1 1 1 Less than 1 1 1
1.00 to 1.50 2 2 1.00 to 2.00 27 30
1.50 to 1.75 9 11 2.00 to 3.00 91 93
1.75 to 2.00 16 17 3.00 to 4.00 38 34
2.00 to 2.25 21 23 Over 4.00 14 16
2.25 to 2.50 29 29 Total 171 174
2.50 to 2.75 28 21 2.75 to 3.00 13 20
3.00 to 3.25 18 18
3.25 to 3.50 11 5
3.50 to 3.75 5 8
3.75 to 4.00 4 3
4.00 to 4.50 7 7
4.50 to 5.00 2 2
5.00 to 6.00 2 3
Over 6.00 3 4
Total 171 174
Photo taken by Maureen McMahon
Market & Feasibility Advisors, LLC
12 OneSouthDearborn,Suite2100,Chicago,IL60603•(312)212-4451•www.mfallc.com
Zoo & Aquarium Revenue Center & Animal Interaction Report – August 2012
ParkingFree parking is available at 66% of the AZA-member facilities from which MFA received responses. Of the 72 facilities that do not offer free parking, 27% offer visitors only on-street or private options. The average parking fee for the institutions was $7.51 in 2011, in a range of $2.00 to $16.00. The Smithsonian National Zoo is the most expensive, with theme park facilities close behind—$13.00 to $15.00 re-spectively. Members get free parking at 46% of the facilities that charge for parking.
RidesMore facilities in 2011 (60%) had rides than in 2010, when it was 53%. The percent of in-stitutions with trains, the most popular ride, remained at 40%, while the percent of zoos with carousel rides increased by 2% to 37%.
Train tickets averaged $2.38 for an adult, a slight increase over 2010’s price, and $2.25 for a child. The number of free rides is declining. In 2010, 15 zoos did not charge for train rides, while only five did so in 2011. The average fee for carousels has increased from $1.56 in 2010 to $1.93 for adults and $1.94 for children in 2011.
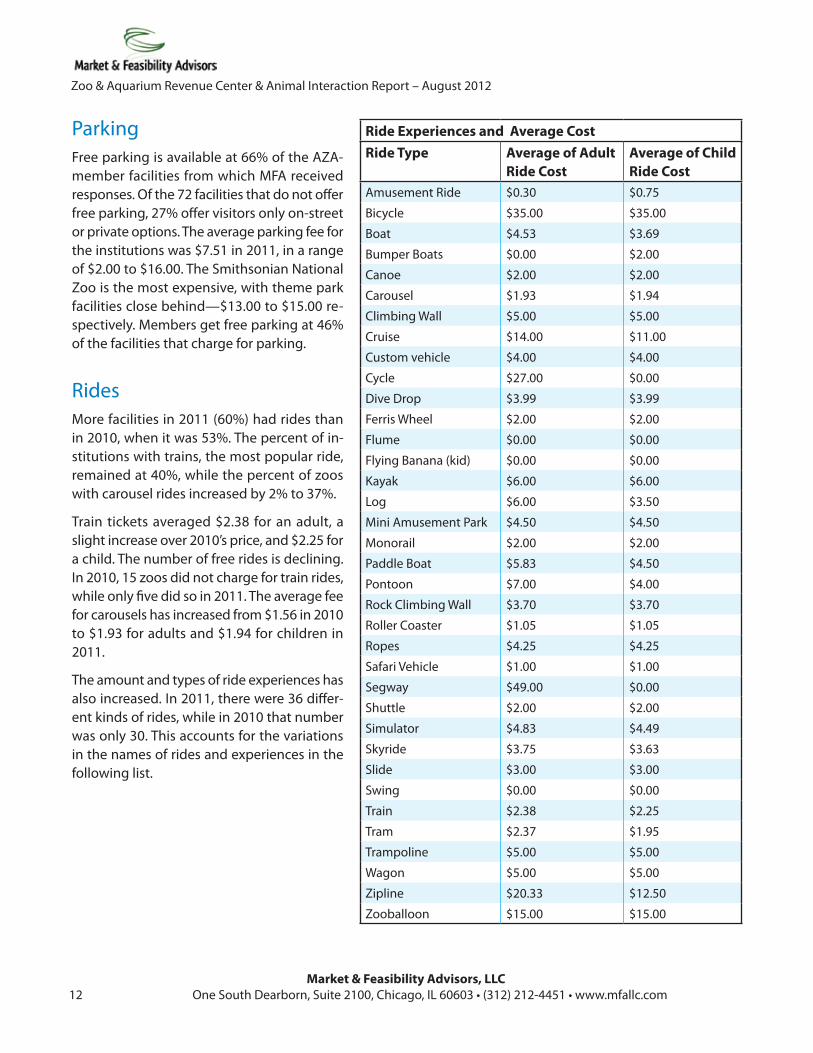
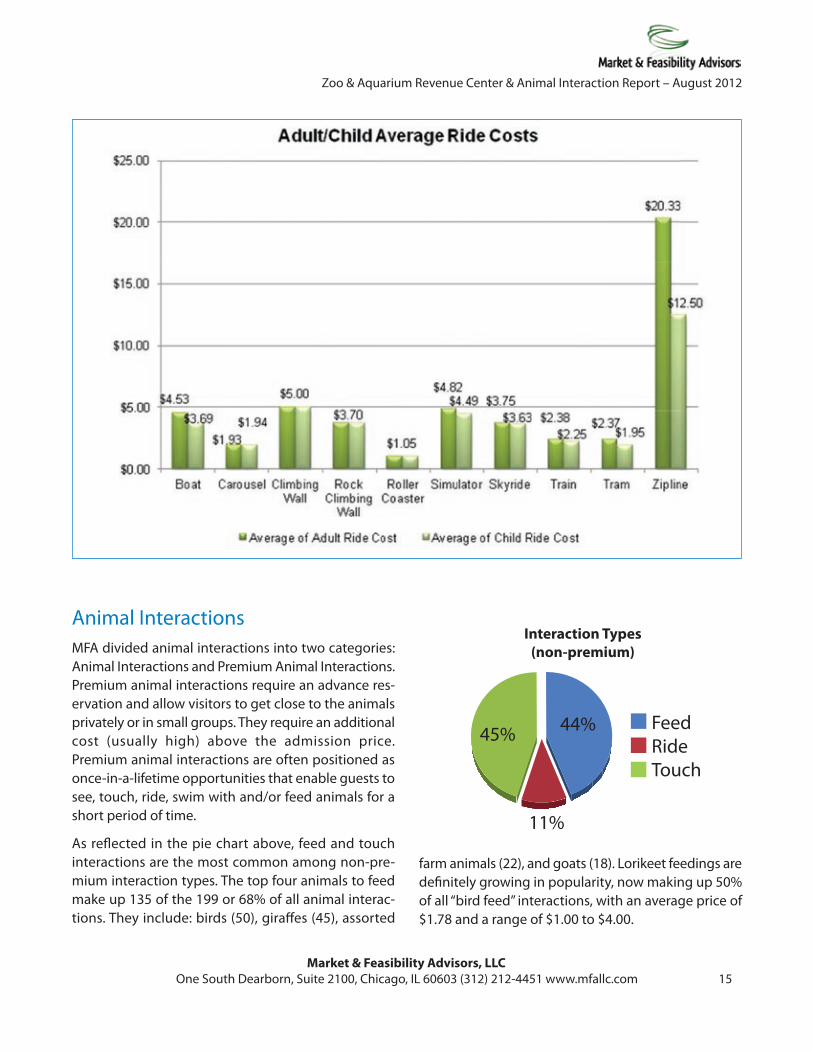
The amount and types of ride experiences has also increased. In 2011, there were 36 differ-ent kinds of rides, while in 2010 that number was only 30. This accounts for the variations in the names of rides and experiences in the following list.
Ride Experiences and Average Cost Ride Type Average of Adult
Ride CostAverage of Child Ride Cost
Amusement Ride $0.30 $0.75
Bicycle $35.00 $35.00
Boat $4.53 $3.69
Bumper Boats $0.00 $2.00
Canoe $2.00 $2.00
Carousel $1.93 $1.94
Climbing Wall $5.00 $5.00
Cruise $14.00 $11.00
Custom vehicle $4.00 $4.00
Cycle $27.00 $0.00
Dive Drop $3.99 $3.99
Ferris Wheel $2.00 $2.00
Flume $0.00 $0.00
Flying Banana (kid) $0.00 $0.00
Kayak $6.00 $6.00
Log $6.00 $3.50
Mini Amusement Park $4.50 $4.50
Monorail $2.00 $2.00
Paddle Boat $5.83 $4.50
Pontoon $7.00 $4.00
Rock Climbing Wall $3.70 $3.70
Roller Coaster $1.05 $1.05
Ropes $4.25 $4.25
Safari Vehicle $1.00 $1.00
Segway $49.00 $0.00
Shuttle $2.00 $2.00
Simulator $4.83 $4.49
Skyride $3.75 $3.63
Slide $3.00 $3.00
Swing $0.00 $0.00
Train $2.38 $2.25
Tram $2.37 $1.95
Trampoline $5.00 $5.00
Wagon $5.00 $5.00
Zipline $20.33 $12.50
Zooballoon $15.00 $15.00
Market & Feasibility Advisors, LLC One South Dearborn, Suite 2100, Chicago, IL 60603 (312) 212-4451 www.mfallc.com 13
Zoo & Aquarium Revenue Center & Animal Interaction Report – August 2012
There is a lot of buzz around zip lines. MFA identified five zoos with zip line experiences ranging in price from $6.00 to $40.00 for adults and $6.00 to $17.50 for children. (Brevard Zoo, Central Florida Zoo and Botanical Garden, John Ball Zoological Garden, Milwaukee County Zoological Gardens and Louisville Zoological Garden).
Rope courses also seem to be increasing in popular-ity as are rock-climbing walls. These range in price from $0.00 to $7.00 (John Ball Zoological Garden, Lincoln (Nebraska) Children’s Zoo, Milwaukee County Zoological Gardens, and Oklahoma City Zoological Park).
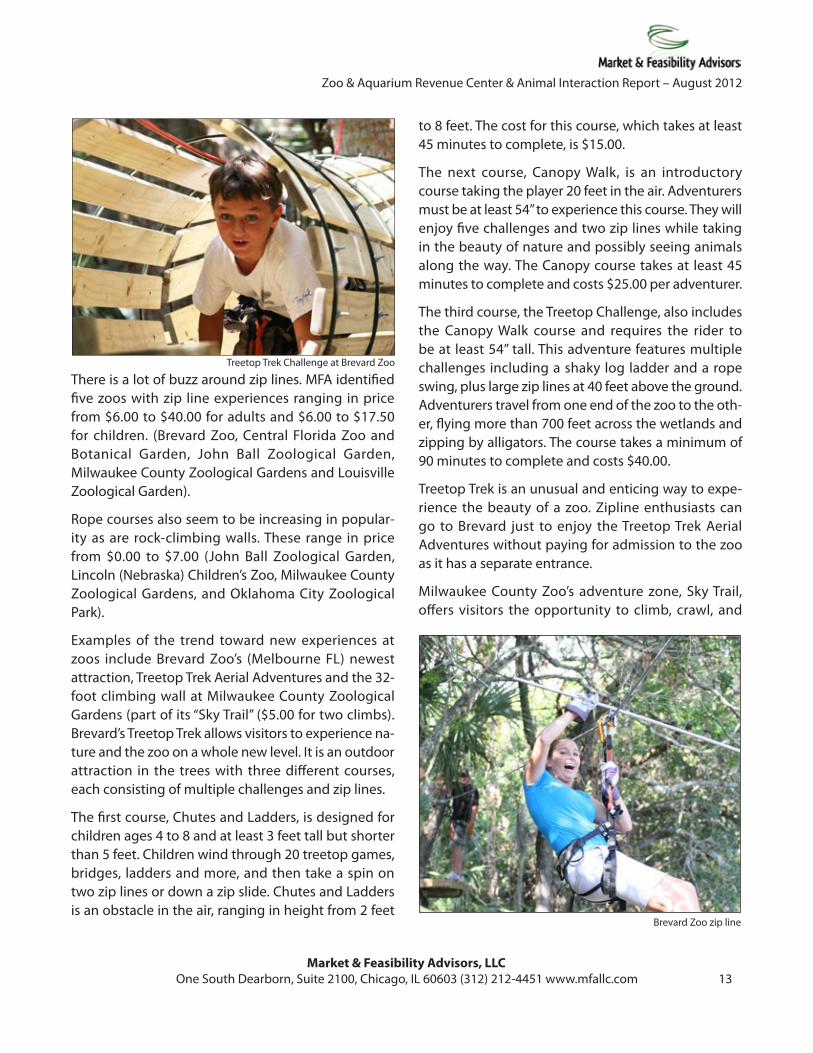
Examples of the trend toward new experiences at zoos include Brevard Zoo’s (Melbourne FL) newest attraction, Treetop Trek Aerial Adventures and the 32-foot climbing wall at Milwaukee County Zoological Gardens (part of its “Sky Trail” ($5.00 for two climbs). Brevard’s Treetop Trek allows visitors to experience na-ture and the zoo on a whole new level. It is an outdoor attraction in the trees with three different courses, each consisting of multiple challenges and zip lines.
The first course, Chutes and Ladders, is designed for children ages 4 to 8 and at least 3 feet tall but shorter than 5 feet. Children wind through 20 treetop games, bridges, ladders and more, and then take a spin on two zip lines or down a zip slide. Chutes and Ladders is an obstacle in the air, ranging in height from 2 feet
to 8 feet. The cost for this course, which takes at least 45 minutes to complete, is $15.00.
The next course, Canopy Walk, is an introductory course taking the player 20 feet in the air. Adventurers must be at least 54” to experience this course. They will enjoy five challenges and two zip lines while taking in the beauty of nature and possibly seeing animals along the way. The Canopy course takes at least 45 minutes to complete and costs $25.00 per adventurer.
The third course, the Treetop Challenge, also includes the Canopy Walk course and requires the rider to be at least 54” tall. This adventure features multiple challenges including a shaky log ladder and a rope swing, plus large zip lines at 40 feet above the ground. Adventurers travel from one end of the zoo to the oth-er, flying more than 700 feet across the wetlands and zipping by alligators. The course takes a minimum of 90 minutes to complete and costs $40.00.
Treetop Trek is an unusual and enticing way to expe-rience the beauty of a zoo. Zipline enthusiasts can go to Brevard just to enjoy the Treetop Trek Aerial Adventures without paying for admission to the zoo as it has a separate entrance.
Milwaukee County Zoo’s adventure zone, Sky Trail, offers visitors the opportunity to climb, crawl, and
Treetop Trek Challenge at Brevard Zoo
Brevard Zoo zip line
Market & Feasibility Advisors, LLC
14 OneSouthDearborn,Suite2100,Chicago,IL60603•(312)212-4451•www.mfallc.com
Zoo & Aquarium Revenue Center & Animal Interaction Report – August 2012
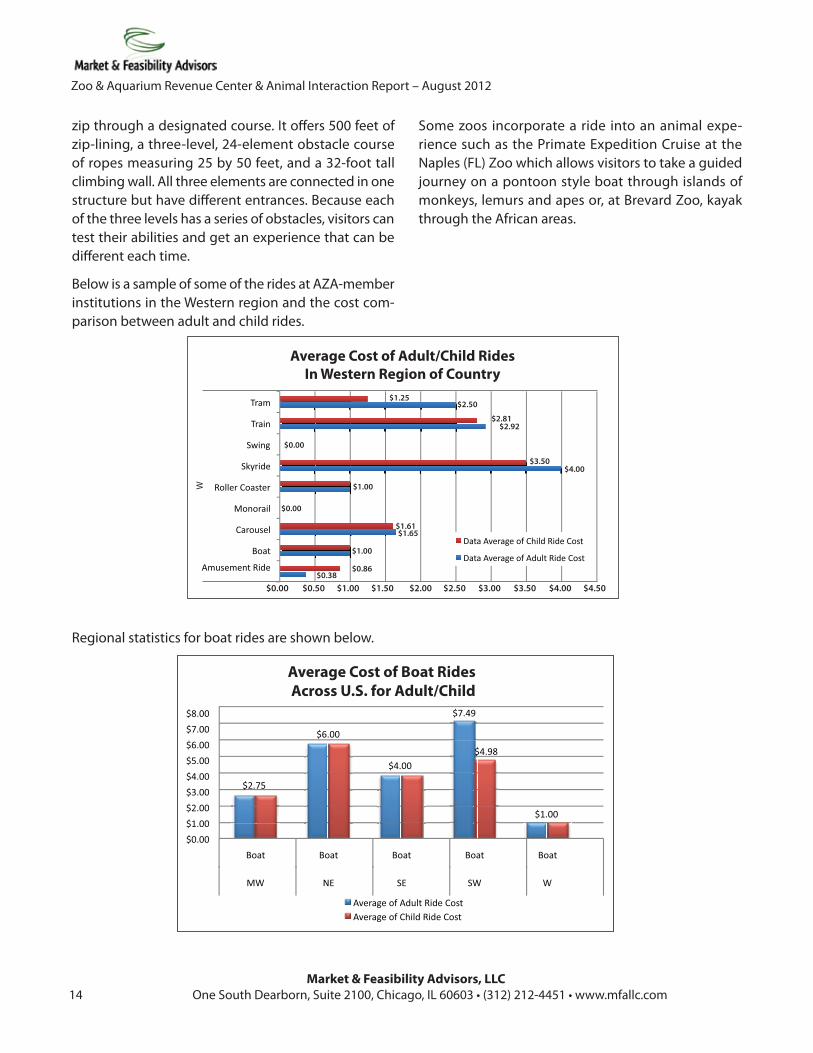
zip through a designated course. It offers 500 feet of zip-lining, a three-level, 24-element obstacle course of ropes measuring 25 by 50 feet, and a 32-foot tall climbing wall. All three elements are connected in one structure but have different entrances. Because each of the three levels has a series of obstacles, visitors can test their abilities and get an experience that can be different each time.
Below is a sample of some of the rides at AZA-member institutions in the Western region and the cost com-parison between adult and child rides.
Regional statistics for boat rides are shown below.
$1.25$2.50
$2.81$2.92
$0.00
$3.50$4.00
$1.00
$0.00
$1.61$1.65
$1.00
$0.86$0.38
$0.00 $0.50 $1.00 $1.50 $2.00 $2.50 $3.00 $3.50 $4.00 $4.50
W
Average Cost of Adult/Child RidesIn Western Region of Country
Average Cost of Boat Rides Across U.S. for Adult/Child
Some zoos incorporate a ride into an animal expe-rience such as the Primate Expedition Cruise at the Naples (FL) Zoo which allows visitors to take a guided journey on a pontoon style boat through islands of monkeys, lemurs and apes or, at Brevard Zoo, kayak through the African areas.
Market & Feasibility Advisors, LLC One South Dearborn, Suite 2100, Chicago, IL 60603 (312) 212-4451 www.mfallc.com 15
Zoo & Aquarium Revenue Center & Animal Interaction Report – August 2012
Animal InteractionsMFA divided animal interactions into two categories: Animal Interactions and Premium Animal Interactions. Premium animal interactions require an advance res-ervation and allow visitors to get close to the animals privately or in small groups. They require an additional cost (usually high) above the admission price. Premium animal interactions are often positioned as once-in-a-lifetime opportunities that enable guests to see, touch, ride, swim with and/or feed animals for a short period of time.
As reflected in the pie chart above, feed and touch interactions are the most common among non-pre-mium interaction types. The top four animals to feed make up 135 of the 199 or 68% of all animal interac-tions. They include: birds (50), giraffes (45), assorted
farm animals (22), and goats (18). Lorikeet feedings are definitely growing in popularity, now making up 50% of all “bird feed” interactions, with an average price of $1.78 and a range of $1.00 to $4.00.
45% 44%
11%
FeedRideTouch
Interaction Types(non-premium)

Market & Feasibility Advisors, LLC
16 OneSouthDearborn,Suite2100,Chicago,IL60603•(312)212-4451•www.mfallc.com
Zoo & Aquarium Revenue Center & Animal Interaction Report – August 2012
Following is a list of all animals included in non-premium interactions at the different AZA-member facilities and they are broken down by interaction type.
Non - Premium animals and associated interactionsFeed Ride TouchAlpaca Camel AnemonesAssorted Farm Animals Horse Assorted Farm AnimalsBat rays Llama Bat raysBirds Pony Budgie-birdsBison ButterfliesBongo ChickensBudgie-birds CowsCamels ElephantChickens GoatsCockatiels Guinea pigsDeer Horseshoe crabsDucks insectsElephants KangaroosFish LlamasGibbons - monkey PigsGiraffe RabbitsGoat ReptilesGuanaco Sea urchinsKangaroo Sea starsKoi SharksKudu SkateLlama ShrimpLorikeet StingraysNyala Touch poolsOcelot WallabyParakeet WhelksPelicansPenguins River otter Scottish highlander Sea Lions Sheep Stingray TortoiseTurkeyTurtleWallabyWarthog White Rhino Zebra Zebas
Don’t know what a Whelk is?
Answer on page 21
Julia—lorikeet feeding—Lion Country Safari
Market & Feasibility Advisors, LLC One South Dearborn, Suite 2100, Chicago, IL 60603 (312) 212-4451 www.mfallc.com 17
Zoo & Aquarium Revenue Center & Animal Interaction Report – August 2012
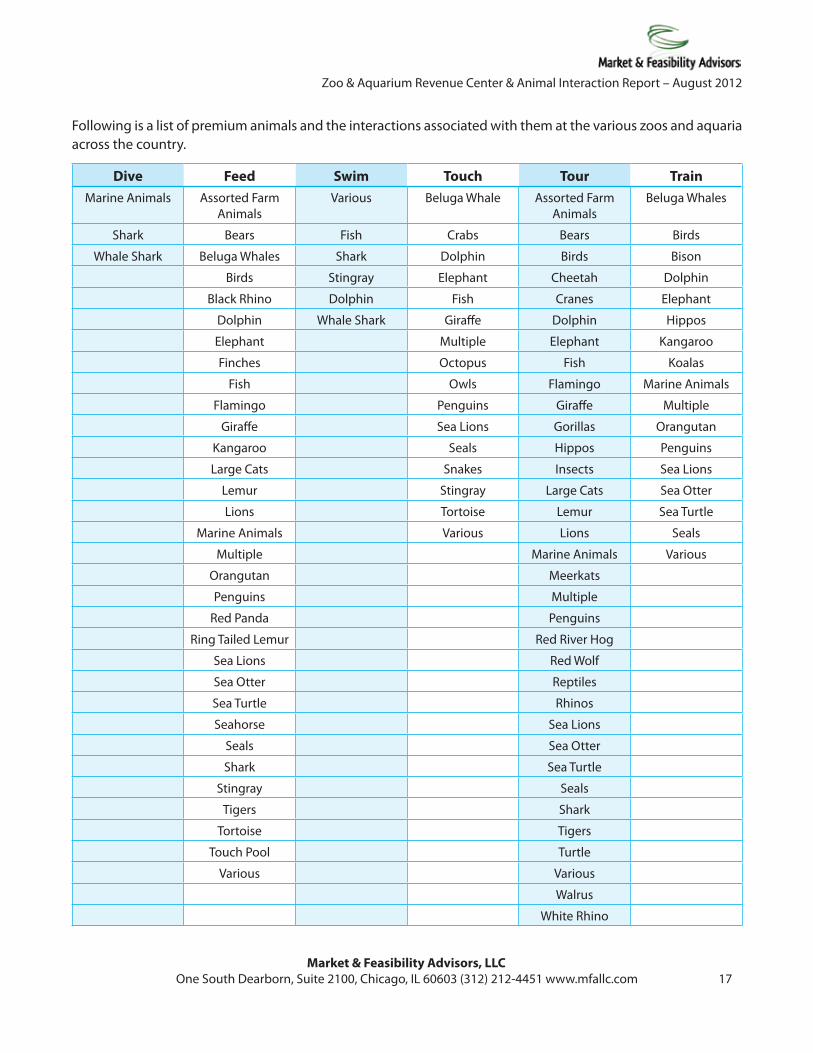
Following is a list of premium animals and the interactions associated with them at the various zoos and aquaria across the country.
Dive Feed Swim Touch Tour TrainMarine Animals Assorted Farm
AnimalsVarious Beluga Whale Assorted Farm
AnimalsBeluga Whales
Shark Bears Fish Crabs Bears Birds
Whale Shark Beluga Whales Shark Dolphin Birds Bison
Birds Stingray Elephant Cheetah Dolphin
Black Rhino Dolphin Fish Cranes Elephant
Dolphin Whale Shark Giraffe Dolphin Hippos
Elephant Multiple Elephant Kangaroo
Finches Octopus Fish Koalas
Fish Owls Flamingo Marine Animals
Flamingo Penguins Giraffe Multiple
Giraffe Sea Lions Gorillas Orangutan
Kangaroo Seals Hippos Penguins
Large Cats Snakes Insects Sea Lions
Lemur Stingray Large Cats Sea Otter
Lions Tortoise Lemur Sea Turtle
Marine Animals Various Lions Seals
Multiple Marine Animals Various
Orangutan Meerkats
Penguins Multiple
Red Panda Penguins
Ring Tailed Lemur Red River Hog
Sea Lions Red Wolf
Sea Otter Reptiles
Sea Turtle Rhinos
Seahorse Sea Lions
Seals Sea Otter
Shark Sea Turtle
Stingray Seals
Tigers Shark
Tortoise Tigers
Touch Pool Turtle
Various Various
Walrus
White Rhino
Market & Feasibility Advisors, LLC
18 OneSouthDearborn,Suite2100,Chicago,IL60603•(312)212-4451•www.mfallc.com
Zoo & Aquarium Revenue Center & Animal Interaction Report – August 2012
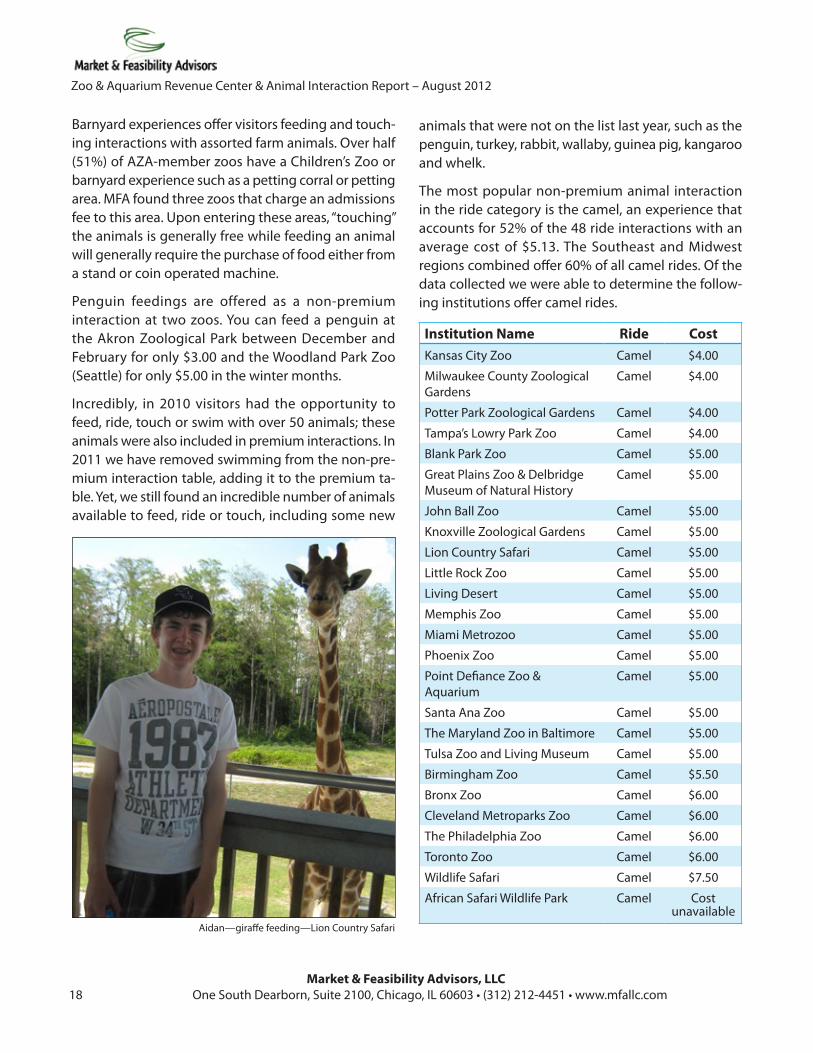
Barnyard experiences offer visitors feeding and touch-ing interactions with assorted farm animals. Over half (51%) of AZA-member zoos have a Children’s Zoo or barnyard experience such as a petting corral or petting area. MFA found three zoos that charge an admissions fee to this area. Upon entering these areas, “touching” the animals is generally free while feeding an animal will generally require the purchase of food either from a stand or coin operated machine.
Penguin feedings are offered as a non-premium interaction at two zoos. You can feed a penguin at the Akron Zoological Park between December and February for only $3.00 and the Woodland Park Zoo (Seattle) for only $5.00 in the winter months.
Incredibly, in 2010 visitors had the opportunity to feed, ride, touch or swim with over 50 animals; these animals were also included in premium interactions. In 2011 we have removed swimming from the non-pre-mium interaction table, adding it to the premium ta-ble. Yet, we still found an incredible number of animals available to feed, ride or touch, including some new
animals that were not on the list last year, such as the penguin, turkey, rabbit, wallaby, guinea pig, kangaroo and whelk.
The most popular non-premium animal interaction in the ride category is the camel, an experience that accounts for 52% of the 48 ride interactions with an average cost of $5.13. The Southeast and Midwest regions combined offer 60% of all camel rides. Of the data collected we were able to determine the follow-ing institutions offer camel rides.
Institution Name Ride CostKansas City Zoo Camel $4.00
Milwaukee County Zoological Gardens
Camel $4.00
Potter Park Zoological Gardens Camel $4.00
Tampa’s Lowry Park Zoo Camel $4.00
Blank Park Zoo Camel $5.00
Great Plains Zoo & Delbridge Museum of Natural History
Camel $5.00
John Ball Zoo Camel $5.00
Knoxville Zoological Gardens Camel $5.00
Lion Country Safari Camel $5.00
Little Rock Zoo Camel $5.00
Living Desert Camel $5.00
Memphis Zoo Camel $5.00
Miami Metrozoo Camel $5.00
Phoenix Zoo Camel $5.00
Point Defiance Zoo & Aquarium
Camel $5.00
Santa Ana Zoo Camel $5.00
The Maryland Zoo in Baltimore Camel $5.00
Tulsa Zoo and Living Museum Camel $5.00
Birmingham Zoo Camel $5.50
Bronx Zoo Camel $6.00
Cleveland Metroparks Zoo Camel $6.00
The Philadelphia Zoo Camel $6.00
Toronto Zoo Camel $6.00
Wildlife Safari Camel $7.50
African Safari Wildlife Park Camel Cost unavailable
Aidan—giraffe feeding—Lion Country Safari
Market & Feasibility Advisors, LLC One South Dearborn, Suite 2100, Chicago, IL 60603 (312) 212-4451 www.mfallc.com 19
Zoo & Aquarium Revenue Center & Animal Interaction Report – August 2012
African Safari Wildlife Park $2.00
Albuquerque Biological Park $1.50
Binder Park Zoo $1.00
Birmingham Zoo $1.00
Blank Park Zoo $1.00
Brevard Zoo $2.00
Buff alo Zoo $5.00
Cheyenne Mountain Zoo $2.00
Cincinnati Zoo & Botanical Garden $1.00
Dallas Zoo $5.00
Detroit Zoological Park $5.00
Dickerson Park Zoo $2.00
Fort Wayne Children’s Zoo $1.00
Fresno Chaff ee Zoo $2.00
Gladys Porter Zoo $3.00
Houston Zoo, Inc. $5.00
Indianapolis Zoological Society, Inc. $1.00
Jacksonville Zoo & Gardens $2.00
Lion Country Safari $2.50
Louisville Zoological Garden $1.00
Memphis Zoo $5.00
Mesker Park Zoo & Botanic Garden $2.00
Milwaukee County Zoological Gardens $10.00
Montgomery Zoo $2.00
Naples Zoo $5.00
Niabi Zoo $4.00
North Carolina Zoological Park $2.00
Northeastern Wisconsin (NEW) Zoo $1.00
Phoenix Zoo $5.00
Racine Zoological Gardens $5.00
Reid Park Zoo $2.00
Riverbanks Zoo & Gardens $2.00
Rolling Hills Wildlife Adventure $1.00
Roosevelt Park Zoo $10.00
Sacramento Zoo $3.00
San Diego Zoo $5.00
Santa Barbara Zoological Gardens $5.00
Sedgwick County Zoo $1.00
Six Flags Discovery Kingdom $4.00
Tampa’s Lowry Park Zoo $3.00
The Maryland Zoo in Baltimore $2.00
Wildlife World Zoo & Aquarium $0.50
Woodland Park Zoo $5.00
Zoo Boise $3.00
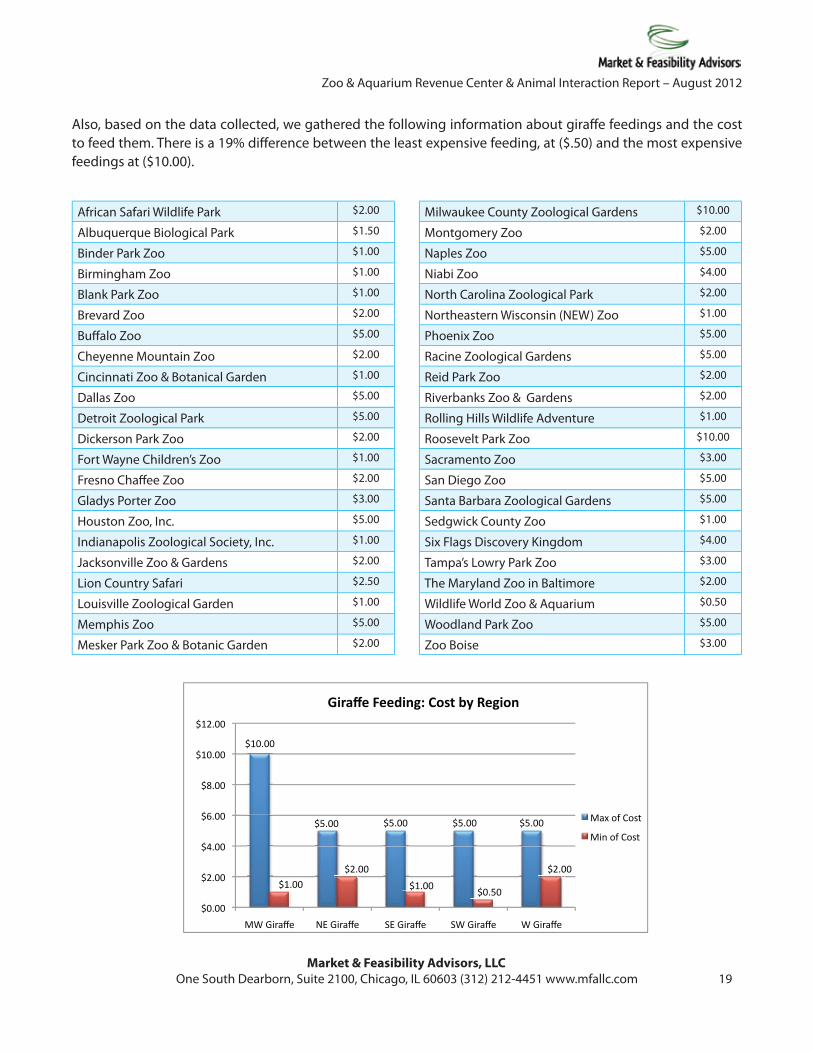
Also, based on the data collected, we gathered the following information about giraff e feedings and the cost to feed them. There is a 19% diff erence between the least expensive feeding, at ($.50) and the most expensive feedings at ($10.00).
$10.00
$5.00 $5.00 $5.00 $5.00
$1.00
$2.00
$1.00 $0.50
$2.00
$0.00
$2.00
$4.00
$6.00
$8.00
$10.00
$12.00
MW Giraffe NE Giraffe SE Giraffe SW Giraffe W Giraffe
Giraffe Feeding: Cost by Region
Max of Cost
Min of Cost
Market & Feasibility Advisors, LLC
20 OneSouthDearborn,Suite2100,Chicago,IL60603•(312)212-4451•www.mfallc.com
Zoo & Aquarium Revenue Center & Animal Interaction Report – August 2012
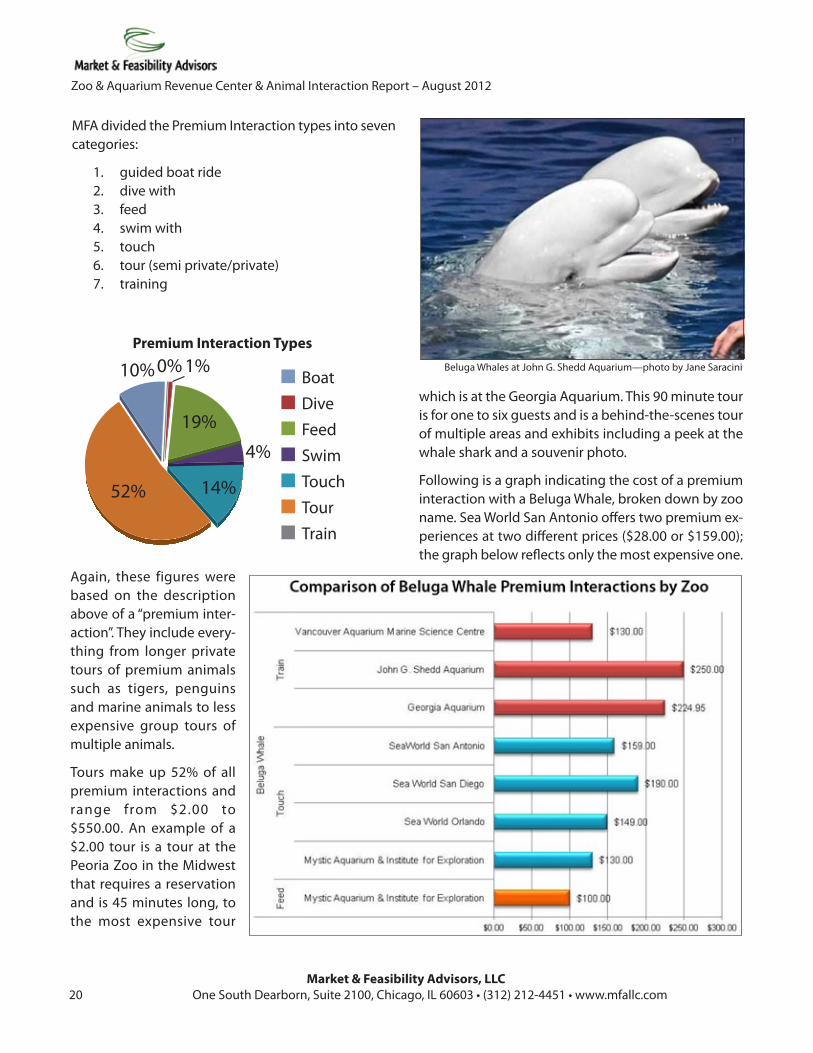
MFA divided the Premium Interaction types into seven categories:
1. guided boat ride2. dive with3. feed4. swim with5. touch6. tour (semi private/private)7. training
Beluga Whales at John G. Shedd Aquarium—photo by Jane Saracini
52%
10% 0% 1%
19%
4%
14%
Premium Interaction Types
BoatDiveFeedSwimTouchTourTrain
Again, these figures were based on the description above of a “premium inter-action”. They include every-thing from longer private tours of premium animals such as tigers, penguins and marine animals to less expensive group tours of multiple animals.
Tours make up 52% of all premium interactions and range from $2.00 to $550.00. An example of a $2.00 tour is a tour at the Peoria Zoo in the Midwest that requires a reservation and is 45 minutes long, to the most expensive tour
which is at the Georgia Aquarium. This 90 minute tour is for one to six guests and is a behind-the-scenes tour of multiple areas and exhibits including a peek at the whale shark and a souvenir photo.
Following is a graph indicating the cost of a premium interaction with a Beluga Whale, broken down by zoo name. Sea World San Antonio offers two premium ex-periences at two different prices ($28.00 or $159.00); the graph below reflects only the most expensive one.
Market & Feasibility Advisors, LLC One South Dearborn, Suite 2100, Chicago, IL 60603 (312) 212-4451 www.mfallc.com 21
Zoo & Aquarium Revenue Center & Animal Interaction Report – August 2012
The Mystic Aquarium & Institute for Exploration also offers two premium Beluga “feed” interactions for $50.00 or $100.00. In both cases, the more expensive one is a longer experience with more interaction with the whale. The differences in price suggest that zoos and aquariums are possibly charging either too little or too much based on the large price differential. The variability in what is actually included in the experi-ence suggests not only that there are likely interaction guidelines but also that the actual set of interactions in the experiences varies. The actual facility in which the interaction takes place may be a factor as well.
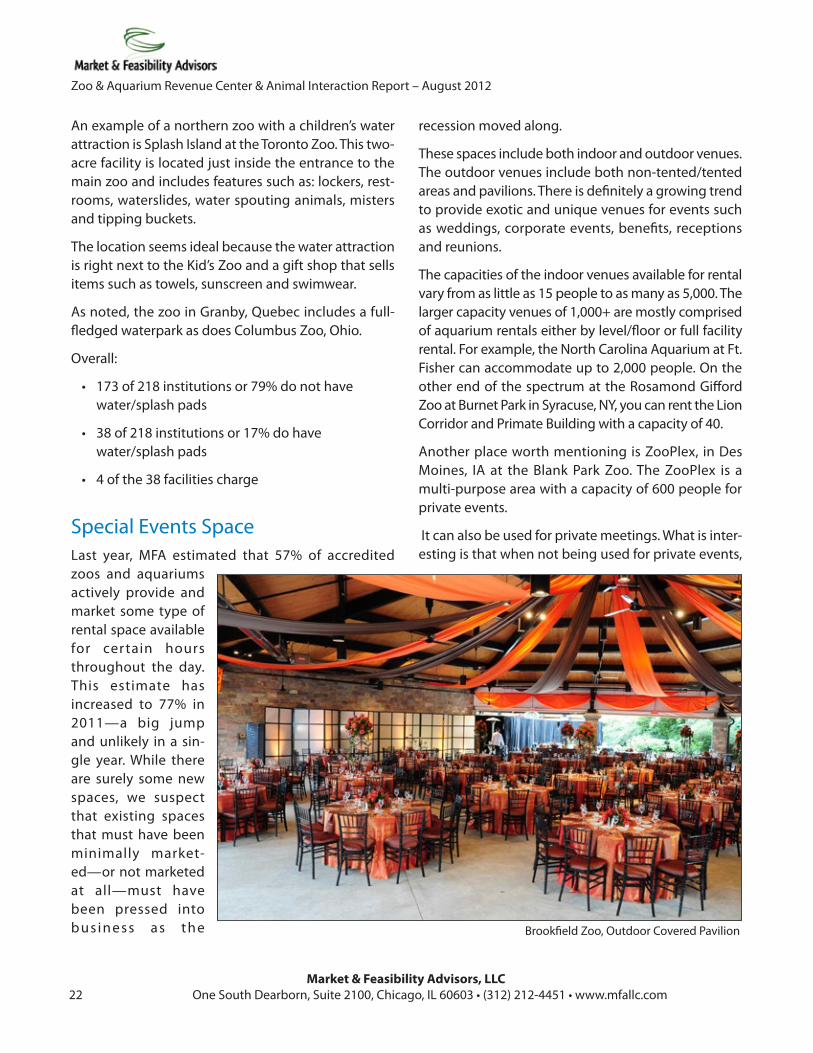
Water Play and Water Park AreasThis year’s MFA data also includes water “spray areas” (2010 did not). Of the approximately 200 AZA insti-tutions, 38 have some type of water play/water park area. These 38 vary greatly in size, ranging from a zero depth water pad in a small open area to an entire wa-terpark that can be as large as some zoos. Only four facilities of the 38 charge an additional amount to use the water area with pricing from $3.96 to $5.00. The facilities with separate entrance waterparks range in price from $15.95 to $32.99.
The relatively low number of 38 facilities with water play areas (17% of the facili-ties surveyed) is quite surprising to MFA.
Southern zoos with water play can enjoy robust early spring attendance into the early summer. Northern zoos can signifi-cantly improve their visitor experience during peak summer months—espe-cially during extended periods of hot weather. One zoo, in Granby, Quebec, includes a full water park in the regular price of admission.
Northern zoos have fewer waterparks (per cap) to compete with than southern zoos. As noted earlier, some regions have more zoos per million than others (like some in the Midwest). Having a water
play area can be a point of distinction for attendance at your zoo. This would be true in the Northeast where distances between zoos are less than in the rest of the country. Aquariums can also have a water play feature. The Florida Aquarium, for example, has a successful water play area next to an outdoor bar that serves cold beers and well drinks.
The Sea World aquatic theme parks in Orlando and San Antonio both have waterparks called Aquatica that integrate animal habitats right within the water park. A number of offshore resorts (like Atlantis in the Bahamas) feature sharks and marine mammals in some of their waterparks too.
Whelk (sea snail)
Brookfield Zoo—Splash Pad
Market & Feasibility Advisors, LLC
22 OneSouthDearborn,Suite2100,Chicago,IL60603•(312)212-4451•www.mfallc.com
Zoo & Aquarium Revenue Center & Animal Interaction Report – August 2012
An example of a northern zoo with a children’s water attraction is Splash Island at the Toronto Zoo. This two-acre facility is located just inside the entrance to the main zoo and includes features such as: lockers, rest-rooms, waterslides, water spouting animals, misters and tipping buckets.
The location seems ideal because the water attraction is right next to the Kid’s Zoo and a gift shop that sells items such as towels, sunscreen and swimwear.
As noted, the zoo in Granby, Quebec includes a full-fledged waterpark as does Columbus Zoo, Ohio.
Overall:
• 173 of 218 institutions or 79% do not have water/splash pads
• 38 of 218 institutions or 17% do have water/splash pads
• 4 of the 38 facilities charge
Special Events SpaceLast year, MFA estimated that 57% of accredited zoos and aquariums actively provide and market some type of rental space available for certain hours throughout the day. This estimate has increased to 77% in 2011—a big jump and unlikely in a sin-gle year. While there are surely some new spaces, we suspect that existing spaces that must have been minimally market-ed—or not marketed at all—must have been pressed into bus iness as the
recession moved along.
These spaces include both indoor and outdoor venues. The outdoor venues include both non-tented/tented areas and pavilions. There is definitely a growing trend to provide exotic and unique venues for events such as weddings, corporate events, benefits, receptions and reunions.
The capacities of the indoor venues available for rental vary from as little as 15 people to as many as 5,000. The larger capacity venues of 1,000+ are mostly comprised of aquarium rentals either by level/floor or full facility rental. For example, the North Carolina Aquarium at Ft. Fisher can accommodate up to 2,000 people. On the other end of the spectrum at the Rosamond Gifford Zoo at Burnet Park in Syracuse, NY, you can rent the Lion Corridor and Primate Building with a capacity of 40.
Another place worth mentioning is ZooPlex, in Des Moines, IA at the Blank Park Zoo. The ZooPlex is a multi-purpose area with a capacity of 600 people for private events.
It can also be used for private meetings. What is inter-esting is that when not being used for private events,
Brookfield Zoo, Outdoor Covered Pavilion
Market & Feasibility Advisors, LLC One South Dearborn, Suite 2100, Chicago, IL 60603 (312) 212-4451 www.mfallc.com 23
Zoo & Aquarium Revenue Center & Animal Interaction Report – August 2012
the space can be used for special exhibits such as “The Ice Age Exhibit”.
Zoos and aquariums that do not have adequate in-door spaces should consider looking into what out-door spaces can be converted into after-hours venues for rental.
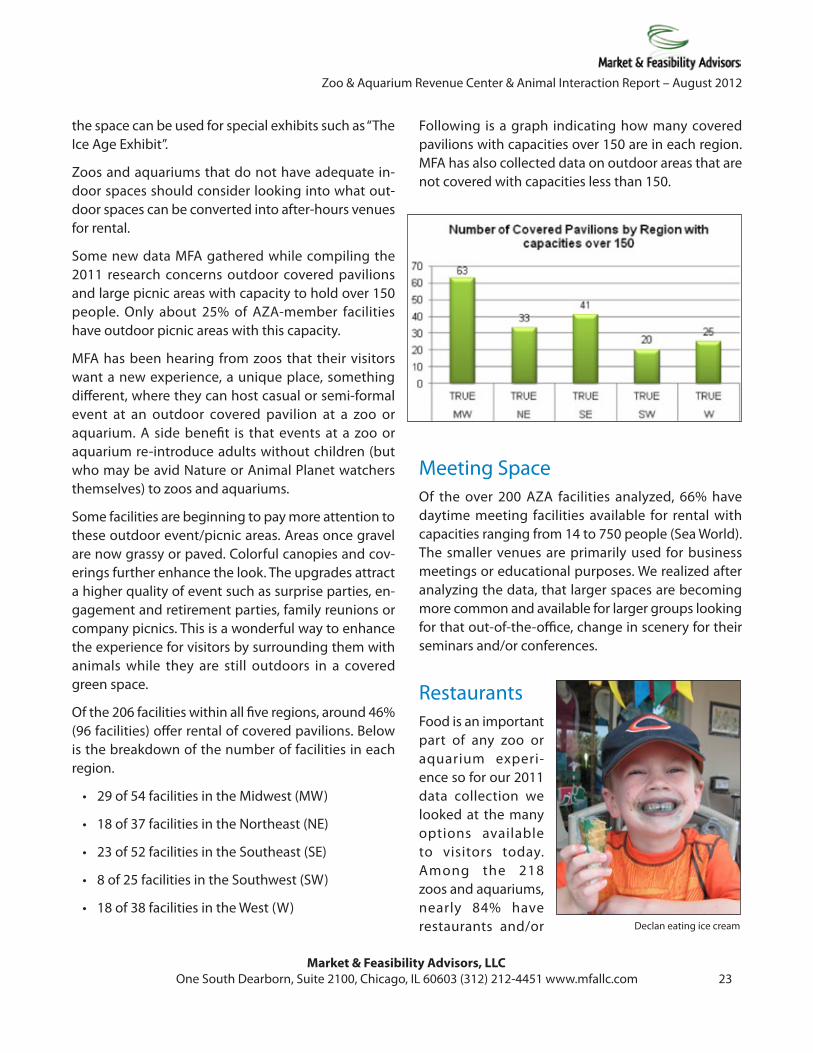
Some new data MFA gathered while compiling the 2011 research concerns outdoor covered pavilions and large picnic areas with capacity to hold over 150 people. Only about 25% of AZA-member facilities have outdoor picnic areas with this capacity.
MFA has been hearing from zoos that their visitors want a new experience, a unique place, something different, where they can host casual or semi-formal event at an outdoor covered pavilion at a zoo or aquarium. A side benefit is that events at a zoo or aquarium re-introduce adults without children (but who may be avid Nature or Animal Planet watchers themselves) to zoos and aquariums.
Some facilities are beginning to pay more attention to these outdoor event/picnic areas. Areas once gravel are now grassy or paved. Colorful canopies and cov-erings further enhance the look. The upgrades attract a higher quality of event such as surprise parties, en-gagement and retirement parties, family reunions or company picnics. This is a wonderful way to enhance the experience for visitors by surrounding them with animals while they are still outdoors in a covered green space.
Of the 206 facilities within all five regions, around 46% (96 facilities) offer rental of covered pavilions. Below is the breakdown of the number of facilities in each region.
• 29 of 54 facilities in the Midwest (MW)
• 18 of 37 facilities in the Northeast (NE)
• 23 of 52 facilities in the Southeast (SE)
• 8 of 25 facilities in the Southwest (SW)
• 18 of 38 facilities in the West (W)
Following is a graph indicating how many covered pavilions with capacities over 150 are in each region. MFA has also collected data on outdoor areas that are not covered with capacities less than 150.
Meeting SpaceOf the over 200 AZA facilities analyzed, 66% have daytime meeting facilities available for rental with capacities ranging from 14 to 750 people (Sea World). The smaller venues are primarily used for business meetings or educational purposes. We realized after analyzing the data, that larger spaces are becoming more common and available for larger groups looking for that out-of-the-office, change in scenery for their seminars and/or conferences.
RestaurantsFood is an important part of any zoo or aquarium experi-ence so for our 2011 data collection we looked at the many options available to visitors today. Among the 218 zoos and aquariums, nearly 84% have restaurants and/or Declan eating ice cream

Market & Feasibility Advisors, LLC
24 OneSouthDearborn,Suite2100,Chicago,IL60603•(312)212-4451•www.mfallc.com
Zoo & Aquarium Revenue Center & Animal Interaction Report – August 2012
cafeterias or snack bar type options. This is an increase from the 2010 data of 77%.
The only noticeable difference in the types of restau-rants is the increase in full-service wait style restau-rants. Between 2010 and 2011 this figure appears to have risen from 16 to 26, an increase of 62.5%. While that figure seems very high, these wait-style restau-rants comprise only 4% of the total amount of all restaurant options. We were also able to confirm that almost all of the wait style restaurants serve alcohol.
It appears that the idea of “date night” at your favorite zoo or aquarium might not be so far-fetched—espe-cially if you can enjoy a glass of wine or cold beer and sit among the beauty of the animals.
After dinner, if the zoo is open, diners can stroll through the zoo among the beautiful “night” lights looking at the nocturnal animals. This could be a po-tential revenue generating area with the often over-looked adult market looking for a night out. At the Houston Aquarium in Texas at the “Dive Lounge” you can enjoy a cocktail before or after dinner at the “Aquarium Restaurant”. It’s a great place for a date night with a beautiful view. Surprisingly only 38 of the approximately 218 institutions researched have eve-ning hours later than 6pm during the summer on the weekends. And, as reflected in the following chart; more than half close by 7pm.
We did notice a trend in adult-only events that are becoming increasingly popular such as “Zoo Brews” and “Zoo-tini”. But we noticed that these events are still ending by 7:30 pm, in most cases. Below is a chart with a breakdown of the restaurant types.
According to the data MFA collected, approximately 49% or 309 of all the restaurants are cafeteria style, and of these 65 are seasonally operated. Some of these cafeterias, like the food court at Cleveland Metroparks Zoo, offer multiple food options and sometimes numerous different food vendors such as Pizza Hut, McDonalds and Quiznos within one food court.
MFA also looked at “walk-up style” restaurants which we define as standing at the window and ordering your food but for the sake of our analysis these were walk-ups that offered meal choices such as burgers,
sandwiches or hot dogs, as opposed to just “snack” items like popcorn or ice cream. Approximately 71% of all walk-up style restaurants are seasonal and weather permitting.
Of the 170 total snack bars, approxi-mately 22 of them are portable. MFA did realize that numerous zoos have more than one cart and they often place the carts throughout the zoo at different times in different places based on consumer need.
CafeteriaSnack BarWaiterWalk Up
Restaurant Types
20%
49%
27%
4%
Market & Feasibility Advisors, LLC One South Dearborn, Suite 2100, Chicago, IL 60603 (312) 212-4451 www.mfallc.com 25
Zoo & Aquarium Revenue Center & Animal Interaction Report – August 2012
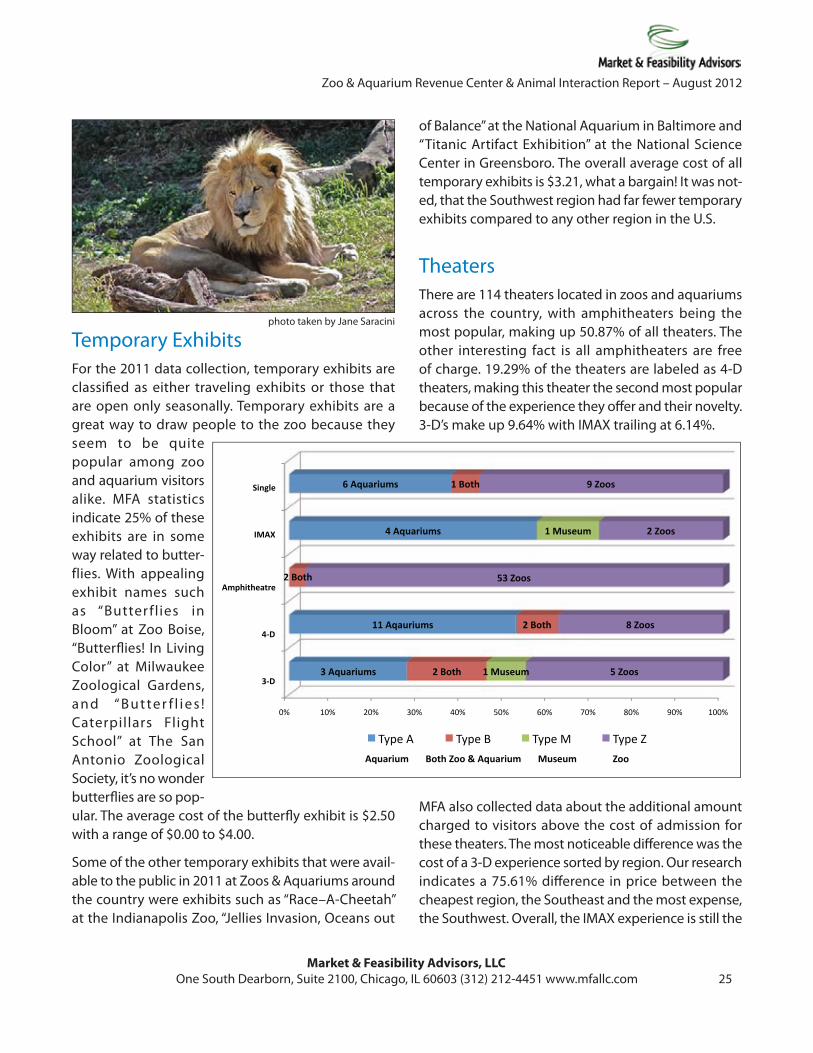
Temporary ExhibitsFor the 2011 data collection, temporary exhibits are classifi ed as either traveling exhibits or those that are open only seasonally. Temporary exhibits are a great way to draw people to the zoo because they seem to be quite popular among zoo and aquarium visitors alike. MFA statistics indicate 25% of these exhibits are in some way related to butter-flies. With appealing exhibit names such as “Butter fl ies in Bloom” at Zoo Boise, “Butterfl ies! In Living Color” at Milwaukee Zoological Gardens, a n d “ B u t te r f l i e s ! Caterpillars Flight School” at The San Antonio Zoological Society, it’s no wonder butterfl ies are so pop-ular. The average cost of the butterfl y exhibit is $2.50 with a range of $0.00 to $4.00.
Some of the other temporary exhibits that were avail-able to the public in 2011 at Zoos & Aquariums around the country were exhibits such as “Race–A-Cheetah” at the Indianapolis Zoo, “Jellies Invasion, Oceans out
of Balance” at the National Aquarium in Baltimore and “Titanic Artifact Exhibition” at the National Science Center in Greensboro. The overall average cost of all temporary exhibits is $3.21, what a bargain! It was not-ed, that the Southwest region had far fewer temporary exhibits compared to any other region in the U.S.
TheatersThere are 114 theaters located in zoos and aquariums across the country, with amphitheaters being the most popular, making up 50.87% of all theaters. The other interesting fact is all amphitheaters are free of charge. 19.29% of the theaters are labeled as 4-D theaters, making this theater the second most popular because of the experience they off er and their novelty. 3-D’s make up 9.64% with IMAX trailing at 6.14%.
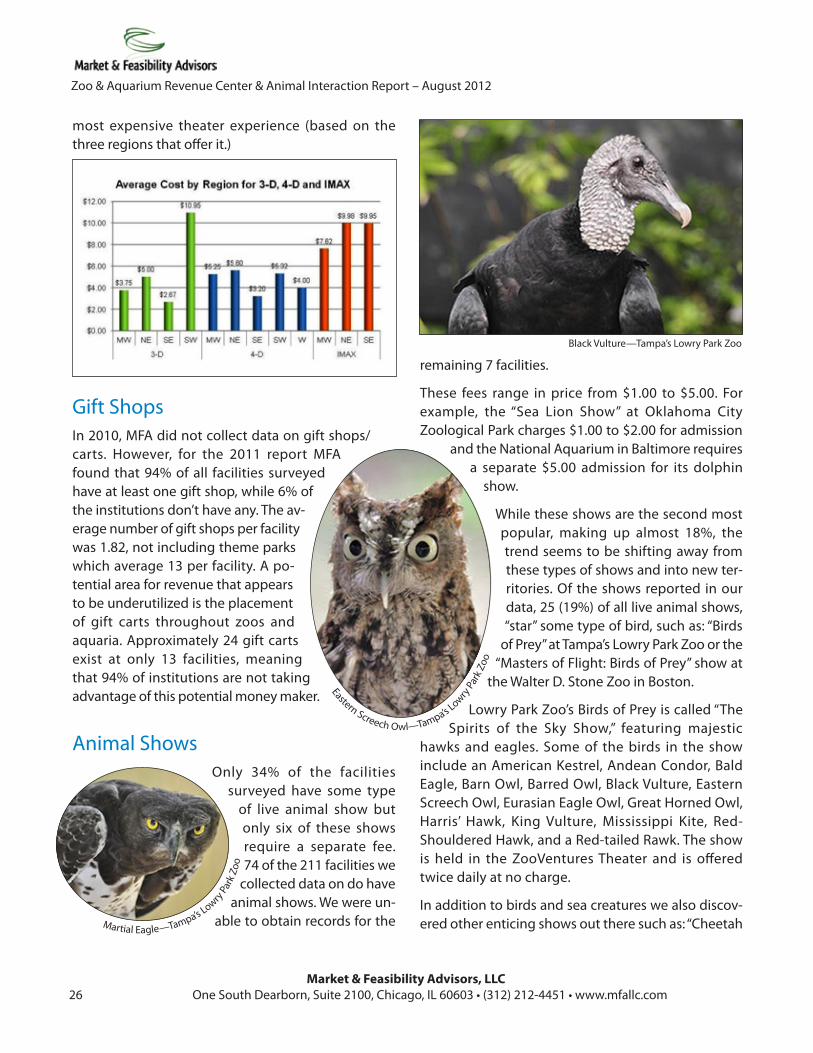
MFA also collected data about the additional amount charged to visitors above the cost of admission for these theaters. The most noticeable diff erence was the cost of a 3-D experience sorted by region. Our research indicates a 75.61% diff erence in price between the cheapest region, the Southeast and the most expense, the Southwest. Overall, the IMAX experience is still the
Count of Zoo Name TypeTheater Type A B M Z Grand Total3-D 3 2 1 5 114-D 11 2 8 21Amphitheatre 2 53 55IMAX 4 1 2 7Single 6 1 9 16Grand Total 24 7 2 77 110
0% 10% 20% 30% 40% 50% 60% 70% 80% 90% 100%
3-‐D
4-‐D
Amphitheatre
IMAX
Single
3 Aquariums
11 Aqauriums
4 Aquariums
6 Aquariums
2 Both
2 Both
2 Both
1 Both
1 Museum
1 Museum
5 Zoos
8 Zoos
53 Zoos
2 Zoos
9 Zoos
Aquarium Both Zoo & Aquarium Museum Zoo
Type A Type B Type M Type Z
photo taken by Jane Saracini
Market & Feasibility Advisors, LLC
26 OneSouthDearborn,Suite2100,Chicago,IL60603•(312)212-4451•www.mfallc.com
Zoo & Aquarium Revenue Center & Animal Interaction Report – August 2012
most expensive theater experience (based on the three regions that offer it.)
Gift ShopsIn 2010, MFA did not collect data on gift shops/carts. However, for the 2011 report MFA found that 94% of all facilities surveyed have at least one gift shop, while 6% of the institutions don’t have any. The av-erage number of gift shops per facility was 1.82, not including theme parks which average 13 per facility. A po-tential area for revenue that appears to be underutilized is the placement of gift carts throughout zoos and aquaria. Approximately 24 gift carts exist at only 13 facilities, meaning that 94% of institutions are not taking advantage of this potential money maker.
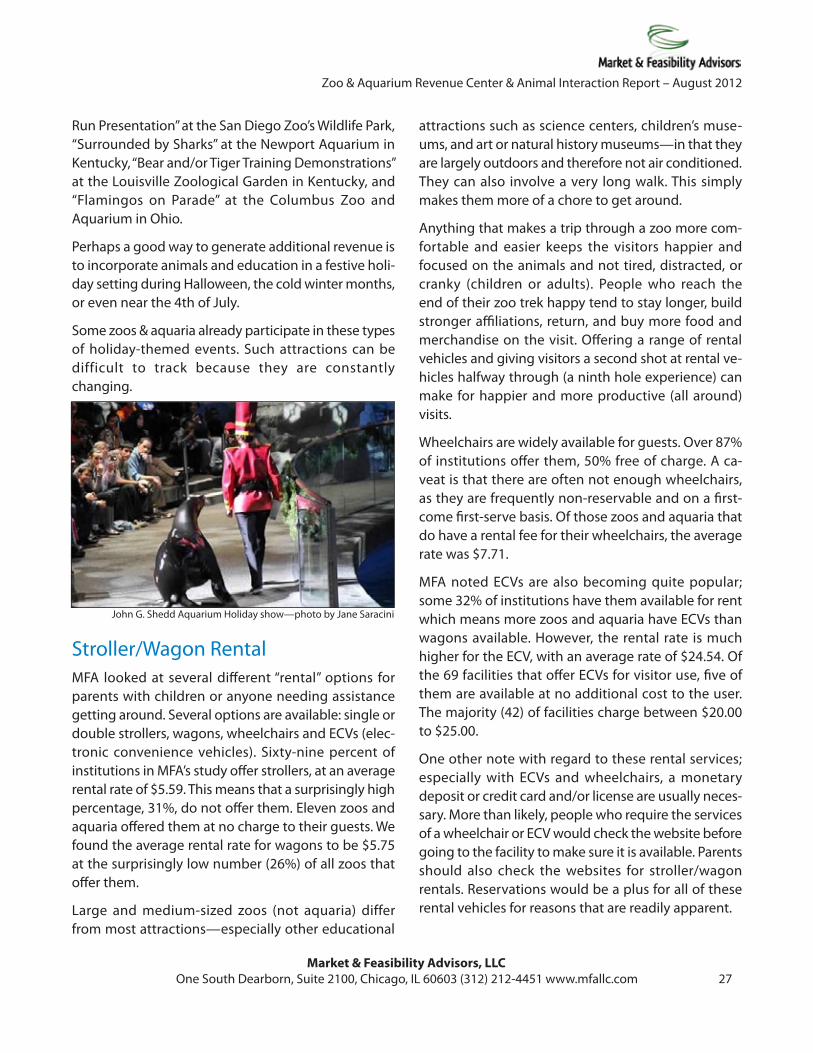
Animal ShowsOnly 34% of the facilities
surveyed have some type of live animal show but only six of these shows require a separate fee. 74 of the 211 facilities we
collected data on do have animal shows. We were un-
able to obtain records for the
remaining 7 facilities.
These fees range in price from $1.00 to $5.00. For example, the “Sea Lion Show” at Oklahoma City Zoological Park charges $1.00 to $2.00 for admission
and the National Aquarium in Baltimore requires a separate $5.00 admission for its dolphin
show.
While these shows are the second most popular, making up almost 18%, the trend seems to be shifting away from these types of shows and into new ter-ritories. Of the shows reported in our data, 25 (19%) of all live animal shows, “star” some type of bird, such as: “Birds
of Prey” at Tampa’s Lowry Park Zoo or the “Masters of Flight: Birds of Prey” show at
the Walter D. Stone Zoo in Boston.
Lowry Park Zoo’s Birds of Prey is called “The Spirits of the Sky Show,” featuring majestic
hawks and eagles. Some of the birds in the show include an American Kestrel, Andean Condor, Bald Eagle, Barn Owl, Barred Owl, Black Vulture, Eastern Screech Owl, Eurasian Eagle Owl, Great Horned Owl, Harris’ Hawk, King Vulture, Mississippi Kite, Red-Shouldered Hawk, and a Red-tailed Rawk. The show is held in the ZooVentures Theater and is offered twice daily at no charge.
In addition to birds and sea creatures we also discov-ered other enticing shows out there such as: “Cheetah Martial Eagle—Tampa’s Lowry
Park
Zoo
Eastern Screech Owl—Tampa’s Lowry
Park
Zoo
Black Vulture—Tampa’s Lowry Park Zoo
Market & Feasibility Advisors, LLC One South Dearborn, Suite 2100, Chicago, IL 60603 (312) 212-4451 www.mfallc.com 27
Zoo & Aquarium Revenue Center & Animal Interaction Report – August 2012
Run Presentation” at the San Diego Zoo’s Wildlife Park, “Surrounded by Sharks” at the Newport Aquarium in Kentucky, “Bear and/or Tiger Training Demonstrations” at the Louisville Zoological Garden in Kentucky, and “Flamingos on Parade” at the Columbus Zoo and Aquarium in Ohio.
Perhaps a good way to generate additional revenue is to incorporate animals and education in a festive holi-day setting during Halloween, the cold winter months, or even near the 4th of July.
Some zoos & aquaria already participate in these types of holiday-themed events. Such attractions can be difficult to track because they are constantly changing.
Stroller/Wagon RentalMFA looked at several different “rental” options for parents with children or anyone needing assistance getting around. Several options are available: single or double strollers, wagons, wheelchairs and ECVs (elec-tronic convenience vehicles). Sixty-nine percent of institutions in MFA’s study offer strollers, at an average rental rate of $5.59. This means that a surprisingly high percentage, 31%, do not offer them. Eleven zoos and aquaria offered them at no charge to their guests. We found the average rental rate for wagons to be $5.75 at the surprisingly low number (26%) of all zoos that offer them.
Large and medium-sized zoos (not aquaria) differ from most attractions—especially other educational
attractions such as science centers, children’s muse-ums, and art or natural history museums—in that they are largely outdoors and therefore not air conditioned. They can also involve a very long walk. This simply makes them more of a chore to get around.
Anything that makes a trip through a zoo more com-fortable and easier keeps the visitors happier and focused on the animals and not tired, distracted, or cranky (children or adults). People who reach the end of their zoo trek happy tend to stay longer, build stronger affiliations, return, and buy more food and merchandise on the visit. Offering a range of rental vehicles and giving visitors a second shot at rental ve-hicles halfway through (a ninth hole experience) can make for happier and more productive (all around) visits.
Wheelchairs are widely available for guests. Over 87% of institutions offer them, 50% free of charge. A ca-veat is that there are often not enough wheelchairs, as they are frequently non-reservable and on a first-come first-serve basis. Of those zoos and aquaria that do have a rental fee for their wheelchairs, the average rate was $7.71.
MFA noted ECVs are also becoming quite popular; some 32% of institutions have them available for rent which means more zoos and aquaria have ECVs than wagons available. However, the rental rate is much higher for the ECV, with an average rate of $24.54. Of the 69 facilities that offer ECVs for visitor use, five of them are available at no additional cost to the user. The majority (42) of facilities charge between $20.00 to $25.00.
One other note with regard to these rental services; especially with ECVs and wheelchairs, a monetary deposit or credit card and/or license are usually neces-sary. More than likely, people who require the services of a wheelchair or ECV would check the website before going to the facility to make sure it is available. Parents should also check the websites for stroller/wagon rentals. Reservations would be a plus for all of these rental vehicles for reasons that are readily apparent.
John G. Shedd Aquarium Holiday show—photo by Jane Saracini
Market & Feasibility Advisors, LLC
28 OneSouthDearborn,Suite2100,Chicago,IL60603•(312)212-4451•www.mfallc.com
Zoo & Aquarium Revenue Center & Animal Interaction Report – August 2012
Albuquerque Biological Park www.cabq.gov/biopark
Audubon Zoo www.auduboninstitute.org
Bramble Park Zoo www.brambleparkzoo.com
Brevard Zoo www.brevardzoo.org
Caldwell Zoo www.caldwellzoo.org
Chicago Zoological Society www.csz.org
Georgia Aquarium www.georgiaaquarium.org
Monterey Bay Aquarium www.montereybayaquarium.org
Potter Park Zoological Gardens www.potterparkzoo.org
Salisbury Zoological Park www.salisburyzoo.org
Virginia Aquarium and Marine Science Center www.virginiaaquarium.com
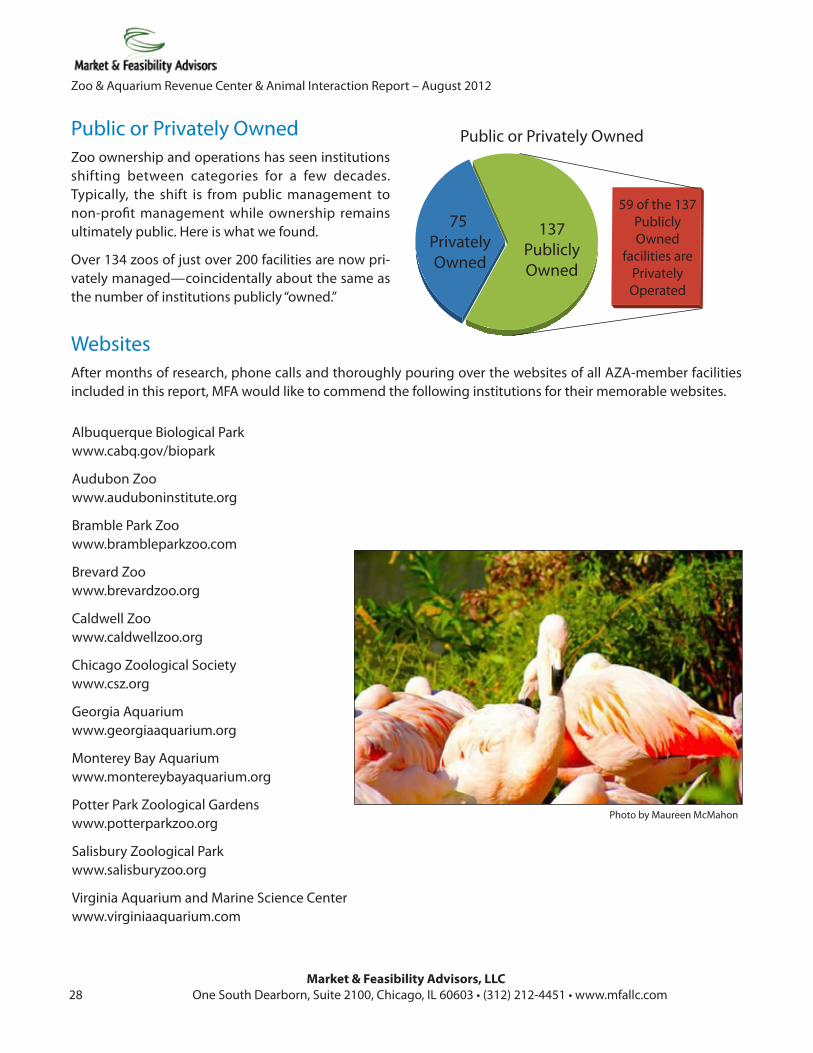
Public or Privately OwnedZoo ownership and operations has seen institutions shifting between categories for a few decades. Typically, the shift is from public management to non-profit management while ownership remains ultimately public. Here is what we found.
Over 134 zoos of just over 200 facilities are now pri-vately managed—coincidentally about the same as the number of institutions publicly “owned.”
WebsitesAfter months of research, phone calls and thoroughly pouring over the websites of all AZA-member facilities included in this report, MFA would like to commend the following institutions for their memorable websites.
75 PrivatelyOwned
Public or Privately Owned
137PubliclyOwned
59 of the 137 Publicly Owned
facilities are Privately Operated
Photo by Maureen McMahon


www.mfallc.com


