
Zain Group Financial Results
Q2 2016

Disclaimer
Mobile Telecommunications Company KSCP “Zain Group” has prepared this presentation to the best of its
abilities, however, no warranty or representation, express or implied is made as to the adequacy, correctness,
completeness or accuracy of any numbers, statements, opinions, estimates, or other information contained in
this presentation.
Certain portions of this document contain “forward-looking statements”, which are based on current expectations
and reasonable assumptions, we can however give no assurance they will be achieved.
The information contained in this presentation is subject to change and we disclaim any obligation to update you
of any such changes, particularly those pertaining to the forward-looking statements.
Furthermore, it should be noted that there are a myriad potential risks, uncertainties and unforeseen factors that
could cause the actual results to differ materially from the forward-looking statements made herein.
Accordingly, this presentation does not constitute an offering of securities or otherwise constitute an invitation or
inducement to any person to underwrite, subscribe for, or otherwise acquire or dispose of, securities in any
company within Zain Group.
For further information about Zain Group, or the materials contained within this presentation, please direct your
enquiries to our Investor Relations team via email at [email protected]
2

Zain Group Overview
Zain Operations Overview
Financial Statements
Contents
3

Zain AT A GLANCE
As Of 30 JUNE, 2016
ZAIN GROUP
OVERVIEW
ZAIN
OPERATIONS
OVERVIEW
FINANCIAL
STATEMENTS
45.2Million active customers
11.2Million customersIn Iraq
4GLong termevolution (LTE)network in Kuwait,Saudi Arabia,Jordan, Bahrain, Lebanon & Sudan
Over
6,700Employees $846
Million in EBITDA
138Million people under license 12.5
Million customers in Republic of Sudan
141Million + total daily calls
3,172TB of daily data usage
$272Million in net income
42.5Million + daily total sms
5.2Million km2
under license
$1.8Billion in revenues
MarketLeaderIn Kuwait, Iraq, Republic of Sudan, Jordan and Lebanon
4
THE WORLD OF ZAIN
As Of 30 JUNE, 2016
ZAIN GROUP
OVERVIEW
ZAIN
OPERATIONS
OVERVIEW
FINANCIAL
STATEMENTS
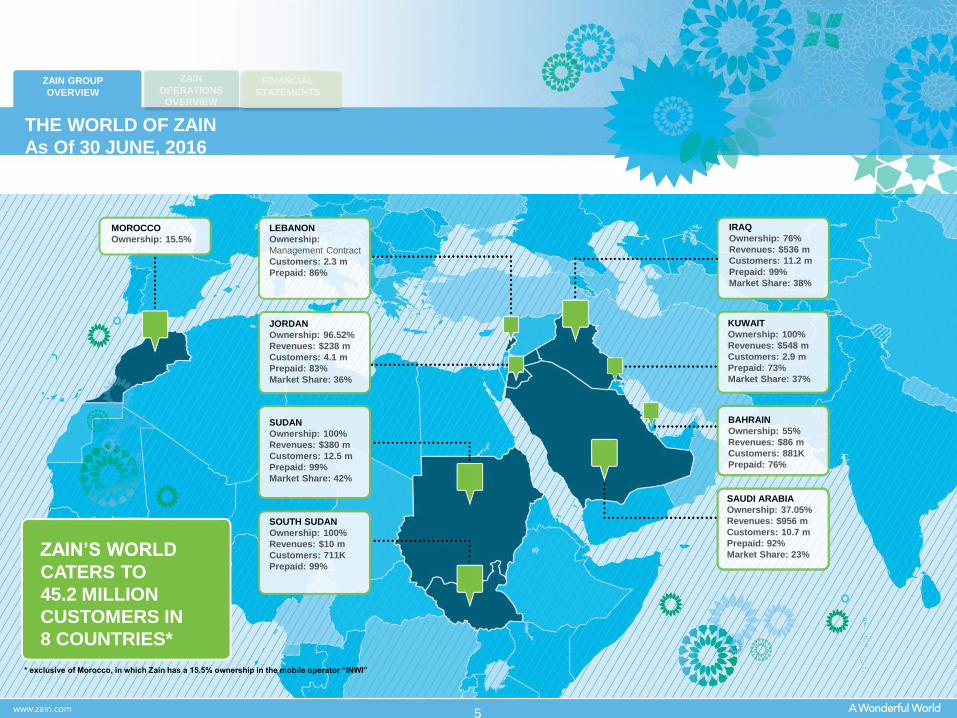
JORDAN
Ownership: 96.52%
Revenues: $238 m
Customers: 4.1 m
Prepaid: 83%
Market Share: 36%
SUDAN
Ownership: 100%
Revenues: $380 m
Customers: 12.5 m
Prepaid: 99%
Market Share: 42%
SOUTH SUDAN
Ownership: 100%
Revenues: $10 m
Customers: 711K
Prepaid: 99%
SAUDI ARABIA
Ownership: 37.05%
Revenues: $956 m
Customers: 10.7 m
Prepaid: 92%
Market Share: 23%
BAHRAIN
Ownership: 55%
Revenues: $86 m
Customers: 881K
Prepaid: 76%
KUWAIT
Ownership: 100%
Revenues: $548 m
Customers: 2.9 m
Prepaid: 73%
Market Share: 37%
IRAQ
Ownership: 76%
Revenues: $536 m
Customers: 11.2 m
Prepaid: 99%
Market Share: 38%
LEBANON
Ownership:
Management Contract
Customers: 2.3 m
Prepaid: 86%
ZAIN’S WORLD
CATERS TO
45.2 MILLION
CUSTOMERS IN
8 COUNTRIES*
* exclusive of Morocco, in which Zain has a 15.5% ownership in the mobile operator “INWI”
MOROCCO
Ownership: 15.5%
5
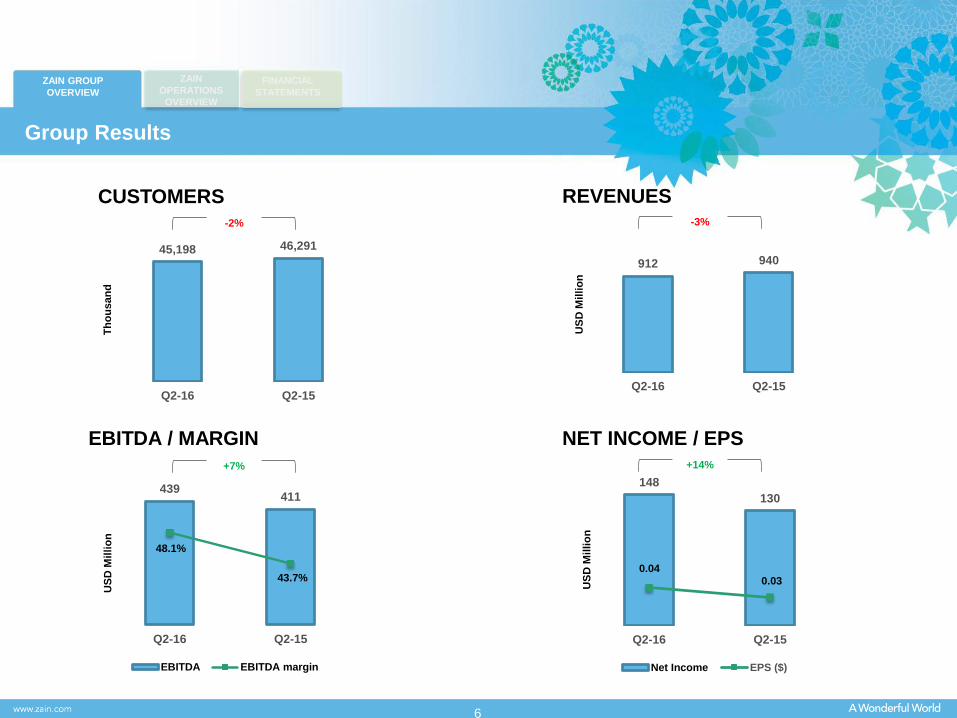
912 940
Q2-16 Q2-15
US
D M
illi
on
Group Results
ZAIN GROUP
OVERVIEW
ZAIN
OPERATIONS
OVERVIEW
FINANCIAL
STATEMENTS
45,198 46,291
Q2-16 Q2-15
Th
ou
san
d
148
130
0.040.03
Q2-16 Q2-15
US
D M
illi
on
Net Income EPS ($)
CUSTOMERS REVENUES
EBITDA / MARGIN NET INCOME / EPS
439411
48.1%
43.7%
Q2-16 Q2-15
US
D M
illi
on
EBITDA EBITDA margin
6
-3%-2%
+14%+7%

1,831 1,882
H1-16 H1-15
US
D M
illi
on
Group Results
ZAIN GROUP
OVERVIEW
ZAIN
OPERATIONS
OVERVIEW
FINANCIAL
STATEMENTS
45,198 46,291
H1-16 H1-15
Th
ou
san
d
272 269
0.07 0.07
H1-16 H1-15
US
D M
illi
on
Net Income EPS ($)
CUSTOMERS REVENUES
EBITDA / MARGIN NET INCOME / EPS
846806
46.2%
42.8%
H1-16 H1-15
US
D M
illi
on
EBITDA EBITDA margin
7
-3%-2%
+1%+5%

CAPEX & CAPEX / Revenues
ZAIN GROUP
OVERVIEW
ZAIN
OPERATIONS
OVERVIEW
FINANCIAL
STATEMENTS
662
797
730
15%
21%
17%
2016 F 2015 2014
US
D M
illi
on
Capex Capex / Revenues
8
+9%-17%
F = Forecasted

Total CAPEX
ZAIN GROUP
OVERVIEW
ZAIN
OPERATIONS
OVERVIEW
FINANCIAL
STATEMENTS
South Sudan1%
Republic of Sudan36%
Jordan9%Kuwait
7%
Iraq28%
Bahrain8%
Others11%
OpcoH1-2016
USD Million
% of
Revenues
Kuwait 11 2%
Iraq 47 9%
Sudan 61 16%
KSA 407 43%
Jordan 16 7%
Bahrain 13 14%
S. Sudan 2 21%
Others 17 N/A
9
Group Total Capex (excluding KSA) = USD 167 million

Total Debt
ZAIN GROUP
OVERVIEW
ZAIN
OPERATIONS
OVERVIEW
FINANCIAL
STATEMENTS
2,604
2,128
729
1,051
H1-16 H1-15
Long Term Short Term
2,2992,203
1.36 1.33
H1-16 H1-15
US
D M
illi
on
Net debt Net debt/EBITDA
US
D M
illi
on
• Net Debt = Total interest bearing debt (excluding letters
of guarantee) after deducting cash and cash equivalents
3,1793,333
10
Net Debt & Net Debt / EBITDA
+5% +4%

Zain Dividends
ZAIN GROUP
OVERVIEW
ZAIN
OPERATIONS
OVERVIEW
FINANCIAL
STATEMENTS
DIVIDEND PAYOUT RATIO DIVIDEND YIELD (%)
76%
80%
89%
77%
86%
2015 2014 2013 2012 2011
8% 8% 8%
7%8%
2015 2014 2013 2012 2011
DIVIDEND PER SHARE (KD) CASH DIVIDEND (USD M)
0.030
0.040
0.050 0.050
0.065
2015 2014 2013 2012 2011
388
533
690 685
908
2015 2014 2013 2012 2011
11

EBITDA Margins
ZAIN GROUP
OVERVIEW
ZAIN
OPERATIONS
OVERVIEW
FINANCIAL
STATEMENTS
48.3% 48.2%
42.7%
37.8%36.2%
22.8%
-27%
Jordan Kuwait Republic of Sudan Bahrain Iraq KSA South Sudan
Group EBITDA margin 46.2%
12
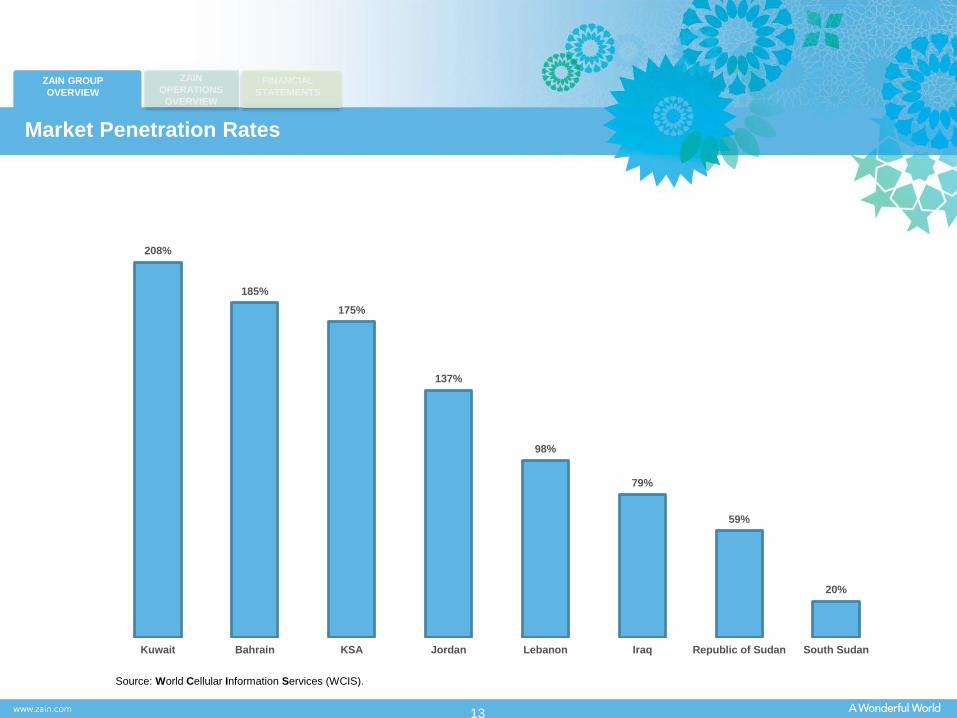
Market Penetration Rates
ZAIN GROUP
OVERVIEW
ZAIN
OPERATIONS
OVERVIEW
FINANCIAL
STATEMENTS
208%
185%
175%
137%
98%
79%
59%
20%
Kuwait Bahrain KSA Jordan Lebanon Iraq Republic of Sudan South Sudan
Source: World Cellular Information Services (WCIS).
13

South Sudan2%
Republic of Sudan27%
Jordan9%
Kuwait6%Iraq
25%
Bahrain2%
KSA24%
Lebanon5%
-12%
-6%
-1%
-1%
3%
4%
7%
10%
Iraq
KSA
Kuwait
South Sudan
Jordan
Lebanon
Republic of Sudan
Bahrain
Customer Contribution
ZAIN GROUP
OVERVIEW
ZAIN
OPERATIONS
OVERVIEW
FINANCIAL
STATEMENTS
Group -2%
14
Customer Growth

Blended ARPU
ZAIN GROUP
OVERVIEW
ZAIN
OPERATIONS
OVERVIEW
FINANCIAL
STATEMENTS
South Sudan1%Republic of Sudan
21%
Jordan13%
Kuwait30%
Bahrain5%
Iraq30%
$28
$16
$14
$9
$8
$5
$2
Kuwait Bahrain KSA Jordan Iraq Republicof Sudan
SouthSudan
15
Revenue Contribution

3.7 mPopulation
208%Penetration
2.9 mCustomers
$28ARPU
$71,000GDP/Capita
1983Year of launch
100%Ownership
ZAIN KUWAIT
ZAIN GROUP
OVERVIEW
ZAIN
OPERATIONS
OVERVIEW
FINANCIAL
STATEMENTS
548 544
264 269
144166
H1-16 H1-15
US
D M
illi
on
Revenues EBITDA Net Income
• The Group’s flagship operation was established in 1983 and made history in 1994 by becoming the first telecom
operator to launch commercial GSM service in the region. Zain has been listed on the Kuwait Stock Exchange
since 1985 with a market capitalization circa USD 5 billion closing at 335 Fils as of 30th June, 2016.
• Zain Kuwait maintained its market with 37% market share, serving 2.9 million customers. For the first half of 2016,
Zain Kuwait revenues increased by 2% to KD 165 million (USD 548 million). EBITDA for the period was stable at
KD 80 million (USD 264 million) while net income decreased by 12% mainly due to higher depreciation and
amortization. The operator reported a healthy EBITDA margin of 48%.
• Notably, data revenues (excluding SMS & VAS) formed 35% of total revenues. Zain’s nationwide 4G LTE network
covered the entire population of Kuwait through a total of 2,071 network sites.
16
MARKET SHARE
$
Technology : 2G, 3G, 4G - Number of Sites : 2,071 - Coverage : 100%
Zain37%
Ooredoo31%
Viva32%
FINANCIALS
270 268
132 132
72 77
Q2-16 Q2-15
US
D M
illi
on

• Zain has been providing mobile services in Iraq since December 2003 and is the largest mobile operator in the
country today. After securing a 15-year license in August 2007, Zain Group owns 76% of the mobile entity. At the
end of June, 2016 Zain Iraq share price closed at IQD 2.7, with a market capitalization circa USD 4 billion.
• The performance of Zain Iraq over the last six months was severely hampered by the escalation of political and
social instability specially in North and Anbar regions, the 20% VAT which affected the customer spending.
These exceptional circumstances coupled with intense competition, adversely affected the operation’s financial
performance, as its revenues for the first six months reached USD 536 million, with EBITDA reaching USD 194
million, and net income amounting to USD 24 million.
• Data revenues (excluding SMS & VAS) represented 8% of total revenues, which grew by 5% as compared with
the same period last year.
ZAIN IRAQ
ZAIN GROUP
OVERVIEW
ZAIN
OPERATIONS
OVERVIEW
FINANCIAL
STATEMENTS
36.8 mPopulation
79%Penetration
11.2 mCustomers
$8ARPU
$14,100GDP/Capita
2003Year of acquisition
76%Ownership
17
$
MARKET SHARE FINANCIALS
536
604
194221
2460
H1-16 H1-15
US
D M
illi
on
Revenues EBITDA Net Income
Zain38%
Korek25%Asia
Cell37%
Technology : 2G, 3G - Number of sites : 4,228 - Coverage : 98% - License : expires in 2022
266
300
99112
22 26
Q2-16 Q2-15
US
D M
illi
on

• In February 2006, Zain acquired the remaining 61% stake of Mobitel, Republic of Sudan’s first mobile operator, ina deal valued at USD 1.3 billion, resulting in 100% ownership. The company rebranded to Zain in September 2007and subsequently renewed its license for a period of 20 years.
• For the first six months of 2016, in local currency (SDG) terms, the operator’s revenues grew by 9% Y-o-Y to reachSDG 2.4 billion (USD 380 million, up 7% in USD terms), due to higher data revenues. EBITDA increased by 19%to reach SDG 1.04 billion (USD 162 million, up 17% in USD terms), while net income decreased by 2% to SDG480 million mainly coming from increase in depreciation, FX loss and change in tax rates from 2.5% to 5%,effective from 1st January 2016.
• Zain Sudan has attracted additional 838K new customers, up 7% Y-o-Y, to now serve around 12.5 millioncustomers, through a total number of 2,432 network sites, with 90% population coverage.
• Data revenues (excluding SMS and VAS) formed only 12% of total revenues, with a remarkable growth of 47% Y-o-Y (44% in USD terms).
ZAIN SUDAN
ZAIN GROUP
OVERVIEW
ZAIN
OPERATIONS
OVERVIEW
FINANCIAL
STATEMENTS
40.6 mPopulation
59%Penetration
12.5 mCustomers
$5ARPU
$4,500GDP/Capita
2006Year of full
acquisition
100%Ownership
18
$
MARKET SHARE FINANCIALS
Zain42%
Sudani29%
MTN29%
Technology : 2G, 3G, 4G - Number of sites : 2,432 - Coverage : 90% - License : expires in 2029
1,242
1,130
558
448
285220
Q2-16 Q2-15
SD
G M
illi
on
193179
8771
4435
Q2-16 Q2-15U
SD
Mil
lio
n
2,4452,238
1,045878
480 491
H1-16 H1-15
SD
G M
illi
on
380355
162139
75 78
H1-16 H1-15
US
D M
illi
on

• Zain launched commercial operations in the Kingdom in August 2008. Zain Group holds a 37% equity stake, a Saudi
consortium owns 21%, and the remaining 42% are free float. Zain KSA is listed on the Saudi Stock Exchange (MTC KSA, 7030)
with a market capitalization circa USD 1.2 billion (share price of SAR 7.9) on June 30th, 2016.
• The operation served 10.7 million customers as of June 2016. Revenues grew 5% Y-o-Y to reach USD 956 million while
EBITDA grew 4% to reach USD 218 million and net losses amounted to USD 154 million for the period. Zain Saudi Arabia’s
EBITDA margin reached 23%..
• The operator witnessed a noticeable 57% rise in data revenues (excluding SMS & VAS) Y-o-Y which represents 31% of total
revenues as the company expands its state-of-the-art 4G LTE network that currently covers 94% of the population.
ZAIN KSA
ZAIN GROUP
OVERVIEW
ZAIN
OPERATIONS
OVERVIEW
FINANCIAL
STATEMENTS
30.4 mPopulation
175%Penetration
10.7 mCustomers
$14ARPU
$52,800GDP/Capita
2008Year of acquisition
37%Ownership
19
$
MARKET SHARE FINANCIALS
956 913
218 209
(154) (122)
H1-16 H1-15
US
D M
illi
on
Revenues EBITDA Net Income
Technology : 2G, 3G, 4G - Number of sites : 7,776 - Coverage : 94% - License : expires in 2033
Zain22%
Mobily30%
STC48%
473 454
99 116
(88)(54)
Q1-16 Q1-15
US
D M
illi
on
Revenues EBITDA Net Income

• In 1994, Zain Jordan, formerly Fastlink, revolutionized the telecom sector in the Kingdom by being the first to introducemobile services in the country. In 2003, it was the first to join what is now Zain Group’s Middle East portfolio, it wasacquired for USD 419 million and today remains the market leader.
• Zain Jordan delivered a solid performance for the first six months of 2016, where revenues increased by 7% to reachUSD 238 million, due to higher data revenues. EBITDA jumped by an impressive 18% to reach USD 115 million with animpressive EBITDA margin of 48.3%. Net income increased by 10% to reach USD 50 million, due to the positive topline performance.
• Data revenues (excluding SMS & VAS) represented 32% of total revenues, which grew by 25% as compared with thesame period last year. The operator covers the entire population through its 2,239 network sites.
ZAIN JORDAN
ZAIN GROUP
OVERVIEW
ZAIN
OPERATIONS
OVERVIEW
FINANCIAL
STATEMENTS
7.8 mPopulation
137%Penetration
4.1 mCustomers
$9ARPU
$11,900GDP/Capita
2003Year of acquisition
96.52%Ownership
20
$
MARKET SHARE FINANCIALS
Zain36%
Orange33%
Umniah31%
Technology : 2G, 3G, 4G - Number of sites : 2,239 - Coverage : 100% - License : expires in 2031238
223
11597
50 45
H1-16 H1-15
US
D M
illi
on
Revenues EBITDA Net Income
121113
5951
26 23
Q2-16 Q2-15
US
D M
illi
on
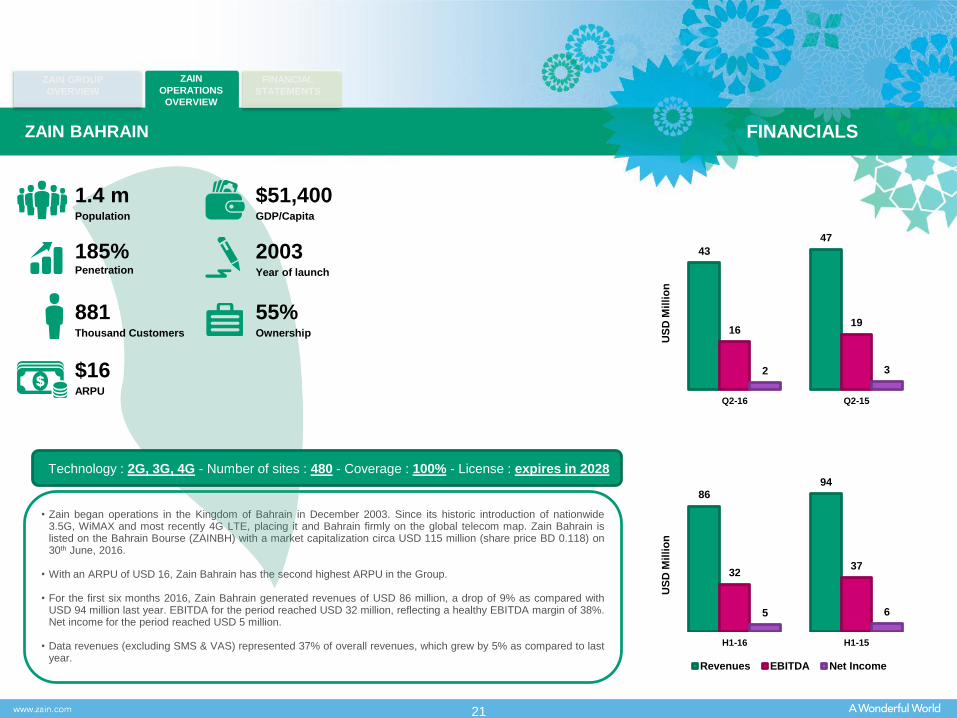
• Zain began operations in the Kingdom of Bahrain in December 2003. Since its historic introduction of nationwide3.5G, WiMAX and most recently 4G LTE, placing it and Bahrain firmly on the global telecom map. Zain Bahrain islisted on the Bahrain Bourse (ZAINBH) with a market capitalization circa USD 115 million (share price BD 0.118) on30th June, 2016.
• With an ARPU of USD 16, Zain Bahrain has the second highest ARPU in the Group.
• For the first six months 2016, Zain Bahrain generated revenues of USD 86 million, a drop of 9% as compared withUSD 94 million last year. EBITDA for the period reached USD 32 million, reflecting a healthy EBITDA margin of 38%.Net income for the period reached USD 5 million.
• Data revenues (excluding SMS & VAS) represented 37% of overall revenues, which grew by 5% as compared to lastyear.
ZAIN BAHRAIN
ZAIN GROUP
OVERVIEW
ZAIN
OPERATIONS
OVERVIEW
FINANCIAL
STATEMENTS
1.4 mPopulation
185%Penetration
881Thousand Customers
$16ARPU
$51,400GDP/Capita
2003Year of launch
55%Ownership
21
$
FINANCIALS
8694
3237
5 6
H1-16 H1-15
US
D M
illi
on
Revenues EBITDA Net Income
Technology : 2G, 3G, 4G - Number of sites : 480 - Coverage : 100% - License : expires in 2028
43
47
1619
2 3
Q2-16 Q2-15
US
D M
illi
on

• Political unrest in South Sudan affected the results as the country also witnessed significant displacement of its
people, with access to and repair of many network sites in parts of the country proving to be difficult, causing
frequent interruptions and higher maintenance costs.
• The operation serves 711 thousand customer through a total of 288 network sites.
• Data revenues (excluding SMS & VAS) continue to grow significantly by 129% in local currency terms, representing
14% of the total revenues for the period.
ZAIN SOUTH SUDAN
ZAIN GROUP
OVERVIEW
ZAIN
OPERATIONS
OVERVIEW
FINANCIAL
STATEMENTS
12.9 mPopulation
20%Penetration
711Thousand
Customers
$2ARPU
$2,000GDP/Capita
2006Year of full
acquisition
100%Ownership
22
$
FINANCIALS
1038
(3)
1
(396)
(41)
H1-16 H1-15
US
D M
illi
on
Revenues EBITDA Net Income
Technology : 2G, 3G - Number of sites : 288 - Coverage : 50% - License : MOU
5
19
(1)
1
(112)
(17)
Q2-16 Q2-15
US
D M
illi
on
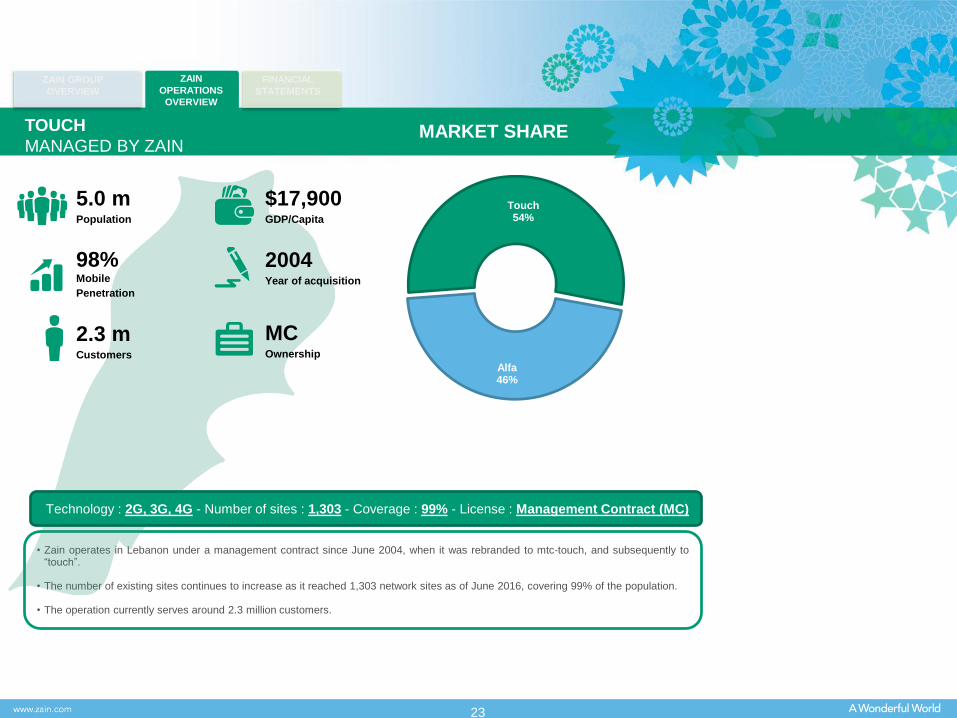
• Zain operates in Lebanon under a management contract since June 2004, when it was rebranded to mtc-touch, and subsequently to“touch”.
• The number of existing sites continues to increase as it reached 1,303 network sites as of June 2016, covering 99% of the population.
• The operation currently serves around 2.3 million customers.
TOUCH
MANAGED BY ZAIN
ZAIN GROUP
OVERVIEW
ZAIN
OPERATIONS
OVERVIEW
FINANCIAL
STATEMENTS
5.0 mPopulation
98%Mobile
Penetration
2.3 mCustomers
$17,900GDP/Capita
2004Year of acquisition
MCOwnership
23
MARKET SHARE
Technology : 2G, 3G, 4G - Number of sites : 1,303 - Coverage : 99% - License : Management Contract (MC)
Touch54%
Alfa46%

BALANCE SHEET
ZAIN GROUP
OVERVIEW
ZAIN
OPERATIONS
OVERVIEW
FINANCIAL
STATEMENTS
24
Unaudited Audited Unaudited
30-Jun-16 31-Dec-15 30-Jun-15
Assets KD ‘000
Current assets
Cash and bank balances 311,739 359,799 294,669
Trade and other receivables 437,672 406,581 386,002
Inventories 15,317 27,593 30,764
Investment securities at fair value through profit or
loss992 1,164 1,453
765,720 795,137 712,888
Non-current assets
Investment securities available for sale 24,590 26,598 30,809
Investments in associates and joint ventures 199,932 219,902 232,978
Due from associates 363,256 350,673 338,041
Other assets 15,485 15,880 23,379
Property and equipment 887,922 901,679 909,747
Intangible assets and goodwill 1,152,711 1,185,312 1,200,533
2,643,896 2,700,044 2,735,487
Total Assets 3,409,616 3,495,181 3,448,375
Unaudited Audited Unaudited
30-Jun-16 31-Dec-15 30-Jun-15
Liabilities and Equity KD ‘000
Current liabilities
Trade and other payables 718,480 761,758 695,653
Due to banks 219,738 213,310 317,568
938,218 975,068 1,013,221
Non-current liabilities
Due to banks 785,146 751,569 643,218
Other non-current liabilities 38,572 40,454 40,922
823,718 792,023 684,140
Equity
Attributable to the Company’s shareholders
Share capital 432,706 432,706 432,706
Share premium 1,707,164 1,707,164 1,707,164
Treasury shares (567,834) (567,834) (567,834)
Legal reserve 216,353 216,353 216,353
Foreign currency translation reserve (773,181) (756,643) (651,588)
Treasury shares reserve 1,967 1,967 1,967
Investment fair valuation reserve 994 (1,446) (1,080)
Hedge reserve (525) (216) (2,454)
Retained earnings 473,994 510,641 437,210
1,491,638 1,542,692 1,572,444
Non-controlling interests 156,042 185,398 178,570
Total equity 1,647,680 1,728,090 1,751,014
Total Liabilities and Equity 3,409,616 3,495,181 3,448,375

INCOME STATEMENT
ZAIN GROUP
OVERVIEW
ZAIN
OPERATIONS
OVERVIEW
FINANCIAL
STATEMENTS
25
Six months ended
30-Jun
2016 2015
Earnings per share
Basic – Fils 21 21
Six months ended
30-Jun
2016 2015
KD’000
Revenue 551,884 562,351
Cost of sales (133,644) (133,336)
Gross profit 418,240 429,015
Operating and administrative expenses (162,048) (185,725)
Depreciation and amortization (109,990) (104,941)
Provision for impairment – trade and other receivables (1,376) (2,316)
Operating profit 144,826 136,033
Interest income 3,633 3,837
Investment income (1,636) (1,190)
Share of results of associates and joint ventures (18,455) (13,271)
Other income/(expense) 3,900 (1,730)
Finance costs (15,625) (13,355)
Loss from currency revaluation (17,265) (12,678)
Board of Directors’ remuneration (138) (172)
Contribution to Kuwait Foundation (469) (442)
for Advancement of Sciences
National Labour Support Tax and Zakat (3,723) (3,081)
Profit for the period before income tax 95,048 93,951
Income tax expenses (10,298) (8,130)
Profit for the period 84,750 85,821
Attributable to:
Shareholders of the Company 81,964 80,354
Non-controlling interests 2,786 5,467
84,750 85,821
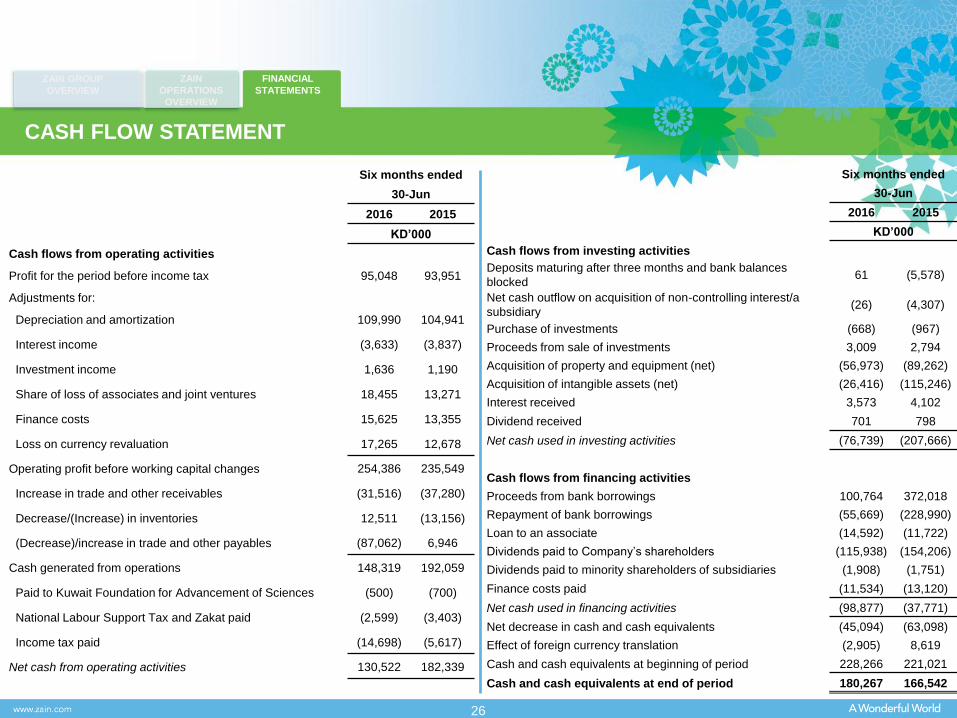
CASH FLOW STATEMENT
ZAIN GROUP
OVERVIEW
ZAIN
OPERATIONS
OVERVIEW
FINANCIAL
STATEMENTS
26
Six months ended
30-Jun
2016 2015
KD’000
Cash flows from operating activities
Profit for the period before income tax 95,048 93,951
Adjustments for:
Depreciation and amortization 109,990 104,941
Interest income (3,633) (3,837)
Investment income 1,636 1,190
Share of loss of associates and joint ventures 18,455 13,271
Finance costs 15,625 13,355
Loss on currency revaluation 17,265 12,678
Operating profit before working capital changes 254,386 235,549
Increase in trade and other receivables (31,516) (37,280)
Decrease/(Increase) in inventories 12,511 (13,156)
(Decrease)/increase in trade and other payables (87,062) 6,946
Cash generated from operations 148,319 192,059
Paid to Kuwait Foundation for Advancement of Sciences (500) (700)
National Labour Support Tax and Zakat paid (2,599) (3,403)
Income tax paid (14,698) (5,617)
Net cash from operating activities 130,522 182,339
Six months ended
30-Jun
2016 2015
KD’000
Cash flows from investing activities
Deposits maturing after three months and bank balances
blocked61 (5,578)
Net cash outflow on acquisition of non-controlling interest/a
subsidiary(26) (4,307)
Purchase of investments (668) (967)
Proceeds from sale of investments 3,009 2,794
Acquisition of property and equipment (net) (56,973) (89,262)
Acquisition of intangible assets (net) (26,416) (115,246)
Interest received 3,573 4,102
Dividend received 701 798
Net cash used in investing activities (76,739) (207,666)
Cash flows from financing activities
Proceeds from bank borrowings 100,764 372,018
Repayment of bank borrowings (55,669) (228,990)
Loan to an associate (14,592) (11,722)
Dividends paid to Company’s shareholders (115,938) (154,206)
Dividends paid to minority shareholders of subsidiaries (1,908) (1,751)
Finance costs paid (11,534) (13,120)
Net cash used in financing activities (98,877) (37,771)
Net decrease in cash and cash equivalents (45,094) (63,098)
Effect of foreign currency translation (2,905) 8,619
Cash and cash equivalents at beginning of period 228,266 221,021
Cash and cash equivalents at end of period 180,267 166,542

Q&A
For More Information Please Contact Zain Group Investor Relations Team : [email protected]
Note: All population, GDP per Capita and Mobile Penetration figures are sourced
from EIU, WCIS & CIA Fact Book as of June 2016.
Zain Group, Head Office Building P.O. Box 22244, 13083 Safat, Kuwait City, Kuwait
Tel: +965 2464 4444 , Fax: +965 2464 4506
www.zain.com


