
York Region Economic Overview and Economic Indicators
January 12, 2011
Planning & Economic Development Committee / January 12, 2011
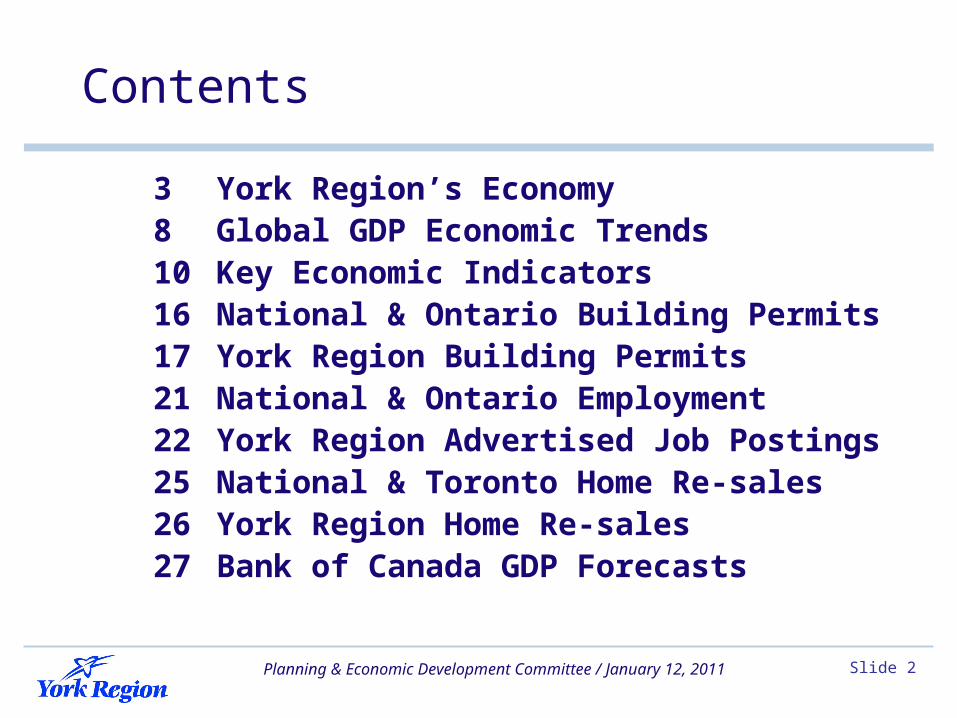
Contents
3 York Region’s Economy8 Global GDP Economic Trends10 Key Economic Indicators16 National & Ontario Building Permits17 York Region Building Permits21 National & Ontario Employment22 York Region Advertised Job Postings25 National & Toronto Home Re-sales26 York Region Home Re-sales27 Bank of Canada GDP Forecasts
Slide 2

Planning & Economic Development Committee / January 12, 2011
York Region’s Economy
Prince Edward Island 4,167
Newfoundland and Labrador 20,186
New Brunswick 23,392
Nova Scotia 28,969
Saskatchewan 41,434
Manitoba 42,057
Slide 3
Real Gross Domestic Product 2008 ($Millions)
Source: York Region Planning and Development Services, 2010; Statistics Canada, CANSIM, table 384-0002
British Columbia 164,869
Alberta 186,528
Quebec 268,406
Ontario 528,635
York Region 43,861
Planning & Economic Development Committee / January 12, 2011
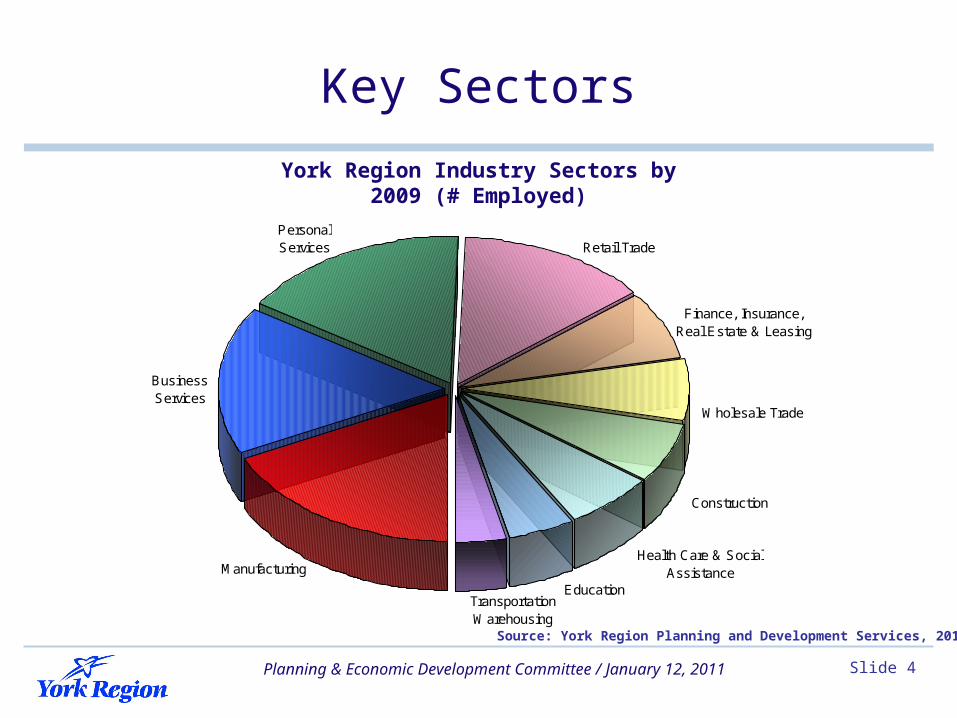
Key Sectors
Wholesale Trade
Transportation Warehousing
Personal Services Retail Trade
Finance, Insurance, Real Estate & Leasing
Business Services
Manufacturing
Education
Construction
Health Care & Social Assistance
Source: York Region Planning and Development Services, 2010
Slide 4
York Region Industry Sectors by2009 (# Employed)
Planning & Economic Development Committee / January 12, 2011
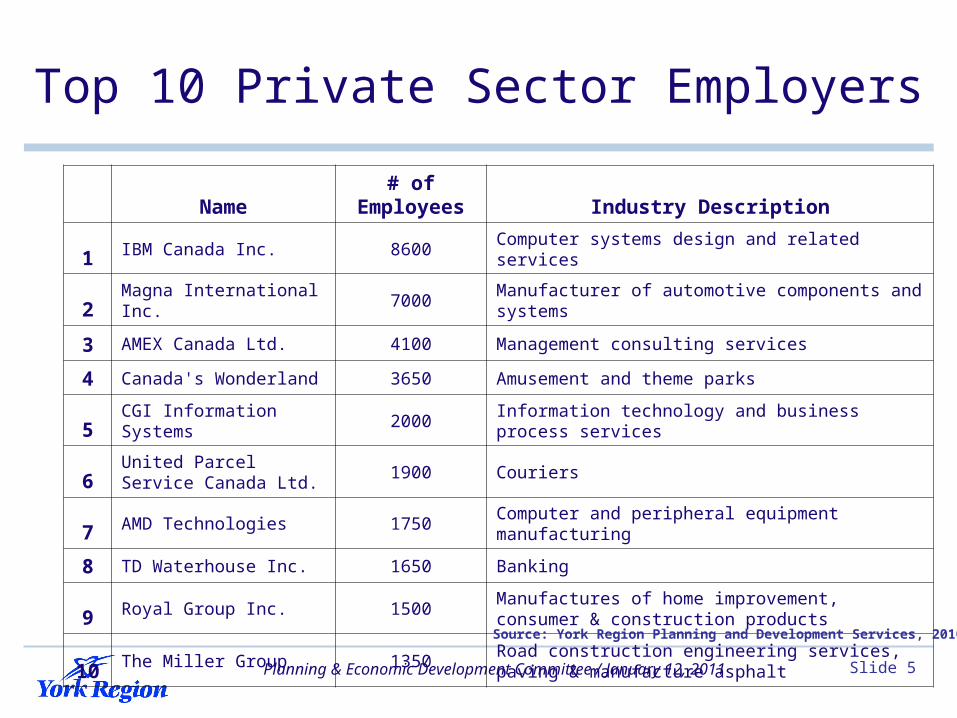
Top 10 Private Sector Employers
Name# of
Employees Industry Description
1 IBM Canada Inc. 8600 Computer systems design and related services
2 Magna International Inc. 7000 Manufacturer of automotive components and systems
3 AMEX Canada Ltd. 4100 Management consulting services
4 Canada's Wonderland 3650 Amusement and theme parks
5 CGI Information Systems 2000 Information technology and business process services
6United Parcel Service Canada Ltd.
1900 Couriers
7 AMD Technologies 1750 Computer and peripheral equipment manufacturing
8 TD Waterhouse Inc. 1650 Banking
9 Royal Group Inc. 1500Manufactures of home improvement, consumer & construction products
10 The Miller Group 1350Road construction engineering services, paving & manufacture asphalt
Source: York Region Planning and Development Services, 2010
Slide 5
Planning & Economic Development Committee / January 12, 2011
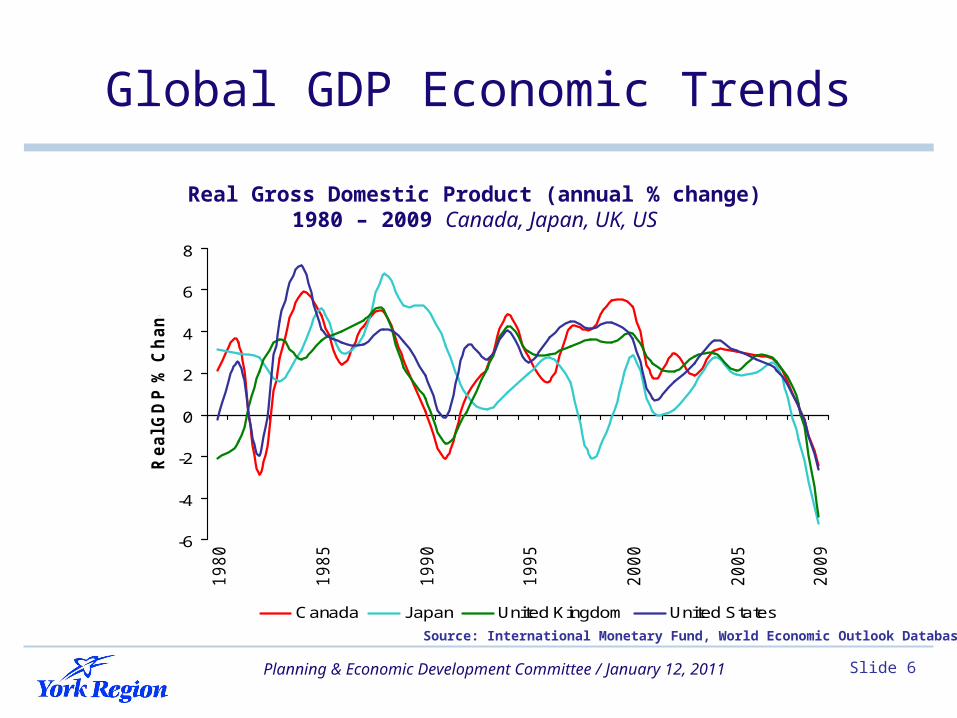
-6
-4
-2
0
2
4
6
8
19
80
19
85
19
90
19
95
20
00
20
05
20
09
Re
al G
DP
% C
ha
ng
e
Canada Japan United Kingdom United States
Slide 6
Global GDP Economic Trends
Source: International Monetary Fund, World Economic Outlook Database
Real Gross Domestic Product (annual % change)1980 – 2009 Canada, Japan, UK, US
Planning & Economic Development Committee / January 12, 2011
-15
-10
-5
0
5
10
15
20
19
80
19
85
19
90
19
95
20
00
20
05
20
09
Re
al G
DP
% C
ha
ng
e
Brazil China India Russia
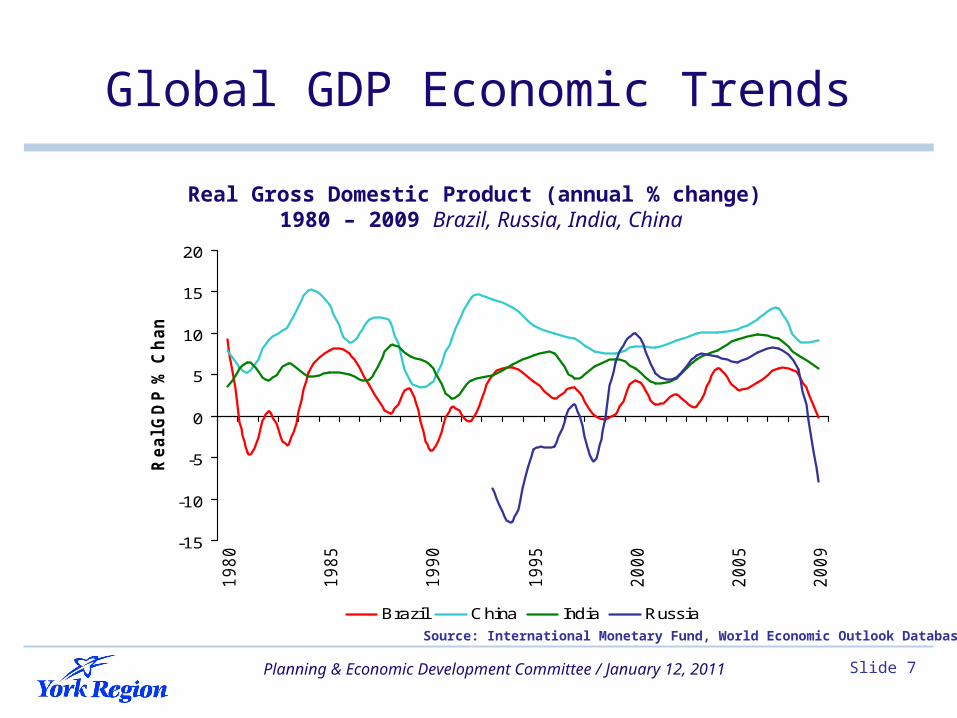
Slide 7
Global GDP Economic Trends
Source: International Monetary Fund, World Economic Outlook Database
Real Gross Domestic Product (annual % change) 1980 – 2009 Brazil, Russia, India, China

Planning & Economic Development Committee / January 12, 2011 Slide 8
Global GDP Economic Trends
Source: Organisation for Economic Co-Operative Development
Real Gross Domestic Product (quarterly)2008-2010 Canada, Japan, UK, US
-5
-4
-3
-2
-1
0
1
2
3
Q1 08 Q2 08 Q3 08 Q4 08 Q1 09 Q2 09 Q3 09 Q4 09 Q1 10 Q2 10 Q3 10
Re
al G
DP
% C
ha
ng
e
Canada Japan United Kingdom United States
Planning & Economic Development Committee / January 12, 2011 Slide 9
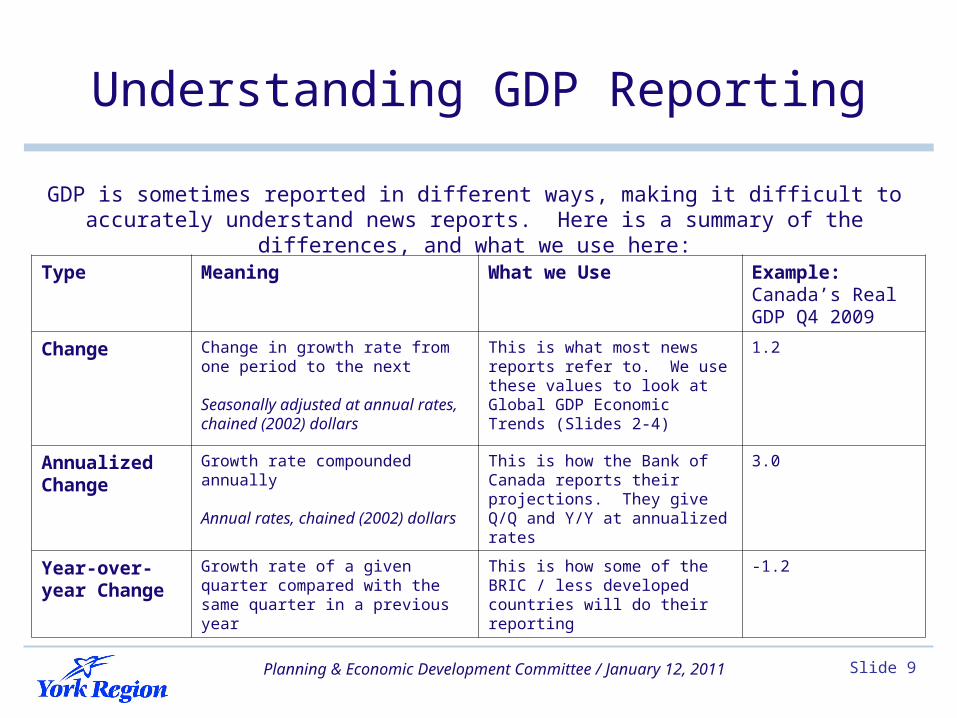
Understanding GDP Reporting
GDP is sometimes reported in different ways, making it difficult to accurately understand news reports. Here is a summary of the differences, and what we use here:
Type Meaning What we Use Example: Canada’s Real GDP Q4 2009
Change Change in growth rate from one period to the next
Seasonally adjusted at annual rates, chained (2002) dollars
This is what most news reports refer to. We use these values to look at Global GDP Economic Trends (Slides 2-4)
1.2
Annualized Change
Growth rate compounded annually
Annual rates, chained (2002) dollars
This is how the Bank of Canada reports their projections. They give Q/Q and Y/Y at annualized rates
3.0
Year-over-year Change
Growth rate of a given quarter compared with the same quarter in a previous year
This is how some of the BRIC / less developed countries will do their reporting
-1.2

Planning & Economic Development Committee / January 12, 2011
0
20
40
60
80
100
120
140
160
7-J
an
-00
7-J
ul-
00
7-J
an
-01
7-J
ul-
01
7-J
an
-02
7-J
ul-
02
7-J
an
-03
7-J
ul-
03
7-J
an
-04
7-J
ul-
04
7-J
an
-05
7-J
ul-
05
7-J
an
-06
7-J
ul-
06
7-J
an
-07
7-J
ul-
07
7-J
an
-08
7-J
ul-
08
7-J
an
-09
7-J
ul-
09
7-J
an
-10
7-J
ul-
10
$U
S P
er
Ba
rre
l
Slide 10
World Oil Prices
Source: Energy Administration Information
Weekly World Oil Prices ($US per barrel) 2000 – 2010
Oct 29, 2010$79.54

Planning & Economic Development Committee / January 12, 2011 Slide 11
US Employment Trends
Source: US Bureau of Economic Research
US Employment Trends (thousands of jobs) 2008 – 2010
Oct 2010139.1 M *6.9 M jobs lost vs. May 08

Planning & Economic Development Committee / January 12, 2011 Slide 12
US Home Re-sales
Source: US Real Estate Association
US Quarterly Home Re-sales (quarterly % change vs. YA) 2008 – 2010
Q1 Q2 Q3 Q4 Q1 Q2 Q3 Q4 Q1 Q2 Q3 2008 2009 2010

Planning & Economic Development Committee / January 12, 2011
0
5,000
10,000
15,000
20,000
25,000
30,000
May-09
Jun-09
Jul-09
Aug-09
Sep-09
Oct-09
Nov-09
Dec-09
Jan-10
Feb-10
Mar-10
Apr-10
May-10
Jun-10
Jul-10
Aug-10
Sep-10
Oct-10
$U
S M
Exports Imports
Slide 13
US / Canada Trade Indicators
Source: US Bureau of Economic Research
US Exports to and Imports from Canada ($US M)
2009 – 2010
Oct 2010Exports +18% VYAImports +10% VYA
Planning & Economic Development Committee / January 12, 2011
0.600
0.650
0.700
0.750
0.800
0.850
0.900
0.950
1.000
1.050
1.10019
8019
8119
8219
8319
8419
8519
8619
8719
8819
8919
9019
9119
9219
9319
9419
9519
9619
9719
9819
9920
0020
0120
0220
0320
0420
0520
0620
0720
0820
0920
10
$CA
N B
uys
$U
S
Slide 14
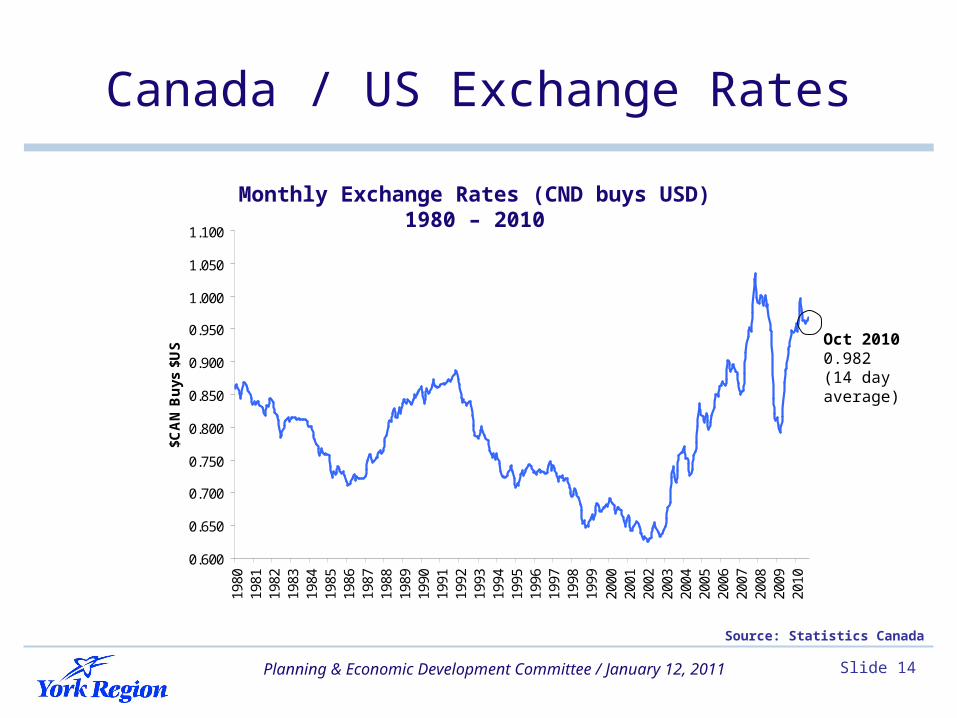
Canada / US Exchange Rates
Source: Statistics Canada
Monthly Exchange Rates (CND buys USD)1980 – 2010
Oct 20100.982 (14 day average)

Planning & Economic Development Committee / January 12, 2011 Slide 15
Canadian Interest Rates
Source: Bank of Canada
Average Canadian Interest Rates (Bank of Canada Short Term rates) 1980 – 2010
Oct 20101.25
Actual
Forecasts

Planning & Economic Development Committee / January 12, 2011 Slide 16
National & Ontario Building Permits
Source: Statistics Canada
Value of Building Permits (seasonally adjusted % change vs. previous period)2008 – 2010
Canada Ontario
Q1 Q2 Q3 Q4 Q1 Q2 Q3 Q4 Q1 Q2 Q3 2008 2009 2010
Planning & Economic Development Committee / January 12, 2011 Slide 17
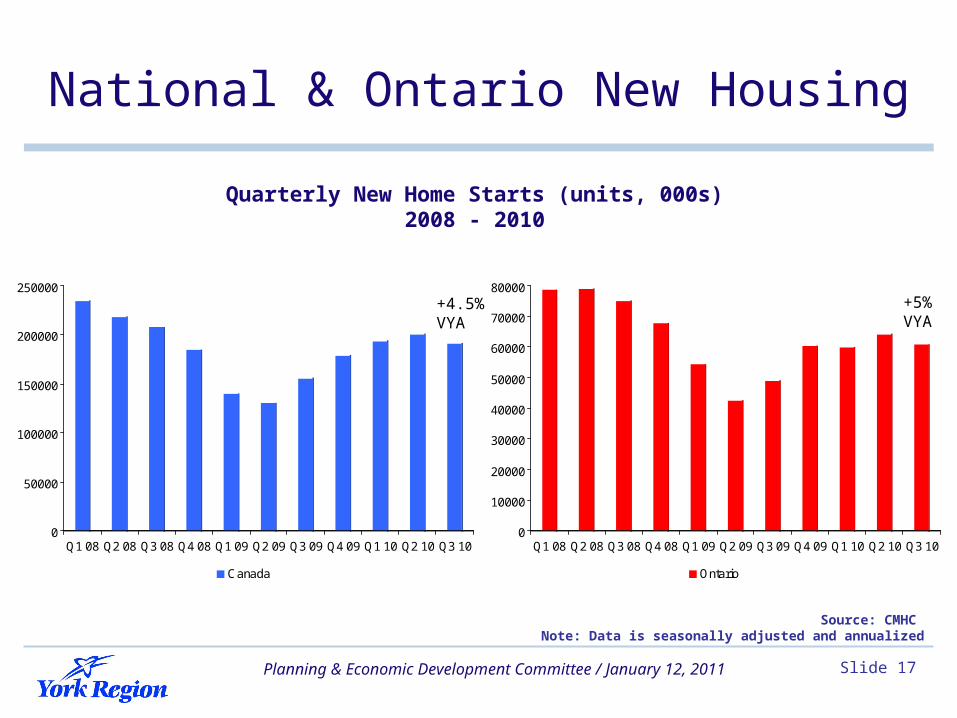
National & Ontario New Housing
Quarterly New Home Starts (units, 000s)2008 - 2010
0
50000
100000
150000
200000
250000
Q1 08 Q2 08 Q3 08 Q4 08 Q1 09 Q2 09 Q3 09 Q4 09 Q1 10 Q2 10 Q3 10
Canada
0
10000
20000
30000
40000
50000
60000
70000
80000
Q1 08 Q2 08 Q3 08 Q4 08 Q1 09 Q2 09 Q3 09 Q4 09 Q1 10 Q2 10 Q3 10
Ontario
Source: CMHC Note: Data is seasonally adjusted and annualized
+4.5% VYA
+5% VYA
Planning & Economic Development Committee / January 12, 2011
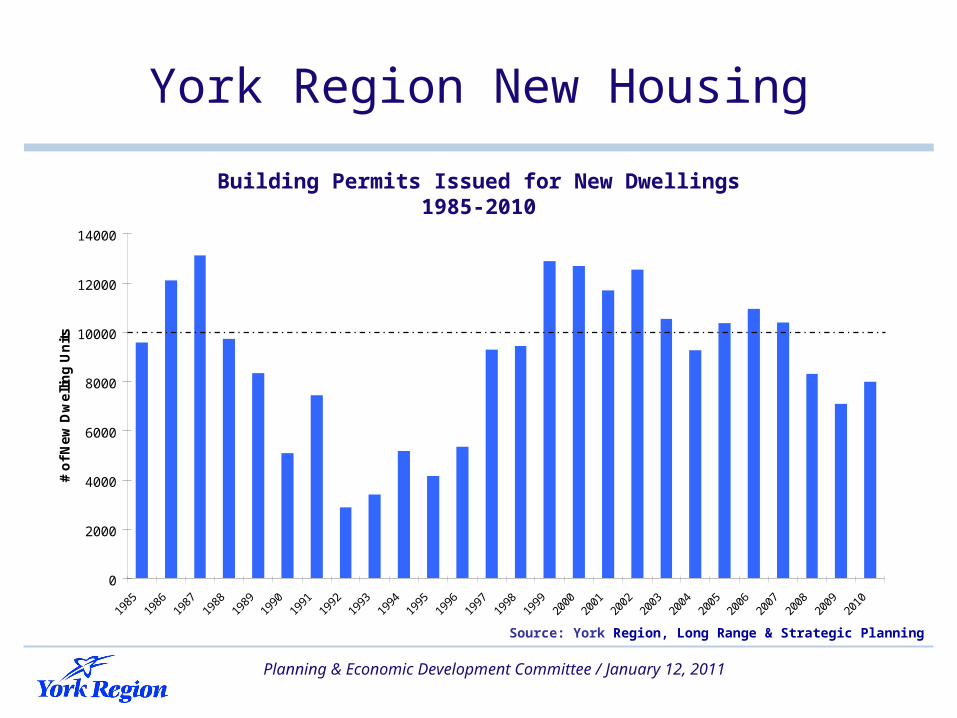
York Region New Housing
0
2000
4000
6000
8000
10000
12000
14000
1985
1986
1987
1988
1989
1990
1991
1992
1993
1994
1995
1996
1997
1998
1999
2000
2001
2002
2003
2004
2005
2006
2007
2008
2009
2010
# o
f N
ew
Dw
elli
ng
Un
its
Building Permits Issued for New Dwellings1985-2010
Source: York Region, Long Range & Strategic Planning

Planning & Economic Development Committee / January 12, 2011 Slide 19
York Region Building Permits
$0
$50
$100
$150
$200
$250
$300
$350
$400
$450
Jan Feb Mar Apr May Jun Jul Aug Sep Oct Nov Dec
Val
ue
($M
)
2008 2009 2010
Total Value of Building Permits ($M)2008 – 2010
Source: York Region, Long Range & Strategic Planning

Planning & Economic Development Committee / January 12, 2011 Slide 20
Building Permits by Municipality
Q3 2010 Residential ($M) ICI ($M) Total ($M) %VYA
Aurora $19.4 $3.4 $22.8 -63%
East Gwillimbury $12.7 $28.2 $40.9 204%
Georgina $12.9 $9.5 $22.4 164%
King $20.3 $0.3 $20.6 44%
Markham $116.2 $64.6 $180.8 34%
Newmarket $10.7 $4.1 $14.8 -60%
Richmond Hill $93.9 $45.3 $139.2 70%
Vaughan $223.1 $69.0 $292.1 -25%
Whitchurch Stouffville $29.8 $3.4 $33.2 -38%
Total York Region $539.0 $227.7 $766.7 -4%
Source: York Region and Local Municipalities
Planning & Economic Development Committee / January 12, 2011
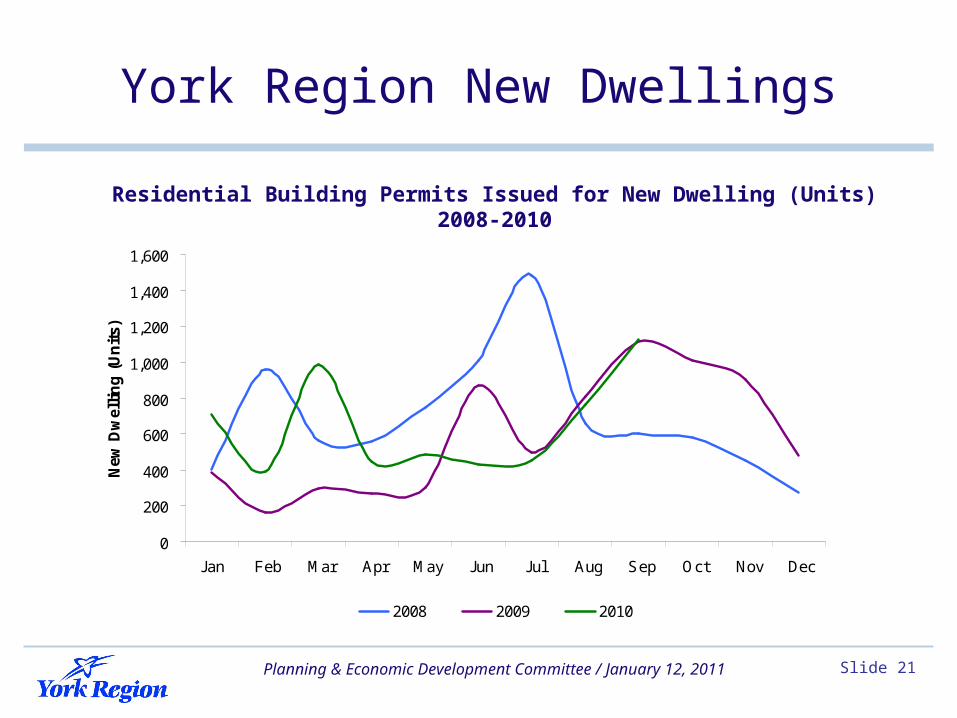
York Region New Dwellings
0
200
400
600
800
1,000
1,200
1,400
1,600
Jan Feb Mar Apr May Jun Jul Aug Sep Oct Nov Dec
New
Dw
elli
ng
(U
nit
s)
2008 2009 2010
Residential Building Permits Issued for New Dwelling (Units)2008-2010
Slide 21

Planning & Economic Development Committee / January 12, 2011 Slide 22
National & Ontario Employment
Employment (seasonally adjusted # jobs ‘000 vs. previous period)2008 – 2010
Source: Statistics CanadaCanada Ontario
Q1 Q2 Q3 Q4 Q1 Q2 Q3 Q4 Q1 Q2 Q3 2008 2009 2010
Planning & Economic Development Committee / January 12, 2011
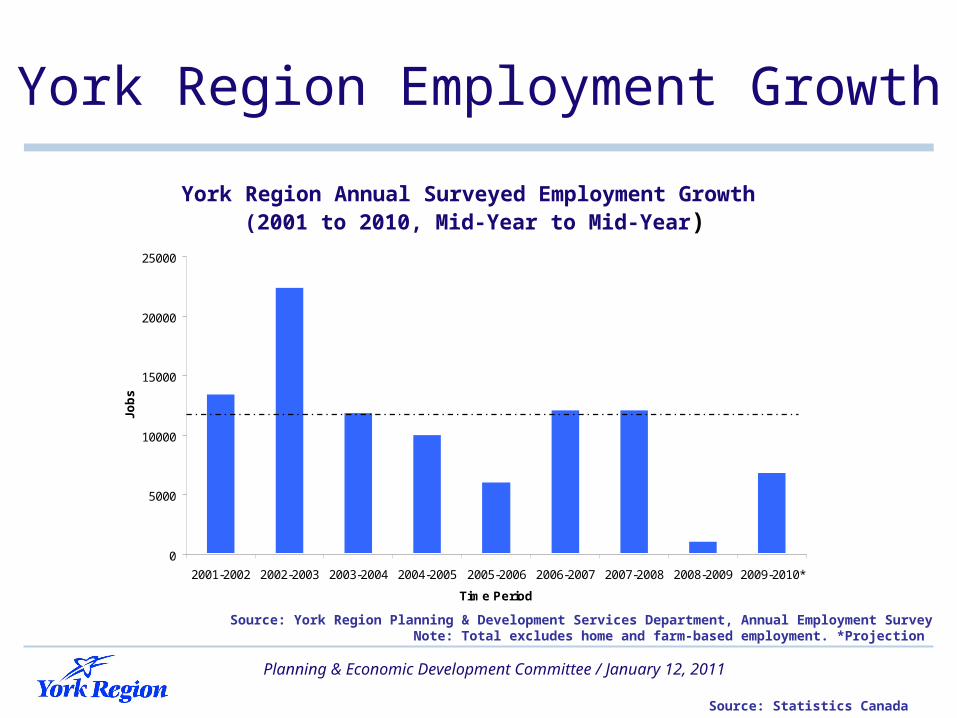
York Region Employment Growth
0
5000
10000
15000
20000
25000
2001-2002 2002-2003 2003-2004 2004-2005 2005-2006 2006-2007 2007-2008 2008-2009 2009-2010*
Time Period
Job
s
York Region Annual Surveyed Employment Growth (2001 to 2010, Mid-Year to Mid-Year)
Source: York Region Planning & Development Services Department, Annual Employment SurveyNote: Total excludes home and farm-based employment. *Projection
Source: Statistics Canada
Planning & Economic Development Committee / January 12, 2011 Slide 24
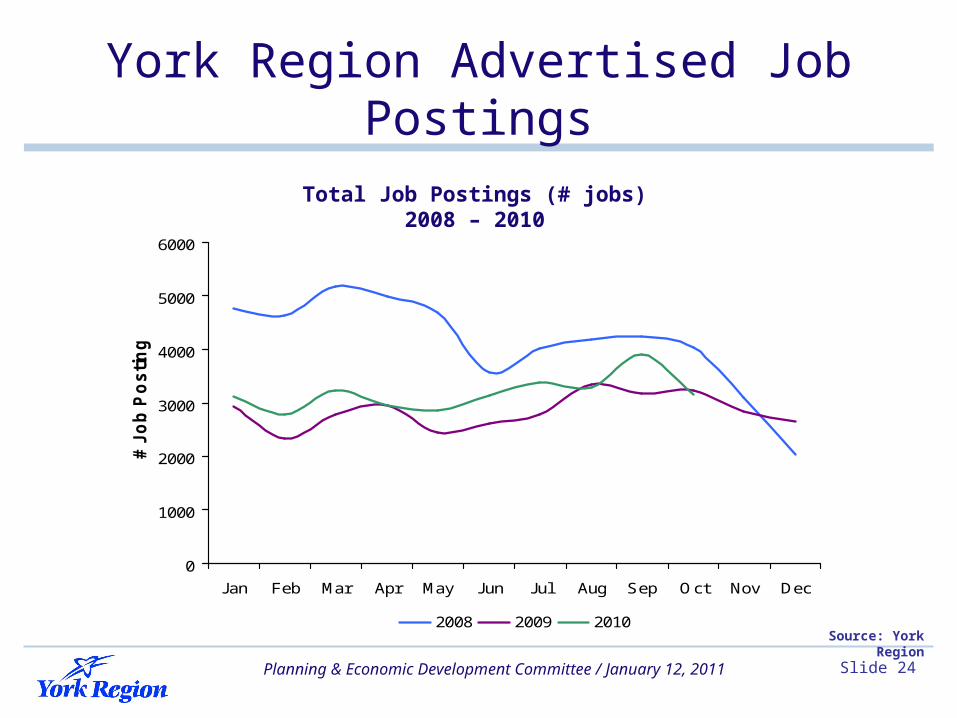
York Region Advertised Job Postings
0
1000
2000
3000
4000
5000
6000
Jan Feb Mar Apr May Jun Jul Aug Sep Oct Nov Dec
# J
ob
Po
sti
ng
s
2008 2009 2010
Total Job Postings (# jobs)2008 – 2010
Source: York Region
Planning & Economic Development Committee / January 12, 2011 Slide 25
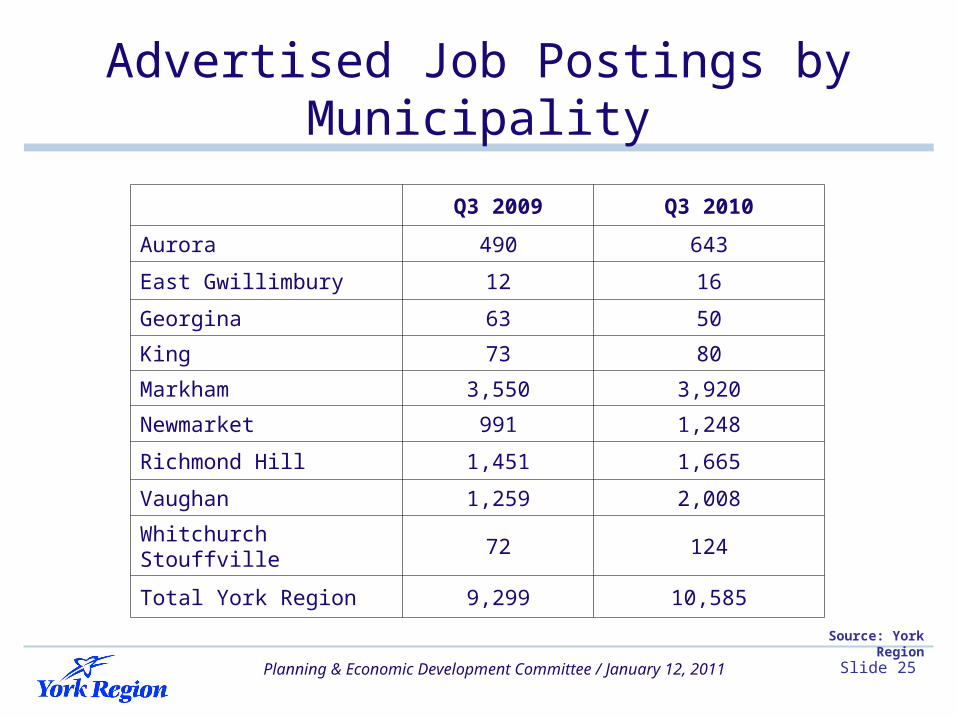
Advertised Job Postings by Municipality
Q3 2009 Q3 2010
Aurora 490 643
East Gwillimbury 12 16
Georgina 63 50
King 73 80
Markham 3,550 3,920
Newmarket 991 1,248
Richmond Hill 1,451 1,665
Vaughan 1,259 2,008
Whitchurch Stouffville 72 124
Total York Region 9,299 10,585
Source: York Region

Planning & Economic Development Committee / January 12, 2011 Slide 26
National & Toronto Home Re-sales
Sources: CMHC, CREA and TREB MLS
Home Re-sales (% change vs. YA)2009 – 2010
Q1 Q2 Q3 Q4 Q1 Q2 Q3 Q1 Q2 Q3 Q4 Q1 Q2 Q3 2009 2010 2009 2010
Canada Toronto CMA

Planning & Economic Development Committee / January 12, 2011 Slide 27
York Region Home Re-sales
0
500
1000
1500
2000
2500
Jan Feb Mar Apr May Jun Jul Aug Sep Oct Nov Dec
Un
its
2008 2009 2010
Total Home Re-sales (units)2008 – 2010
Source: TREB MLS

Planning & Economic Development Committee / January 12, 2011 Slide 28
Home Re-sales by Municipality
Q3 2009 Q3 2010
Aurora 294 180
East Gwillimbury 92 86
Georgina 219 190
King 56 37
Markham 1,431 971
Newmarket 393 284
Richmond Hill 1,391 888
Vaughan 1,020 694
Whitchurch Stouffville 175 148
Total York Region 5,071 3,478
Source: TREB MLS
Planning & Economic Development Committee / January 12, 2011 Slide 29
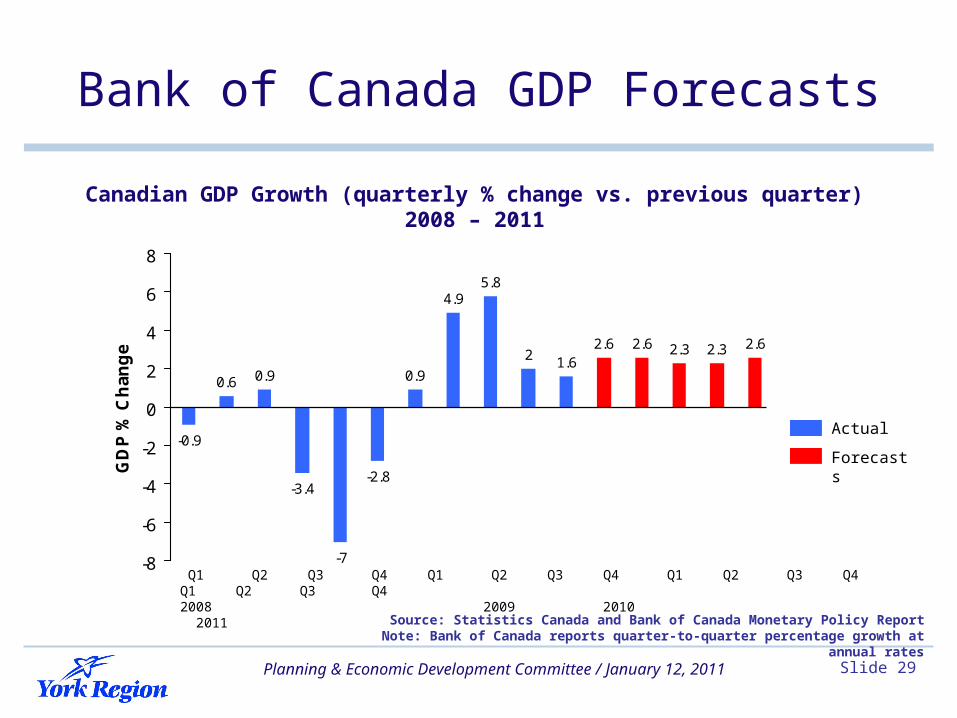
Bank of Canada GDP Forecasts
Source: Statistics Canada and Bank of Canada Monetary Policy ReportNote: Bank of Canada reports quarter-to-quarter percentage growth at annual rates
0.6 0.9
-3.4
-7
-2.8
0.9
4.95.8
2 1.62.6 2.6 2.3 2.3 2.6
-0.9
-8
-6
-4
-2
0
2
4
6
8
GD
P %
Ch
an
ge
Q1 Q2 Q3 Q4 Q1 Q2 Q3 Q4 Q1 Q2 Q3 Q4 Q1 Q2 Q3 Q4 2008 2009 2010 2011
Actual
Forecasts
Canadian GDP Growth (quarterly % change vs. previous quarter)2008 – 2011


