This is an electronic reprint of the original article.This reprint may differ from the original in pagination and typographic detail.
Powered by TCPDF (www.tcpdf.org)
This material is protected by copyright and other intellectual property rights, and duplication or sale of all or part of any of the repository collections is not permitted, except that material may be duplicated by you for your research use or educational purposes in electronic or print form. You must obtain permission for any other use. Electronic or print copies may not be offered, whether for sale or otherwise to anyone who is not an authorised user.
Yildirim, E.; Zhang, Y.; Lutkenhaus, J.L.; Sammalkorpi, MariaThermal transitions in polyelectrolyte assemblied occur via a dehydration mechanism
Published in:ACS Macro Letters
Published: 01/01/2015
Document VersionPeer reviewed version
Please cite the original version:Yildirim, E., Zhang, Y., Lutkenhaus, J. L., & Sammalkorpi, M. (2015). Thermal transitions in polyelectrolyteassemblied occur via a dehydration mechanism. ACS Macro Letters, 4(4), 1017-1021.
Thermal transitions in polyelectrolyte assemblies
occur via a dehydration mechanism
Erol Yildirim,† Yanpu Zhang,‡ Jodie L. Lutkenhaus,∗,‡ and Maria Sammalkorpi∗,†
†Aalto University, P.O. Box 16100, 00076 Aalto, Espoo, Finland
‡Artie McFerrin Department of Chemical Engineering, Texas A&M University, College
Station, Texas 77843, United States
E-mail: [email protected]; [email protected]
1
This document is the Accepted Manuscript version of a Published Work that appeared in finalform in the ACS Macro Letters, copyright © American Chemical Society after peerreview and technical editing by the publisher.To access the final edited and published work see http://pubs.acs.org/doi/abs/10.1021/acsmacrolett.5b00351
ACS Macro Lett., 2015, 4 (9), pp 1017–1021DOI: 10.1021/acsmacrolett.5b00351
Abstract
Hydrated polyelectrolyte (PE) complexes and multilayers undergo a well-defined
thermal transition that bears resemblance to a glass transition. By combining molecu-
lar simulations and differential scanning calorimetry (DSC) of poly(diallyldimethylammonium)
(PDAC) and poly(styrenesulfonate) (PSS) multilayers, we establish for the first time
that dehydration drives the thermally induced change in plasticization of the complex
and in the diffusion behavior of its components. DSC experiments show that the
thermal transition appears when the assemblies are hydrated in water, but not in the
presence of alcohols, which supports that water is required for this transition. These
findings connect PE complexes more generally to thermoresponsive polymers and liquid
crystal phases, which bear phase transitions driven by the (de)hydration of functional
groups, thus forming a fundamental link toward an integrated understanding of the
thermal response of molecular materials in aqueous environments.
Introduction
Polyelectrolyte (PE) assemblies such as multilayers and complexes have received significant
attention as materials with extraordinary tensile strength,1 superhydrophobicity,2 and re-
sponsiveness.3–7 When hydrated, these materials are known to possess a thermal transition
possessing features similar to that of a glass transition including a decrease in modulus and
an increase in mobility.8–11 For lack of a better term, this thermal transition has been called a
”glass transition” or a ”glass-melt” transition, and it has been thought to arise from breaking
of ion pairs and subsequent polyelectrolyte chain relaxation.
For polyelectrolyte multilayers, the existence of this transition has been established under
different conditions by extensive thermal characterization efforts, see e.g. Refs.8–13 Our ear-
lier work using quartz crystal microbalance with dissipation (QCM-D), modulated differen-
tial scanning calorimetry (MDSC), and electrochemical impedance spectroscopy techniques
provided direct evidence of this transition for multilayers containing strong14,15 or weak15,16
2
polyelectrolytes assembled from solutions of varying ionic strength or pH, respectively. The
calorimetric transition manifests as a second-order change in the heat capacity at the ther-
mal transition temperature. For those made with strong polyelectrolytes, a distinct thermal
transition for hydrated polyelectrolyte multilayers assembled with excess salt was observed
at 49-56 ◦C, but no transition was observed in the absence of added salt or for dry films.14
Without added salt, strong polyelectrolyte complexes are primarily charge-compensated in-
trinsically (PE-PE) in a ladder-like configuration; with added salt, charge-compensation in-
creasingly becomes extrinsic (PE-small counter ion), loosening the ladder-like configuration.
For a recent description on the competing charge compensation mechanisms, see Ref.17 In ad-
dition to hydration and salt effects, pH strongly affects the transition for weak polyelectrolyte
assemblies.16 We have also observed the thermal transition in analogous polyelectrolyte com-
plexes, to be reported elsewhere. Therefore, it can be suggested that water and some degree
of extrinsic charge compensation are key requirements for the thermal transition. These
findings raise interesting questions regarding the mechanism behind the transition as it is
not well understood and speculative up to this point.
Here we show by detailed molecular simulations interconnected with MDSC characteri-
zation of PE complexes and multilayers that the ”glass transition” is actually driven by PE
dehydration and the disruption of water-PE hydrogen bonds; the mechanism bears resem-
blance to lower critical solution temperature (LCST)-type transitions in which dehydration,
and resulting phase separation, is driven by entropic considerations. To our knowledge, this
is the first time a water hydrogen bond disruption-based transition is established for polyelec-
trolyte complexes and multilayers (not containing a traditional thermoresponsive polymer).
The findings draw a direct, prior unknown fundamental connection between polyelectrolyte
complexes and multilayers and a variety of aqueous soft matter systems known to exhibit
dehydration transitions. Examples include thermoresponsive polymers such as poly(N-
isopropylacrylamide) (PNIPAM),18–20 lipid systems in which dehydration promotes liquid
crystal phase transitions,21 dehydration-driven cryptobiosis in biology,22,23 and amphiphilic
3
surfactants undergoing phase transitions under dehydration, see e.g. Refs.24,25 By estab-
lishing the dehydration-driven mechanism for polyelectrolyte complexes and multilayers, we
link them together with the thermal behavior of a broad range of synthetic and biological
molecular materials.
Experimental and computational methods
Simulation Details
PSS-PDAC hydrated complexes were modeled in compositions of 4 PSS25 - 4 PDAC25 chains
by classical molecular dynamics simulations using COMPASS (Condensed-Phase Optimized
Molecular Potentials for Atomistic Simulation Studies) force field and its explicit water
model within Accelrys Materials Studio software.26,27 The subscript 25 refers to the number
of repeat units in each linear PSS and PDAC polyelectrolyte chain. Corresponding to 18%
w/w hydration and 1.25 M excess salt, the simulated systems contain 500 water molecules
and 50 excess Na+ and Cl− ions in addition to the counterions in a simulation box of (40.51
A)3. The simulations are performed in NPT ensemble using the Andersen barostat28
the Nose-Hoover-Langevin thermostatting algorithms.29,30 Detailed simulation parameters,
initial configuration preparation and analysis details are presented in supporting information.
To eliminate uncertainty in the simulations, a five times slower heating rate and a larger
simulation box with longer PE chains (4PSS50/4PDAC50 and 10PSS50/10PDAC50) as well
as an OPLS-aa force-field based description of the polyelectrolytes31 and explicit TIP4P
water32 within GROMACS 4.6.6 simulation software33 were cross-examined to assess the
magnitude of these factors; the transition and its range persisted. However, the stochastic
variation in the initial configurations and their finite size result in a broad transition instead
of a single, well-defined temperature as in experiments, see e.g.14,16
4
Preparation of Free-Standing Layer-by-Layer Assemblies
In the experiments, free-standing PDAC/PSS layer-by-layer assemblies were prepared in
accordance with the procedure described in Ref.14 The ionic strength of assembly was 0.5 M
NaCl for all baths.
Modulated Differential Scanning Calorimetry (MDSC) Measure-
ments
Tzero hermetic pans and lids were used for MDSC experiments, TA Instruments Q200. Each
dry sample weight was about 10 mg, to which water was added until a concentration of 12 wt
% water (or alcohol) was achieved. Water with the same ionic strength (0.5 M NaCl), 1-
propanol, n-butanol or ethylene glycol was added to dry samples, respectively, yielding four
separate specimens. MDSC in a heat-cool-heat cycle was performed, ramping from 278 to
388 K (5 to 115◦C) at a rate of 2 K min−1, amplitude of 1.272 K for a period of 60 s. The
MDSC thermograms are shown in ”exotherm up” format. The first cooling cycle was chosen
to show the Tg. The transition temperature was taken as the inflection point. A minimum
of three experiments were performed for each condition.
Results and discussion
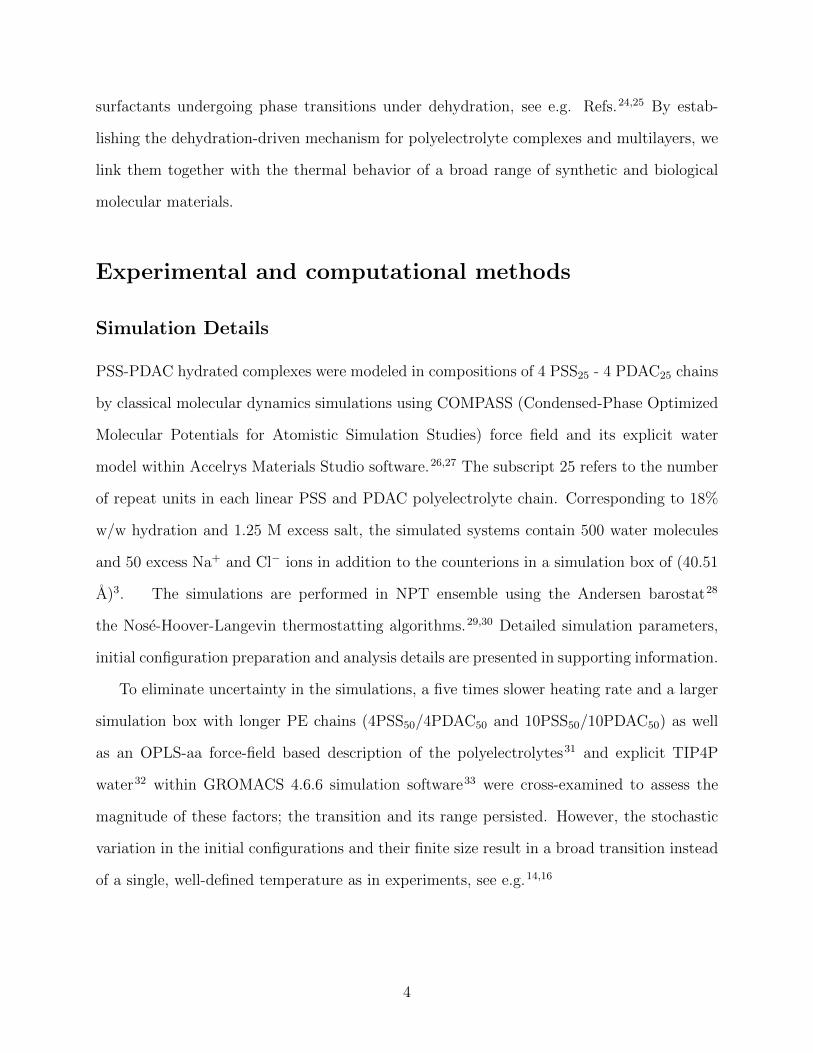
Figure 1 shows the mean square displacement (MSD) of water, PSS, and PDAC in simula-
tions of hydrated PDAC-PSS complexes at 1.25 M excess salt. In the range of 340 – 350 K,
all components in the system exhibit a sharp increase in MSD, suggesting an increase in the
dynamics as a result of the thermal transition.
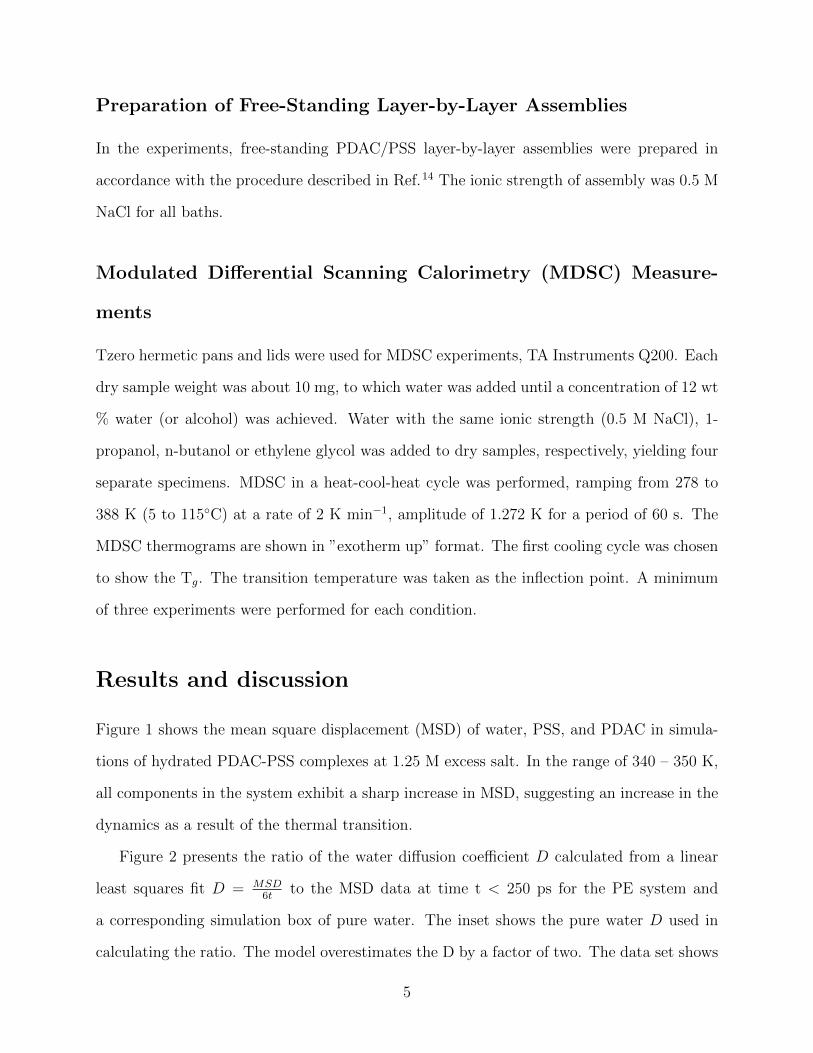
Figure 2 presents the ratio of the water diffusion coefficient D calculated from a linear
least squares fit D = MSD6t
to the MSD data at time t < 250 ps for the PE system and
a corresponding simulation box of pure water. The inset shows the pure water D used in
calculating the ratio. The model overestimates the D by a factor of two. The data set shows
5
A)
water
B)
PSS
C)
Figure 1: Mean square displacement of A) water, B) PSS, and C) PDAC molecules atdifferent temperatures in simulations of 4PSS25 - 4PDAC25 systems at 18 wt% water and1.25 M NaCl. The mobility of the molecules increases between 340 – 345 K (water) and 345– 350 K (PEs).
Figure 2: Ratio of water diffusion coefficient calculated in the PE system described in Figure1 and in pure bulk water at different temperatures. The inset shows the pure water dataused in calculating the ratio.
a clear discontinuity upon the transition, indicating a jump in the mobility of water in the
PE system. Notably, water diffusion in this system throughout this temperature range is
significantly below the self-diffusion of bulk water. This means that, although the binding
becomes weaker with increasing temperature, water molecules in the vicinity of the PE chains
retain partial PE binding even at elevated temperatures.
On the other hand, the polymeric diffusion is restricted by confinement; the time scale is
insufficient to quantify polymeric diffusion but nevertheless the MSD plots show an obvious
increase in chain segmental motion for both anionic and cationic chains. In the simulations,
initial observations of this increase in mobility occur at 340 K for water, whereas PE chain
6
mobility increases at 345 K, and the transition is completed by 350 K. The higher onset
of PE chain mobility is merely a consequence of the response time of the PE chains to the
change in water binding. The significance of this observation is that it shows that an increase
in the water mobility initiates the transition, followed by a relaxation of PE chains.
No such transition was observed in our simulations of pure water (no PE complex) or
with nonionic polystyrene chains described within the same simulational setup. Furthermore,
PSS, PDAC, and their complexes simulated as dry complexes (without water) or without
salt ions did not exhibit thermal transitions under the same simulational setup. The absence
of this transition in all of these systems and the onset of the transition by increased water
mobility suggests that the observed thermal transition originates from water-PE interactions
and requires some degree of extrinsic charge compensation.
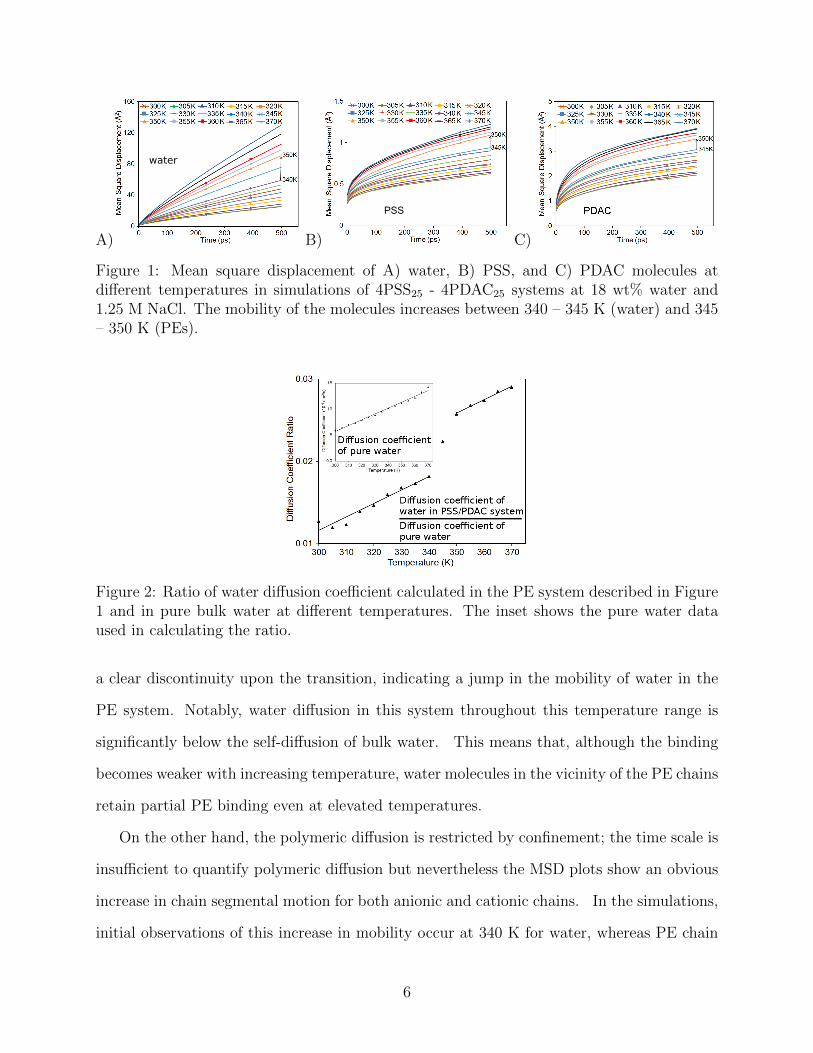
To verify that the observed thermal transition is related to water-PE interactions, we
performed experimental MDSC experiments on PSS-PDAC complexes in the presence of
different solvents (water and various alcohols). The MDSC data presented in Figure 3
shows that the thermal transition is indeed specific to the presence of water in the system.
The transition is present for water but not for alcohols. When water was the solvent, the
reversing heat flow changed by 10% upon going through the transition. The data also show
that the thermal transition is reversible with weak dependence on the thermal history of the
material, indicating structural reorganization between heating cycles. Likewise, repeated
molecular dynamics heating cycles also show that the simulationally observed transition
is reversible and occurs with comparable strength during every heating and cooling cycle.
Because the alcohols, which have less hydrogen bonding capacity than water, do not bear
the transition, we conclude that the transition originates from changes in the hydrogen bond
network formed by water and the PE chains.
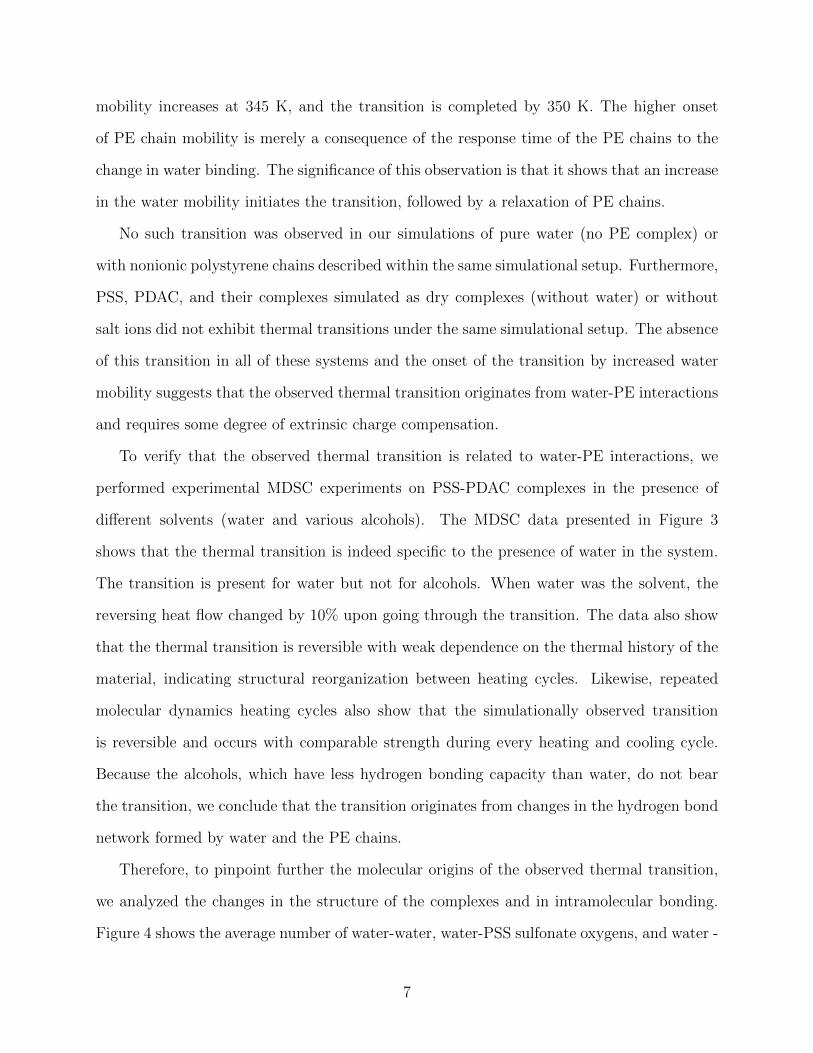
Therefore, to pinpoint further the molecular origins of the observed thermal transition,
we analyzed the changes in the structure of the complexes and in intramolecular bonding.
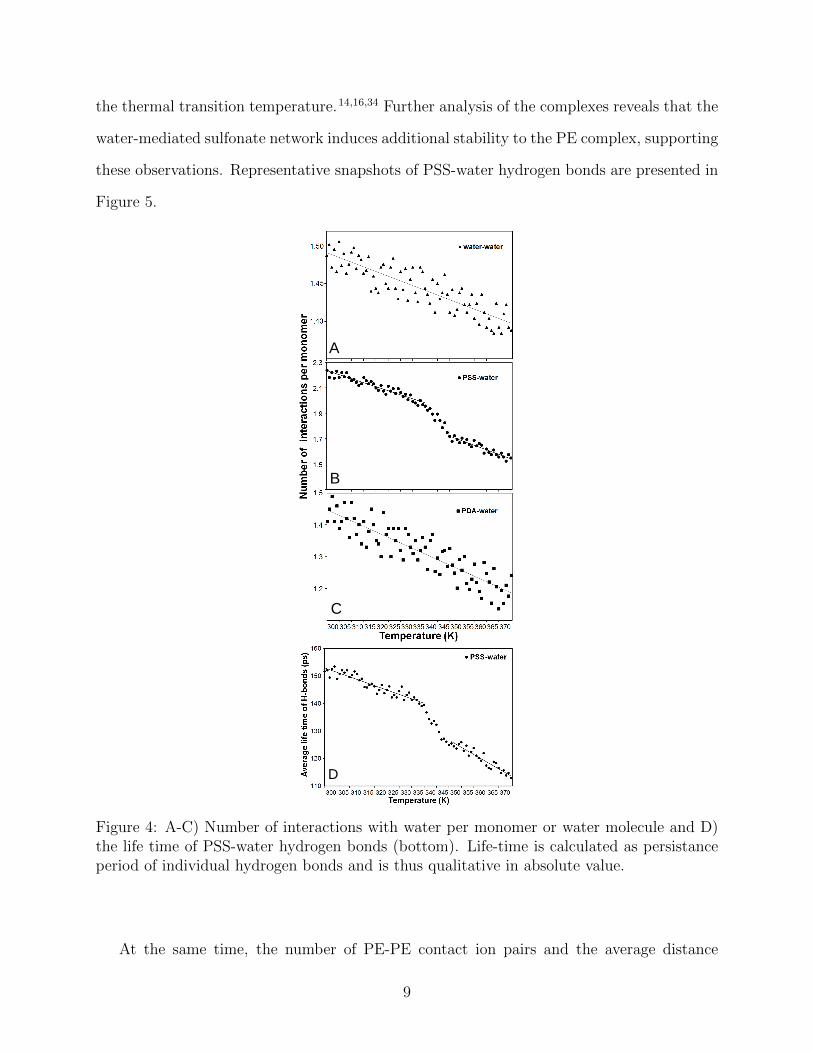
Figure 4 shows the average number of water-water, water-PSS sulfonate oxygens, and water -
7
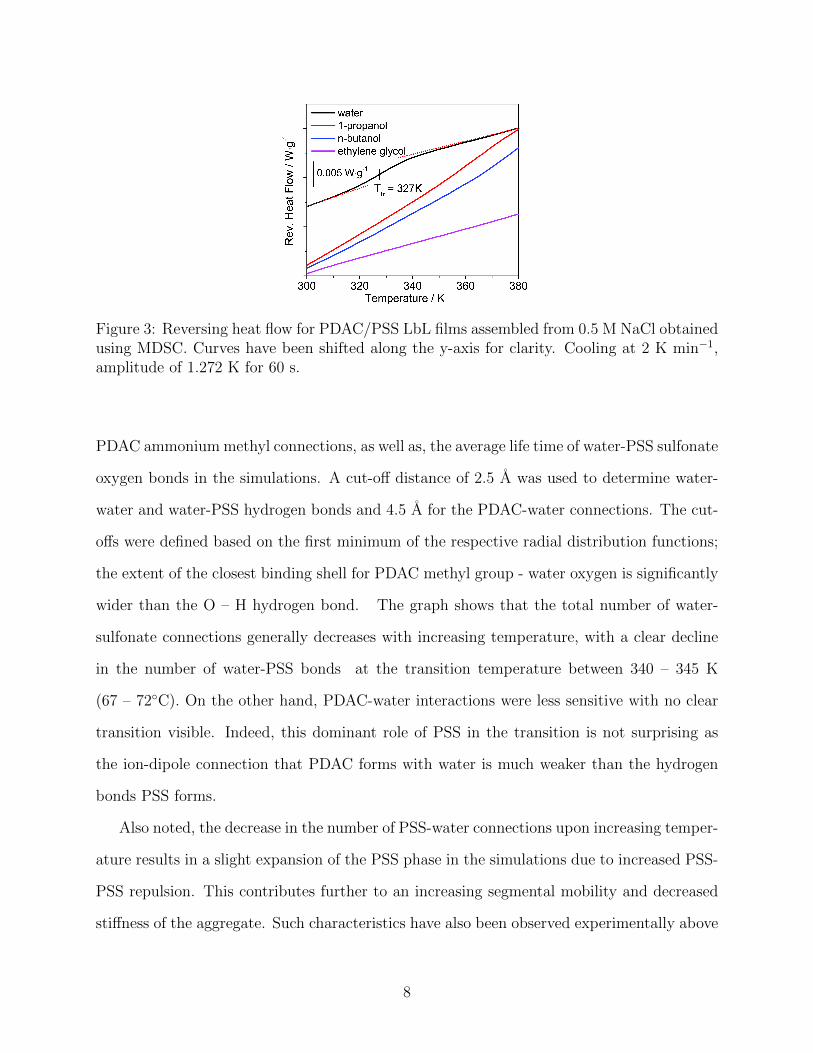
Figure 3: Reversing heat flow for PDAC/PSS LbL films assembled from 0.5 M NaCl obtainedusing MDSC. Curves have been shifted along the y-axis for clarity. Cooling at 2 K min−1,amplitude of 1.272 K for 60 s.
PDAC ammonium methyl connections, as well as, the average life time of water-PSS sulfonate
oxygen bonds in the simulations. A cut-off distance of 2.5 A was used to determine water-
water and water-PSS hydrogen bonds and 4.5 A for the PDAC-water connections. The cut-
offs were defined based on the first minimum of the respective radial distribution functions;
the extent of the closest binding shell for PDAC methyl group - water oxygen is significantly
wider than the O – H hydrogen bond. The graph shows that the total number of water-
sulfonate connections generally decreases with increasing temperature, with a clear decline
in the number of water-PSS bonds at the transition temperature between 340 – 345 K
(67 – 72◦C). On the other hand, PDAC-water interactions were less sensitive with no clear
transition visible. Indeed, this dominant role of PSS in the transition is not surprising as
the ion-dipole connection that PDAC forms with water is much weaker than the hydrogen
bonds PSS forms.
Also noted, the decrease in the number of PSS-water connections upon increasing temper-
ature results in a slight expansion of the PSS phase in the simulations due to increased PSS-
PSS repulsion. This contributes further to an increasing segmental mobility and decreased
stiffness of the aggregate. Such characteristics have also been observed experimentally above
8
the thermal transition temperature.14,16,34 Further analysis of the complexes reveals that the
water-mediated sulfonate network induces additional stability to the PE complex, supporting
these observations. Representative snapshots of PSS-water hydrogen bonds are presented in
Figure 5.
C
B
A
D
Figure 4: A-C) Number of interactions with water per monomer or water molecule and D)the life time of PSS-water hydrogen bonds (bottom). Life-time is calculated as persistanceperiod of individual hydrogen bonds and is thus qualitative in absolute value.
At the same time, the number of PE-PE contact ion pairs and the average distance
9
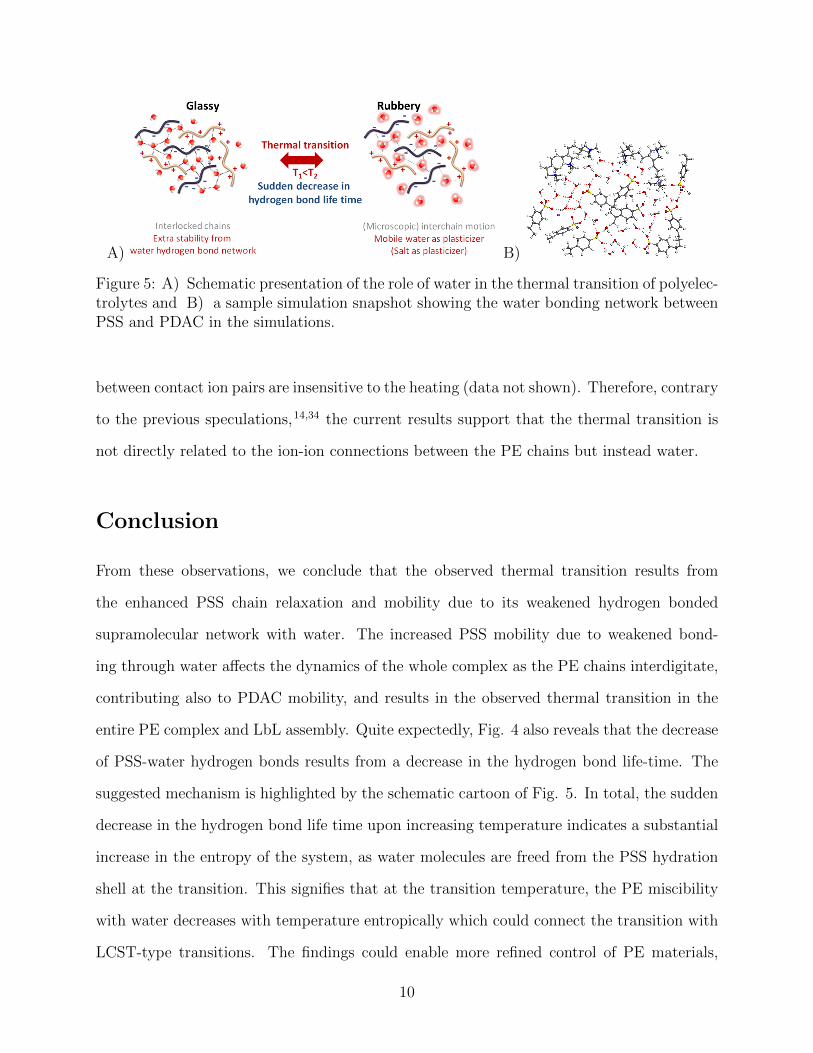
A) B)
Figure 5: A) Schematic presentation of the role of water in the thermal transition of polyelec-trolytes and B) a sample simulation snapshot showing the water bonding network betweenPSS and PDAC in the simulations.
between contact ion pairs are insensitive to the heating (data not shown). Therefore, contrary
to the previous speculations,14,34 the current results support that the thermal transition is
not directly related to the ion-ion connections between the PE chains but instead water.
Conclusion
From these observations, we conclude that the observed thermal transition results from
the enhanced PSS chain relaxation and mobility due to its weakened hydrogen bonded
supramolecular network with water. The increased PSS mobility due to weakened bond-
ing through water affects the dynamics of the whole complex as the PE chains interdigitate,
contributing also to PDAC mobility, and results in the observed thermal transition in the
entire PE complex and LbL assembly. Quite expectedly, Fig. 4 also reveals that the decrease
of PSS-water hydrogen bonds results from a decrease in the hydrogen bond life-time. The
suggested mechanism is highlighted by the schematic cartoon of Fig. 5. In total, the sudden
decrease in the hydrogen bond life time upon increasing temperature indicates a substantial
increase in the entropy of the system, as water molecules are freed from the PSS hydration
shell at the transition. This signifies that at the transition temperature, the PE miscibility
with water decreases with temperature entropically which could connect the transition with
LCST-type transitions. The findings could enable more refined control of PE materials,
10
their mechanical response, and structure, as well as, their materials interactions in aqueous
environment in analogy to surfactant and traditional thermoresponsive polymer materials
undergoing similar dehydration transitions.
Acknowledgement
This work is supported in part by Academy of Finland, Marie Curie Career Integration
Grants within the 7th European Community Framework Programme through Grant 293861,
and the National Science Foundation (Grant No. 1312676). The computational results of
this work have been achieved using the PRACE Research Infrastructure resources based in
Finland at CSC – IT Center for Science, as well as, using the CSC – IT Center for Science,
Finland national resources.
Supporting Information Available
Supporting Information Available: Additional simulation details. This material is available
free of charge via the Internet at http://pubs.acs.org/.
References
(1) Podsiadlo, P.; Arruda, E. M.; Kheng, E.; Waas, A. M.; Lee, J.; Critchley, K.; Qin, M.;
Chuang, E.; Kaushik, A. K.; Kim, H.-S.; Qi, Y.; Noh, S.-T.; Kotov, N. A. ACS Nano
2009, 6, 1564–1572
(2) Zhai, L.; Cebeci, F. C.; Cohen, R. E.; Rubner, M. F. Nano Lett 2004, 4, 1349–1353.
(3) Cohen Stuart, M. A.; Huck, W. T. S.; Genzer, J.; Mueller, M.; Ober, C.; Stamm, M.;
Sukhorukov, G. B.; Szleifer, I.; Tsukruk, V. V.; Urban, M.; Winnik, F.; Zauscher, S.;
Luzinov, I.; Minko, S. Nat Mater 2010, 9, 101–113.
11
(4) Mertz, D.; Vogt, C.; Hemmerle, J.; Mutterer, J.; Ball, V.; Voegel, J.-C.; Schaaf, P.;
Lavalle, P. Nat Mater 2009, 8, 731–735.
(5) Cui, J.; van Koeverden, M. P.; Muellner, M.; Kempe, K.; Caruso, F. Adv Colloid
Interfac 2014, 207, 14–31.
(6) Li, J.; Park, J. K.; Moore, R. B.; Madsen, L. A. Nat Mater 2011, 10, 507–511.
(7) Delcea, M.; Mohwald, H.; Skirtach, A. G. Adv Drug Deliver Rev 2011, 63, 730–747.
(8) Ghostine, R. A.; Schlenoff, J. B. Langmuir 2011, 27, 8241–8247.
(9) Kohler, K.; Mohwald, H.; Sukhorukov, G. B. J Phys Chem B 2006, 110, 24002–24010.
(10) Muller, R.; Kohler, K.; Weinkamer, R.; Sukhorukov, G.; Fery, A. Macromolecules 2005,
38, 9766–9771.
(11) Nazaran, P.; Bosio, V.; Jaeger, W.; Anghel, D. F.; von Klitzing, R. J Phys Chem B
2007, 111, 8572–8581.
(12) Salomaki, M.; Vinokurov, I. A.; Kankare, J. Langmuir 2005, 21, 11232–11240.
(13) Chollakup, R.; Smitthipong, W.; Eisenbach, C. D.; Tirrell, M. Macromolecules 2010,
43, 2518–2528.
(14) Vidyasagar, A.; Sung, C.; Gamble, R.; Lutkenhaus, J. L. ACS Nano 2012, 6, 6174–
6184.
(15) Sung, C.; Hearn, K.; Lutkenhaus, J. Soft Matter 2014, 10, 6467–6476.
(16) Vidyasagar, A.; Sung, C.; Losensky, K.; Lutkenhaus, J. L. Macromolecules 2012, 45,
9169–9176.
(17) Volodkin, D.; von Klitzing, R. Curr Opin Colloid In 2014, 19, 25–31.
(18) Roy, D.; Brooks, W. L. A.; Sumerlin, B. S. Chem Soc Rev 2013, 42, 7214–7243.
12
(19) Aseyev, V.; Tenhu, H.; Winnik, F. M. Adv Polym Sci: Self Organized Nanostructures
of Amphiphilic Block Copolymers II 2011, 242, 29–89.
(20) Dimitrov, I.; Trzebicka, B.; Muller, A. H. E.; Dworak, A.; Tsvetanov, C. B. Prog Polym
Sci 2007, 32, 1275–1343.
(21) Milhaud, J. Biochim Biophys Acta - Biomembranes 2004, 1663, 19–51.
(22) Keilin, D. Proc R Soc Lond B Biol Sci 1959, 150, 149–191.
(23) Clegg, J. S. Comp Biochem Physiol Biochem Mol Biol 2001, 128, 613–624.
(24) Soldi, V.; Keiper, J.; Romsted, L. S.; Cuccovia, I. M.; Chaimovich, H. Langmuir 2000,
16, 59–71.
(25) Heerklotz, H.; Tsamaloukas, A.; Kita-Tokarczyk, K.; Strunz, P.; Gutberlet, T. J Am
Chem Soc 2004, 126, 16544–16552.
(26) Sun, H. J Phys Chem B 1998, 102, 7338–7364.
(27) Material Studio Modeling Environment, Release 6 ; Accelrys Software Inc.: San Diego,
CA, USA, 2011.
(28) Andersen, H. C. J Chem Phys 1980, 72, 2384–2393.
(29) Samoletov, A. A.; Dettmann, C. P.; Chaplain, M. A. J. J Stat Phys 2007, 128, 1321–
1336.
(30) Leimkuhler, B.; Noorizadeh, E.; Theil, F. J Stat Phys 2009, 135 .
(31) Qiao, B. F.; Cerda, J. J.; Holm, C. Macromolecules 2010, 43, 7828–7838.
(32) Jorgensen, W. L.; Chandrasekhar, J.; Madura, J. D.; Impey, R. W.; Klein, M. L. J
Chem Phys 1983, 79, 926–935.
13
(33) Hess, B.; Kutzner, C.; van der Spoel, D.; Lindahl, E. J Chem Theory Comput 2008,
4, 435–447.
(34) Shamoun, R. F.; Hariri, H. H.; Ghostine, R. A.; Schlenoff, J. B. Macromolecules 2012,
45, 9759–9767.
14
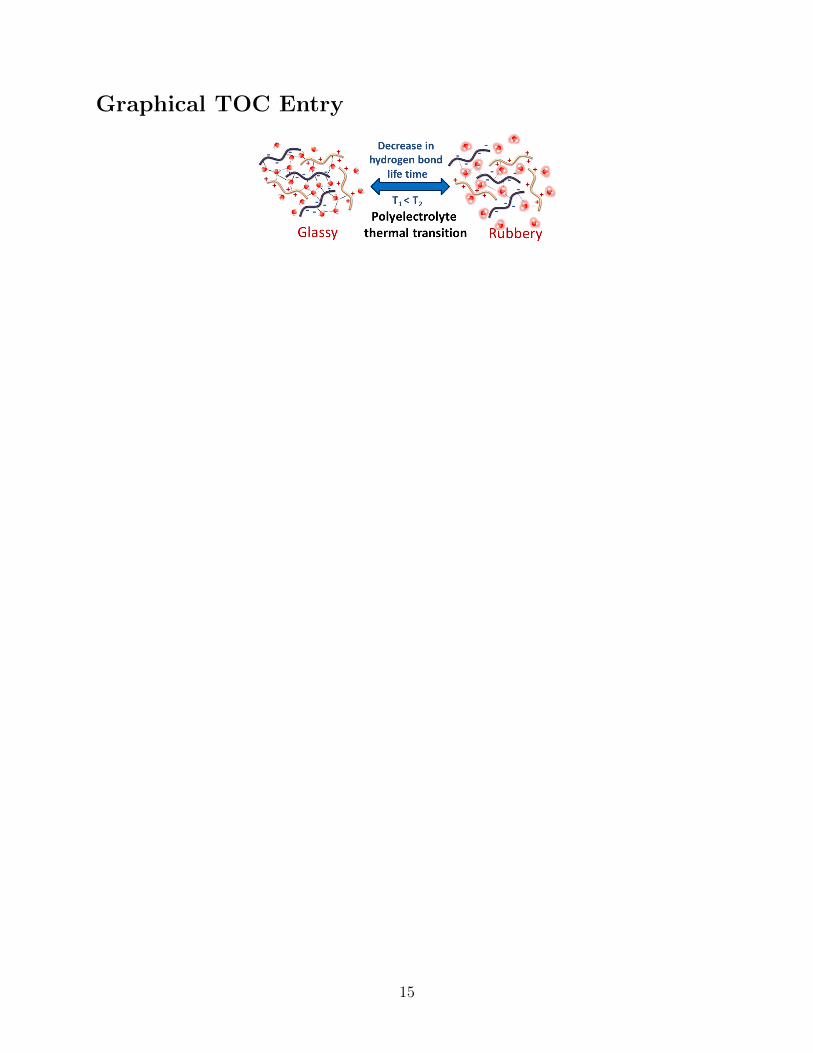
Graphical TOC Entry
15


