
WORLD’S BEST DRIVERLESS METRO LINES 2017M a r k e t s t u dy o n d r i v e r l e s s M e t r o l i n e s a n d b e n c h M a r k o f n e t w o r k p e r f o r M a n c e

32
FOREWORD
www.wavestone.com
Wavestone is a consulting firm, created from the merger of Solucom and Kurt Salmon’s European Business (excluding retails and consumer goods outside of France) Wavestone’s mission is to enlighten and guide their clients in the most critical decisions, drawing on functional, sectoral and technological expertise.
In tomorrow’s megacities, citizens’ selected route will take on increasing importance (in France, journey length grew by 63% between 1982 and 2008 according to INSEE, France’s National Institute of Statistics and Economic Studies).
At the same time, citizens’ habits regard-ing transport change as a result of pres-sure, from environmental responsibility which is more present in their conscience and, on the other hand, from congestion in city centers. The “transport mix” in big cities has clearly shifted from the individ-ual car towards mass public transport.
Faced with the challenge of transporting more passengers in a continuous and fluid way, and with the challenge of increasing line capacity that is already saturated, the driverless metro system brings practical solutions: high headway (up to 60’’ for Lille’s metro), high flexibility (adapting the service frequency to real time demand), high service level (24/7 service, e.g. Copenhagen’s metro) and higher commer-cial speed (up to 44km/h in Vancouver).
In addition, driverless metro systems con-siderably reduce operating costs (by up to 40%) mainly bringing with them human resources flexibility. This means public transport prices are significantly reduced and accessible to more of the population.
By making the most of all these advan-tages, the driverless metro system will, in the next five years, strategically meet the challenges of decongestion in the
megacities which are coming into view in emerging countries in Asia, Africa and South America as well as the challenges presented by the peripheral urbanization of highly dense big cities in developed European countries.
This panorama on “smartization”, which optimizes and streamlines urban mobil-ity highlights France as the flagship of driverless metro system operations. The momentum of its authorities and industry in the segment has propelled the country to the top of the pack in the global driv-erless metro market.
A transport system’s performance is based on strategic choices made over the long term by the organizing transport authority and tactical and operating choices made by the operator.
Through its vision, the organizing trans-port authority comes up with a transport solution that meets mobility demands modelled for several years (generally, the organizing transport authority’s vision is for a 10-30-year period). In reality, this choice which seems to have little impact on metro line operations proves decisive for:
/ Mobility quality perceived by the user, closely linked to the density of the stations (varying between 0.54 station/km for Dubai and 2.17 stations/km for Lausanne), with the theoretical headway and there-fore the transport system’s capac-ity (varying between 1’ for the Lille
*See glossary.

4 5
metro and 6’ for the Dubai metro), at the commercial speed brought about by the choice of rolling stock and accessibility, often standardized by strict rules
/ A recovery in the operator’s opera-tions which depend on the quality of the return good disposed of by the organizing transport authority and the ageing of the network and rolling stock. As a result, investment for the operator and additional oper-ating costs for maintenance are to be planned for
The study shows that the operator has a much more important role to play than the organizing transport authority in improv-ing the service delivered to the customer: the transport experience. It may compen-sate for choices made by the organizing transport authority which are judged as sub-optimal, ensuring a high rate of punc-tuality and frequency (varying between 93% for Lausanne and 99.73% for Taipei) and a group of innovative connected ser-vices which transform urban mobility.
Likewise, the operator’s expertise is cru-cial in guaranteeing efficient, reliable and above all profitable operations, particu-larly for ageing networks and rolling stock such as that found on the following metro systems: Lille (35 years’ old), Lyon (26), Taipei (21) and Vancouver (31). Network operations of this type may easily gen-erate uncontrollable maintenance costs which have a direct impact on the orga-nizing transport authority and the user through a higher transport price.
Transport service quality perceived by the customer is also thought to be linked to settings that are endogenous to oper-ations, which do not depend on the orga-nizing transport authority. This perception of quality is achieved through a passen-ger satisfaction level measured by the operator itself, with the operator’s own indicators undergoing self-monitoring i.e. monitoring by the organizing author-ity which seeks to measure the differ-ence between the thresholds set in the operations contract and users’ perceived performance.
Wavestone chose to compare users’ satis-faction levels in two domains for which the operator’s margins are significant: peo-ple’s cleanliness and safety. For the first domain, lines including Lyon, Barcelona, Rennes and Taipei top the rankings with positive opinions from users, reaching 99.3% for Lyon, versus less than 70% for Vancouver and Milan. For the second domain, the operator’s efforts are cru-cial even if the socio-economic context of the area served by the metro line has an important role. Regarding safety, Copenhagen, Dubai and Taipei come out with user satisfaction rates that exceed 90%.
Nevertheless, the comparison of users’ satisfaction between different networks remains a tricky task due:
/ The difference in terms of methods for measurement between the differ-ent lines and the type of surveys or inquiries conducted
/ The diverse nature of the socio-eco-nomic differences of the served areas, between cities and even countries
/ Citizens’ different perceptions faced with qualitative issues (safety, clean-liness) based on their country
/ The scope of the inquiry which varies according to author (operator, orga-nizing transport authority and third party). The scope for an authority or third party is often larger than that of an operator, which is sometimes impartial
Finally, in its analysis, Wavestone adopts a weighting factor which reflects the old-age of the infrastructure and rolling stock. At similar operating performance, a network with major operating constraints due to its age, reveals an operator’s potentially more advanced competency. A change to this factor would have an impact on the global ranking: by reducing such this factor, the best metro lines in the ranking may see their rank lowered, but the score will no longer precisely reflect their operational excellence.
As part of the development of its expertise in the trans-port sector, Wavestone’s Transport & Travel practice has taken a deeper look at mass urban transport by drawing on the existing network of our international offices to enhance the knowledge base of our local and international clients.
The trend of automation affecting all transport modes (including autonomous cars, autonomous buses and hyperloops) quickly shifted the focus of the study to driverless metro lines, a mature and rapidly expanding technology, the data for which is fully accessible, unlike those for disruptive systems, which are new and have little market presence.
To carry out the study, Wavestone limited the scope to a representative and coherent sample:
/ Driverless metro lines* mainly transporting pas-sengers on back-and-forth journeys including commutes.
/ Collective driverless transport lines such as light rail transit (LRT)*, people movers* and auto-mated guided transit (AGT)* are not included
in the benchmark target as their context, ser-vice and operation are not comparable with “heavier” systems such as metros and are not used in the same way.
/ The study analyses 25 of the 40 driverless metro lines existing worldwide in February 2017, for which information is considered as available, accessible and reliable, notably thanks to our international offices, thus providing the items necessary for a comparative analysis.
This survey is notably based on:
/ The collection of documents from different sources and supported by Wavestone’s inter-national offices.
/ A series of interviews with major players in urban transport and experts in the field.
/ Analysis work serving to compare driverless metro lines in three respects: the performance of infrastructure and rolling stock; the reliability and quality of the service; and the innovation demonstrated by the operators.
*See glossary.

76
Philippe MenesplierPhilippe Menesplier, Partner, he has more than 20 years of experience in strategy and management consult-ing. He managed numerous studies and clients’ deliver-ies for urban mobility market
actors: organization, industrial strategy, optimiza-tion and lean management.Also, he delivered important transformation pro-grams for companies evolving within the transport infrastructure industry, and he regularly conducts studies on multimodal mobility in megacities and [email protected]
CONTENTS
A d e t a i l e d b e n c h m a r k o f t h e d r i ve r l e s s m e t r o l i n e s u n d e r r e v i e w s 57
D e s c r i p t i o n o f s c o p e a n d m e t h o d o l o g y 2 9
I n t r o d u c t i o n o f t h e s t u d y 0 9
A p p e n d i c e s 97
S u m m a r y o f t h e c o m p a r a t i ve a n a l y s i s o f d r i ve r l e s s m e t r o l i n e s 3 5
AuThORS
Aurélien GuéAurélien Gué is a Senior Manager and expert in new uses that are deeply chang-ing our day to day living and the business model of the industry players.He managed several strate-
gic studies related to new mobility solutions (air transport, mass-transit, etc.) and conducted major transformation projects in the fields of passenger’s experience and operations for major transport and retail [email protected]
Jonathan LongoJonathan is part of Energy, Utilities and Transport Practice of Wavestone. Following several years of experience in the energy sector (investment fund, bank, energy producer and
distributor), he got the opportunity to help many private and public entities in the scope of market analysis, business model conception and bench-marks deliveries.More specifically, he addresses problems mixing energy and transport: smart city, green mobility, [email protected]
Franck BenoitFranck Benoit, Business Analyst, he initiated his career in transport and travel consulting. He grad-uated from the “Institut d’Etudes Politiques d’Aix-en-Provence”, public affairs
and holds a Master’s degree in Business Law from Aix-Marseille University.His double expertise allows him to advise public transport operators in conducting their strategic projects. He is particularly interested in the rela-tion between mobility operators or providers and transport organization [email protected]
Juliano NaoufalJuliano Naoufal is a con-sultant within the Energy, Utilities and Transport Practice. Following several years of studies in transport and sustainable develop-
ment at the “Ecole des Ponts ParisTech”, Juliano started his career in the air transport industry
before pursuing it in transport and multimodal mobility consulting.Generalist of passengers and fret transport, expert in externalities and LCA Life Cycle Assessment, Juliano works regularly on strategic benchmarks and studies in the service of major industry players: operators, transport organization authorities and equipment [email protected]

98
INTRODuCTION OF ThE STuDyuN VISuEL

1110
Chine France Allemagne
Italie Royaume-Uni États-Unis
2 0 1 6 - T h e W o r l d ' s 1 0 B i g g e s t C i t i e s ( p o p u l a t i o n i n m i l l i o n s o f i n h a b i t a n t s )
TokyoDehliShanghaiBombaySão PaoloMexicoPékinOsakaCairoNew York
3826.4
24.521.421.321.221.2
20.319.1
18.6
Chine France Allemagne
Italie Royaume-Uni États-Unis
2 0 3 0 - T h e W o r l d ' s 1 0 B i g g e s t C i t i e s ( p o p u l a t i o n i n m i l l i o n s o f i n h a b i t a n t s )
TokyoDehliShanghaiBombayPékin DhakaKarachiCairoLagosMexico
37.236.1
30.827.827.727.4
24.824.524.2
23.9
U R B A N I z AT I o N I S o N T h e R I S e I N A L L T h e W o R L D ’ S M e G A C I T I e S , PA R T I C U L A R Ly I N e M e R G I N G Co U N T R I e S
The global urban landscape is in the midst of e deep-seated change. In 1950, only New York and Tokyo had a population of over ten million. In 2016, some 31 cities are home to over ten million people, six of them
in China and five in India. The figure will rise to 41 by 2030. The world is currently home to 7.3 billion people, over 54.5% of whom live in cities. By 2050, the world population will rise to roughly 9.7 billion, with over 65% of the total living in cities.
The number of megacities is on the increase, a trend accompanied by urban sprawl, which gives these cities an interface role through an effective transport system:
A F R I C A A N D A S I A A R e S e T F o R S T R o N G U R B A N G R o W T h , L e A D I N G To T h e A D v e N T o F N e W M e G A C I T I e S o N T h e T W o Co N T I N e N T S
Megacities are concentrated in Asia and Africa: in 2016, 17 of the world’s 31 cities with over 10 million inhabitants were in
Asia (55%) and 3 in Africa (10%). In 2030, 23 of the world’s 41 cities with over 10 million inhabitants will be in Asia (56%) and 6 in Africa (15%).
The 10 new megacities will be in Asia (Pakistan, India, Thailand, Vietnam), Africa (South Africa, Tanzania, Angola) and South America (Colombia).
• China (19% of the world population) and India (18%) are the world’s most populous countries, each with over one billion inhabitants.
• Only four megacities are not on the Asian continent: São Paulo, Mexico, Cairo and New york.
• None of the megacities are in Europe, and Cairo is the only one in Africa.
• Seven of the ten most populous cities are in Asia
• India will overtake China as the world’s most populous country in 2022.
• Bangladesh (Dhaka) and Pakistan (Karachi) are highly populated and capital-centric.
• The population of Nigeria (Lagos) will overtake that of the uSA in 2050, with the country becoming the world’s third most populous.
MOBILITy, A KEy ISSuE IN TOMORROW’S C IT IES
The rapid expansion of these cities, and the emergence of a middle class resulting from the far-reaching economic transformation in these regions, make urban mobility a key issue for
these countries. The urban transport market will be increasingly concentrated in these two regions in the coming decades.
Source: United Nations, The World’s Cities in 2016.*See glossary.
Source: United Nations, The World’s Cities in 2016.
Chine France Allemagne
Asia
Africa
Africa (Tanzania, Angola, Nigeria, RDC)
Asia (Bangladesh, Pakistan, India)
South America
Italie Royaume-Uni États-Unis
T o p 1 0 C i t i e s w i t h t h e S t r o n g e s t P o p u l a t i o n G r o w t h b e t w e e n 2 0 1 6 a n d 2 0 3 0
G e o g r a p h i c a l B r e a k d o w n o f C i t i e s E n t e r i n g t h e R a n k i n g s o f M e g a c i t i e s w i t h O v e r 1 0 m i l l i o n I n h a b i t a n t s i n 2 0 3 0
Hyderabad AhmedabadBangaloreLahoreKarachiDhakaKinshasaLagosLuandaDar es Salaam
38.639
41.24545.1
50.165.7
77.481.8
98.9
6030
10
0
500
1000
1500
2000

1312
To P R e PA R e F o R D o U B L e - D I G I T U R B A N G R o W T h , T h e W o R L D ’ S B I G G e S T C I T I e S N e e D To S TA R T T h I N k I N G A B o U T S U S TA I N A B L e M o B I L I T y h e R e A N D N o W
Worldwide, the urban population overtook the rural population in 2007. In a world of cities, city dwellers, whether commuting or traveling for family or leisure purposes, are in movement: mobility is an integral part of their everyday lives.
Today’s cities are congested, traf-fic-jammed and polluted. Tomorrow’s cities need to address the mobility issues of their inhabitants – and the manage-ment of transport flows has become a crucial issue. Tomorrow’s hyper-connected and smart cities (which are just around the corner) also need to take a new approach to mobility:
Mobility adapted to the characteristics of tomor-row’s cities: the modern
metropolis – the “Smart City” – is larger and more densely populated, a place of 24-7 mobility with peaks in transport use that require transport authorities to be adaptable.
Mobility that respects the environment: mobility today is overly polluting;
it needs to be approached as part of the efforts to shrink the environ-mental footprint of the Smart City.
Mobility that goes above and beyond the tradi-tional, technical and
functional definition of transport to adopt a service-based and more modern approach: mobility condi-tions (comfort and well-being, wait-ing times, information access) are becoming crucial, with users more concerned about the time than the distance of their daily journeys.
Mobility that takes account of the back-and-forth travel characteristic of
large cities, in which inhabitants take the same routes back and forth in the same day, mainly as part of their commutes.
C L I C k A B L e , e F F I C I e N T A N D P e R S o N A L I z e D T R A N S P o R T F o R A U G M e N T e D M o B I L I T y I N T h e S M A R T C I T y
For economic and ecological reasons, large cities around the world are seeking to shift to a Smart City model. They are exploring a broad range of fields – includ-ing energy, waste management, water supply and enhanced transport – and digital technology is playing a vital role in optimizing the way these services work.
And so the transport sector is in the midst of a major transformation, with far-reaching changes in the offer and in
user behavior since the arrival of digital technology. A day-to-day issue for all the population, transport is naturally a key focus in efforts to develop Smart Cities.
Data is used to assist pas-sengers, who now have access to an unprece-
dented urban transport offer with increasingly varied transport modes (collaborative modes, bike fleets, self-service cars, etc.) accessible in just a few clicks thanks to digital advances in the sector. Transport data, widely shared on an open-data basis, are behind new comparative services, such as CityMapper.
The availability of trans-port data is also enabling transport organization
authorities to better plan the development of their networks by adapting transport offers to pas-senger flows, with electronic tickets improving the analysis of journeys, connections and so on.
The use of real-t ime shar ing i s improving the responsiveness of
the transport offer and serving to enhance mobility. Transport users are increasingly called on to provide information on the functioning of the network in real time (with Waze and Moovit, for example), and the information collected in real time
is supplied to transport authorities through partnerships (as with the Waze Connected Citizens Program).
S h o RT e R J o U R N e y S A N D L I G h T e R T R A N S P o RT M o D e S A R o U N D D e N S e A N D I N C R e A S I N G Ly D eC e N T R A L I z e D AG G Lo M e R AT I o N S
Commutes are growing increasingly longer. The average commute distance in France has risen 63% in the last 30 years. This is mainly a result of the widespread migration of inhabitants to peri-urban areas, which in turn results from the sub-stantial growth in the population of cities and increasing pressure on urban areas.
The socio-economic and ecological impact of the daily commutes stem-ming from this shift is considerable. The economically active population is more stressed and productivity is on a non-stop decline, negatively impacting the urban economic fabric.
To address this problem, countries, and often developed countries, are seeking to bring homes closer to workplaces and even concentrate them in peri-urban micro-centers (such as those in Seine Saint-Denis and Paris-Saclay outside Paris).
The adoption of this approach in the national strategies of various countries,

1514
along with the rise of these “micro-cities”, whose populations are considerably lower than those of cities, presages a switch from a mass transit network, such as the metro, to much lighter micro-networks such as people movers and trams.
A product of this model, the Grand Paris Express rapid transit system serves to decentralize the City of Paris and paves the way for the arrival of tomorrow’s peri-urban micro-cities.
To M o R R o W ’ S S M A R T C I T y W I L L B e S e R v e D B y A h I G h e R - P e R F o R M A N C e M A S S T R A N S I T S o L U T I o N : T h e D R I v e R L e S S M e T R o
“New mobilities” are a new way for get-ting from A to B made possible by emerg-ing models and technologies and rolled out through high user adoption rates, including electric cars, autonomous shut-tles and carpooling. But these systems are not adapted to mass transit, involv-ing faster passenger throughput rates on high-pressure routes and in a sustainable manner.
Driverless metros stand as an intelligent and innovative mass-transit solution. Driverless technology meets a certain number of the objectives involved, includ-ing high capacity, speed and regularity, reduced operating costs, adaptability, and flexibility in terms of human resources. It fulfills the criteria of a new approach to mobility:
I t i s adapted to the requirements of future cities
> it is integrated in the urban envi-ronment and responds to the demand for diversified mobility from
Copenhagen and Toulouse to Dubai and Vancouver; > it is more flexible to operate, both in technical and HR terms: automatic solutions can be quickly adapted to available capacity by minimizing or even eliminating constraints linked to drivers.
It creates a better service for passengers > it helps to reduce wait-
ing times on platforms by provid-ing a more frequent service and faster commercial speed than con-ventional metros while maintain-ing top-level punctuality; > it offers a better passenger experi-ence through more recent trains and renovated stations.
It is a reliable means of transport requiring lead-ing-edge expertise
By eliminating the risk factors stemming from human driving, the driverless metro achieves higher safety and reliability rates than conventional metro systems*; the introduction of platform doors also limits the risk of accidents and human presence on the track.
C u r r e n t U r b a n Tr a n s p o r t M o d e l F u t u r e P e r i - U r b a n Tr a n s p o r t M o d e l
A ve r a g e C o m m u t e D i s t a n c e i n F r a n c e ( i n k m )
So
urce
: IN
SE
E.
0
5
10
15
1982 1994 2008
+63%
Metro-style mass transit line
Light tram or people-mover line with very low capacity
*See glossary.

1716
selected with a view to decentralizing the city, reducing commute times and, above all, creating peri-urban socio-economic centers of interest able to relieve congestion in the capital.
The law relative to Greater Paris provides for a specific organizational model for the Grand Paris Express, whereby technical infrastructure management is handled by RATP and the operation of the lines is han-dled by operators selected through tenders.
While the reform of collective transport in Île-de-France brings all operators access to the network in free and non-discrimina-tory conditions (and formally provides for a seamless connection between the activ-ities handled by RATP and those handled by the network manager), operators have expressed reserves as to the organization model selected and the fairness of the call for competition.
F o R e x A M P L e , T h e D R I v e R L e S S M e T R o I S C e N T R A L To T h e G R e AT e R PA R I S T R A N S P o R T S T R AT e G y A N D T h e D e C e N T R A L I z AT I o N o F T h e C I T y
The initial part of the Greater Paris trans-port plan concerns the modernization and extension of the existing network. This includes extending the RER E line and the metro line, creating high-level-service buses and trams, modernizing RER trains and improving Transilien regional train lines.
The second part of the transport plan is focused on the creation of new driverless metro lines, the “Grand Paris Express”. The aim is to build 205km of metro lines and 72 new stations, to enter into service between 2018 and 2030.
As with similar projects in other large cities, the Grand Paris Express project was

1918
Sources: Wavestone research and analysis, UN data, UITP.
*In the scope of this study, the definition of “driverless metro” is slightly different from the one adopted by the UITP, that considers 55 lines. The UITP includes in its definition people movers, LRT and AGT, which is not the case of the current benchmark.
Line U2 / Line U21 Line 3
Shanghai Line 10
Barcelona Line 9
Line 10 Line 11
Brescia MetroBs
Budapest M4
M1 M2
DubaiRed Line
Green Line
Hong Kong South Island Line
KualaLumpur
Sungai Buloh-Kajang Line
Lausanne M2
Lille Line 1 Line 2
LondonDocklands Light Railway
Lyon Line D
Milan Line 5
Paris Line 1
Line 14
Rennes Line A
Rome Line C
São Paulo Line 4 Yellow
Seoul Shinbundang Line Uijeongbu - U Line
SingaporeCircle Line (CCL) North-East Line (NEL) Downtown MRT Line (DTL)
Brown Line
Toronto Scarborough RT Line 3
Toulouse Line A Line B
Turin Line 1 Vancouver
Canada Line Skytrain Expo Line
Skytrain Millenium Line
Busan Line 4
Nuremberg
Copenhagen
Taipei
Over 5m inhabitants (city population)
Between 1m and 4.9m inhabitants (city population)Under 1m inhabitants (city population)
Over 10,000 inhab./km² (population density)
Between 5,000 and 9,999 inhab./km² (population density)Under 5,000 inhab./km² (population density)
T h e W o R L D ’ S 4 0 D R I v e R L e S S M e T R o * L I N e S A R e Co N C e N T R AT e D I N T h e e M e A R e G I o N A N D S o U T h - e A S T A S I A
KEy fIgurES ON DrIvErLESS METRO LINES WORLDWIDE
AND ThE FINANCIAL PERFORMANCE OF AuTOMATION
L i s t o f D r i ve r l e s s M e t r o L i n e s Wo r l d w i d e
Wo r l d w i d e4 0 L i n e s i n 2 6 N e t w o r k s
The lines analyzed in this study are underlined
APAC: 25%APAC: 25%EMEA: 63%EMEA: 63%
2,52,53057,5
25
10
5 North America
Middle East
Asia
EuropeSouth AmericaSouth America
AMERICAS: 13%AMERICAS: 13%
Line U2 / Line U21 Line 3
Shanghai Line 10
Barcelona Line 9
Line 10 Line 11
Brescia MetroBs
Budapest M4
M1 M2
DubaiRed Line
Green Line
Hong Kong South Island Line
KualaLumpur
Sungai Buloh-Kajang Line
Lausanne M2
Lille Line 1 Line 2
LondonDocklands Light Railway
Lyon Line D
Milan Line 5
Paris Line 1
Line 14
Rennes Line A
Rome Line C
São Paulo Line 4 Yellow
Seoul Shinbundang Line Uijeongbu - U Line
SingaporeCircle Line (CCL) North-East Line (NEL) Downtown MRT Line (DTL)
Brown Line
Toronto Scarborough RT Line 3
Toulouse Line A Line B
Turin Line 1 Vancouver
Canada Line Skytrain Expo Line
Skytrain Millenium Line
Busan Line 4
Nuremberg
Copenhagen
Taipei
Over 5m inhabitants (city population)
Between 1m and 4.9m inhabitants (city population)Under 1m inhabitants (city population)
Over 10,000 inhab./km² (population density)
Between 5,000 and 9,999 inhab./km² (population density)Under 5,000 inhab./km² (population density)
Nearly 3/4 of driverless metro lines are located in cities with dense urban popula-tions (over 4,000 inhabitants/km²).
81% of driverless metro lines are located in cities with over 500,000 inhabitants.
NB: The uITP Observatory of automated metros has counted 55 lines due to including in its scope certain people mover lines, LrT systems, AgT systems, trains with a >100 passagers/train capacity (vs a capacity of >400 PAX/train for the Wavestone study), monorail trains (vs only due or 3-rails for the Wavestone study) as well as Maglev technology (vs only pneumatic or steel for the Wavestone study): scope differences with this benchmark Observatory attributable to the fact that the Wavestone study aims to compare performance on equivalent urban mass-transit technologies and use.

2120
o ve r v i e w a n d k e y F i g u r e s o f t h e Wo r l d D r i ve r l e s s M e t r o M a r k e t
86.8 76.5 74.6
51 44
Vancouver Singapore Dubai Kuala Lumpur Lille
120
93.2 76.5 74.6
57.9
France Canada Singapore UnitedArab Emirates
Italy
137
50 49 41 38 35 34 34 31 31 30
104
75 68 51
41 41 36 36 35 31 28 26
TOP 5 COUNTRIES IN TERMS OF DRIVERLESS L INE MILEAGETOP 5 COUNTRIES IN TERMS OF DRIVERLESS L INE MILEAGE
TOP 5 C IT IES IN TERMS OF DRIVERLESS L INE MILEAGE
THE MAJORITY OF DRIVERLESS METRO L INES ARE OPERATED BYPRIVATE EXTERNAL PLAYERS
OPERATORS OPERATING THE GREATEST L INE MILEAGEOPERATORS OPERATING THE GREATEST L INE MILEAGE
OPERATORS OPERATING THE GREATEST L INE MILEAGE
Managed by local player(public service)
Managed by external player(private law)
FRANCE ITALY CANADA CHINASOUTH KOREA
FRENCH ENTIT IES OPERATE NEARLY 1/4 OF THE WORLD'SNETWORKS (23 . 1%) , FOLLOWED CLOSELY BY THE ITALIANS ( 19 .2%)
5 out of the 40 linesare operated
by foreign players
87.5% of the linesare operated by
national operators
87.5% of the linesare operated by
national operators
Vancouver is the only network with 1 line managed by an external player (SNC-Lavalin)and the other 2 lines by a public player (municipal council).
KeolisSerco
Translink / B
CRTC
PrasaranaATM
SBS Transit /
Shentong Metro Group /
ComfortDelGro
Shanghai Jiushi Group
SMRT Corporation /
SMRT TrainsTMB
NeoTransTissé
oRATP
KeolisSerco
Translink / B
CRTC
PrasaranaATM TMB
Tisséo
RATP
4060
SBS Transit /
Shentong Metro Group /
ComfortDelGro
Shanghai Jiushi Group
SMRT Corporation /
SMRT Trains
23.1% 7%7%
7%19.2%

2322
/ Station: the investments involved in implementing platform doors are offset by smaller platform areas for driverless metros and, consequently, lower civil engineering costs. This results from the higher-level service of the driverless metro in terms of headways.
/ Line: the costs of driverless lines are naturally higher than those of conven-tional lines. This is largely due to com-munication and signaling. However, the use of CBTC communication is becoming more widespread for differ-ent types of metro, thereby reducing the cost gradient involved.
D R I v e R L e S S M e T R o L I N e S A R e Co N S I D e R A B Ly M o R e Co M P e T I T I v e T h A N Co N v e N T I o N A L M e T R o S A N D W I L L B eCo M e M o R e S o A S T h e y A R e I N D U ST R I A L Ly D e v e Lo P e D
Highly competitive in terms of complete cost:
/ Rolling stock: the additional cost linked to the purchase of driverless trains is offset by a gain in the sizing of the rolling stock, since automatic systems have better performance (headways / commercial speeds). For the same service frequency, the driver-less metro requires 33%* fewer trains.
In terms of global costs per km, the driverless metro is more competitive than the conventional metro for a
depreciation of infrastructure and rolling stock of over
30 years.
Hypotheses: Average line length of 14.5km, 30 trains per line, 22 stations on average per line, 200 drivers to operate a line.
Sources: LVMT Laboratoire ville mobilité transport, The Economics of Urban Transportation 2007,
/ Operating costs: the additional cost linked to the maintenance of platform protection systems is offset by savings on personnel costs and energy costs (15% lower for driverless metro lines).
*Rolling stock manufacturers, Wavestone analysis.
I n ve s t m e n t C o s t s p e r k m ( i n € m i l l i o n ) o p e r a t i n g C o s t s p e r k m ( i n € m i l l i o n )
15
87
15
108
2721
Classic metro Automatic metro
Lines Stations Rolling stock
0.15 0.13
0.3 0.36
0.2 0.2
0.5
Classic metro Automatic metro
Energy Maintenance
Staff Staff on board
+12% –40% 15
87
15
108
2721
Classic metro Automatic metro
Lines Stations Rolling stock
0.15 0.13
0.3 0.36
0.2 0.2
0.5
Classic metro Automatic metro
Energy Maintenance
Staff Staff on board
+12% –40%

2524
oPeRAToRS NeeD To ADoPT TheIR kNoW-hoW To The GRoWING USe oF CBTC TeChNoLoGy
CBTC technology is the preferred sig-naling solution with a 68% share of the market. This solution combines safety and optimized frequency.
The market of CBTC solutions suppliers is highly concentrated: the top 3 suppliers, namely Bombardier, Siemens and Thales, have a 78% share of the market (including for non-automatic trains and metros).
The convergence of manufacturers towards CBTC, as well as the invest-ments involved (Invensys was bought out
by Siemens in 2013), indicate the future widespread use of the technology in the rail sector in general and driverless metros in particular.
All the metro systems analyzed in this study are equipped with CBTC signaling and communication. A wide range of sup-pliers are represented by the benchmark (see graph opposite).
The Lille network is currently being redesigned and the new system is to be equipped with Urbalis, supplied by Alstom. But the delay in the project (esti-mated at 4 years) means that the current system (supplied by Siemens) will be maintained for the next few years.
TEChNOLOgICAL TrENDS AND ChALLENgES IN METrO AuTOMATION
T h e S h A R e o F P N e U M AT I C T I R e S I S FA L L I N G To T h e B e N e F I T o F ST e e L W h e e L- R A I L L I N k S D U e To T h e S P eC I F I C e x P e RT I S e A N D M A I N T e N A N C e Co N ST R A I N T S I N vo Lv e D
10 manufacturers supplying rolling stock. Bombardier, Alstom and Siemens are the leaders with 68% of total installed mileage.
The preferred wheel-rail link in the mileage built in the last decade is steel, accounting
for 70% of total mileage built. But pneu-matic links have an advantage in terms of sound levels and passenger comfort.
The know-how of the operator and tech-nological expertise are decisive. The two technologies have their specific charac-teristics in operation, with pneumatic systems requiring know-how in mainte-nance. In this respect, some operators, such as Serco and ATM, appear to prefer steel links.
• Better grip, system adapted to cities with sharp gradients
• Less noise inside and better passenger comfort
• Better adapted to automated system by avoiding wheel slip
• Not particularly energy efficient (+1% to 3%)• Leads to higher maintenance costs • Makes the system heavier, which means it
consumes more energy• higher fine-particle emissions than steel
M a r k e t S h a r e o f S t e e l v s . P n e u m a t i c f o r A n a l y z e d S a m p l e ( i n % )
• Lower energy consumption owing to reduced rail friction
• Better adapted to metro systems in cities with difficult weather conditions (e.g. Dubai, Nordic countries, etc.)
• Lower maintenance costs
• recurring slip of train-rail link leading to control system problems
• Longer headways owing to longer breaking and acceleration times
+
– –
+
London (DCL)CopenhagenMilanVancouverDubaiBarcelonaNuremberg
ToulouseLille
RennesLyon (D)
LausanneParis (1 & 14)
TurinTaipei
M a r k e t S h a r e * o f C o m m u n i c a t i o n S y s t e m S u p p l i e r s ( i n % )
*Frost & Sullivan data, Wavestone analysis.
40
20
19
22 Siemens
Thales
Bombardier
Other actors
B r e a k d o w n o f C B TC S u b c o n t r a c t o r s i n t h e S a m p l e S t u d i e d ( n u m b e r o f l i n e s )
Sources: World Report on Metro Automation - July 2016, UITP.
Siemens
Thales
Ansaldo STS
Bombardier
Taipei
Alstom
1
Lausanne
1
Milan (1), Copenhagen (1)
2
London (1), Dubai (2), Vancouver (3)
6
Toulouse (2), Lille (2), Rennes (1), Paris (2), Turin (1), Barcelona (1), Nuremberg (2)
12
Pneumatic Steel
48 52
p n e u M at i c s t e e l

2726
/ The possible creation of new main-tenance workshops adapted to solutions that are often specific to driverless metro lines, such as plat-form doors.
Operationally speaking, operators need to:
/ Ramp up the driverless rolling stock during the transition phase operating in combined mode. Operators have to make this transition with as few interruptions as possible. The com-missioning phase increases risks in service quality and requires specific expertise on the part of the operator.
Organizationally speaking, operators need to:
/ Redeploy driving staff to con-nected positions (line control and supervision).
/ Upskill existing staff or hire the new employees required to ensure the operation and maintenance of driv-erless lines.
W h AT D o e S A U To M AT I o N I N v o Lv e F o R o P e R ATo R S ?
Technically speaking, operators need to:
/ Carry out the prerequisite work for the installation of platform doors necessary for optimizing passenger safety.
/ Roll out the automation system for train operation, which differs depend-ing on the desired headways:
• For long headways, operators can opt for a fixed-block com-munication system (in which the position of the train is determined relative to a section of the line). This is a mature technique used by driverless and manual metro lines. However, because it is only moderately precise, it cannot be used for short headways.
• For short headways, operators are required to implement a mobile-block communication system (in which train position and speed are determined in a precise manner). This necessarily calls for the roll-out of additional technologies, namely ATP*, ATC* and ATO*. This in turn leads to additional risks (of a technical nature).
T h e o U T Lo o k F o R T h e D e v e Lo P M e N T o F D R I v e R L e S S M e T R o L I N e S Lo o k S R o B U S T T h R o U G h 2 0 2 0 , D R I v e N B y L A R G e - S C A L e P R oJ e C T S
With more and more people living in cities, mass transit systems increasingly have to:
/ Optimize the exist ing urban infrastructure as capacity can be extended only to a limited extent. The solution in this case is the automation of conventional lines.
/ Develop new infrastructure on the outskirts of cities offering users high-quality service while keeping costs under control.
Automated technologies propose solu-tions meeting both these requirements.
According to the UITP, by 2025 some 2,300km of driverless metro lines will be in operation, compared with around 800km today.
The increasingly widespread use of CBTC technology by all driverless metro lines together with rising living standards in emerging countries will boost the com-petitiveness of automation solutions and increase demand.
In 2025, Asia and Europe are expected to account for 33% and 30% of driverless metro mileage, followed by the Middle East (25%) with ambitious projects such as the Riyadh metro.
China has announced the introduction of two new driverless lines between now and end-2017, one of them built exclusively with Chinese technologies.
ThE DEvELOPMENT OuTLOOK fOr DRIVERLESS METRO L INES
Source: World Report on Metro Automation - July 2016, UITP.
*The estimated number of kilometers by 2020 takes account of construction and/or automation projects confirmed as of July 2016.
0
200
400
600
800
1,000
1,200
1,400
1,600
1,800
2,000
1990 2000 2010 2020*
103%
143%
276%
Completed and Projected Driver less Metro L ines* in km and Growth over 10 years
*See glossary.

2928
DESCRIPTION OF SCOPE AND METhODOLOgy

3130
Line U2 / Line U21 Line 3
Shanghai Line 10
Barcelona Line 9
Line 10 Line 11
Brescia MetroBs
Budapest M4
M1 M2
Dubai Red Line
Green Line
Hong Kong South Island Line
KualaLumpur
Sungai Buloh-Kajang Line
Lausanne M2
Lille Line 1 Line 2
LondonDocklands Light Railway
Lyon Line D
Milan Line 5
Paris Line 1
Line 14
Rennes Line A
Rome Line C
São Paulo Line 4 Yellow
Seoul Shinbundang Line Uijeongbu - U Line
Singapore Circle Line (CCL) North-East Line (NEL) Downtown MRT Line (DTL)
Brown Line
Toronto Scarborough RT Line 3
Toulouse Line A Line B
Turin Line 1
Vancouver Canada Line
Skytrain Expo Line Skytrain Millenium Line
Busan Line 4
Over 5m inhabitants (city population)
Between 1m and 4.9m inhabitants (city population)Under 1m inhabitants (city population)
Over 10,000 inhab./km² (population density)
Between 5,000 and 9,999 inhab./km² (population density)Under 5,000 inhab./km² (population density)
Nuremberg
Copenhagen
Taipei
D ATA A CC e S S A N D R e L I A B I L I T y e N A B L e D U S To A N A Ly z e 2 5 D R I v e R L e S S M e T R o L I N e S * o U T o F T h e ToTA L 4 0 e x I S T I N G I N F e B R U A R y 2 0 1 7 W I T h I N T h e S Co P e o F T h e S T U Dy
C r i t e r i a U s e d t o D e f i n e S c o p e
SCOPE OF ThE STuDyL i s t o f D r i ve r l e s s M e t r o L i n e s Wo r l d w i d e
Network included in the comparative analysisNetwork not included in the analysis due to the unavailability or unreliability of information
Driverless metro*: a dedicated, rail-powered circuit mainly used for com-mutes, with several carriages (up to 6 or 8), raised access and a capacity of over 400 passengers
*The terms used in the study are defined in the glossary.
Pneumatic or steel rail link
Dual-rail or third-rail systems
Automation level GoA 3 and 4*
Not including automated people-mover*, light rail transit* and automated
guideway transit* systems
Excluding Maglev and Hyperloop rail links
Excluding monorail
Automation level GoA 1 and 2* excluded

3332
P e r f o r m a n c e F i e l d s S e l e c t e d f o r t h e B e n c h m a r k
The difference in performance between 2 driverless metro lines can be attributed to a great extent by the operator’s ability to effectively operate the lines in question. Infrastructure and
rolling stock are key to the performance of a network but with room for maneuver in the much longer term.
B e N C h M A R k M e T h o D o Lo G y
1 Performance of infrastructure and rolling stock
2 Service reliability and quality
2 Auxiliary or innovative services
Commercial speed
Distance between stations
headway
Accessibility
Intrusion rate in network
1
Punctuality and/or availability and/or regularity
Cleanliness
Passenger information
Passenger safety
1.5
Available communication networks
Innovative mobility service (route planner, etc.)
New technologies (NFC, IoT, mobile)
Field assessed but not included in the final grade attributed to each metro line
indicators concernedperforMance field proposed weighting
Icons denoting the fields to which the analysis of each page refers

3534
SuMMARy OF ThE COMPARATIVE ANALySIS OF DRIVERLESS METRO
L INES

3736
The performance of a transport system – including driverless metros – is impacted by a set of factors external to the orga-nization of the operator or transport authority
This means that the distinctive character-istics of each network have to be taken into account in order to contextualize the analysis
Consequently, the following character-istics or factors need to be considered when comparing performance:
The age of the network: entailing growing obsolescence costs with the age of the infrastructure and rolling stock, as well as the corre-sponding adapted processes for maintaining the line in operational condition.
The requirements included in the delegation contract (headways): involving an operational strategy on the part of the operator capa-ble of delivering performance consistent with contractual requirements.
T h e P e R F o R M A N C e o F T h e W o R L D ’ S D R I v e R L e S S L I N e S : A P e R F e C T B A L A N C e B e T W e e N I N F R A S T R U C T U R e A N D o P e R AT I o N AT T h e S e R v I C e o F PA S S e N G e R S
The performance of driverless metro lines is assessed through a complex equation of the operational ability to deliver a trans-port service adapted to mobility behavior and the optimization of the transport con-ditions of the journey experience.
/ The correlation between the strong constraints imposed by transport authorities (short headways) and the punctuality of the service is vital to performance.
/ Ageing networks require opera-tional overperformance on the part of operators.
/ The experience operators have of a network and their length of service are decisive to the performance of an driverless metro line.
The design, construction and commis-sioning of an driverless metro line present value added for the city and its popula-tion, as vital as it is a difficult activity for transport authorities and operators.
The most recent driverless lines and net-works demonstrate high levels of reliabil-ity that need to be maintained over the long term if they are to become world leaders.
The architecture and geography of the network: involving the uneven exposure of rolling stock to its environment (underground, overground) and specific needs for fulfilling transport demand (air conditioning, heating).
The “load curve” (breakdown of passenger use over the day): involving peaks of varying extent that may have an impact on punc-tuality (passenger incidents, etc.).
The socio-cultural characteristics of the user population: involving the uneven use of public services, with particular impact on cleanli-ness and safety.
*Factor taken into account in the grade attributed to the metro line.
**Factor not taken into account in the grade, but assessed in the analysis of the results.
Sources: Wavestone grades and modeling.
The grade being the weighted sum of infrastructure performance (weight=1), operational performance (weight=1.5) and the network age indicator (weight=0.5).
PERSPECTIVE G r a d e s f o r t h e P e r f o r m a n c e o f D r i ve r l e s s M e t r o L i n e s ( o u t o f 5 ) I n f r a s t r u c t u r e x o p e r a t i o n / N e t w o r k a g e
2.1
2.3
2.4
2.5
2.6
2.7
2.8
2.9
3
3.1
3.1
3.1
3.2
3.6
3.7
3.8
3.8
3.8
3.9
4
4
4
Vancouver - Millenium Line
Vancouver - Canada Line
Milan - Line 5
Barcelona - Line 9
Lausanne - M2
Paris - Line 1
Nuremberg U3
Nuremberg U2
Dubai - Green line
Dubai - Red line
Turin - Line 1
Copenhagen - M1/M2
Toulouse - Line B
Vancouver - Expo Line
Paris - Line 14
Rennes - Line A
Lyon - Line D
Taipei - Wenhu Line
Toulouse - Line A
London - Docklands Light Railway
Lille - Line 1
Lille - Line 2
27 - 37
SercoTBM
Tisséo
KeolisSNC Lav.
RATP
ATMBCRTC
GTT
TLTRTCVAG
0 0.5 1 1.5 2 2.5 3 3.5 4.5 54
*
*
**
**
**

3938
T h e P e R F o R M A N C e o F T h e I N F R A S T R U C T U R e A N D R o L L I N G S To C k o F T h e W o R L D ’ S D R I v e R L e S S M e T R o L I N e S U N D e R P I N S T h e I R S A F e T y A N D Co M F o R T
Infrastructure and rolling stock perfor-mance involves:
/ Strategies on urban mobility flow management: the design of a driv-erless metro line, from upstream research to the layout of the line and the choice of stations, determines the relevance of a line and its utilization success.
/ Network access: an infrastructure that makes access easier for people with mobility issues or harder for fraudulent users contributes to over-all quality.
/ Matching operating requirements and expected use: the optimization of infrastructure and rolling stock hinges on aligning service levels with use.
Infrastructure operation and maintenance serve to maintain performance levels over the long term. This challenge tests the operational performance of operators.
T h e h I G h e S T- P e R F o R M A N C e D R I v e R L e S S M e T R o L I N e S S h A R e T h e S A M e C h A R A C T e R I S T I C S o F e xC e L L e N C e
The best driverless metro transport services all score high on 4 key points related to infrastructure and operation:
Grades for the Performance of Infrastructure and Rol l ing Stock* (out of 5)
*The sum of the grade attributed to the performance of the network and stock (weight=1) and the grade attributed to the aged of the infrastructure (weight=0.5) (5 corresponds to very old infrastructure).
INfrASTruCTurE AND rOLLINg STOCK PErfOrMANCE
Scoring de performance de l’infrastructure et du matériel roulant*
29 - 39
2.6
2.5
2.6
2.6
2.6
2.7
2.9
3.0
3.0
3.1
3.2
3.2
3.5
3.7
3.7
3.8
3.8
3.9
4.2
4.2
4.3
4.3
Vancouver - Canada Line
Lausanne - M2
Paris - Line 1
Barcelona - Line 9
Dubai - Green line
Dubai - Red line
Nuremberg U3
Milan - Line 5
Nuremberg U2
Vancouver - Millenium Line
Turin - Line 1
Copenhagen - M1/M2
Toulouse - Line B
Rennes - Line A
Lyon - Line D
Taipei - Wenhu Line
London - Docklands Light Railway
Paris - Line 14
Lille - Line 1
Lille - Line 2
Toulouse - Line A
Vancouver - Expo Line
SercoTBM
Tisséo
KeolisSNC Lav.
RATP
ATMBCRTC
GTT
TLTRTCVAG
0 0.5 1 1.5 2 2.5 3 3.5 4.5 54
The strong punctuality of the lines managed by these operators confirms their commitment to demanding trans-port authorities.
These operators demonstrate excel-lence in the management of old assets. As confirmed by the impressive availability and regularity of their networks.
Globally speaking, the surveys led by these operators confirm a good level of user satisfaction, knowing that ageing infrastructure has a negative impact on passenger perception in this area.
This is a defining characteristic of driv-erless metro lines. But combined with
short headways it confirms the abil-ity of an operator to respect
the requirements imposed by the transport authority.
the able ManageMent of ageing infrastructure
strong punctuality
high-level user satisfaction relative to cleanliness
and safetyshort headways
PUNCTUALITY
INFR
ASTRUCTURE
COMFORTHEADWAYS

4140
F o U R M A I N C AT e G o R I e S o F I N F R A S T R U C T U R e A N D R o L L I N G S To C k P e R F o R M A N C e F o R D R I v e R L e S S M e T R o L I N e S
The entities in this category operate infrastructure and rolling stock that are several years old. Their strong performance reflects their optimal use of these assets, which requires good operating conditions on the
part of the transporters.
The input of operators in this category is clearly a factor in the performance of the assets. The
advanced age of the rolling stock suggests considerable maturity on the part of the operator in terms of
maintenance and operations.
The players operate infrastructure and rolling stock that are generally recent and even new. Their strong performance may be considered as resulting from the newness of the network. At this stage, the good
performance of the rolling stock cannot be correlated to any operator input.
The entities in this category have difficulties maintaining their rolling
stock in optimal operating condition, independently of the fact that their stock is new. As such, the ageing
of the infrastructure and the rolling stock will have a considerable impact
on performance.
EFFICIENThIGh PeRFoRMANCe/
oLD NeTWoRk
AgILEAveRAGe PeRFoRMANCe/
veRy oLD NeTWoRk
BEgINNErhIGh PeRFoRMANCe/
ReLATIveLy NeW NeTWoRk
STruggLINgLoW PeRFoRMANCe/
ReLATIveLy NeW NeTWoRk
0
5
10
15
20
25
30
35
40
3
3.2
3.4
3.6
3.8
4
4.2
4.4
4.6
4.8
5
Infra
stru
ctur
e an
d ro
lling
stok
per
form
ance
(out
of 5
)
Age o
f inf
rastr
uctu
re (i
n ye
ars)
Laus
anne
- M2
Paris
- Lin
e 1Va
ncou
ver -
Cana
da Li
ne
Barce
lona -
Line
9Du
bai -
Gree
n line
Nure
mberg
U3
Milan -
Line
5
Duba
i - Re
d line
Nure
mberg
U2
Turin
- Lin
e 1Co
penh
agen
- M1/M
2
Vanc
ouve
r - M
illeniu
m Line
Toulo
use -
Line
B
Renn
es -
Line A
Lyon
- Lin
e D
Taipe
i - W
enhu
Line
Lond
on -
Dock
lands
Ligh
t Rail
way
Paris
- Lin
e 14
Lille
- Line
1
Lille
- Line
2
Toulo
use -
Line
A
Vanc
ouve
r - Ex
po Li
ne
Vancouver - Millenium Line
Age of infrastructure Performance infrastructure rolling stock

4342
L I N e D e N S I T y I S A FA C To R I N T h e R e D U C T I o N o F T R Av e L T I M e S , T h e I M P R o v e M e N T o F T h e PA S S e N G e R e x P e R I e N C e A N D T h e o P T I M I z AT I o N o F I N F R A S T R U C T U R e
Driverless metro networks are character-ized by short distances between stations.
European lines are denser in this respect than international lines, mainly because European cities have smaller surface areas and users prefer public transport to walking.
Adding more stations to a network or line involves additional operating constraints (the more stations, the higher the punc-tuality risk). The operators of European networks appear to be more exposed to this type of constraint.
Short distances between stations help operators to maintain reasonable travel times between stations at low speed. They also limit infrastructure wear and reduce the resulting maintenance costs.
Co M M e R C I A L S P e e D , A k e y C h A R A C T e R I S T I C I N T R A N S P o R T S e R v I C e , I S A Co R e P e R F o R M A N C e A S S e S S M e N T I T e M
VAL rolling stock is the most represented in the study sample, accounting for 35% of lines. It is operated at low speeds on some lines (such as Turin) and high speeds on others (Lille and Taipei). In addition, some operators appear to have experience with and a preference for a single type of roll-ing stock (Ansaldo Breda for ATM, for example).
End-to-end line times depend mainly on station stop times. Commercial speed is thus inversely proportional to the density of stations on a given line (see previous slide vs. graph opposite).
By optimizing acceleration and braking times, driverless metro lines increase the average commercial speed of “dense” lines.
High commercial speed entails additional operating constraints. Operators manag-ing low-speed lines only may find it dif-ficult to effectively operate high-speed lines.
EuropeNorth America
Middle EastAsia
0 20
0 400 60
0 80
0 1,0
00 1,2
00 1,4
00 1,6
00 1,8
00
Lausanne - M2
Rennes - Line A
Nuremberg U3
Turin - Line 1
Milan - Line 5
Paris - Line 1
Lille - Line 2
Toulouse - Line A
Lille - Line 1
London - Docklands Light Railway
Toulouse - Line B
Nuremberg U2
Lyon - Line D
Copenhagen - M1/M2
Taipei - Wenhu Line
Paris - Line 14
Barcelona - Line 9
Dubai- Green line
Vancouver - Canada Line
Vancouver - Expo Line
Vancouver - Millenium Line
Dubai - Red line
Average = 967m
A ve r a g e D i s t a n c e B e t w e e n S t a t i o n s ( i n m ) A ve r a g e C o m m e r c i a l S p e e d ( i n k m / h )
0 5 10 15 20 25 30 35 40 45
Lausanne - M2
London - DocklandsLight Railway
Turin - Line 1
Nuremberg U3
Milan - Line 5
Barcelona - Line 9
Lyon - Line D
Paris - Line 1
Dubai - Green line
Rennes - Line A
Toulouse - Line B
Toulouse - Line A
Lille - Line 1
Lille - Line 2
Nuremberg U2
Vancouver - Canada Line
Paris - Line 14
Copenhagen - M1/M2
Taipei - Wenhu Line
Dubai - Red line
Vancouver -Millenium Line
Vancouver - Expo Line INNOVIA Métro(Bombardier)
Kinki Sharyo
VAL (Siemens)
Ansaldo Breda
MP14 (Alstom)
EMU Rotem (Hyundai/Mitsubishi)
VAL (Siemens)
Kinki Sharyo
MP05 (Alstom)
MPL85 (Alstom)
Série 9000 (Alstom)
AnsaldoBreda
VAL (Siemens)
B2007 (Bombardier)
Be 8/8 TL (Alstom)
DT3 DT3-F (Siemens)
DT1 DT2DT3 DT3-F (Siemens)
SercoTBM
Tisséo
KeolisSNC Lav.
RATP
ATMBCRTC
GTT
TLTRTCVAG
Average = 33.1km/h
Low
spee
d

4544
D R I v e R L e S S M e T R o L I N e S G e N e R A L Ly P R o v I D e I M P R o v e D A CC e S S F o R PA S S e N G e R S
The ChoICe oF INFRASTRUCTURe ACCeSS IS CRUCIAL To FRAUD RATeS . oPeN SySTeMS* FoSTeRING AN eNhANCeD CUSToMeR exPeRIeNCe LeAD To PooR ReSULTS IN ThIS ReSPeCT
Platform access gates are decisive in the fight against fraud.
The two networks still without these gates (Lille and Rennes) have fraud rates of over 10%, compared with 7% for networks with gates. However, the DLR line in London remarkably has the lowest fraud rate despite lacking access gates.
The installation of access gates is often a joint decision by the operator and the transport authority. Access gates appear to be much more effective at limiting fraud than an increase in (often random) ticket inspections by the operator.
The socio-economic characteristics of the cities and neighborhoods served by the metro line are also a key factor in this respect, with the fraud rate varying on the same line from one station to the next. Operators are powerless against this vari-able but it does negatively impact their operations over the long term.
e s t i m a t e d F r a u d R a t e ( i n % )
Station accessibility is generally related to infrastructure and thus to the transport authority’s approach to the issue. however, the availability of the implemented solutions results from
the performance of operators. Besides the fact that this availability remains difficult to measure, the metro lines analyzed have high accessibility as a whole, resulting from standardized
construction compliant with new standards and good rolling stock access (reduced distance between platform and train).
10% of the lines surveyed have limited accessibility: fewer than
80% of the stations are equipped for people with reduced mobility
87% of the metro lines analyzed have high
accessibility: more than 90% of the total number of stations
are equipped for passengers with reduced mobility
3% of the lines analyzed have average accessibility: more than
80% of the stations are equipped for people with reduced mobility
Low Accessibility
Average Accessibility
high Accessibility
* A system is considered as “open” if access to the metro network is not controlled by gates.
34 - 45
0 2 4 6 8 10 12 14 16
Lille - Line 1 / Line 2
Rennes - Line A
Lyon - Line D
Vancouver - Expo Line / Millenium Line
Vancouver - Canada Line
Turin - Line 1
Barcelona - Line 9
Toulouse - Line A / Line B
Lausanne - M2
Paris - Line 1 / Line 14
Copenhagen - M1/M2
Milan - Line 5
Nuremberg - U2
Nuremberg - U3
London - DocklandsLight Railway
Estimated fraud rate (%)
Average = 4 %
OPEN SYSTEM
OPEN SYSTEM
OPEN SYSTEM
Europe North America

4746
F R e N C h D R I v e R L e S S M e T R o L I N e S A R e e x T R e M e Ly R e L I A B L e , A q UA L I Ty R e I N Fo R C e D By e x P e RT I S e I N T h e o P e R AT I o N o F AG e I N G N e TWo R k S
Reliability and service quality are key factors in driverless metro line operational performance, determining:
/ The passenger experience
/ The rhythm of the service
Performance in this area is an oper-ational signature that also creates the relational signature of the net-work: a memorable mass transit experience or, on the contrary, an unpleasant experience encouraging customers to use other transport modes.
SERVICE RELIABIL ITy AND quALITy PERFORMANCE
35 - 46
SercoTBM
Tisséo
KeolisSNC Lav.
RATP
ATMBCRTC
GTT
TLTRTCVAG
1.8 2.0
2.2 2.5
2.7 2.8 2.8 2.8
3.0 3.0 3.0 3.0
3.3 3.3
3.5 3.7
3.8 3.8 3.8 3.8 3.8
4.2
0 0.5 1 1.5 2 2.5 3 3.5 4 4.5
Milan - Line 5
Vancouver - Millenium Line
Vancouver - Canada Line
Barcelona - Line 9
Lausanne - M2
Paris - Line 1
Nuremberg - U2
Nuremberg - U3
Turin - Line 1
Copenhagen - M1/M2
Toulouse - Line B
Vancouver - Expo Line
Dubai - Green line
Dubai - Red line
Paris - Line 14
Toulouse - Line A
Rennes - Line A
Taipei - Wenhu Line
Lyon - Line D
Lille - Line 1
Lille - Line 2
London - DocklandsLight Railway 99.11 % / 30 yrs
99.80 % / 28 yrs
99.80 % / 34 yrs
97.23 % / 26 yrs
99.73 % / 21 yrs
99.66 % / 15 yrs
99.50 % / 24 yrs
99.70 % / 19 yrs
99.23 % / 8 yrs
99.83 % / 6 yrs
96.00 % / 31 yrs
99.50 % / 10 yrs
98.80 % / 15 yrs
99.90 % / 11 yrs
99.00 % / 9 yrs
99.00 % / 7 yrs
99.70 % / 6 yrs
93.00 % / 9 yrs
94.72 % / 8 yrs
96.00 % / 8 yrs
96.00 % / 15 yrs
96.00 % / 4 yrs
Punctuality**
GradeAgeing
network
G r a d e s f o r R e l i a b i l i t y a n d S e r v i c e q u a l i t y P e r f o r m a n c e * ( o u t o f 5 )
*The sum of the grade attributed to reliability and service quality (weight=1) and the grade attributed to the age of the infrastruc-ture (weight=0.5) (5 corresponds to very old infrastructure).
** According to data availability and/or reliability, the figure may concern punctuality, availability or regularity (see glossary for definitions).

4948
T h e A G e o F T h e N e T W o R k A N D R o L L I N G S To C k h A S A S T R o N G I M PA C T o N o P e R AT I o N A L R e L I A B I L I T y
Infrastructure age is key to the reliability of service. The deterioration of service qual-ity is correlated to the ageing of assets (see graph above).
As it ages, infrastructure becomes less robust and limits the commercial speed of the line.
For example, the ageing of rolling stock and stations has a direct impact on how passengers perceive cleanliness.
To ensure short headways, ageing infra-structure and rolling stock require sub-stantial experience on the part of the operator. Failing which, maintenance costs rise drastically.
0
5
10
15
20
25
30
35
40
1
1.5
2
2.5
3
3.5
4
4.5
5
Relia
bilit
y an
d se
rvice
qua
lity
perfo
rman
ce (o
ut o
f 5)
Average 3.4
13
20
Infra
struc
ture
and
rolli
ng st
ock a
ge (i
n ye
ars)
Laus
anne
- M2
Paris
- Lin
e 1
Vanc
ouve
r - Ca
nada
Line
Barce
lone -
Line
9
Nure
mberg
U3
Milan -
Line
5
Duba
i - Gr
een l
ine
Duba
i - Re
d line
Nure
mberg
U2
Turin
- Lin
e 1Co
penh
ague
- M1/M
2
Vanc
ouve
r - M
illeniu
m Line
Toulo
use -
Line
B
Renn
es -
Line A
Lyon
- Lin
e D
Taipe
i - W
enhu
Line
Lond
on -
Dock
lands
Ligh
t Rail
way
Paris
- Lin
e 14
Lille
- Line
1
Lille
- Line
2
Toulo
use -
Line
A
Vanc
ouve
r - Ex
po Li
ne
Vancouver - Millenium Line
Age of infrastructure Performance infrastructure & Rolling stock

5150
h I G h Ly S T R o N G vA R I AT I o N S I N C U S To M e R A U T h o R I T y S TA N D A R D S FAv o R I N G T h e P e R F o R M A N C e o F C e R TA I N L I N e S A N D e R o D I N G T h AT o F oT h e R S
Punctual operators are able to deliver punctuality performance only when headway requirements are longer. Any pressure to shorten those headways may considerably worsen their performance.
European operators, and French operators in particular, lead the way in terms of punctuality performance. Their experience, built on the margins of the high-level requirements of their respective transport authorities, brings them a major advantage over other operators.
“Under-performers” are unable to ensure decent punctuality, even for long headways. Any transport-authority demands to shorten headways will significantly impact service levels.
The short headways required by the transport authority appear to put the operators in the “trying to perform” category under pressure. BCRTC is currently struggling to deliver punctuality for short headways.
PuNCTuAL SuPER-PERFORMERS
uNDER-PERFORMERS TryINg TO PErfOrM
While headways are generally the responsibility of transport authorities, their respect as part of a punctual service shows the ability of some operators to deliver high-level service under strong
constraints. This is the case with the “Punctual” and “Super-performing” categories. *Assessment method: the assessment is made comparatively between the lines analyzed. The maximum grade of 5 corresponds to the best headway/punctuality identified, the minimum being 1. Distribution within this range of grades is made in a proportional manner.
Trying to perform
Super-performersPunctual
under-performers1
0 1 2 3
2
3
4
5
Perfo
rman
ce p
unct
ualit
y* (o
ut o
f 5)
4 5
Average
Aver
age
3.3
London DLR - KeolisDubai Green - Serco Turin - GTT
Nuremberg - VAG
Dubai Red - Serco
Vancouver - MilleniumLine - BCR
Milan - ATM
Barcelona - TBM
Paris 1 - RATPTaipei - Wenhu Line - TRT
Rennes - Keolis
Paris 14 -RATP
Toulouse A - Tisséo
Lille 1 - Keolis
Lyon D - Keolis
Vancouver - Expo Line - BCR
Copenhagen - ATM
Vancouver - Canada Line - PBC
Lausane M2 - TPL
Performance cadence* (out of 5)Performance cadence* (out of 5)
Toulouse B - Tisséo
Lille 2 - Keolis
Vancouver - Millenium Line

5352
A LT h o U G h D I F F I C U LT To A N A Ly z e o W I N G To I T S S U B J e C T I v e N AT U R e , S AT I S FA C T I o N W I T h C L e A N L I N e S S P L Ay S A C R U C I A L R o L e I N T h e e x P e R I e N C e o F PA S S e N G e R S
The satisfaction rate of users relative to the cleanliness of the network and rolling stock varies. It is closely linked to the (often subjective) perception of users.
While the satisfaction rate used in this study corresponds to people having reported a positive opinion, the com-parison cannot be exact. This is because customer surveys are not the same for all the lines, which can bias comparisons to a certain extent.
Ageing infrastructure and rolling stock can play an important role in the perception of users. But the performance of operators on cleanliness remains decisive, as shown by the mediocre satisfaction ratings of certain lines (including Turin and Milan).
T h e S A F e T y o F A M e T R o L I N e R e F L e C T S U S e R P e R C e P T I o N S o F T h e N e T W o R k A N D T h e S o C I o - e Co N o M I C S I T U AT I o N o F T h e U R B A N A R e A S S e R v e D
The safety of a metro line depends directly on the surrounding environment. The safety performance of a metro line is directly related to that of the city in ques-tion, and more specifically the different areas of that city.
Lines in cities such as Dubai, Copenhagen and Taipei benefit from the high levels of safety existing outside the metro in the city itself.
Safety quality is often judged by users in terms of the entire network. The grades of metro lines such as lines 1 and 14 in Paris, reputed to be the city’s safest, are lowered by the poor perception of the network as a whole.
Some lines serving areas far from the center with sensitive socio-economic sit-uations appear to be more exposed to a drop in the overall safety level and, hence, a drop in user satisfaction (for example, Toulouse, Lyon and Lille).
*Satisfaction rate estimated via observations and com-parisons between metro lines.
*Satisfaction rate estimated via observations and com-parisons between metro lines.
C l e a n l i n e s s S a t i s f a c t i o n R a t e ( p o s i t i ve o p i n i o n i n % )
S a f e t y S a t i s f a c t i o n R a t e ( p o s i t i ve o p i n i o n i n % )
38 - 52
Cleanliness satisfaction rate (positive opinion)*
Milan - Line 5
Vancouver - Millenium & Expo Line
Lille - Lines 1 & 2
Nuremberg - U2 & U3
Turin - Line 1
Dubai - Green & Red line*
Copenhagen - M1/M2
Vancouver - Canada Line
London - Docklands Light Railway
Toulouse - Lines A & B
Paris - Lines 1 & 14
Lausanne - M2
Taipei - Wenhu Line
Rennes - Line A
Barcelona - Line 9
Lyon - Line D
Average = 86.9%
60 70 80 90 1000
SercoTBM
Tisséo
KeolisSNC Lav.
RATP
ATMBCRTC
GTT
TLTRTCVAG
39 - 53
60 70 80 90 100
Milan - Line 5
Toulouse - Lines A & B
Barcelona - Line 9
Paris - Lines 1 & 14
Lyon - Line D*
Vancouver - Millenium & Expo Line
Lille - Lines 1 & 2
Turin - Line 1
Rennes - Line A*
Vancouver - Canada Line
Lausanne - M2
Nuremberg - U2 & U3*
London - Docklands Light Railway
Taipei - Wenhu Line
Dubai - Green & Red line*
Copenhagen - M1/M2
Safety satisfaction rate (positive opinion)
Average = 80%
0
SercoTBM
Tisséo
KeolisSNC Lav.
RATP
ATMBCRTC
GTT
TLTRTCVAG
5554
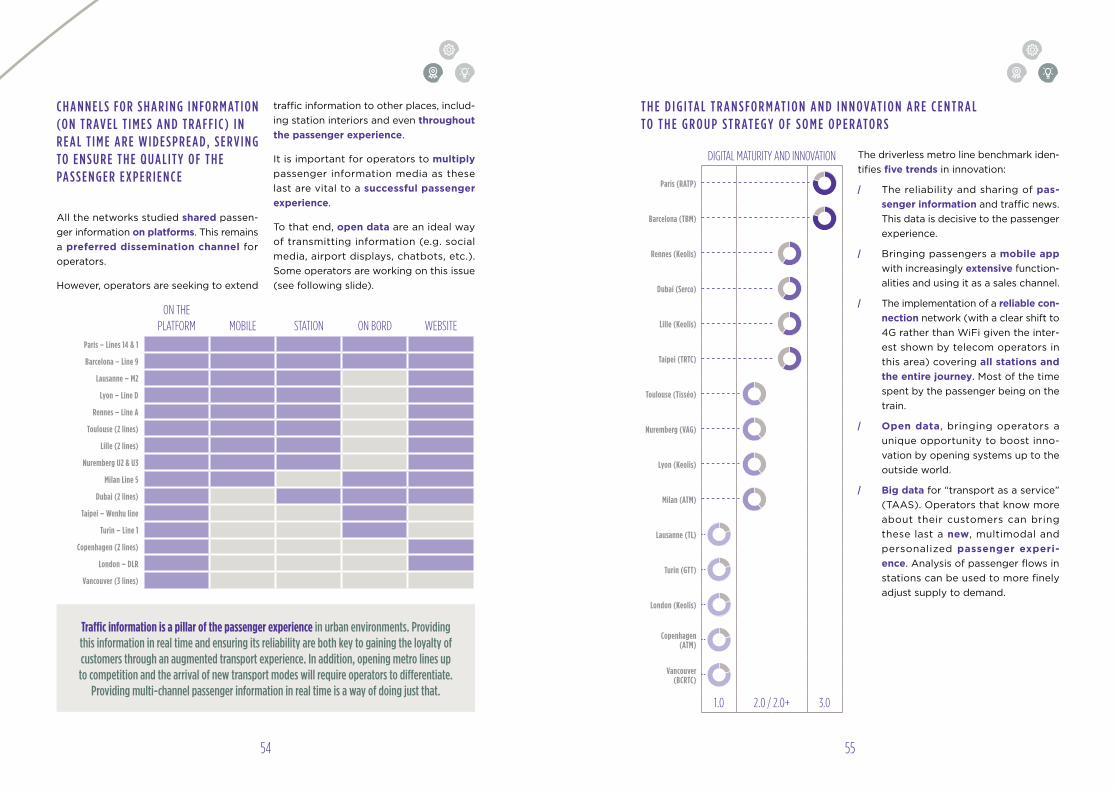
C h A N N e L S Fo R S h A R I N G I N Fo R M AT I o N (o N T R Av e L T I M e S A N D T R A F F I C ) I N R e A L T I M e A R e W I D e S P R e A D, S e R v I N G To e N S U R e T h e q UA L I Ty o F T h e PA S S e N G e R e x P e R I e N C e
All the networks studied shared passen-ger information on platforms. This remains a preferred dissemination channel for operators.
However, operators are seeking to extend
traffic information to other places, includ-ing station interiors and even throughout the passenger experience.
It is important for operators to multiply passenger information media as these last are vital to a successful passenger experience.
To that end, open data are an ideal way of transmitting information (e.g. social media, airport displays, chatbots, etc.). Some operators are working on this issue (see following slide).
Traffic information is a pillar of the passenger experience in urban environments. Providing this information in real time and ensuring its reliability are both key to gaining the loyalty of customers through an augmented transport experience. In addition, opening metro lines up to competition and the arrival of new transport modes will require operators to differentiate.
Providing multi-channel passenger information in real time is a way of doing just that.
T h e D I G I TA L T R A N S F o R M AT I o N A N D I N N o vAT I o N A R e C e N T R A L To T h e G R o U P S T R AT e G y o F S o M e o P e R ATo R S
The driverless metro line benchmark iden-tifies five trends in innovation:
/ The reliability and sharing of pas-senger information and traffic news. This data is decisive to the passenger experience.
/ Bringing passengers a mobile app with increasingly extensive function-alities and using it as a sales channel.
/ The implementation of a reliable con-nection network (with a clear shift to 4G rather than WiFi given the inter-est shown by telecom operators in this area) covering all stations and the entire journey. Most of the time spent by the passenger being on the train.
/ Open data, bringing operators a unique opportunity to boost inno-vation by opening systems up to the outside world.
/ Big data for “transport as a service” (TAAS). Operators that know more about their customers can bring these last a new, multimodal and personalized passenger experi-ence. Analysis of passenger flows in stations can be used to more finely adjust supply to demand.
on the platforM Mobile station on bord website
Paris – Lines 14 & 1
Barcelona – Line 9
Lausanne – M2
Lyon – Line D
Rennes – Line A
Toulouse (2 lines)
Lille (2 lines)
Nuremberg u2 & u3
Milan Line 5
Dubai (2 lines)
Taipei – Wenhu line
Turin – Line 1
Copenhagen (2 lines)
London – DLR
vancouver (3 lines)
digital Maturity and innovation
Paris (rATP)
Barcelona (TBM)
rennes (Keolis)
Dubai (Serco)
Lille (Keolis)
Taipei (TrTC)
Toulouse (Tisséo)
Nuremberg (vAg)
Lyon (Keolis)
Milan (ATM)
Lausanne (TL)
Turin (gTT)
London (Keolis)
Copenhagen (ATM)
Vancouver (BCrTC)
1.0 2.0 / 2.0+ 3.0

5756
A DETAILED BENChMArK OF ThE DRIVERLESS
METRO L INES uNDER REVIEW

5958
B A R C e Lo N A : L I N e 9
1
Infrastructure and rolling stock
• Average commercial speed (29km/h) and long distances between sta-tions (>1,000m)
• Long headways, with 3-min intervals at rush hour• Accessibility: good for PWRM (>80% of stops accessible)• Fraud rate: <4%
3.4
2
Service reliability and quality
• Regularity: 94.72% (this is the contractual objective)• Cleanliness: 9.9 / 10 satisfaction rate for trains and stations• Passenger information: information in real time disseminated in sta-
tions, scheduled times and traffic info on mobile app, on board and the TMB website
3.25
3
Auxiliary and innovative
services
• Route planner app with real-time information (TMB app)• 4G coverage for entire line 9• The operator, TMB, has rolled out an open-data platform with 6 inter-
faces. In this respect it remains less mature than operators such as RATP and Keolis
• TMB already uses big data to model passenger flows in stations and adapts line operation in consequence and in a predictive manner
• In 2015 TMB introduced NFC and mobile payments for the entire urban network
characteristics
•Line9isthefirstdriverlesslineinSpain.Itcomprises2sections(L9NorthandL9 South). Once these two sections have been joined up, it will be the longest driverless metro line in Europe.
key PoINTS
Barcelona, Spain
Line 9
Steel
GoA4
Transports Metropolitans de Barcelona
Metropolitan Transport Authority
38,500
TrainGuard MT CBTC - Airlink
30
24
2009
895 (passengers per train)
Alstom Série 9000
29km/h
Age of network 8 years
*Age of network in number of years of driverless line operation.
evaluation*
*Raw grades out of 5, not weighted for age of network.
City, Country
Line
Wheel type
Degree of automation
operator
Transport authority
Passengers per hour and per direction (PPhPD)
Signaling
Network length in km
Number of stations in operation
Date commissioned
Passengers per car
Manufacturer / model
Average commercial speed

6160
1
Infrastructure and rolling stock
• High commercial speed (40km/h) and average distances between sta-tions (>1,000m)
• Average headways, with 2-min intervals at best at rush hour• Accessibility: good for PWRM (>80% of stops)• Fraud rate: 2.7%
3.8
2
Service reliability and quality
• Respect of departure numbers: 98.7%• Cleanliness: more than 80% of users say they are satisfied or very sat-
isfied with the cleanliness of the stations and trains• Passenger information: real-time information on platforms and
planned hours on the Metro Services website (80% of people say they are satisfied or very satisfied with information updates)
• Passenger safety: more than 95% of users say they feel safe
3.5
3
Auxiliary and innovative
services • 3G available on entire metro line, including the 22 stations • The Copenhagen network doesn’t have a dedicated mobile app
Co P e N h A G e N : L I N e S 1 A N D 2
characteristics
•Theoperator,MetroService,isajointventurebetweenATMandAnsaldoSTS.
•ThemanufactureristhuslikelytoprovideATMwithstrongsupportinrolling stock maintenance. The current operating and maintenance contract terminates on December 31, 2018 and the new contract covers the 2019-2024 period.
•TheCopenhagenmetrowonthe“World’sBestDriverlessMetro”awardin2008, 2009 and 2010.
•TheCopenhagenmetroruns24-7.
key PoINTS
Copenhagen, Danemark
M 1 M 2
Steel
GoA4
Metro Service
Movia
12,000
Ansaldo STS driverless solution - CBTC
21.5
22
2002
200 - 34 trains, 3 cars per train
Ansado Breda
40km/h
Age of network* 15 years
*Age of network in number of years of driverless line operation.
evaluation*
*Raw grades out of 5, not weighted for age of network.
City, Country
Line
Wheel type
Degree of automation
operator
Transport authority
Passengers per hour and per direction (PPhPD)
Signaling
Network length in km
Number of stations in operation
Date commissioned
Passengers per car
Manufacturer / model
Average commercial speed

6362
D U B A I : L I N e R e D
1
Infrastructure and rolling stock
• High commercial speed (42km/h) but long distances between stations (>1,800m)
• Long headways, with 3-min intervals at rush hour • Accessibility: 100% for PWRM• Fraud rate: unknown• Free park-and-ride at three stations
3.6
2
Service reliability and quality
• Strong punctuality (>99%)• RTA does not disclose passenger satisfaction levels regarding cleanli-
ness, but numerous opinions point to high levels of cleanliness• Passenger information: real-time information disseminated in stations,
on platforms, on board; scheduled times on the RTA website
4.5
3
Auxiliary and innovative
services• Network fully covered by mobile phone network • WiFi access across entire network• NFC payments by mobile phone available since 2013• The Dubai metro stands out through its high levels of in-train connec-
tivity: Very high quality WiFi and 4G connectivity end-to-end
characteristics
•Sercohasobtainedtherenewaloftheoperatingandmaintenancecontract(terminating in 2019) for two additional years
•Inadditiontoofferingamorecompetitiveoffer,SERCOhascommittedtomaking a skills transfer, in particular by recruiting more nationals in operations, maintenance and supervision
key PoINTS
City, Country
Line
Wheel type
Degree of automation
operator
Transport authority
Passengers per hour and per direction (PPhPD)
Signaling
Network length in km
Number of stations in operation
Date commissioned
Passengers per car
Manufacturer / model
Average commercial speed
Dubai, UAE
Red Line
Steel
GoA4
Serco
rta
26,000
SelTrac CBTC - UTO
52.1
29
2009
110 - 62 five-car trains (550 pass cap)
Kinki Sharyo
42km/h
Age of network* 8 years
*Age of network in number of years of driverless line operation.
evaluation*
*Raw grades out of 5, not weighted for age of network.

6564
D U B A I : L I N e G R e e N
1
Infrastructure and rolling stock
• Average commercial speed (32km/h) and long distances between sta-tions (>1,100m)
• Very long headways, with 6-min intervals at rush hour • Accessibility: 100% for PWRM• Fraud rate: unknown, estimated on the basis of observations
3.4
2
Service reliability and quality
• Strong punctuality (>99%)• RTA does not disclose passenger satisfaction levels regarding cleanli-
ness, but numerous opinions point to high levels of cleanliness• Passenger information: real-time information disseminated in stations,
on platforms, on board; scheduled times on the RTA website
4.5
3
Auxiliary and innovative
services• Network fully covered by mobile phone network • WiFi access across entire network• NFC payments by mobile phone available since 2013• The Dubai metro stands out through its high levels of in-train connec-
tivity: Very high quality WiFi and 4G connectivity end-to-end
characteristics evaluation*
•Sercohasobtainedtherenewaloftheoperatingandmaintenancecontract(terminating in 2019) for two additional years.
•Inadditiontoofferingamorecompetitiveoffer,SERCOhascommittedtomaking a skills transfer, in particular by recruiting more nationals in operations, maintenance and supervision.
key PoINTS
Dubai, UAE
Green Line
Steel
GoA4
Serco
rta
26,000
SelTrac CBTC - UTO
22.5
20
2011
110 - 25 five-car trains (550 pass cap)
Kinki Sharyo
32km/h
Age of network* 6 years
*Age of network in number of years of driverless line operation.*Raw grades out of 5, not weighted for age of network.
City, Country
Line
Wheel type
Degree of automation
operator
Transport authority
Passengers per hour and per direction (PPhPD)
Signaling
Network length in km
Number of stations in operation
Date commissioned
Passengers per car
Manufacturer / model
Average commercial speed

6766
1
Infrastructure and rolling stock
• Low commercial speed (18km/h) – major gradients with an incline as steep at 12% – but short average distance between stations (<500m)
• Average headways, with 2.5-min intervals at rush hour• Accessibility: high for PWRM• Fraud rate: ~ 3%• One park-and-ride facility
3.4
2
Service reliability and quality
• The operator has no quantified data on punctuality but does disclose a user satisfaction rate, of 93/100
• Cleanliness: user satisfaction rate of 95/100• Passenger information: real-time information in stations, on platforms,
via mobile apps, and scheduled times/traffic info on the TL website (satisfaction rate with information: 94%)
• Passenger safety: satisfaction rate of 84%
3.5
3
Auxiliary and innovative
services • Route planner app with real-time information (TL Live app)• TL has chosen SMS payments rather than NFC technology
L A U S A N N e : L I N e M 2
characteristics
•LineM2isthefirstandonlydriverlessmetrolineinSwitzerland,openedin2008. In 2012 Métro Lausanne-Ouchy SA, concession-holder and long-standing operator, was struck off the Commercial Register and its assets taken over by Transports Publics Lausannois. This change in operator was made following congestion problems resulting from an under-estimation of user numbers in preparatory studies.
•Aprojecthasbeeninitiatedtoincreasecapacitybyupgradingtheline’sautomatic systems.
key PoINTS
Lausanne, Switzerland
M2
Pneumatic
GoA4
Transports publics lausannois
-
5,600
Urbalis 300 CBTC
6
14
2008
222 - 15 x 2-car trains
Alstom
18km/h
evaluation*
Age of network* 9 years
*Age of network in number of years of driverless line operation.*Raw grades out of 5, not weighted for age of network.
City, Country
Line
Wheel type
Degree of automation
operator
Transport authority
Passengers per hour and per direction (PPhPD)
Signaling
Network length in km
Number of stations in operation
Date commissioned
Passengers per car
Manufacturer / model
Average commercial speed

6968
1Infrastructure
and rolling stock
• High commercial speed (35km/h) given the age of the rolling stock. Short average distance between stations (750m)
• The shortest rush-hour headways in the world: ~ 66 seconds• High fraud rate (~14%) owing to open network. This is expected to fall
with the installation of access gates throughout the network, to be completed by 2020.
• Accessibility: 100% for PWRM
3.8
2
Service reliability and quality
• Availability: 99.8% / Respect of journey time: 99%• Cleanliness: satisfaction rate of 78% for stops and 82% for trains• Passenger information: real-time information in stations, on platforms,
via mobile apps, and scheduled times/traffic info on the Transpole website. Satisfaction rate of 86% for availability of information and 66% for information on line disruptions
• Passenger services: stores, Internet connection to public services• Passenger safety: satisfaction rate of 73% for stops and 80% for trains
3.25
3
Auxiliary and innovative
services
• Route planner app with real-time information (Transpole app)• Launch of Moodi, an app designed to generate real-time mapping of
the “emotional climate” of passengers (passengers can express how they feel and report on incivility or violence)
• 3G/4G will be available in 2018 throughout both lines• The operator favors NFC technology, providing customers with an app
that can recharge travel passes via mobile phone. This is a further step towards 100% electronic travel
• Passengers have access to a “PlanBookTicket” app as part of a multi-modal transport approach
L I L L e : L I N e S 1 A N D 2
characteristics evaluation*
•Lillewastheworld’sfirsturbandriverlessmetroline,commissionedin1983.
•Transpolehasreceivedexcellentfeedbackonitsrollingstock,thislastservingto optimize maintenance processes.
•Maintenancecostsarefallingsteadily,whiletheMeanKilometerBetweenFailure (MKBF) rate has risen constantly in the last few years (currently at 5,600km).
key PoINTS
Lille, France
Line 1 Line 2
Pneumatic
GoA4
Transpole
Métropole Européenne Lilloise
11,000
TrainGuard MT
12.6 31.5
18 44
1983 1989
156
Alstom/Siemens - VAL 208 / VAL 206
34km/h
Age of network*Line 1: 34 yearsLine 2: 28 years
*Age of network in number of years of driverless line operation.
*Raw grades out of 5, not weighted for age of network.
City, Country
Line
Wheel type
Degree of automation
operator
Transport authority
Passengers per hour and per direction (PPhPD)
Signaling
Network length in km
Number of stations in operation
Date commissioned
Passengers per car
Manufacturer / model
Average commercial speed

7170
1
Infrastructure and rolling stock
• Short average distance between stations (750m)• Long headways, with 5-min intervals at rush hour• Accessibility: good for PWRM (>80% of stops)• Fraud rate: 0.6%, down sharply since Keolis Amey took over the fran-
chise
3.2
2
Service reliability and quality
• Punctuality: 99.11%• Cleanliness: the composite cleanliness indicator is 88/100• Passenger information: real-time information on platforms, and sched-
uled times/traffic info on the TFL website• Passenger safety: 89%
3.75
3
Auxiliary and innovative
services• Monthly reporting available on the performance of the network, dis-
seminated by TFL• Traffic information and travel times available in real time via the TFL
transport authority
Lo N D o N : D o C k L A N D S L I G h T R A I LW Ay
characteristics
•Theconcessionwasrecentlytakenover(2014)bytheAmeygroupandthe French urban transport player Keolis. Consequently, the performance indicators for the line could soon change in the future.
key PoINTS
London, UK
Docklands Light Railway
Steel
GoA3
KeolisAmey Docklands
Transport for London
6,000
SelTrac CBTC (Thales)
34
45
1987
284
Bombardier
18km/h
evaluation*
Age of network* 30 years
*Age of network in number of years of driverless line operation.*Raw grades out of 5, not weighted for age of network.
City, Country
Line
Wheel type
Degree of automation
operator
Transport authority
Passengers per hour and per direction (PPhPD)
Signaling
Network length in km
Number of stations in operation
Date commissioned
Passengers per car
Manufacturer / model
Average commercial speed

7372
1
Infrastructure and rolling stock
• Average commercial speed (30km/h) and relatively short average dis-tance between stations (890m)
• Average headways, with 2-min intervals at rush hour• High accessibility rate for PWRM (superior to contractual objectives)• Fraud rate: ~6.5% (closed network)
3.6
2
Service reliability and quality
• Regularity: 97.23% (superior to contractual objective)• Cleanliness: Metro stations: 99.54% / Metro cars: 99.20% (superior to
contractual objective)• Passenger information: information in real time and disruptions com-
municated in stations, on platforms, and on mobile phones; scheduled times and traffic info on the Sytral website (Metro stations: 99.54% / Metro cars: 99.20% (superior to contractual objective)
• Passenger safety: estimated at 75%
3.75
3
Services auxiliaires et
innovants • Route planner app with real-time information (TCL app)• Implementation of WiFi by end-2017 in stations (but not on entire line)• More than 15 APIs available via the Greater Lyon open-data platform
Lyo N : L I N e D
characteristics
•LineDwastheworld’sfirstdriverlessdriverlessmetrolinewithtrainintervalsmanaged by a CBTC system. The operator is planning to increase rush-hour capacity by 15% by 2020 (to this end, in 2015 Sytral and Keolis Lyon tested the operation of a train with 4 cars as opposed to the current 2).
•TheprincipleoffullautomationformetrolineBin2019hasbeenacceptedbySytral.
key PoINTS
Lyon, France
Line D
Pneumatic
GoA4
Keolis Lyon
systral
15,000
TrainGuard MT CBTC
12.5
15
1991
291
Alstom MPL 85
30km/h
evaluation*
Age of network* 26 years
*Age of network in number of years of driverless line operation.*Raw grades out of 5, not weighted for age of network.
City, Country
Line
Wheel type
Degree of automation
operator
Transport authority
Passengers per hour and per direction (PPhPD)
Signaling
Network length in km
Number of stations in operation
Date commissioned
Passengers per car
Manufacturer / model
Average commercial speed

7574
1
Infrastructure and rolling stock
• Modest commercial speed (30km/h) but short distances between sta-tions (>1,000m)
• Relatively long headways, with 3-min intervals at rush hour • Accessibility: good for PWRM (>80% of stops)• Low fraud rate (~1%) due to ticket access gates at network entrances
and exits
4
2
Service reliability and quality
• Strong punctuality (>99%)• No contractual commitment to cleanliness in delegation contract.
Cleanliness levels are measured by a satisfaction survey that must respect a minimum threshold. The latest known and available rates are particularly low.
• Passenger information: real-time information on platforms, in-train, via mobile apps, and scheduled times/traffic info on the ATM website.
• Passenger safety: 61% for latest known and available rates
2.25
3
Auxiliary and innovative
services • Route planner app with real-time information (ATM app)• 3G is available on all the metro lines• Electronic travel pass via mobile app (non-NFC)
M I L A N : L I N e 5
characteristics
•Line5issubjecttoaconcessioncontractbetweentheCityofMilanandtheMetro 5 SpA company, whereby the City concedes the financing, design, production and operation/maintenance to Metro 5 SpA. For the account of Metro 5 SpA, ATM operates and maintains Line 5 via a gross-cost contract applying for the entire duration of the concession through end-2040.
•ATMisresponsibleforallregularmaintenanceofrollingstock(Ansaldo’sactivity is limited to exceptional work as provided for in the warranty).
key PoINTS
Milan, Italy
Line 5
Steel
GoA4
Azienda Transporti Milanesi
Azienda Transporti Milanesi
10,700
Ansaldo STS driverless solution - CBTC
12.6
19
2013
134 - 21 trains, 4 cars per train (536 passengers per train)
Hitachi Rail Italy (formerly Ansado Breda) / Driverless Metro
30km/h
evaluation*
Age of network* 4 years
*Age of network in number of years of driverless line operation.*Raw grades out of 5, not weighted for age of network.
City, Country
Line
Wheel type
Degree of automation
operator
Transport authority
Passengers per hour and per direction (PPhPD)
Signaling
Network length in km
Number of stations in operation
Date commissioned
Passengers per car
Manufacturer / model
Average commercial speed

7776
N U R e M B e R G : L I N e U 2
1
Infrastructure and rolling stock
• High commercial speed (34.4km/h) and relatively short average dis-tance between stations (880m)
• Relatively long rush-hour headways: ~3-min• Very low fraud rate of 0.9% (ranking in the top three networks in this
study)• Accessibility: 100% for PWRM
4
2
Service reliability and quality
• High punctuality rate of 99%• Cleanliness: satisfaction rate of 80% for stations and rolling stock• Passenger information: widely available. VAG even provides an inter-
face providing the real-time geolocation of the trains• Passenger safety: passengers are generally satisfied with the safety
level of the Nuremberg network, though there are some incidents
3.75
3
Auxiliary and innovative
services• Route planner app with real-time information• VAG is working with T-System on a big data project to analyze passen-
ger flows across the entire transport network• WiFi is available in stations and on trains
characteristics
•LineU2hashigh-levelpunctualityandaverylowfraudrate,characteristicofGerman networks.
key PoINTS
Nuremberg, Germany
Line U2
Steel
GoA4
vgn / vag
Nuremberg Public Transport
12,800
TrainGuard MT
13.2
16
2010
128
Siemens Munich A
34.4km/h
evaluation*
Age of network* 7 years
*Age of network in number of years of driverless line operation.*Raw grades out of 5, not weighted for age of network.
City, Country
Line
Wheel type
Degree of automation
operator
Transport authority
Passengers per hour and per direction (PPhPD)
Signaling
Network length in km
Number of stations in operation
Date commissioned
Passengers per car
Manufacturer / model
Average commercial speed

7978
N U R e M B e R G : L I N e U 3
1
Infrastructure and rolling stock
• Low commercial speed (26km/h) and relatively short average distance between stations (650m)
• Relatively long rush-hour headways: ~3-min• Very low fraud rate of 0.9% (ranking in the top three networks in this
study)• Accessibility: 100% for PWRM
3.8
2
Service reliability and quality
• High punctuality rate of 99%• Cleanliness: satisfaction rate of 80% for stations and rolling stock• Passenger information: widely available. VAG even provides an inter-
face providing the real-time geolocation of the trains• Passenger safety: passengers are generally satisfied with the safety
level of the Nuremberg network, though there are some incidents
3.75
3
Auxiliary and innovative
services• Route planner app with real-time information• VAG is working with T-System on a big data project to analyze passen-
ger flows across the entire transport network• WiFi is available in stations and on trains
characteristics
•LineU3hashigh-levelpunctualityandaverylowfraudrate,characteristicofGerman networks.
key PoINTS
Nuremberg, Germany
Line U3
Steel
GoA4
vgn / vag
Nuremberg Transport Public
12,800
TrainGuard MT
6.5
11
2008
128
Siemens Munich A
26km/h
evaluation*
Age of network* 9 years
*Age of network in number of years of driverless line operation.*Raw grades out of 5, not weighted for age of network.
City, Country
Line
Wheel type
Degree of automation
operator
Transport authority
Passengers per hour and per direction (PPhPD)
Signaling
Network length in km
Number of stations in operation
Date commissioned
Passengers per car
Manufacturer / model
Average commercial speed

8180
PA R I S : L I N e 1
1
Infrastructure and rolling stock
• Average commercial speed (30km/h) and short distance between sta-tions (660m)
• Short maximum headways, with 2-min intervals at rush hour• Accessibility: low for PWRM (<70% of stops)• Fraud rate: 3% for entire network (closed network)
3.4
2
Service reliability and quality
• Availability: >100% (% of real number of metro trains in circulation in rush hour relative to service ordered)
• RATP does not disclose information on passenger satisfaction concern-ing cleanliness but STIF reports that 89.6% of the stations comply with the reference service level
• Passenger information: real-time information in stations, on platforms, in-train, via mobile apps, and scheduled times/traffic info on the RATP website
3.75
3
Auxiliary and innovative
services
• Route planner app with real-time information (RATP app)• Most of the stations on Line 1 have 3G and 4G coverage • An API console with more than 20 interfaces• Big data and IoT are strategic topics for RATP and central to the group’s
overall strategy• RATP is carrying out tests on the simulation and projection of passen-
ger flows in stations, using big data
characteristics
•Line1wasoneoftheworld’sfirstmetrolinestobeautomated,in2011.
•Line1demonstrateditsadaptabilityinsummer2015,absorbingtheincreaseinpassengers when the RER A line was shut down for work. To achieve headways of 100 seconds, Line 1 benefited from the temporary use of 4 shuttles intended for use on Line 14.
key PoINTS
Paris, France
Line 1
Pneumatic
GoA4
ratp
stif
25,000
TrainGuard MT CBTC
16.5
25
2011
120 (6 cars per train)
Alstom
30km/h
evaluation*
Age of network* 6 years
*Age of network in number of years of driverless line operation.*Raw grades out of 5, not weighted for age of network.
City, Country
Line
Wheel type
Degree of automation
operator
Transport authority
Passengers per hour and per direction (PPhPD)
Signaling
Network length in km
Number of stations in operation
Date commissioned
Passengers per car
Manufacturer / model
Average commercial speed

8382
PA R I S : L I N e 1 4
1
Infrastructure and rolling stock
• High commercial speed (40km/h) and average distance between sta-tions (1,000m)
• Short maximum headways, with 85-sec intervals at rush hour• Accessibility: good for PWRM (>80% of stops)• Fraud rate: 3% for entire network (closed network)
4.4
2
Service reliability and quality
• Availability: >100% (% of real number of metro trains in circulation at rush hour relative to the service ordered)
• RATP does not disclose information on passenger satisfaction concern-ing cleanliness but STIF reports that 89.6% of the stations comply with the reference service level
• Passenger information: real-time information in stations, on platforms, in-train, via mobile apps, and scheduled times/traffic info on the RATP website
3.75
3
Auxiliary and innovative
services
• Route planner app with real-time information (RATP app)• Most of the stations on Line 1 have 3G and 4G coverage • An API console with more than 20 interfaces• Big data and IoT are strategic topics for RATP and central to the group’s
overall strategy• RATP is carrying out tests on the simulation and projection of passen-
ger flows in stations, using big data
characteristics
•Thefirstlarge-size100%driverlesslineintheworldwhenitwentintoservice,Line 14 is to be extended to link up the center of the capital with the Saint-Denis Pleyel business hub to the north and Orly airport to the south.
•Theseextensionswillbemadewhilemaintainingthecurrentcharacteristicsofthe line, with a speed of over 40km/h.
key PoINTS
Paris, France
Line 14
Pneumatic
GoA4
ratp
stif
25,000
TrainGuard MT CBTC
9.2
9
1998
720 (passengers per train)
Alstom
40km/h
evaluation*
19 years
*Age of network in number of years of driverless line operation.*Raw grades out of 5, not weighted for age of network.
Age of network*
City, Country
Line
Wheel type
Degree of automation
operator
Transport authority
Passengers per hour and per direction (PPhPD)
Signaling
Network length in km
Number of stations in operation
Date commissioned
Passengers per car
Manufacturer / model
Average commercial speed

8584
1
Infrastructure and rolling stock
• Average commercial speed (32km/h) and short distance between sta-tions (610m)
• Short headways, with 100 sec intervals at rush hour• Accessibility: 100% for PWRM • High fraud rate (~10.4%) due to open network, to be closed in 2019/2020
4
2
Service reliability and quality
• Punctuality: 99.66%, system availability rate: 99.72%• Cleanliness: satisfaction rate of 94.4/100• Passenger information: real-time information in stations, on platforms,
via mobile apps, and scheduled times/traffic info on the Star website. Satisfaction rate of 95/100 relative to the condition and the availability of information
• Passenger safety: estimated at 80%
4.25
3
Services auxiliaires et
innovants
• The 4G system of mobile telephony operators will be available from June 2017 on the entire Line A
• A customer mobility solution (mobile app) is available. It brings users a route planning resource and real-time traffic information
• In collaboration with OpenDataSoft, Keolis provides a comprehensive open-date platform with over 30 APIs for third-party developers
R e N N e S : L I N e A
characteristics
•Theconstructionofaseconddriverlessmetroline(usingtheCityValvariantofNeoval) is under way, with service planned to begin in 2020.
•Thecurrentdelegationcontractexpiresatend-2017andwillneedtobereviewed before the inception of the second metro line, which will significantly change the Rennes transport offering.
key PoINTS
Rennes, France
Line A
Pneumatic
GoA4
Keolis Rennes
Rennes Métropole
6,000
TrainGuard MT CBTC (Siemens)
8.56
15
2002
156
Siemens
32km/h
evaluation*
15 years
*Age of network in number of years of driverless line operation.*Raw grades out of 5, not weighted for age of network.
Age of network*
City, Country
Line
Wheel type
Degree of automation
operator
Transport authority
Passengers per hour and per direction (PPhPD)
Signaling
Network length in km
Number of stations in operation
Date commissioned
Passengers per car
Manufacturer / model
Average commercial speed

8786
TA I P e I : W e N h U L I N e ( B R o W N L I N e )
1
Infrastructure and rolling stock
• High commercial speed (42km/h) and long distances between stations (>1.100m)
• Maximum headway of 2-min at rush hour • High level of accessibility for PWRM• Fraud rate: unknown
4.2
2
Service reliability and quality • Punctuality: 99.73%
• Cleanliness: satisfaction rate of over 95/100• Passenger information: real-time information on platforms and in
trains, and 24-7 customer hotline
4.25
3
Auxiliary and innovative
services
• WiFi accessible in all stations• NFC contactless technology was rolled out across the network starting
in 2012• The Taipei metro has an open-data platform but does not communicate
real-time data. The interface is mainly used to share monthly statistics• MRT provides a mobile app with offline information, with no route-
planner function
characteristics
•TheTaipeimetroisconsideredbyseverallocalpresssourcestorankamongthe top 4 most efficient networks in the world (with Hong Kong, Seoul and Singapore). This is a result of top-level punctuality, very good condition infrastructure and high-level cleanliness.
key PoINTS
Taipei, Taiwan
Wenhu line
Pneumatic
GoA4
Taipei Rapid Transit
-
28,400
Bombardier CityFlo
25.2
24
1996
114
Alstom-Bombardier / VAL
42km/h
evaluation*
21 years
*Age of network in number of years of driverless line operation.*Raw grades out of 5, not weighted for age of network.
Age of network*
City, Country
Line
Wheel type
Degree of automation
operator
Transport authority
Passengers per hour and per direction (PPhPD)
Signaling
Network length in km
Number of stations in operation
Date commissioned
Passengers per car
Manufacturer / model
Average commercial speed

8988
1
Infrastructure and rolling stock
• Average commercial speed (33km/h) but relatively short distance between stations (740m)
• Short headways, with 80 sec intervals at rush hour• Low fraud rate of ~3.2% (closed network)• Accessibility: good for PWRM (over 80% of stops accessible)
4.4 Line A
4.2 Line B
2
Service reliability and quality
• The operator does not share quantified data on punctuality, cleanliness or passenger information
• But these indicators are compliant with the quality commitment established with AFNOR, which has awarded Tisséo with NF Service certification
• Passenger information: real-time information in stations, and sched-uled times/traffic info on the Tisséo website
• Passenger safety: Estimated at 67%
3.5
3
Services auxiliaires et
innovants• Route planner app with real-time information (Tisséo app)• The 4G system of mobile telephony operators will be available from
October 2017 throughout lines A and B• An open-data platform is available. But the number of APIs remains
low (10 interfaces)
To U Lo U S e : L I N e S A A N D B
characteristics
•ThelineisoperatedbyTisséo-RéseauUrbain,apublicundertakingofanindustrial and commercial nature (EPIC).
•GiventhedemographicandeconomicgrowthoftheToulouseagglomerationand its mobility needs, the plan is to double the capacity of line A between now and 2019.
key PoINTS
Toulouse, France
Line A Line B
Pneumatic
GoA4
Tisséo
Tisséo-EPIC
7,000
TrainGuard MT CBTC
12.5 15
18 20
1993 2007
200
Siemens (val 206 and val 208)
34km/h 33km/h
evaluation*
Age of network*Line A: 24 yearsLine B: 10 years
*Age of network in number of years of driverless line operation.*Raw grades out of 5, not weighted for age of network.
City, Country
Line
Wheel type
Degree of automation
operator
Transport authority
Passengers per hour and per direction (PPhPD)
Signaling
Network length in km
Number of stations in operation
Date commissioned
Passengers per car
Manufacturer / model
Average commercial speed

9190
T U R I N : L I N e 1
1
Infrastructure and rolling stock
• Low commercial speed (25.5km/h) but relatively short distance between stations (660m on average)
• Long average headways, with 3-min intervals at rush hour • Very high level of accessibility for PWRM• Fraud rate of 4%, moderately high for a closed network
3.8
2
Service reliability and quality
• Service availability is very high, close to 99.9% • Passenger information: available on platforms and in-train 3.5
3
Auxiliary and innovative
services • A mobile app is available. It has route-planner functions but no real-time traffic information
characteristics
•TheTurinmetronetworkisrecentandtheinfrastructureisnewandwellmaintained. This explains in part the reliability of the service and the strong satisfaction of customers regarding cleanliness.
•Thefraudrateisconsideredasmoderatelyhighforaclosednetwork.Thisratedoes not fall within the average in Italy, which appears to vary between 1% and 3%.
key PoINTS
Turin, Italy
1
Pneumatic
GoA4
Gruppo Trasporti Torinesi
-
23,000
TrainGuard MT CBTC
13.2
21
2006
200
Siemens / VAL 208
25.5km/h
evaluation*
11 years
*Age of network in number of years of driverless line operation.*Raw grades out of 5, not weighted for age of network.
Age of network*
City, Country
Line
Wheel type
Degree of automation
operator
Transport authority
Passengers per hour and per direction (PPhPD)
Signaling
Network length in km
Number of stations in operation
Date commissioned
Passengers per car
Manufacturer / model
Average commercial speed

9392
1
Infrastructure and rolling stock
• High commercial speed (35km/h) but long average distance between stations (1,300m)
• Long headways, with 6-min intervals at rush hour• Accessibility: good for PWRM (>80% of stops)• Fraud rate: 5.4%
3.2
2
Service reliability and quality
• The operator does not disclose figures on punctuality, but this last is judged as satisfactory or very satisfactory by 92% of passengers
• Cleanliness: 87% of passengers give a good to excellent rating of cleanli-ness in trains and in stations
• Passenger information: real-time information disseminated on plat-forms; scheduled times on the Translink website
• Passenger safety: 82% of passengers give a good to excellent rating of on-board safety
2.75
3
Auxiliary and innovative
services• No dedicated app, but a route planner developed for mobiles
vA N Co U v e R : C A N A D A L I N e
characteristics
•TheCanadaLinewasbuiltaspartofapublic-privatepartnership.SNCLavalinis the operator for a 35-year period, with minimum frequency guaranteed by Translink.
key PoINTS
Vancouver
Canada Line
Steel
GoA4
Protrans BC
Greater Vancouver Transport Authority
15,000
SelTrac CBTC - UTO
19.2
16
2009
334
Hyundai Rotem
35km/h
8 years
*Age of network in number of years of driverless line operation.*Raw grades out of 5, not weighted for age of network.
Age of network*
evaluation*
City, Country
Line
Wheel type
Degree of automation
operator
Transport authority
Passengers per hour and per direction (PPhPD)
Signaling
Network length in km
Number of stations in operation
Date commissioned
Passengers per car
Manufacturer / model
Average commercial speed

9594
1
Infrastructure and rolling stock • High commercial speed (45km/h) but long distance between stations
(>1,500m)• Average headways, with 2-min intervals at rush hour• Fraud rate: 5.5%
4 Expo Line
3.6Millenium Line
2
Service reliability and quality
• The operator does not disclose figures on punctuality, but this last is judged as satisfactory or very satisfactory by 81% of passengers
• Cleanliness: 71% of passengers give a good to excellent rating of clean-liness in trains and in stations
• Passenger information: real-time information disseminated on plat-forms; scheduled times on the Translink website
• Passenger safety: 76% of passengers give a good to excellent rating of on-board safety
2
3
Auxiliary and innovative
services• No dedicated app, but a route planner developed for mobiles
vA N Co U v e R : e x P o L I N e / M I L L e N I U M L I N e
characteristics
•BritishColumbiaRapidTransitCompanyLtd(BCRTCTC)operatesandmaintains the two Skytrain lines on behalf of TransLink.
key PoINTS
Vancouver, Canada
Skytrain Expo Line Skytrain Millenium Line
Steel
GoA4
British Colombia Rapid Transit Company
Autorité des Transports du Grand Vancouver
16,000 15,000
SelTrac CBTC - UTO
28.9 15
20
1985 2002
500 (passengers per train) 200
Bombardier Transportation Siemens (val 206 and val 208)
44km/h 33km/h
evaluation*
Age of network*Expo Line: 31 years
Millenium Line: 15 years
*Age of network in number of years of driverless line operation.*Raw grades out of 5, not weighted for age of network.
City, Country
Line
Wheel type
Degree of automation
operator
Transport authority
Passengers per hour and per direction (PPhPD)
Signaling
Network length in km
Number of stations in operation
Date commissioned
Passengers per car
Manufacturer / model
Average commercial speed

9796
APPENDICES
INDICATOR ASSESSMENT METhODOLOgy
Performance is graded in 5 levels so as to determine for each indicator the relative performance of each network in the benchmark
Mediocre performance
The least efficient network in the scope1
Grade attributions are systematically objectified on the basis of the quantitative data compiled
Where quantified data are not available, the grade is based on all the supplementary qualitative items liable to enlighten the analysis
Insufficient performance 2
Average performance 3
Good performance 4
excellent performance
The most efficient network in the scope5
perforMance level scored out of 5 attribution of grade

9998
T h e Co M PA R AT I v e A N A Ly S I S o F T h e M e T R o L I N e S I S B A S e D o N I N D I C ATo R S TA k I N G A CCo U N T o F I N F R A S T R U C T U R e , S e R v I C e q U A L I T y A N D T h e A G e o F T h e A S S e T S
Performance of infrastructureand rolling stock
Service reliabilityand quality
Overall performanceof the metro line
The effect of ageon the infrastructure
and rolling stock
Grades for the performanc of infrastructureand rolling stock
Grades for reliability and service quality
performance
Grades for the performanceof driverless metro lines
Commercial speed
Distance between stations
Headway
Accessibility
Intrusion rate in network
Punctuality
Cleanliness
Passenger information
Passenger safety
1
1.5
0.5

101100
The main characteristics of the CBTC system are:• the localization of trains independently of track circuits;• high-speed dual-direction transmission between ground equipment and trains;• a system comprising computers located both on ground and in trains.
Co M M U N I C AT I o N - B A S e D T R A I N Co N T R o L (C B TC ) A R C h I T e C T U R e G Lo S S A R y
Automatic Train Supervision (ATS) serves as an interface between the operators and the system. It can be used to control and glob-ally supervise the system and manage train flows in respect of theoretical service.
Wayside ATP: manages communications with the trains in its area and calculates the movement limits to be respected by the trainsWayside ATO: controls the destination of trains and the parame-ters for regulating their movement (station stop times)
Onboard ATP: continuous control of train speed consistent with safety criteria (braking management where necessary). Serves to communicate the data necessary to operations with the Wayside atpOnboard ATO: automatic control of the acceleration and braking of the train, consistent with theoretical service
ATP: Automatic Train Protection
ATO: Automatic Train Operation
Automated guideway transit (AGT): a system similar to the metro, in that it runs on a dedicated circuit which does not interfere with other modes of transport. It differs from a metro by often being com-posed of one car per train, with a maxi-mum capacity of 100 passengers. Through its simple design, AGT does not have the same limitations as a metro.
Automatic train protection (ATP), auto-matic train control (ATC), automatic train operation (ATO): onboard systems serving respectively to prevent collisions, control route setting and train regulation, and con-trol train acceleration and deceleration.
Automation level: the level of automa-tion is defined according to the division of responsibilities between the system and human resources of the activities relating to the operation of the service.
GoA 1 (Grade of automation 1): 100% manual operation in which the driver is responsible for starting and stopping the train and controlling the doors and operating incidents.
GoA 2 (Grade of automation 2): semi-automatic operation in which the train is started and stopped auto-matically but the driver is responsi-ble for controlling the doors and operating incidents and is called on to drive the train where necessary
GoA 3 (Grade of automation 3): driverless operation in which the train is started and stopped auto-matically but an operator (not a driver) is responsible for controlling the doors and operating incidents and is called on to drive the train where necessary
GoA 4 (Grade of automation 4): operation with no human resources on board, in which the train is started and stopped automatically and the control of the doors and operating incidents are fully automated.
Availability: an indicator quantifying the difference between the actual number of kilometers traveled and the number of theoretical kilometers. Availability is cal-culated as the ratio between the actual number of kilometers traveled and the number of theoretical kilometers.
Communication-based train control (CBTC) system: an automatic rail transport control system (train or metro) based on continuous communication between the train and the computers used to coordi-nate traffic.
Conventional metro (as defined for the study): a metro (see definition above) whose running is entirely or partially ensured by a driver (grade 1 and grade 2)
ATSTrain supervision
Wayside ATP + ATo systems
onboard ATP + ATo systems
Several technologies exist for communications between onboard systems and ground systems, including induction loops, beacons and radio communication. This last technology is the most widely used

102 103
Driverless metro (as defined for the study): a mass transit system operating on a dedicated underground or over-ground circuit powered by rail and trans-porting passengers essentially making back-and-forth journeys/commutes. Generally speaking, the train is made up of several cars (up to 6 or 8), comprises a raised access level, and has a capacity of over 100 passengers. The train is oper-ated entirely automatically without driver input (grade 3 or grade 4). The LTR, AGT and people-mover systems defined in this glossary do not fall within this category.
Driverless metro operators: TL (Transports Publics de la Région Lausannoise), ATM (Azienda Transporti Milanesi), BCRTC (British Colombia Rapid Transit), GTT (Gruppo Torinese di Transporte), TMB (Transports Metropolitans de Barcelona), TRTC (Taipei Rapid Transit).
Light rail transit (LRT): a system operat-ing on a circuit that may be shared with other modes of transport (such as cars), often powered by a catenary, the trains of which have a limited number of cars (1 or 2). Trams are included in this category.
Metro: a mass transit system operating on a dedicated underground or overground circuit. Generally speaking, the train is made up of several cars (up to 6 or 8) and comprises a raised access level.
People mover: a fully automated light transit rail system. The term is generally used only for raised, single-rack shuttles operating over short distances at airports, leisure parks or compact urban areas.
PPHPD: the number of passengers per hour and per direction is a measurement of the capacity of a public transport system. PPHPD is used to determine the capacity requirements of the rolling stock (and thus the CAPEX and OPEX of the project).
Punctuality: an indicator quantifying the difference between the actual time of arrival at a station and the theoretical time of arrival. Regularity can be calculated as the percentage of trains respecting the theoretical time of arrival.
Regularity: an indicator quantifying the difference between actual headways and theoretical headways. Regularity can be calculated as the percentage of trains respecting theoretical headways.
Urbanization: population movements from rural areas to urban areas, or the transfor-mation of rural areas into densely popu-lated urban areas.
F R A M e o F R e F e R e N C e S
“The trend to automation”, London Seminar, UITP 2013
“Metro automation – facts and figures”, UITP
“Observatory of automated metros 2013”
“UTO Metros opportunities and challenges”, Arts et métiers
“The automation control systems for the efficiency of metro transit lines”
“Impacts of Unattended Train Operations on Productivity and Efficiency in Metropolitan Railways”, Judith M Cohen, Alexander S Barron, Richard J Anderson, Daniel J Graham, 2015, Transportation Research Board
“The impacts of moving block signaling on technical efficiency: An application of pro-pensity score matching on urban metro rail Systems”, Shane Canavana, Daniel J. Graham, Patricia C. Melo, Richard J. Anderson, Alexander Barron and Judith M. Cohen, 2015, Railway and Transport Strategy Centre, Centre for Transport Studies, Dept of Civil and Environmental Engineering, Imperial College London
“Future of rail 2050”, ARUP
“Copenhaguen metro – The best metro in the world 2010”, Ansaldo STS
“The world cities in 2016”, Nations Unies
“The economic of public transportation 2007”, Taylor & Francis
“The future of Transportation 2015”, Siemens
2015 Annual activity reports for metro operators and suppliers
INSEE communications
LVMT Laboratoire Ville, Mobilité et Transport communications
Specialised press articles: Streetsblog, CityLab, Nordbayern, Railway Technology, Gulf News, Think Railways, MarktSpiegel, Business Insider…

104
www.wavestone.com


