
Financial capability in MEXICO: results from a national survey on financial behaviors, attitudes, and knowledge
November 2013
Pub
lic D
iscl
osur
e A
utho
rized
Pub
lic D
iscl
osur
e A
utho
rized
Pub
lic D
iscl
osur
e A
utho
rized
Pub
lic D
iscl
osur
e A
utho
rized
Pub
lic D
iscl
osur
e A
utho
rized
Pub
lic D
iscl
osur
e A
utho
rized
Pub
lic D
iscl
osur
e A
utho
rized
Pub
lic D
iscl
osur
e A
utho
rized

Financial capability in Mexico: results from a national survey on financial behaviors, attitudes, and knowledge
REKHA REDDY
MIRIAM BRUHN
CONGYAN TAN

© 2013 International Bank for Reconstruction and Development / The World Bank
1818 H Street, NW
Washington, DC 20433
Telephone: 202-473-1000
Internet: www.worldbank.org
The findings, interpretations, and conclusions expressed here do not necessarily reflect the
views of the Executive Directors of The World Bank or the governments they represent. The
World Bank does not guarantee the accuracy of the data included in this work. The boundaries,
colors, denominations, and other information shown on any map in this work do not imply
any judgment on the part of The World Bank concerning the legal status of any territory or the
endorsement or acceptance of such boundaries.
Rights and Permissions
The material in this publication is copyrighted. Copying and/or transmitting portions or all of
this work without permission may be a violation of applicable law. The International Bank for
Reconstruction and Development / The World Bank encourages dissemination of its work and
will normally grant permission to reproduce portions of the work promptly.
For permission to photocopy or reprint any part of this work, please send a request with
complete information to the Copyright Clearance Center, Inc., 222 Rosewood Drive, Danvers,
MA 01923, USA, telephone 978-750-8400, fax 978-750-4470, http://www.copyright.com/.
All other queries on rights and licenses, including subsidiary rights, should be addressed to
the Office of the Publisher, The World Bank, 1818 H Street NW, Washington, DC 20433, USA, fax
202-522-2422, e-mail [email protected].
Cover images: World Bank; picture of students © Esther Vargas/October 2012
Cover design/layout: Nita Congress

v
Contents
Acknowledgments — vii
Abbreviations — ix
Executive summary — xi
1 Introduction — 1
1.1 Context — 1
1.2 Why this report? — 2
1.3 What is financial capability? — 5
2 Daily money management and financial planning — 7
2.1 characteristics of financial decision makers — 7
2.2 Budgeting and monitoring expenses — 9
2.3 Making ends meet: balancing income and expenses — 10
2.4 Planning for major expenses: expected and unexpected — 12
2.5 Plans for children’s future and old age — 12
2.6 Attitudes — 15
3 Decisions about financial services and financial knowledge — 17
3.1 Usage of financial services — 17
3.2 Making decisions about financial products — 22
3.3 Financial knowledge — 23
4 Comparing financial capability — 27
4.1 Components of financial capability — 27
4.2 Profiles of financial capability in Mexico — 29
4.3 Regional variation of financial capability — 32
4.4 Financial capability of youth — 33
5 International comparisons — 39
6 Linkages between financial capability and financial inclusion — 45
6.1 Financial knowledge and capability — 45
6.2 Financial knowledge, financial capability, and use of credit and savings — 46
6.3 Financial knowledge, financial capability, access to finance, and formal product usage — 49

FINANCIAL CAPABILITY IN MEXICO: RESULTS FROM A NATIONAL SURVEY ON FINANCIAL BEHAVIORS, ATTITUDES, AND KNOWLEDGE
vi
7 Conclusions and recommendations — 53
Appendixes
A Construction of financial capability scores — 63
B Segmenting the population using cluster analysis — 69
C Youth financial capability — 71
D Methodology to analyze linkages between financial capability and financial inclusion — 75
E Literature review: financial knowledge, capability, and behavior — 85
References — 89
Boxes
1.1 Financial capabilities and knowledge survey data featured in this report — 3
3.1 Comparing different data sources on financial inclusion in Mexico — 18
Figures
1.1 Coverage of the Mexico Financial Capability Survey — 4
2.1 Contributions to the household budget and participation in financial decision making, by age and gender — 8
2.2 Making and adhering to plans about budgeting — 9
2.3 Planning behavior by gender, location, and income — 10
2.4 Precision of money management — 10
2.5 Shortfalls in money for necessities — 11
2.6 Coping strategies to cover shortfalls — 12
2.7 Ability to cover major unexpected expenses, by income group — 13
2.8 Strategies employed to cover old age expenses — 14
2.9 Coverage of old age expenses, by gender and employment (<60 years of age) — 14
2.10 Attitude toward the future — 15
2.11 Financial planning horizons — 16
2.12 Achievement orientation — 16
3.1 Percentage of the Mexican population using types of financial products currently or in the past — 19
3.2 Distribution of responses to financial literacy questions — 24
3.3 Distribution of correct financial knowledge responses — 25
3.4 Distribution of sources of money management information — 26
4.1 Mexico’s mean scores for components of financial capability — 29
4.2 Cluster size by educational attainment and financial inclusion — 31
4.3 Sociodemographic characteristics of each cluster — 32
4.4 Financial capability behavioral and knowledge scores mapped by region — 34
4.5 Financial knowledge by age group — 35
4.6 Percentage agreeing with each statement by age group — 36
4.7 Mean score on behavioral components of financial capability — 37
5.1 Cross-country comparison of components of financial capability — 40

CONTENTS
vii
6.1 Correlations between financial knowledge and capability benchmarked by standard deviation — 47
6.2 Use of financial products by individuals with low or high financial capability — 49
6.3 Distribution of bank branches and correspondents across municipalities — 50
B.1 Scores on financial capability components by cluster — 70
C.1 Educational attainment by age — 72
C.2 Employment of youth (aged 18–24) — 72
C.3 Mean score on a composite index of attitudes by age group — 74
Tables
E.1 Recommendations to support improved money management and financial planning and reduce vulnerability in Mexico — xvii
2.1 Financial decision-making roles — 8
3.1 Reasons for saving by respondents who save (%) — 20
3.2 Use of social programs and financial products/services by survey respondents (%) — 21
3.3 Perception of borrowing capacity by respondents who borrow (%) — 22
3.4 Respondent diligence in making financial service decisions, by credit or savings vehicle (%) — 23
4.1 Components of financial capability — 28
4.2 Financial capability clusters in the population — 30
4.3 Average financial capability behavioral and knowledge scores by region — 33
5.1 Summary statistics of key sociodemographic variables — 41
5.2 International comparison of percentages of correct responses to knowledge questions — 42
6.1 Partial correlations between financial knowledge, financial capability components, and use of financial services — 48
A.1 Sample statistics for key sociodemographic variables — 67
D.1 Relationship between financial knowledge and financial capability — 76
D.2 Financial knowledge and use of financial products — 79
D.3 Financial capability and use of financial products — 80
D.4 Partial correlations between financial access points and use of financial products, by financial capability and financial knowledge levels — 82
D.5 Mexican financial literacy survey variable definitions: financial knowledge and financial capability — 83
D.6 Mexican financial literacy survey variable definitions: financial product usage — 83
D.7 Mexican financial literacy survey variable definitions: individual control variables — 84
D.8 Mexican financial literacy survey municipal-level variable definitions and sources — 84


ix
Acknowledgments
This report was prepared by a World Bank team led by Rekha Reddy, with contri-
butions from Miriam Bruhn and Congyan Tan. Pallavi Nuka provided an analysis
of financial capability of the youth population. Valeria Perotti provided research to
support the international comparison of Mexican financial capability data. Sarah
Antos and Katie McWilliams provided geographic information system mapping exper-
tise, and Nita Congress provided editorial and design support.
This project was strengthened throughout its design and implementation by a part-
nership with project counterparts from the Mexican National Banking and Securities
Commission (CNBV) and the National Commission for the Protection and Defense
of Users of Financial Services (CONDUSEF): Luis Treviño Garza (CNBV), Arturo Luna
Canales, Sara Gutierrez, and Jesus David Chavez Ugalde (CONDUSEF) provided
invaluable insights and support. In addition, the team would like to thank Ana Luisa
Saavedra and Javier Suarez Luengas (Ministry of Finance and Public Credit) for their
guidance throughout this project. Finally, the team would also like to acknowledge
the inspiration provided by the late Raul Hernandez-Coss (CNBV), who championed
this project from its inception.
The team is indebted to numerous colleagues for providing comments, inputs, and
suggestions on the execution of this project and on draft reports, including Lily Chu,
Eva Gutierrez, and P. S. Srinivas. The team is also grateful to peer reviewers Anna-
maria Lusardi, Samuel Maimbo, and James Seward for their valuable comments on
this document and the design of this project.
We are especially grateful to the Russia Financial Literacy and Education Trust Fund
and the World Bank Latin America and the Caribbean region for providing financial
support making the collection of the data and their analysis possible. We particularly
appreciate the strategic guidance provided by Richard Hinz, Program Manager of
the Trust Fund and Kinnon Scott, Task Leader of the global financial capabilities pilot.
Finally, the insights from the international academic team that was involved in the
design of this survey instrument, namely Gerritt Antonides, Sharon Collard, Elaine
Kempson, Olga Kuzina, and Christian Poppe, were invaluable.

FINANCIAL CAPABILITY IN MEXICO: RESULTS FROM A NATIONAL SURVEY ON FINANCIAL BEHAVIORS, ATTITUDES, AND KNOWLEDGE
x
Much of this report is based on new data from a survey in Mexico executed by the
firm Ipsos Bimsa. We would particularly like to thank Maria Jose Gentili, Patricia
Lopez, and Edgar Monsalvo for their support and insights throughout both the
research process. Finally, the team wishes to express its gratitude to the 2,022
Mexican survey respondents who gave of their time to provide us with the insights
utilized in this report.
xi
Abbreviations
BANSEFI Bank of National Savings and Financial Services (Banco del Ahorro Nacional y Servicios Financieros, S.N.C.)
CNBV National Banking and Securities Commission (Comisión Nacional Bancaria y de Valores)
CONDUSEF National Commission for the Protection of Users of Financial Services (Comision Nacional para la Protección y Defensa de los Usuarios de Servicios Financieros)
ENIF National Survey on Financial Inclusion (Encuesta Nacional de Inclu-sión Financiera)
IMSS Mexican Social Security Institute (Instituto Mexicano del Seguro Social)
INEGI National Statistics Institute for Mexico (Instituto Nacional de Esta-dística y Geografía)
INFE International Network on Financial Education
ISSSTE Institute for Social Security and Services for State Workers (Instituto de Seguridad y Servicios Sociales de los Trabajadores del Estado)
NGO nongovernmental organization
OECD Organisation for Economic Co-operation and Development
SOFIPO popular financial society (sociedad financiera popular)

xiii
Executive summary
Findings from the Mexican Financial Capability Survey, the country’s first nationally
representative survey on financial behaviors, attitudes, and knowledge, suggest
five areas of opportunity to support the Mexican population in sound financial deci-
sion making.
� Daily money management and planning are imprecise. Just 41 percent of
those surveyed reported budgeting regularly and 20 percent were monitoring
expenses rigorously.
� Many are vulnerable to shocks. Only 34 percent believe they could cover a
major unanticipated expense and 70 percent reported having had regular or
occasional difficulties in covering basic expenses, such as food and housing.
� Even anticipated life events are difficult to cover. Just 28 percent of those
under the age of 60 have plans to cover retirement expenses fully in old age,
and just over a third of those over age 60 have sufficient provisions for old age
expenses.
� Despite a sharp increase in the availability of financial products and services in
recent years, financial inclusion remains a challenge. Almost half (49 percent)
do not report any current use of financial services (formal or informal), and
there is a high level of usage of sources of informal credit and saving. Even
channels designed to increase financial access, such as bank correspondents,
are primarily beneficial to those with greater financial knowledge (financial
literacy) and capability.
� Most users of financial products reported making careful financial deci-
sions. However, formal financial knowledge was mixed: most understood
the concepts of interest paid on a loan and the time value of money, yet only
37 percent could calculate a simple interest rate.
This report details how findings vary among different segments and provides recom-
mendations to equip the Mexican population to meet these challenges.

FINANCIAL CAPABILITY IN MEXICO: RESULTS FROM A NATIONAL SURVEY ON FINANCIAL BEHAVIORS, ATTITUDES, AND KNOWLEDGE
xiv
CONTEXT
Over the past decade Mexican consumers have witnessed a dramatic increase in
the availability and diversity of consumer financial products. As financial products
become more broadly available, financial capability—the ability of consumers to
make sound financial decisions and use financial products effectively and respon-
sibly—is of crucial importance in accelerating financial inclusion.
Promoting responsible financial inclusion and financial education is a high priority for
the Mexican government. Given this priority, the Government of Mexico, in partner-
ship with the World Bank, commissioned this national financial capability study in
order to
� develop an empirical understanding of the financial behavior, attitudes, and
knowledge of the Mexican population;
� support the design of public policies to enhance both the knowledge about
and quality of financial services;
� highlight vulnerabilities and gaps in particular segments of the population with
the goal of improving and focusing public policies and interventions where
they are most needed; and
� provide a basis for international comparison, because similar surveys have
been completed in six other countries.
This study contributes to and complements existing stores of consumer financial
data.
The World Bank worked with counterparts at the Mexican National Banking and
Securities Commission (CNBV) and the National Commission for the Protection and
Defense of Users of Financial Services (CONDUSEF) to develop and execute this
survey of a nationally representative sample of 2,022 Mexicans aged 18 and over.
The survey instrument collected data on daily money management practices, finan-
cial planning, financial product information and choice, financial knowledge and atti-
tudes, and sociodemographic characteristics.
This report describes a baseline measure of the financial capability of the Mexican
adult population. Chapter 1 describes the Mexican context and the rationale for the
financial capability study. Chapter 2 describes key findings related to daily money
management and financial planning behaviors and attitudes. Chapter 3 examines
decisions related to the use of financial products and level of financial knowledge.
Chapter 4 summarizes key behaviors and attitudes into financial capability scores,
facilitating the creation of profiles and comparisons among different segments of the
population. Chapter 5 presents international comparisons. Chapter 6 examines the

EXECUTIVE SUMMARY
xv
relationship between financial capability, financial knowledge, and financial inclusion.
Chapter 7 provides policy recommendations related to the key challenges to finan-
cial capability identified in the report.
DAILY MONEY MANAGEMENT
Over 90 percent of Mexican adults are responsible for some aspect of house-
hold financial management, from paying bills, to deciding how money will
be spent, to financial planning. Of those surveyed who make household financial
decisions, 46 percent are men and 54 percent are women. Women play a key role
in household finances even through almost half of women in the sample reported
that they do not contribute to the household budget. The 9 percent of adults who
reported no participation in household financial decision making were primarily the
young and the elderly.
For the majority of Mexicans, budgeting income and monitoring spending
are imprecise and irregular processes. Although close to 70 percent of Mexicans
report that they budget how income will be spent, only 41 percent do so regu-
larly, and just one-third consistently adhere to a budget. The majority of Mexicans,
over 80 percent, did not know exactly how much they had spent in the last week,
and only about one-fifth knew precisely how much they had available for current
spending. Higher-income households and urban dwellers are more likely to closely
monitor expenses and develop exact plans for household finances.
MAKING ENDS MEET AND PLANNING AHEAD
More than 70 percent of the population has experienced financial strain, as
indicated by regular or occasional shortfalls in income to cover basic expenses
such as food and housing. Lower-income individuals, the elderly, and those with
informal sector employment or only primary education are particularly susceptible to
financial strain. The most common coping strategy is informal borrowing.
The majority of Mexicans have no provisions to cover major expenses, either
planned (school fees, weddings) or unplanned (job loss, accident). Of those
respondents who anticipated an upcoming major expense, only 45 percent believed
they could fund it, and only 34 percent of respondents believed they could fund
a major unplanned expense. Slightly less than one-third of those with dependent
children in their household did not report any plans to support their future, with low-
income families more predominantly represented.
Planning for old age and retirement is infrequent, with less than a third of the
population under the age of 60 reporting any plans in place to cover old-age
expense. Of those over age 60, nearly two-thirds report insufficient or no provisions
for living costs, with many reliant on support from working-age family and friends.

FINANCIAL CAPABILITY IN MEXICO: RESULTS FROM A NATIONAL SURVEY ON FINANCIAL BEHAVIORS, ATTITUDES, AND KNOWLEDGE
xvi
Nearly two-thirds of the Mexicans surveyed expressed a greater orientation
toward the present than the future. Sixteen percent of survey respondents did
not report any financial plans, 27 percent reported their planning time frame to
be one week or shorter, and 27 percent reported a planning time frame between
one week and one month. At the same time, two-thirds of the survey respondents
reported a strong achievement orientation, meaning they felt they worked hard to be
their best and improve their future, suggesting a need to harness these aspirations to
concrete financial planning actions.
MAKING DECISIONS ABOUT FINANCIAL SERVICES
Mexicans utilize a range of formal and informal instruments for savings and
credit. Nearly half of those surveyed (49 percent) reported that they do not currently
use any financial services, formal or informal, for saving and credit purposes, and
42 percent reported that they have not used any financial services in the past five
years. Among the 51 percent who are currently using financial services, the most
prevalent formal financial products were savings vehicles such as accounts at finan-
cial institutions and credit cards. For informal sources of credit and savings, tandas
(the Mexican term for informal rotating savings and credit associations, or ROSCAs)
and loans from family or friends were commonly mentioned.
The majority of those currently using financial services reported making very
careful decisions about this usage—even as they chose high-cost informal
services such as credit from pawn shops. When considering financial product
options, 62 percent of respondents reported detailed knowledge of terms and condi-
tions. Those respondents who own formal financial products, have formal sector jobs,
or are in higher-income groups are more likely to have researched financial product
decisions.
FINANCIAL KNOWLEDGE
The level of formal financial knowledge among those surveyed showed oppor-
tunities for improvement, particularly for interest rate calculations. Most Mexi-
cans do not understand how interest is compounded and calculated, and are not
familiar with the concept of portfolio diversification. However, the majority of survey
respondents correctly answered questions related to basic numeracy and the defini-
tion of inflation, and were familiar with the concept of interest paid on a loan. The
level of financial knowledge is positively correlated with education and income. Defi-
ciencies in financial knowledge suggest challenges in choosing financial products.
Half of the surveyed population stated they were never taught how to manage their
money—for those who did receive guidance, the primary source was a parent.
EXECUTIVE SUMMARY
xvii
COMPARING FINANCIAL CAPABILITY
Analysis of survey data yields seven behavioral and three attitudinal
components of overall financial capability (budgeting, living within means,
monitoring expenses, using information, not overspending, covering unex-
pected expenses, saving, attitude toward the future, not being impulsive,
and achievement orientation). Financial knowledge is positively associated with
increased financial capability for 7 out of the 10 components, and after controlling for
sociodemographic factors, is highly correlated with the not overspending capability,
followed by achievement orientation, saving, and living within means.
Five distinct clusters in the sampled population were identified using indi-
vidual scores on the components of financial capability. These clusters are:
unsophisticated money managers (22 percent), short-term money managers
(33 percent), young impulsive spenders (12 percent), affluent but disorganized
(9 percent), and careful money managers and planners (25 percent). The first two
categories, comprising 55 percent of the population altogether, are made up of
predominantly low-income and informal sector workers. The unsophisticated money
managers do live within their means, but show limited planning, budgeting, and
monitoring of finances, and make little use of savings and credit products. The short-
term money managers, on the other hand, are strong at day-to-day financial manage-
ment, and half of these are using financial services. However, most lack the skills and
income to save adequately and make provisions for the future.
INTERNATIONAL PERSPECTIVES
Compared to survey respondents from other countries (Armenia, Colombia,
Lebanon, Nigeria, Turkey, and Uruguay), Mexicans report a relatively shorter
time horizon for financial planning and are less likely to plan how they would
spend their money. They do, however, report being more inclined to save. Mexico’s
budgeting score, measuring the extent to which people plan use of income, was
lower than six of the seven countries for which data were collected, the exception
being Lebanon. Mexicans also expressed more of a short-term focus as measured by
scores on questions of time preference. However, for the saving score, which reports
perception of ability to save, Mexico was among the highest of the seven countries.
LINKAGES BETWEEN FINANCIAL CAPABILITY AND FINANCIAL INCLUSION
Both financial knowledge and financial capability are positively associated
with a use of formal financial products such as bank accounts and credit
cards. Use of formal financial products (bank accounts, credit cards, personal loans,
mortgage, and insurance) is more common among men, urban residents, high-
income earners, and formal sector employees. Informal sources of savings and credit
(tandas, pawn shop loans, loans from family or friends) are largely utilized on an

FINANCIAL CAPABILITY IN MEXICO: RESULTS FROM A NATIONAL SURVEY ON FINANCIAL BEHAVIORS, ATTITUDES, AND KNOWLEDGE
xviii
ad hoc basis by lower-income segments of the population to save for emergencies
and cover fluctuations in income, as well as to pay for food and other necessities.
Results suggest that banking correspondents increase access to formal financial
products primarily for individuals with high financial capability or high financial
knowledge (as measured by a battery of financial literacy questions).
CONCLUSIONS AND POLICY RECOMMENDATIONS
Promoting financial capability and financial knowledge can accelerate finan-
cial inclusion and support responsible use of financial products by consumers
at all income levels. The findings presented in this report show how financial
capability and financial inclusion varies significantly with factors such as educational
attainment, income, employment, and geographic location. Additionally, the analysis
highlights the strengths (disposition to save) and weaknesses (planning behaviors) of
overall financial capability for most Mexicans.
Increasing the overall financial capability of Mexicans will require a multi-
pronged, multistakeholder strategy involving improved design of financial
management tools and financial products, targeted financial education to
enhance capability, and supportive regulation ensuring adequate consumer
protection. Government agencies at national and local levels, banks and other finan-
cial institutions, education institutions, the media, and nongovernmental organiza-
tions can all play a role in improving financial capability. Diverse strategies—such as
the development of user-friendly financial planning and monitoring tools, strength-
ening the infrastructure for expansion of appropriately designed financial products,
supporting regulation ensuring adequate consumer protection, and implementing
well-designed financial education interventions—all have the potential to enhance
financial capability in Mexico. Table E.1 summarizes the report’s policy recommenda-
tions with respect to each of the challenges noted above.

EXECUTIVE SUMMARY
xix
TABLE E.1 RECOMMENDATIONS TO SUPPORT IMPROVED MONEY MANAGEMENT AND FINANCIAL PLANNING AND REDUCE VULNERABILITY IN MEXICO
MAIN CHALLENGE POLICY GOALPOLICY INSTRUMENT OR PROGRAM
(AND SUGGESTED TIME FRAME)
Daily money management and planning ahead
Limited budgeting and
monitoring of expenses:
just 41% budget regularly
and 20% monitor expenses
rigorously
Build consciousness of
budgeting and monitoring
behaviors by using tech-
nology to facilitate expense
tracking and budgeting
� Support the development of mobile phone– and Internet-based
personal finance tools (such as Juntos Finanzas and the CON-
DUSEF tool for family budgeting) and their distribution through
financial and educational institutions (short term)
� Encourage financial institutions and other stakeholders to use
text messages and/or social media to relay notices and informa-
tion related to personal finance, such as managing account bal-
ances, loan repayment, etc. (short term)
Vulnerability to shocks:
34% believed they could
cover a major unanticipated
expense and 70% reported
regular or occasional
difficulties covering basic
expenses
� Encourage people to save
for unanticipated major
expenses
� Create mechanisms to
encourage recipients of
social assistance to save
� Encourage private, and require state-owned, financial institutions
to pilot product design features supporting savings mobilization
(medium term)
� Adjust contract between relevant government entities to enable
recipients of social assistance to save a portion of their social
benefits in their associated account and emphasize savings
mobilization in financial literacy training to social benefit recipi-
ents (medium term)
Limited funds for retirement
and other predictable life
events: 28% of those under
the age of 60 has plans to
cover their expenses fully in
old age
Encourage a culture of
saving for retirement and
other predictable life-cycle
events
� Support campaigns to raise awareness of the need to increase
voluntary saving for retirement through entertainment and
media channels (medium term)
� Public and private institutions providing financial education should
develop programs centering around a specific teachable moment,
such as retirement or a milestone life event such as the com-
mencement of higher education or birth of a child (medium term)
Decisions about financial products and formal financial knowledge
Persistent financial inclu-
sion gaps: 49% do not
currently use any financial
product, formal or informal,
for saving and credit pur-
poses
Continue to develop finan-
cial infrastructure to expand
the provision of regulated
financial products
� Expand the range of deposit services by supporting regulations
that would allow financial cooperatives and regulated deposit-
taking microfinance institutions to operate bank correspondents
in rural and marginalized locations (short term)
� Widen the scope of transactions executed through banking agents
by building the business case for low-risk deposit accounts and
additional services such as microinsurance (medium term)
� Build a stronger mobile payments network by enhancing regulation
to support interoperability among different mobile network opera-
tors and supporting potentially transformational business models
(such as mobile point-of-sale schemes) (medium term)
� Scale up promising programs that support rural adoption of mobile
payments, such as the Telecomm pilot in Oaxaca (short term)
� State development banks could pilot a program to support link-
ages from informal to formal sources of savings and credit, such
as tandas to banks (medium term)
� Mexican authorities could issue more specific rules to promote
the marketing of basic bank accounts (medium term)
(continued)

FINANCIAL CAPABILITY IN MEXICO: RESULTS FROM A NATIONAL SURVEY ON FINANCIAL BEHAVIORS, ATTITUDES, AND KNOWLEDGE
xx
MAIN CHALLENGE POLICY GOALPOLICY INSTRUMENT OR PROGRAM
(AND SUGGESTED TIME FRAME)
Limited level of formal
financial knowledge hin-
ders decision making on
financial products: just 37%
could calculate a simple
interest rate
Support well-timed, targeted
financial education interven-
tions that equip all segments
of the population to respon-
sibly use formal financial
services
� Mexican authorities could establish a policy framework for finan-
cial education that considers the inventory of existing programs
and incorporates the mixed evidence on the impact of financial
education (short term)
� Mexican authorities could consider incorporating financial edu-
cation modules in public school curricula and experiential educa-
tion, involving household members in assignments to optimize
spillovers (medium term)
� Continue to collect and analyze data to strengthen the empirical
basis for policies related to financial capability, e.g., through the
National Survey on Financial Inclusion (medium term)
Formal financial products,
even bank correspondents,
are primarily used by indi-
viduals with high financial
capability or high financial
knowledge
Support consumer protec-
tion interventions that help
mitigate effects of limited
formal financial knowledge
� Mexican authorities and other stakeholders could consider
scaling up mass media interventions (e.g., telenovelas, radio)
to disseminate key messages related to financial capability
(short term)
� Mexican authorities could require regulated financial institutions
to incorporate research on good practices for disclosure and
pricing regimes for financial consumers; these measures could
promote the use of formal financial products among less knowl-
edgeable segments of the population (medium term)
� Develop market conduct regulations governing banking transac-
tions occurring outside the traditional banking infrastructure
(medium term)
TABLE E.1 RECOMMENDATIONS TO SUPPORT IMPROVED MONEY MANAGEMENT AND FINANCIAL PLANNING AND REDUCE VULNERABILITY IN MEXICO (continued)

1
CHAPTER 1
I ntroduction
1.1 CONTEXT
In the last decade, the financial landscape in Mexico has been altered by a sharp
increase in the availability of consumer financial products and services. To broaden
outreach and stimulate competition, Mexican banking authorities have supported
legal changes to permit specialized banks. This has facilitated the creation of
banks backed by retailers such as Banco Azteca and Banco Walmart, which have a
strong physical presence throughout the country. Legislation to provide an enabling
framework for third parties, such as neighborhood stores or pharmacies, to deliver
banking services (corresponsales, or correspondents) and to establish bank accounts
managed via mobile phones was passed in 2009 and 2010, respectively; together,
this legislation increases the accessibility and convenience of financial services
beyond medium-size urban centers. As of October 2012, 60 percent of Mexico’s
2,456 municipalities were served by a bank branch or bank correspondent, up from
36 percent in June 2009 (CNBV 2009). Credit card use has also expanded significantly.
Consequently, Mexican consumers are confronted with an array of financial deci-
sions involving credit, savings, investments, and insurance more complex than in
previous decades.
As access to finance expands, the ability to make sound financial decisions and use
financial products responsibly has become more crucial. Good financial decision-
making skills help consumers achieve higher levels of individual and family welfare—
particularly in households that are vulnerable to economic shocks, such as loss
of income. When resources become strained, the effects of suboptimal financial
decisions can be more severe. In the aftermath of the global financial crisis, finan-
cial literacy and consumer protection issues have gained new prominence both in
Mexico and worldwide.
Promoting responsible financial inclusion and education has been a high priority of
the Mexican government. In fact, in 2006, financial education for the Mexican popula-
tion was specifically named a priority of the government. In 2008, a unit dedicated
to supporting financial inclusion was set up in the Mexican National Banking and
FINANCIAL CAPABILITY IN MEXICO: RESULTS FROM A NATIONAL SURVEY ON FINANCIAL BEHAVIORS, ATTITUDES, AND KNOWLEDGE
2
Securities Commission (CNBV). In 2009 and 2010, modifications of the Law for Trans-
parency and Regulation of Financial Services expanded the regulatory and supervi-
sory capacity of the National Commission for the Protection and Defense of Users of
Financial Services (CONDUSEF) with the aim of helping eliminate predatory lending
practices.
Two coordination bodies were established by the government in 2011 to enhance
financial education and financial inclusion in Mexico. The Committee on Financial
Education (CEF), chaired by the Ministry of Finance, was created as a coordinating
and consulting board for the public sector and other stakeholders involved in finan-
cial education development (including CONDUSEF, state-owned banks, and public
finance institutions). The committee is charged with designing and implement the
National Strategy on Financial Education. It is chaired by the Ministry of Finance and
Public Credit. The National Council for Financial Inclusion (CONAIF) was created as a
board for consultation, advice, and coordination between domestic financial regula-
tory bodies and to oversee the National Policy on Financial Inclusion.
Internationally, Mexico has taken a leadership role in promoting financial inclusion. It
was a founding member of the Alliance for Financial Inclusion, and the CNBV presi-
dent sits on that organization’s board. Financial inclusion was also a key priority
established by Mexico in its capacity as chair of the G20 in 2012. In this context,
Mexico has worked with the Global Partnership for Financial Inclusion and the Inter-
national Network for Financial Education (INFE). The priority attached to these issues
by the country led to the commissioning of the present financial capability study by
the World Bank—the first of its kind in Mexico. Accelerating responsible financial
inclusion of the poor is an important part of the World Bank’s goal of promoting
shared prosperity in Mexico.
An increasing number of institutions are promoting financial education programs
among different audiences. A 2009 mapping of financial education initiatives
(Heimann and Sainz 2009) found 53 national programs targeting diverse segments
including students, teachers, housewives, businesspeople, and migrant workers.
These initiatives were being provided by a variety of financial institutions, public
organizations, and nongovernmental organizations (NGOs), but in many cases
without a clear market diagnostic.
1.2 WHY THIS REPORT?
The CNBV and CONDUSEF requested support from the World Bank to develop and
execute a nationally representative survey on financial capability. The survey instru-
ment used was developed and implemented with the support of the Russia Trust
Fund for Financial Literacy and Education as part of a global program (box 1.1). An

CHAPTER 1. INTRODUCTION
3
initial phase of qualitative research was conducted in the six geographic regions of
Mexico in various urban and rural settings. The Mexican research included 13 focus
groups in October 2010 and 50 in-depth interviews conducted from April to June
2011. This Mexican qualitative research, and the research conducted in a range of
low- and middle-income countries worldwide, was used to develop a comprehensive
questionnaire on financial capabilities, which was piloted in the state of Puebla in
November 2011 and administered to 2,022 Mexican adults nationwide in June and
July 2012 (figure 1.1). Although Mexico has a wealth of available financial inclusion
data, this report presents the first nationally representative study to detail the finan-
cial behavior, attitudes, and knowledge that comprise financial capability. Comple-
BOX 1.1 FINANCIAL CAPABILITIES AND KNOWLEDGE SURVEY DATA FEATURED IN THIS REPORT
The Mexican Financial Capability Survey implemented by CONDUSEF, the CNBV, and the World Bank collected a range of
information on financial behavior and financial knowledge. The data collected include sociodemographic characteristics, daily
money management practices, planning for future events, use of and decisions related to financial products/services, and
financial knowledge. The survey used both objective and attitudinal questions.
The 2012 Mexican survey covered a nationally representative sample of 2,022 adults. Adults over age 18 who reported
making financial decisions for their household and/or themselves were eligible for the survey. Respondents were randomly
chosen from each eligible and selected household through the use of a Kish grid. Individuals selected for the survey were
interviewed face to face in their homes by staff of the survey firm Ipsos Bimsa during July and August 2012. Sampling weights
were constructed and applied in the analysis in this report.
A multistage probabilistic survey design was applied, which means that each eligible individual had an equal chance of being
selected. The National Federal Election Register was utilized as a sampling frame. The sample population was stratified by
urban and rural areas (with rural defined as municipalities with fewer than 15,000 inhabitants); localidades, small census
enumeration units, were used as the primary sampling units. The distribution of the sample in both rural and urban areas
was made according to the proportion of the weight of the localidades relative to the total population, with adjustments to
provide greater representation to urban areas, which contain a greater proportion of the population. The estimated margin of
error for the sample is ±3 percent for a level of confidence of 95 percent.
Comparable data are available for a range of low- and middle-income countries. The survey questions were developed by
the Russia Trust Fund for Financial Literacy and Education, which facilitated the collection of similar data using comparable
methodologies in six other countries: Armenia, Colombia, Lebanon, Nigeria, Turkey, and Uruguay. The Mexican questionnaire
was customized to include additional survey questions on financial knowledge from the Organisation for Economic
Co-operation and Development/International Network on Financial Education (OECD/INFE) study, as well as questions on
preferences and the use of government programs that were not part of the common core on financial capability.
This 2012 survey collected data from adults from all regions of Mexico with a range of sociodemographic characteristics. Of
those surveyed, slightly more than half (53 percent) were female. The full age distribution of the adult population over age 18
was covered. The summary statistics for selected sociodemographic factors are presented in table A.1 in appendix A.

FINANCIAL CAPABILITY IN MEXICO: RESULTS FROM A NATIONAL SURVEY ON FINANCIAL BEHAVIORS, ATTITUDES, AND KNOWLEDGE
4
mentary national studies include the 2008 Survey on Financial Culture conducted by
Banamex and the National Autonomous University of Mexico (Banamex-UNAM 2008);
the 2011 National Firms’ Finance and Competitiveness Survey (ENAFIN) conducted
by Banxico, the Inter-American Development Bank, and the CNBV; and the 2012
National Survey on Financial Inclusion (ENIF) conducted by CNBV and the National
Statistics Institute for Mexico (INEGI). In addition, the Financial Diaries project, which
provides a qualitative record of the financial lives of poor people, began in 2012.
Global annually updated data sets, such as the World Bank’s Findex, the International
Monetary Fund’s Financial Access database, and the World Bank´s Enterprise Survey
data, provide complementary information on financial inclusion.
This report has four objectives:
� To provide empirical evidence to understand the financial behavior, attitudes,
and knowledge of the Mexican population
FIGURE 1.1 COVERAGE OF THE MEXICO FINANCIAL CAPABILITY SURVEY
ChihuahuaSonora
Durango
Oaxaca
Jalisco
Chiapas
Sinaloa
Zacatecas
Guerrero
Morelos
Campeche
Yucatan
Tamaulipas
Coahuila de Zaragoza
Nuevo Leon
Baja California
Puebla
Veracruz-Llave
Baja California Sur
NayaritSan LuisPotosí
México QuintanaRoo
Tabasco
HidalgoGuana-juato
Michoacán de Ocampo
Colima
Querétaro de Arteaga
Tlaxcala
Distrito Federal
Aguascalientes
Source: World Bank and Government of Mexico Financial Capability Survey data.
Note: Surveyed states are in orange; nonsurveyed states are in gray.

CHAPTER 1. INTRODUCTION
5
� To support the design of public policies to enhance both the knowledge about
and the quality of financial services
� To highlight vulnerabilities and gaps in particular segments of the popula-
tion with the goal of improving and focusing public policies and interventions
where they are most needed
� To provide a basis for international comparison.
1.3 WHAT IS FINANCIAL CAPABILITY?
The term “financial capability” refers to a broader concept than financial literacy
alone. Although the specific definition varies from study to study, financial literacy
is often equated with the knowledge and skills to make key financial decisions.
Studies tend to measure financial literacy based on questions that test knowledge
of financial concepts—such as the time value of money (inflation), interest rates,
compounding, and risk diversification—that are needed to make key financial
choices (Huston 2010; Lusardi and Mitchell 2011; Xu and Zia 2012).
Financial capability encompasses an individual’s behavior and attitudes related to his
or her finances. Approaches differ, but financial capability recognizes that knowledge
alone is necessary but not sufficient to make sound financial decisions and to access
and use financial products/services responsibly. The analysis of financial capability
that was pioneered in the United Kingdom centered on four areas: managing money,
planning ahead, choosing products, and staying informed (Atkinson et al. 2006). A U.S.
study (Lusardi 2011) measured Americans’ financial capability in four areas: making
ends meet, planning ahead, managing financial products, and financial literacy and
decision making. This report describes Mexico’s financial capability related to daily
money management, planning ahead, and choosing financial products/services; it
also explores levels of financial knowledge and the complex relationship between
financial capability, knowledge, and inclusion.
Elements of financial capability—particularly financial knowledge—have been linked
to a range of behavioral outcomes. Much literature to date has analyzed behaviors
related to financial knowledge. Studies on the United States (Lusardi and Mitchell
2009), Italy (Fornero and Monticone 2011), and Japan (Sekita 2011) find that those
who are less financially literate are less likely to plan for retirement. Those with
more limited financial knowledge are also less likely to choose mutual funds with
lower fees (Hastings and Tejeda-Ashton 2008). There are also linkages between
financial literacy and debt outcomes. Lusardi and Tufano (2009) find that individuals
with lower levels of debt literacy tend to transact in a high-cost manner, incurring
a higher debt burden and borrowing at a greater cost. The less knowledgeable also

FINANCIAL CAPABILITY IN MEXICO: RESULTS FROM A NATIONAL SURVEY ON FINANCIAL BEHAVIORS, ATTITUDES, AND KNOWLEDGE
6
report excessive debt loads or that they are unable to judge their debt position.
Although there is less evidence to date, attitudes and preferences are also consid-
ered to be important elements of financial capability. Mandell and Klein (2007) find
evidence supporting motivation as a factor in increasing the financial literacy of
respondents.
The findings in this report will facilitate discussion about how best to increase finan-
cial capability and boost the ability of people to manage their finances in Mexico.
Educational interventions (through schools, financial institutions, and the mass
media) are the most commonly mentioned strategies, but financial capability facili-
tates a more comprehensive approach that considers behaviors and attitudes to help
people make better choices in the context of the services and products available to
them.
This report describes a baseline measure of the financial capability of the Mexican
adult population and highlights key results from the first national survey of 2,022
Mexicans aged 18 and over. Chapter 2 describes key findings related to daily money
management and financial planning behaviors and attitudes. Chapter 3 examines
decisions related to the use of financial products and level of financial knowledge.
Chapter 4 summarizes key behaviors and attitudes into financial capability scores,
facilitating the creation of profiles and comparisons among different segments of the
population. Chapter 5 presents international comparisons. Chapter 6 examines the
relationship between financial capability, financial knowledge, and financial inclusion.
Chapter 7 provides policy recommendations related to the key challenges to finan-
cial capability identified in the report.

7
CHAPTER 2
Daily money management and financial planning
This chapter explores the behaviors and attitudes related to participation in finan-
cial decision making, budgeting and monitoring the use of money, balancing
income and expenses to make ends meet, saving, and long-term financial planning.
The survey results show that 91 percent of Mexican adults actively participate in
household expenditure decisions. The majority of household financial managers are
women (54 percent), even though women contribute to household incomes less
than do men. For the majority of households, daily money management and planning
processes are imprecise. Less than half (41 percent) of all households consistently
budget, and just 20 percent monitor expenses rigorously. Many Mexican households
are financially strained, with 70 percent reporting regular or occasional shortages
of funds to cover basic expenses such as food and housing. Most Mexicans have
made no provisions to cover major expenses, either planned (such as school fees or
weddings) or unplanned (such as job loss or an accident). Nearly two-thirds of those
surveyed cite an orientation toward the present rather than the future. Planning for
old age is infrequent, with less than a third of the population under the age of 60
reporting any plans in place to cover old age expenses.
2.1 CHARACTERISTICS OF FINANCIAL DECISION MAKERS
Of the adults surveyed, 91 percent actively participated in a range of household
expenditure decisions, while 6 percent were responsible only for their personal
expenses. The remaining 3 percent were excluded from the survey, because they
reported not making financial decisions for themselves or the household; this
resulted in a total sample of 2,022. Common household expenditure decisions
included planning how money was spent, paying household bills (e.g., rent), and/or
making financial decisions for the household.
Females play a key role in household financial matters even when they are not the
heads of household. Nearly half of the women in the sample reported that they did not
contribute financially to the household, as opposed to just 12 percent of men (figure 2.1).
However, a higher percentage of women surveyed participated in household financial

FINANCIAL CAPABILITY IN MEXICO: RESULTS FROM A NATIONAL SURVEY ON FINANCIAL BEHAVIORS, ATTITUDES, AND KNOWLEDGE
8
decisions than men (table 2.1). And a majority of women responded that they ensured
that all regular household expenses are paid. Slightly more than half the women making
financial decisions identified themselves as partners or wives, while 27 percent were
heads of household; the remainder were other types of family relations.
The few adults who did not report making any financial decisions for the household
were primarily the young (age 18–24) and the old (age 60 and above). As shown in
table 2.1, young adults had the highest share (17 percent) of those who reported
responsibility only for personal expenses. Those who reported not making any finan-
FIGURE 2.1 CONTRIBUTIONS TO THE HOUSEHOLD BUDGET AND PARTICIPATION IN FINANCIAL DECISION MAKING, BY AGE AND GENDER
0
20
40
60
80
100
18–24 25–29 30–39 40–49 50–59 60–69 70–79 ≥ 80 Male Female
Percent
Contributes to budget Participates in decision making
Source: World Bank and Government of Mexico Financial Capability Survey data.
TABLE 2.1 FINANCIAL DECISION-MAKING ROLES
CHARACTERISTIC
% MAKING HOUSE-HOLD FINANCIAL
DECISIONS
% MAKING PER-SONAL FINANCIAL
DECISIONS
% NOT MAKING ANY FINANCIAL
DECISIONS
Male 88 6 6
Female 94 5 1
Age
18–24 82 17 1
25–46 94 4 2
47–59 91 2 7
≥ 60 90 3 6
Highest education level
Primary or below 94 3 3
Secondary 90 6 3
Tertiary 83 11 6
Source: World Bank and Government of Mexico Financial Capability Survey data.
Note: n = 2,090.

CHAPTER 2. DAILY MONEY MANAGEMENT AND FINANCIAL PLANNING
9
cial decisions—particularly among the young and the old—tended to be economi-
cally dependent on the household head and reported that they did not contribute to
the household budget.
2.2 BUDGETING AND MONITORING EXPENSES
Although about 70 percent of adults said they made plans about how to use the
money they received, adherence to these plans was more limited. Adults who planned
were split between those who always planned and those who only sometimes planned
(figure 2.2). While 61 percent of those surveyed reported keeping to their expenditure
plans (approximately one-third all the time, and more than one-quarter some of the
time); 9 percent did not keep to their plans at all, and 31 percent did not have any plan
at all. Just 21 percent of those surveyed characterized their plans as exact as opposed
to rough (figure 2.3). Being a woman, an urban dweller, or having a higher income
was associated with a greater likelihood of making exact plans. The 31 percent of the
surveyed population that reported not planning at all were characterized by lower
education levels, informal employment, and living in a rural area.
FIGURE 2.2 MAKING AND ADHERING TO PLANS ABOUT BUDGETING
0 50 100
Keep to plans made
Make plans about howto use money received
Always Sometimes
Percent
Not at all/never
34% 27% 39%
41% 28% 31%
Source: World Bank and Government of Mexico Financial Capability Survey data.
Less than a quarter of survey respondents knew exactly how much they had spent
in the last week, suggesting a low level of precision in daily money management.
Although 63 percent of those surveyed said they knew how much their household
had available for daily expenses, most characterized this knowledge as rough rather
than exact (figure 2.4). And while 52 percent knew how much they had spent person-
ally in the last week, just 18 percent knew exactly how much they had spent person-
ally in the last week.1 Being a formal sector employee or a higher-income individual
1 These results are similar to findings from the first survey on financial culture (Banamex-UNAM
2008), in which 18 percent of those surveyed reported having some register of their income,
expenses, and debts.

FINANCIAL CAPABILITY IN MEXICO: RESULTS FROM A NATIONAL SURVEY ON FINANCIAL BEHAVIORS, ATTITUDES, AND KNOWLEDGE
10
FIGURE 2.3 PLANNING BEHAVIOR BY GENDER, LOCATION, AND INCOME
0
20
40
60
80
Male Female Rural Urban Lowestincome
Low-middleincome
Middle-high
income
Highestincome
Make rough plan Make exact plan
Percent
Source: World Bank and Government of Mexico Financial Capability Survey data.
FIGURE 2.4 PRECISION OF MONEY MANAGEMENT
0
20
40
60
Exact Rough Does not know
Knowledge of spendingin last week
Knowledge of amountavailable for current spending
Percent
18
33
48
22
41 37
Source: World Bank and Government of Mexico Financial Capability Survey data.
is correlated with increased likelihood of monitoring spending. In terms of attitudes,
perceiving oneself as disciplined in money matters was correlated with a higher
degree of precision in managing money.
2.3 MAKING ENDS MEET: BALANCING INCOME AND EXPENSES
More than 70 percent of the surveyed population experienced regular or occa-
sional financial strain, such as being short of money to cover basic necessities. Only
29 percent of those surveyed reported having money left over after paying for basic
expenses such as food and other necessities. Twenty percent of the surveyed sample
reported being regularly short of money to cover basic expenses, and 51 percent

CHAPTER 2. DAILY MONEY MANAGEMENT AND FINANCIAL PLANNING
11
reported occasional shortfalls. For those with funds remaining after paying their
basic expenses, saving to provide a cushion against unexpected shocks was by far
the most common use.
Low-income individuals, the elderly, informal sector employees, and those whose
schooling ended with primary education or less were particularly vulnerable to finan-
cial strain. Low-income levels and seasonal income fluctuations were two of the
most commonly cited reasons for shortfalls in the ability to meet basic expenses.
Not surprisingly, income levels were highly correlated with limitations in being able
to make ends meet (figure 2.5). Having no knowledge or limited knowledge of how
much money was spent in the last week was correlated with being short of money
to cover basic necessities.
FIGURE 2.5 SHORTFALLS IN MONEY FOR NECESSITIES
No
0 50 100
Highest income
Middle-high income
Low-middle income
Lowest income
Regularly Sometimes
Percent
28 54
18 38 43
12 51 36
14 55 31
17
Source: World Bank and Government of Mexico Financial Capability Survey data.
Informal borrowing was a common coping strategy to ease financial strain. Nearly
half of those who ran short of money cited borrowing from family or friends as their
most common solution, and 29 percent of respondents reported being in debt to a
friend or family member. Thirty percent of those surveyed reported regularly or occa-
sionally borrowing money to buy food or other necessities, and 43 percent reported
borrowing to pay off debts (figure 2.6). Having less than a high school education and
a lower income was associated with a greater likelihood of borrowing to cover debts,
with all other variables held constant. Use of financial services is discussed in more
detail in chapters 3 and 6.

FINANCIAL CAPABILITY IN MEXICO: RESULTS FROM A NATIONAL SURVEY ON FINANCIAL BEHAVIORS, ATTITUDES, AND KNOWLEDGE
12
FIGURE 2.6 COPING STRATEGIES TO COVER SHORTFALLS
Borrow to pay off debts
Borrow to buy food or other necessities
Regularly Sometimes No
Percent0 50 100
4 39 57
5 25 70
Source: World Bank and Government of Mexico Financial Capability Survey data.
2.4 PLANNING FOR MAJOR EXPENSES: EXPECTED AND UNEXPECTED
Less than half (45 percent) of those who had a major upcoming expense planned
believed they could cover it. Twenty-one percent of those surveyed projected a
major upcoming expense in the next year equivalent to one month’s income, such as
a wedding or other occasion, or school fees. Of those who felt they could not cover
the planned expense, less than half had made some plans toward being able to meet
the obligation.
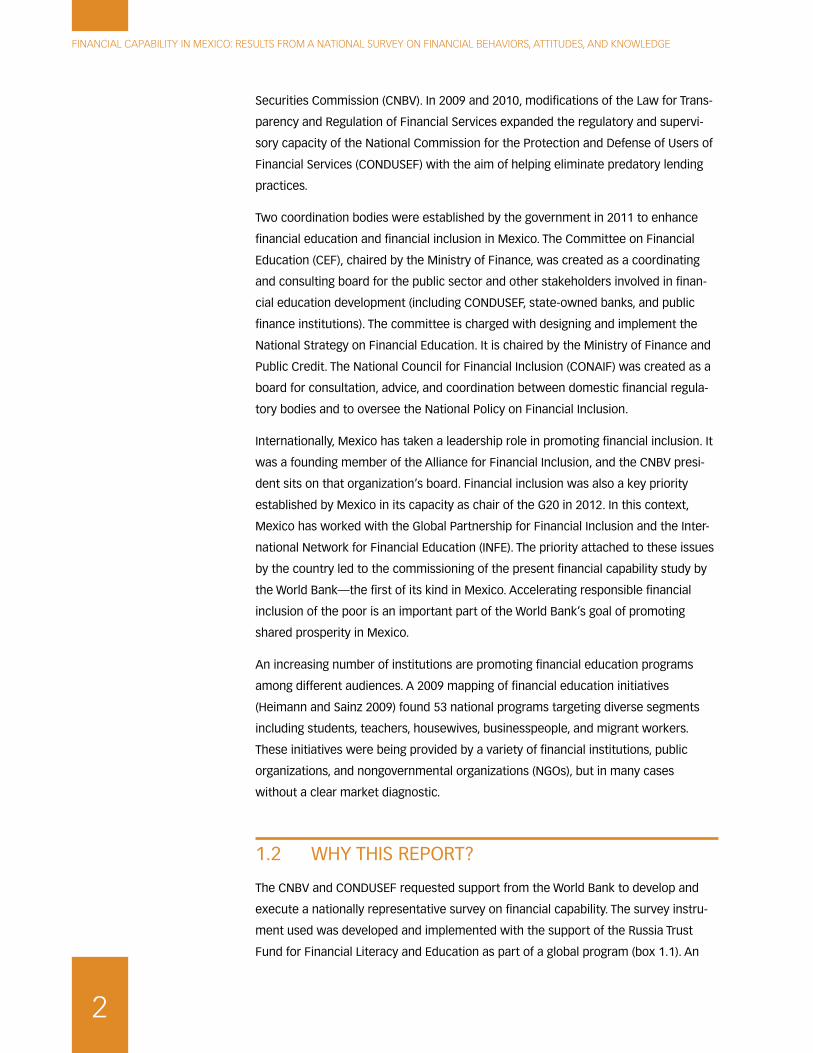
Overall, just one-third of respondents believed they could cover a major unplanned
expense, compared to about one-quarter of low-income individuals. Only 34 percent
of those surveyed had done anything to prepare for an unplanned expense equiva-
lent to one month’s income. Perceived ability to cope with a major unexpected
expense increases greatly with income, as shown in figure 2.7. Those employed in
the formal sector also professed a greater ability to cope with unexpected shocks
than those in the informal sector. This vulnerability to shocks is a source of stress.
Eighty-two percent of those surveyed were worried about this situation, including
some of those who felt they had the means to cover this unexpected expense.
2.5 PLANS FOR CHILDREN’S FUTURE AND OLD AGE
Nearly half of those with one or more dependent children had made some plans to
provide for their education. Among the sample, 55 percent had dependent children
in their household, and the number of children in the household was not correlated
with these plans. Plans to save for children’s inheritance were less common, with
only 16 percent of respondents with dependent children citing such plans. Slightly
less than one-third of those with dependent children in their household did not
report any plans to support their future; this proportion was larger among low-
income families.
CHAPTER 2. DAILY MONEY MANAGEMENT AND FINANCIAL PLANNING
13
Less than a third of the population under the age of 60 made plans to cover their
expenses fully in old age. The most common strategies envisioned by this age group
to cover these expenses were to accumulate savings or other financial assets, or
seek financial support from the family; just 13 percent reported contributing to a
pension (either voluntary or compulsory) through an employer or the government
(figure 2.8). A minority of respondents under the age of 60 (28 percent) believed that
these strategies would fully cover their expenses in old age, and another 21 percent
cited partial coverage; the majority (51 percent) reported having no strategies for
coverage at all. A lack of strategies was highly correlated with lower income. And
a higher percentage of those who were employed informally had no provisions for
old age, as they did not benefit from government- or employer-provided support
(figure 2.9). A higher percentage of women than men had no provisions for old age,
possibly reflecting their more limited participation in the formal labor force (roughly
a 5 percent gap, according to ILO 2011 data). The vast majority of those surveyed
(87 percent) cited the ability to fund old age expenses as a source of concern. In a
global overview, Lusardi and Mitchell (2011) find that retirement planning is a good
proxy for retirement wealth, because those who have calculated how much they
need to save reach retirement age with three times the wealth of those who did no
such calculations.
Nearly two-thirds of those over age 60 reported having insufficient or no provi-
sions for old age expenses. Seeking support from family and friends was the most
commonly cited strategy, used by one-third of the over 60 population; govern-
FIGURE 2.7 ABILITY TO COVER MAJOR UNEXPECTED EXPENSES, BY INCOME GROUP
0 20 40 60 80 100
Highest income
Middle-high income
Low-middle income
Lowest income
Could not cover,not thought about
Could not cover, thoughtabout doing something
Could not cover, donesomething to plan
Could cover
Percent
23 6 14 57
28 7 19 46
42 10 18 31
50 10 16 24
Source: World Bank and Government of Mexico Financial Capability Survey data.

FINANCIAL CAPABILITY IN MEXICO: RESULTS FROM A NATIONAL SURVEY ON FINANCIAL BEHAVIORS, ATTITUDES, AND KNOWLEDGE
14
ment pensions played a role for almost a quarter of respondents in this age group,
followed by savings and other assets for more than 15 percent (figure 2.8). Other
surveys (e.g., CNBV/INEGI 2012) have indicated that, although by law all formal sector
workers must have a pension or a savings for retirement account, a portion of the
population did not know that they had individual savings for retirement accounts.
FIGURE 2.8 STRATEGIES EMPLOYED TO COVER OLD AGE EXPENSES
Percent0 10 20 30
Support from family/friends
Government pension
Business income
Employer pension
Keep working always
Savings/other financial assets
> age 60
< age 60
40
Source: World Bank and Government of Mexico Financial Capability Survey data.
FIGURE 2.9 COVERAGE OF OLD AGE EXPENSES, BY GENDER AND EMPLOYMENT (<60 YEARS OF AGE)
Has no provision Has provision, not full coverage Has provision, full coverage
Female
Male
Informal
Formal
Percent0 20 40 60 80 100
54 21 26
50 21 29
61 16 22
52 16 32
Source: World Bank and Government of Mexico Financial Capability Survey data.

CHAPTER 2. DAILY MONEY MANAGEMENT AND FINANCIAL PLANNING
15
2.6 ATTITUDES
Nearly two-thirds of the population indicated an orientation toward the present
rather than the future with regard to saving and planning. Impatience has been
shown to play a role in financial behavior, especially on behavior related to
savings and pensions (Hastings and Mitchell 2010). More than two-thirds of the
surveyed population agreed with statements expressing a focus on the present day
(figure 2.10). Lower levels of education and income are correlated with this stated
orientation to the present, while being middle-aged (as opposed to young or old) is
correlated with greater orientation toward the future (see chapter 4). This orientation
toward the present was also correlated with statements in which the respondents
identified themselves as impulsive.
FIGURE 2.10 ATTITUDE TOWARD THE FUTURE
Percent0 20 40 60 80 100
I live more for the present day than tomorrow
The future will take care of itself
I only focus on the short term
Strongly agree Partially agree Partially disagree Strongly disagree
46 25 14 15
47 25 11 16
39 26 16 19
Source: World Bank and Government of Mexico Financial Capability Survey data.
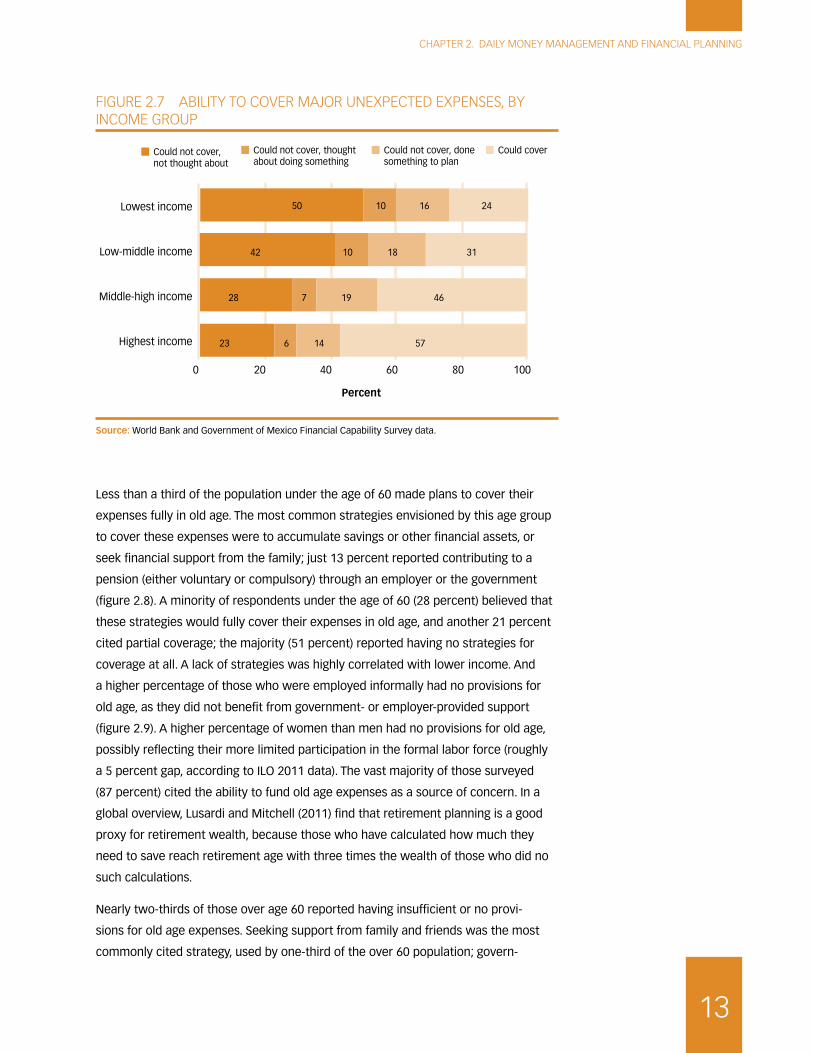
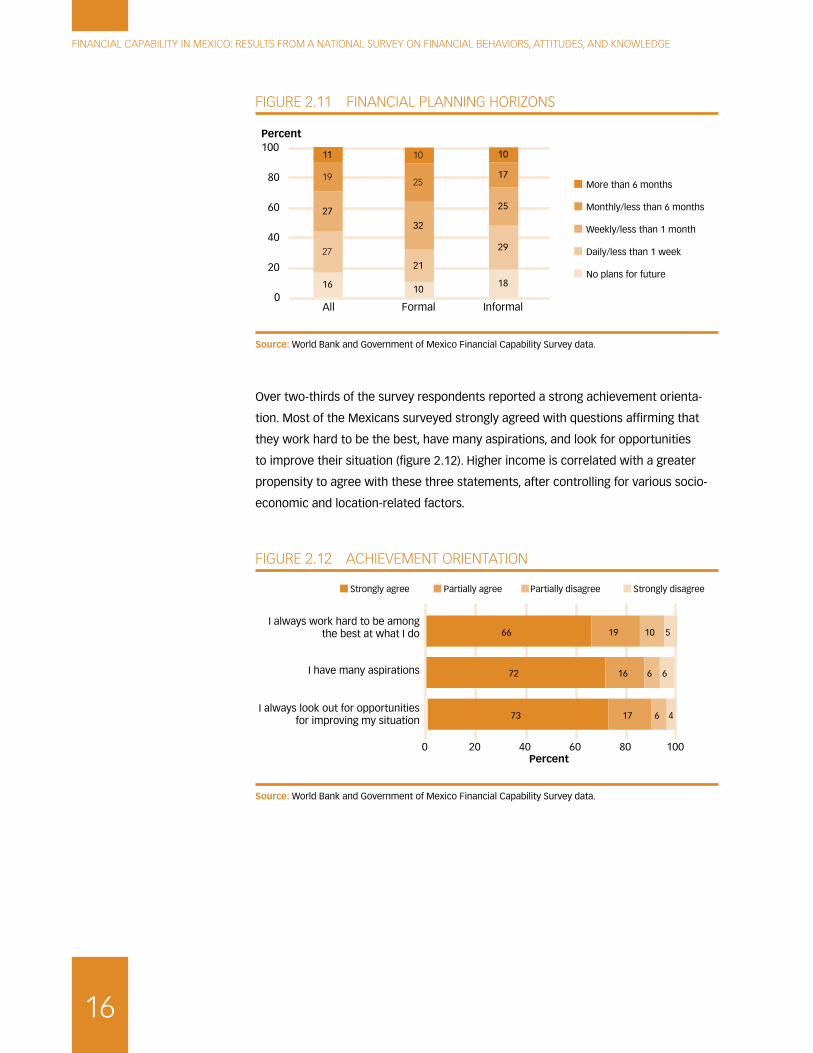
More than half of those surveyed cited a financial planning time frame of less than
a month. Equal percentages—27 percent of respondents—reported their financial
planning time horizon as either less than a week, or as between one week and
one month; 16 percent reported no financial plans for the future at all (figure 2.11).
Those who were employed in the formal sector reported longer time horizons, as
did those in higher-income groups. Stable incomes can facilitate access to products
and services—which in turn can facilitate planning, such as automatic deductions for
savings or pension accounts.
FINANCIAL CAPABILITY IN MEXICO: RESULTS FROM A NATIONAL SURVEY ON FINANCIAL BEHAVIORS, ATTITUDES, AND KNOWLEDGE
16
FIGURE 2.11 FINANCIAL PLANNING HORIZONS
Percent
0
20
40
60
80
100
All Formal Informal
No plans for future
More than 6 months
Monthly/less than 6 months
Weekly/less than 1 month
Daily/less than 1 week
16
27
27
19
11
10
21
32
25
10
18
29
25
17
10
Source: World Bank and Government of Mexico Financial Capability Survey data.
Over two-thirds of the survey respondents reported a strong achievement orienta-
tion. Most of the Mexicans surveyed strongly agreed with questions affirming that
they work hard to be the best, have many aspirations, and look for opportunities
to improve their situation (figure 2.12). Higher income is correlated with a greater
propensity to agree with these three statements, after controlling for various socio-
economic and location-related factors.
FIGURE 2.12 ACHIEVEMENT ORIENTATION
0 20 40 60 80 100
I always look out for opportunitiesfor improving my situation
I have many aspirations
I always work hard to be amongthe best at what I do
Strongly agree Partially agree Partially disagree Strongly disagree
Percent
73 17 6 4
72 16 6 6
66 19 10 5
Source: World Bank and Government of Mexico Financial Capability Survey data.

17
CHAPTER 3
Decisions about financial services and financial knowledge
How people choose financial products that are appropriate for their needs and
how they make choices between similar financial offerings is an important part
of financial capability. Formal knowledge of key financial concepts and the ability to
apply numeracy skills in financial situations are also important in the responsible use
of financial services. This chapter provides a brief overview of the usage of financial
products in Mexico and explores how decisions about financial products are made
and the levels of knowledge that are utilized in decision making.
Data show that 49 percent of the survey population does not currently use any
financial service, whether formal or informal.1 Among those who do, informal loans
from family or friends and accounts at financial institutions are the most commonly
used financial service. Informal sources of credit and savings—including tandas
(informal rotating savings and credit associations), pawn shops, and loans from
family or friends—are largely used on an ad hoc basis by lower-income segments of
the population to save for emergencies and cover fluctuations in income, as well as
to pay for food and other necessities. More than 60 percent of those using financial
services reported verifying terms and conditions and comparing various products
before making financial decisions. However, just 37 percent of the survey popula-
tion was able to do a simple interest rate calculation necessary to compare financial
services. Note that, as discussed in box 3.1, financial surveys undertaken in Mexico
use differing definitions of financial services.
3.1 USAGE OF FINANCIAL SERVICES
Among the range of credit and savings services utilized by the Mexican popula-
tion, informal loans and accounts at financial institutions were the most prevalent
(figure 3.1). Less than a quarter (22 percent) of those surveyed reported currently
receiving credit informally from family or friends. Accounts at financial institutions
1 The Financial Capability Survey defines financial services as including both formal financial
products (e.g., accounts at financial institutions, credit cards) and informal sources of credit and
savings (e.g., loans from family or friends, pawn shops, and tandas).
FINANCIAL CAPABILITY IN MEXICO: RESULTS FROM A NATIONAL SURVEY ON FINANCIAL BEHAVIORS, ATTITUDES, AND KNOWLEDGE
18
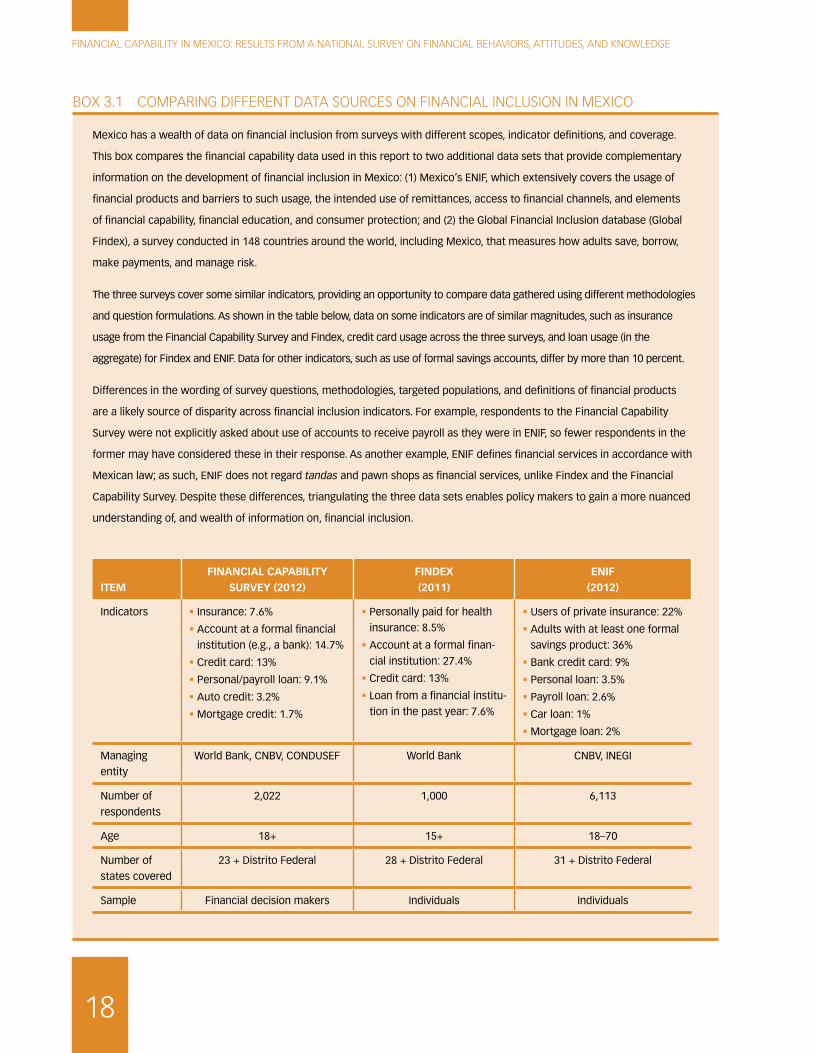
BOX 3.1 COMPARING DIFFERENT DATA SOURCES ON FINANCIAL INCLUSION IN MEXICO
Mexico has a wealth of data on financial inclusion from surveys with different scopes, indicator definitions, and coverage.
This box compares the financial capability data used in this report to two additional data sets that provide complementary
information on the development of financial inclusion in Mexico: (1) Mexico’s ENIF, which extensively covers the usage of
financial products and barriers to such usage, the intended use of remittances, access to financial channels, and elements
of financial capability, financial education, and consumer protection; and (2) the Global Financial Inclusion database (Global
Findex), a survey conducted in 148 countries around the world, including Mexico, that measures how adults save, borrow,
make payments, and manage risk.
The three surveys cover some similar indicators, providing an opportunity to compare data gathered using different methodologies
and question formulations. As shown in the table below, data on some indicators are of similar magnitudes, such as insurance
usage from the Financial Capability Survey and Findex, credit card usage across the three surveys, and loan usage (in the
aggregate) for Findex and ENIF. Data for other indicators, such as use of formal savings accounts, differ by more than 10 percent.
Differences in the wording of survey questions, methodologies, targeted populations, and definitions of financial products
are a likely source of disparity across financial inclusion indicators. For example, respondents to the Financial Capability
Survey were not explicitly asked about use of accounts to receive payroll as they were in ENIF, so fewer respondents in the
former may have considered these in their response. As another example, ENIF defines financial services in accordance with
Mexican law; as such, ENIF does not regard tandas and pawn shops as financial services, unlike Findex and the Financial
Capability Survey. Despite these differences, triangulating the three data sets enables policy makers to gain a more nuanced
understanding of, and wealth of information on, financial inclusion.
ITEMFINANCIAL CAPABILITY
SURVEY (2012)FINDEX (2011)
ENIF (2012)
Indicators � Insurance: 7.6%
� Account at a formal financial
institution (e.g., a bank): 14.7%
� Credit card: 13%
� Personal/payroll loan: 9.1%
� Auto credit: 3.2%
� Mortgage credit: 1.7%
� Personally paid for health
insurance: 8.5%
� Account at a formal finan-
cial institution: 27.4%
� Credit card: 13%
� Loan from a financial institu-
tion in the past year: 7.6%
� Users of private insurance: 22%
� Adults with at least one formal
savings product: 36%
� Bank credit card: 9%
� Personal loan: 3.5%
� Payroll loan: 2.6%
� Car loan: 1%
� Mortgage loan: 2%
Managing
entity
World Bank, CNBV, CONDUSEF World Bank CNBV, INEGI
Number of
respondents
2,022 1,000 6,113
Age 18+ 15+ 18–70
Number of
states covered
23 + Distrito Federal 28 + Distrito Federal 31 + Distrito Federal
Sample Financial decision makers Individuals Individuals

CHAPTER 3. DECISIONS ABOUT FINANCIAL SERVICES AND FINANCIAL KNOWLEDGE
19
or participation in tandas were the primary savings products used by the Mexican
population. Fifteen percent of the respondents currently had an account at a finan-
cial institution, and 11 percent of the respondents participated in tandas.
Nearly half of those surveyed (49 percent) did not report any current financial
product usage. Only around 10 percent of the population cited currently using
credit cards (13 percent), personal or payroll loans (9 percent), insurance products
(8 percent), or loans from cajas de ahorro (savings entities) or pawn shops (8 and 7
percent, respectively); even smaller percentages (2–4 percent) used mortgage or car
loans or financial investments.
Because people use financial services as needed, it is to be expected that reported
current use would be less than usage over a five-year span. But the use of certain
financial sources—particularly informal services such as loans through family or
FIGURE 3.1 PERCENTAGE OF THE MEXICAN POPULATION USING TYPES OF FINANCIAL PRODUCTS CURRENTLY OR IN THE PAST
Percent
0 5 10 15 20 25 30 35
Mortgage credit
Auto credit
Investments
Pawn shop loan
Insurance
Caja de ahorro loan
Personal or payroll loan
Tanda
Credit card
Account at a financial institution
Loan from family or friends
Obtained financial products in last 5 years Currently have financial products
Source: World Bank and Government of Mexico Financial Capability Survey data.

FINANCIAL CAPABILITY IN MEXICO: RESULTS FROM A NATIONAL SURVEY ON FINANCIAL BEHAVIORS, ATTITUDES, AND KNOWLEDGE
20
TABLE 3.1 REASONS FOR SAVING BY RESPONDENTS WHO SAVE (%)
REASON
RESPONDENTS USING/PARTICIPATING IN
BANK TANDANO FINANCIAL INTERMEDIARY
Unforeseen events, emergencies, medical fees 64.2 49.0 54.3
Covering fluctuations in income 15.8 21.7 22.8
Food and other necessary items 13.5 17.9 19.0
A known major expenditure 8.7 12.5 10.0
A planned future purchase 9.5 5.0 3.0
No specific purpose in mind 12.3 6.4 5.0
Investment in business or assets 6.2 6.2 5.1
Source: World Bank and Government of Mexico Financial Capability Survey data.
friends, tandas, and pawn shops—is even more sporadic. Sixty-two percent of those
who had used tandas and 63 percent of those who had used pawn shops in the past
five years reported currently using these services. In contrast, the ratios of current to
past use are higher for formal financial products such as bank accounts (88 percent)
and credit cards (77 percent).
Use of formal financial products (bank accounts, credit cards, personal loans,
mortgage, and insurance) was more prevalent among men, urban residents, high-
income earners, and formal sector employees. Women, rural residents, and low-
income earners more commonly used loans from cajas de ahorro and informal
sources of credit and savings such as tandas and loans from family or friends. A
higher percentage of men than women used all financial services except tandas.
The highest-income group (with monthly income greater than Mex$5,000) used
significantly more formal financial products (particularly credit cards) than the other
income groups, while groups with lower income were more likely to borrow from
family or friends. Respondents who reported no usage of any financial products
tended to be low income and employed in the informal sector. Informal sector
workers were more frequent users of informal services such as tandas and pawn
shops, and were more likely to borrow from family or friends.
Unforeseen shocks were the most commonly cited motivation for saving, irrespec-
tive of the type of savings mechanism. At least half of the savers with bank accounts,
tanda participants, and those who saved without the assistance of a financial inter-
mediary reported saving for unforeseen events (table 3.1). Less commonly cited
motivations for saving were to cover fluctuations in income, food and other neces-

CHAPTER 3. DECISIONS ABOUT FINANCIAL SERVICES AND FINANCIAL KNOWLEDGE
21
sities, and known or planned major expenditure. These motivations were cited by
higher percentages of savers participating in tandas and those saving without finan-
cial intermediaries than those using bank accounts.
Those who received social security through government or formal sector employ-
ment used savings products far more than those who received some form of govern-
ment social assistance (table 3.2). Just over half of those receiving funds from the
Mexican Social Security Institute (IMSS, the social security program for private sector
employees and their families) and 81 percent of those receiving funds from the
Institute for Social Security and Services for State Workers (ISSSTE, the social secu-
rity program that covers federal government workers and their families) saved in
banks. In contrast, less than 20 percent of those receiving social assistance benefits
or those affiliated with Seguro Popular (a Ministry of Health program providing
health services to people working in the informal economy) had a savings account
at a formal financial institution; even their use of informal savings products such
as tandas is lower than for IMSS or ISSSTE recipients. Conversely, IMSS and ISSSTE
recipients used formal sector credit products at much higher rates than did social
assistance and Seguro Popular program participants.
Users of formal savings services were less likely to report being short of money.
A quarter of the users of banks reported ever having run short of money for food
and other necessities, in contrast with 55 percent of participants in tandas and
30 percent of people without financial intermediaries of any sort. Of those who ran
short of money, 80 percent were not associated with any financial intermediary.
By way of explanation, those who used formal savings services had higher income
levels, which contributed to their relative financial stability.
TABLE 3.2 USE OF SOCIAL PROGRAMS AND FINANCIAL PRODUCTS/SERVICES BY SURVEY RESPONDENTS (%)
SOCIAL PROGRAM
% OF SURVEY RESPONDENTS
SAVINGS PRODUCT/SERVICE LOAN PRODUCT/SERVICE
FINANCIAL INSTITUTION TANDA NONE
PERSONAL/PAYROLL
LOAN
FROM CAJA DE AHORRO
FROM FAMILY/FRIENDS NONE
Social assistance 19 18 38 49 7 10 29 85
Seguro Popular 25 16 36 51 6 11 25 85
IMSS 7 51 51 35 24 8 11 74
ISSSTE 19 81 38 40 15 7 17 81
Source: World Bank and Government of Mexico Financial Capability Survey data.

FINANCIAL CAPABILITY IN MEXICO: RESULTS FROM A NATIONAL SURVEY ON FINANCIAL BEHAVIORS, ATTITUDES, AND KNOWLEDGE
22
Although more than 60 percent of borrowers felt they could take on higher levels
of debt, those with nonbank credit were more likely to believe they had borrowed
excessively. More than 60 percent of borrowers receiving personal or payroll loans,
caja de ahorro loans, or loans from family or friends felt they could afford to borrow
more (table 3.3). Higher fractions of borrowers from cajas de ahorro and from family
or friends than from banks felt they had reached their borrowing limit (30 percent
and 28 percent, respectively). More of these nonbank borrowers felt they had
borrowed more than they could afford (9 percent and 10 percent, respectively) than
those who borrowed through payroll and personal loans from banks. Female debtors
were slightly more likely than males to report that they borrowed more than they
could afford, while debtors in higher-income groups and rural dwellers were most
likely to feel they could borrow more.
TABLE 3.3 PERCEPTION OF BORROWING CAPACITY BY RESPONDENTS WHO BORROW (%)
RESPONDENTS BORROWING FROM
PERCEPTIONPERSONAL OR PAYROLL
LOAN (FROM BANK) CAJA DE AHORRO
FAMILY OR FRIENDS
ALL RESPONDENTS
Could afford to borrow more 68.1 60.6 62.2 63.1
Have borrowed to the limit and could
not afford to borrow more
28.5 30.1 27.8 26.1
Have borrowed more than can afford 3.4 9.3 10.0 9.2
Source: World Bank and Government of Mexico Financial Capability Survey data.
3.2 MAKING DECISIONS ABOUT FINANCIAL PRODUCTS
Most of those using financial services reported making careful decisions about them.
The survey results show that more than half the respondents using financial products
searched for information and considered many alternatives when making their deci-
sions about financial products. Moreover, when considering financial product options,
62 percent of the respondents reported detailed knowledge of the terms and condi-
tions (table 3.4). These results must be viewed with some skepticism, however, given
similarly diligent reports of verifying terms and conditions provided by those using
tandas, which do not have terms and conditions that lend themselves to comparison;
and those using pawn shops, which are infamous for steep interest rates. One-third
of respondents reported making little effort in obtaining and product-related informa-
tion. This raises concerns as to how to best match financial products with consumer
needs, given the increasing sophistication of such products.

CHAPTER 3. DECISIONS ABOUT FINANCIAL SERVICES AND FINANCIAL KNOWLEDGE
23
People with formal financial products, with formal sector jobs, and in high-income
groups reported more analysis related to making financial product decisions. Half of
those surveyed stated that they always sought advice before making a major finan-
cial decision. As shown in table 3.4, a larger percentage of people with an account
at a financial institution looked for information, considered alternatives, searched for
the best product, and verified terms and conditions than did people participating in
tandas. In addition, 15 percent more formal sector workers than informal workers
sought information before making financial product decisions, and 25 percent more
of people from the top income group sought information than those from the bottom
income group. Gender did not appear to be a factor influencing the rigor with which
individuals made financial decisions.
3.3 FINANCIAL KNOWLEDGE
Financial knowledge, or financial literacy, refers to the understanding of financial
concepts that complements financial capability (Lusardi and Mitchell 2011). indi-
viduals make sound decisions regarding saving, borrowing, and investment. Financial
knowledge is analyzed separately from the other components of financial capability
in order to maintain the cross-country comparability of results, since not all countries
in the financial capability project used the same set of questions to measure financial
knowledge. In Mexico, the survey used eight questions related to financial knowl-
edge, ranging from relatively basic numeracy questions involving division to more
complex questions about portfolio diversification.
TABLE 3.4 RESPONDENT DILIGENCE IN MAKING FINANCIAL SERVICE DECISIONS, BY CREDIT OR SAVINGS VEHICLE (%)
ACTION TAKEN IN MAKING DECISION
ALL FINANCIAL SERVICES
ACCOUNT AT A FINANCIAL INSTITUTION
PERSONAL/PAYROLL LOAN FROM FORMAL FINANCIAL
INSTITUTION
PARTICI-PANT IN TANDA
USE OF PAWN SHOP
Look for information from
distinct sources
57 71 66 53 52
Consider various alternatives
before deciding
62 76 71 60 60
Look to find the most
appropriate product for needs
68 76 74 68 68
Verify terms and conditions
before contracting
68 81 76 72 64
Verify terms and conditions
in detail
62 66 51 61 60
Source: World Bank and Government of Mexico Financial Capability Survey data.

FINANCIAL CAPABILITY IN MEXICO: RESULTS FROM A NATIONAL SURVEY ON FINANCIAL BEHAVIORS, ATTITUDES, AND KNOWLEDGE
24
The majority of survey respondents correctly answered questions related to basic
numeracy, the definition of inflation, and the concept of interest paid on a loan.
Figure 3.2 illustrates the distribution of responses to questions that measured levels
of financial knowledge. Over 80 percent of respondents correctly answered a ques-
tion testing basic numeracy (division) and a question testing their understanding of
the concept of interest paid on a loan. Almost 60 percent understood the concept
of the time value of money (i.e., inflation—that an amount of money today does not
have the same buying power as the same amount in the future).
FIGURE 3.2 DISTRIBUTION OF RESPONSES TO FINANCIAL LITERACY QUESTIONS
0 20 40 60 80 100
Correct Don’t know Incorrect response
Percent
31
31
37
50
56
58
81
83
29
23
33
23
18
9
8
12
40
46
30
27
26
33
11
5
Compound interest
Portfolio diversification
Calculation of simple interest
Risk and return
Inflation definition
Time value of money
Basic division
Concept of interest paid on loan
Source: World Bank and Government of Mexico Financial Capability Survey data.
However, most Mexicans surveyed could not perform interest rate calculations,
nor were they familiar with the concept of portfolio diversification. Most of those
surveyed showed a marked inability to do basic interest calculations: only 37 percent
could calculate simple interest, and just 31 percent understood the concept of
compound interest.2 This finding corresponds fairly well to survey respondents’ own
self-assessments: just 14 percent of those surveyed characterized themselves as
very capable of calculating interest rates. The inability to do the interest rate calcula-
2 In a cross-country study, Atkinson and Messy (2012) recorded a response to a multiple-choice
compound interest question as correct only if the respondent also correctly answered an
open-ended simple interest rate calculation. If the latter practice were used, 14 percent of the
Mexicans surveyed would be considered as having answered the compound interest question
correctly.
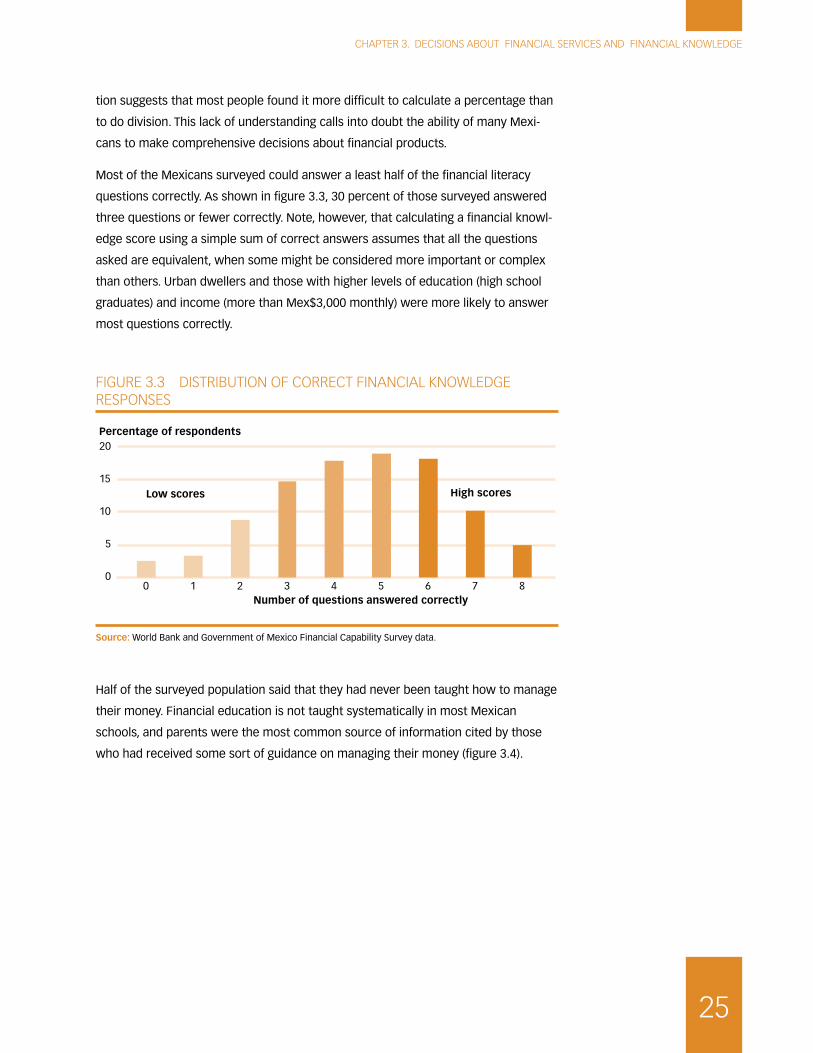
CHAPTER 3. DECISIONS ABOUT FINANCIAL SERVICES AND FINANCIAL KNOWLEDGE
25
tion suggests that most people found it more difficult to calculate a percentage than
to do division. This lack of understanding calls into doubt the ability of many Mexi-
cans to make comprehensive decisions about financial products.
Most of the Mexicans surveyed could answer a least half of the financial literacy
questions correctly. As shown in figure 3.3, 30 percent of those surveyed answered
three questions or fewer correctly. Note, however, that calculating a financial knowl-
edge score using a simple sum of correct answers assumes that all the questions
asked are equivalent, when some might be considered more important or complex
than others. Urban dwellers and those with higher levels of education (high school
graduates) and income (more than Mex$3,000 monthly) were more likely to answer
most questions correctly.
FIGURE 3.3 DISTRIBUTION OF CORRECT FINANCIAL KNOWLEDGE RESPONSES
Percentage of respondents
Number of questions answered correctly
0
5
10
15
20
0 1 2 3 4 5 6 7 8
Low scores High scores
Source: World Bank and Government of Mexico Financial Capability Survey data.
Half of the surveyed population said that they had never been taught how to manage
their money. Financial education is not taught systematically in most Mexican
schools, and parents were the most common source of information cited by those
who had received some sort of guidance on managing their money (figure 3.4).

FINANCIAL CAPABILITY IN MEXICO: RESULTS FROM A NATIONAL SURVEY ON FINANCIAL BEHAVIORS, ATTITUDES, AND KNOWLEDGE
26
FIGURE 3.4 DISTRIBUTION OF SOURCES OF MONEY MANAGEMENT INFORMATION
0 30 50 60
No one
A teacher
Other
Other family member
Father
Mother
Percentage of respondents
20 40 10
Source: World Bank and Government of Mexico Financial Capability Survey data.
Note: Results do not total 100, because respondents could choose multiple responses.
Although these results were similar irrespective of head of household status,
they were correlated with both age and education: the older the person, the less
frequency with which they reported being taught money management. The higher
their education level, the more frequently respondents reported having been taught
money management. Men were more likely to report having been taught money
management by their fathers, while women were fairly evenly split between the two
parents.
27
CHAPTER 4
Comparing financial capability
This chapter examines the seven behavioral and three attitudinal components
of financial capability, facilitating identification of strengths and weaknesses
among different segments of the Mexican population. Mexico’s strongest compo-
nents are achievement orientation and living within means. Education, income, and
participation in household money management are all positively associated with
most components of financial capability. These 10 components are used to profile
five distinct clusters of financial capability that occur within the Mexican popula-
tion with the goal of highlighting the diversity of challenges for specific clusters. The
largest cluster, comprising a third of the surveyed population, is particularly strong at
aspects of day-to-day money management and budgeting, but is weak in saving and
making provisions for unexpected expenses and long-term goals. Further analysis
of the variation in financial capability by region shows that residents of the North-
east and Northwest generally had relatively higher financial capability. Comparison
of youth to adults shows that while youth are better educated with greater formal
financial knowledge, they also cited some difficulty in controlling overspending rela-
tive to the rest of the population.
4.1 COMPONENTS OF FINANCIAL CAPABILITY
Financial capability is a multidimensional concept for which 10 distinct components
have been identified. These 10 components, which span a range of behaviors and
attitudes related to daily money management, planning ahead, and choosing financial
products, are drawn from a report of the Russia Trust Fund for Financial Education and
Literacy summarizing results from seven countries that participated in the Trust Fund’s
financial capability measurement project (Kempson, Perotti, and Scott 2013). These
components were determined using principal component analysis1 and represent a
1 Principal component analysis is a data reduction method that uses the correlation structure
of variables in the data set to find the smallest possible number of linear combinations of these
variables that best synthesize the information contained in the data (see appendix A). Once a
combination of variables is identified as explaining or “loading on” the same underlying compo-
nent, a single component score can be calculated based on a weighted average of the variables
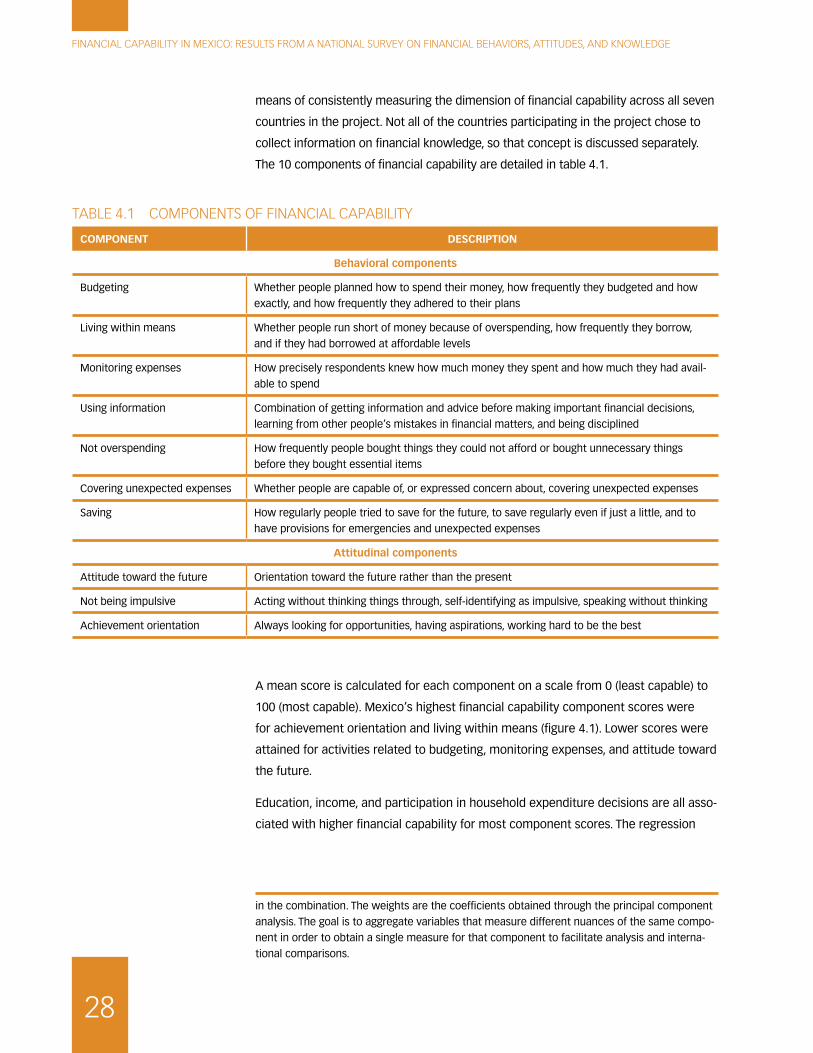
FINANCIAL CAPABILITY IN MEXICO: RESULTS FROM A NATIONAL SURVEY ON FINANCIAL BEHAVIORS, ATTITUDES, AND KNOWLEDGE
28
means of consistently measuring the dimension of financial capability across all seven
countries in the project. Not all of the countries participating in the project chose to
collect information on financial knowledge, so that concept is discussed separately.
The 10 components of financial capability are detailed in table 4.1.
A mean score is calculated for each component on a scale from 0 (least capable) to
100 (most capable). Mexico’s highest financial capability component scores were
for achievement orientation and living within means (figure 4.1). Lower scores were
attained for activities related to budgeting, monitoring expenses, and attitude toward
the future.
Education, income, and participation in household expenditure decisions are all asso-
ciated with higher financial capability for most component scores. The regression
in the combination. The weights are the coefficients obtained through the principal component
analysis. The goal is to aggregate variables that measure different nuances of the same compo-
nent in order to obtain a single measure for that component to facilitate analysis and interna-
tional comparisons.
TABLE 4.1 COMPONENTS OF FINANCIAL CAPABILITY
COMPONENT DESCRIPTION
Behavioral components
Budgeting Whether people planned how to spend their money, how frequently they budgeted and how
exactly, and how frequently they adhered to their plans
Living within means Whether people run short of money because of overspending, how frequently they borrow,
and if they had borrowed at affordable levels
Monitoring expenses How precisely respondents knew how much money they spent and how much they had avail-
able to spend
Using information Combination of getting information and advice before making important financial decisions,
learning from other people’s mistakes in financial matters, and being disciplined
Not overspending How frequently people bought things they could not afford or bought unnecessary things
before they bought essential items
Covering unexpected expenses Whether people are capable of, or expressed concern about, covering unexpected expenses
Saving How regularly people tried to save for the future, to save regularly even if just a little, and to
have provisions for emergencies and unexpected expenses
Attitudinal components
Attitude toward the future Orientation toward the future rather than the present
Not being impulsive Acting without thinking things through, self-identifying as impulsive, speaking without thinking
Achievement orientation Always looking for opportunities, having aspirations, working hard to be the best

CHAPTER 4. COMPARING FINANCIAL CAPABILITY
29
analysis shown in table D.1 in appendix D highlights how financial capability varies by
gender, age, education, employment, income, and location.
On average, women scored significantly higher than men on budgeting and saving.
Those individuals who had completed tertiary education scored higher than those
with only secondary education on budgeting, attitude toward the future, and not
being impulsive—although they showed more of an inclination to spend unneces-
sarily. Higher-income groups tended to score better on nearly all components of
financial capability compared to lower-income groups. Participating in household
expenditure decisions (as opposed to being responsible for only personal expenses)
is strongly associated with higher scores for budgeting, monitoring expenses, using
information, covering unexpected expenses, and saving behavior.
4.2 PROFILES OF FINANCIAL CAPABILITY IN MEXICO
Five distinct clusters of financial capability were identified within the Mexican popu-
lation (table 4.2). These groups were identified through cluster analysis (Kempson,
Perotti, and Scott 2013; see appendix B for detailed methodology) to help Mexican
policy makers and other stakeholders understand the diversity of challenges facing
specific groups in the population. Cluster analysis was used because it permits
comparison of scores across all 10 components of financial capability. The identifica-
tion of clusters has the potential to facilitate more targeted interventions to improve
FIGURE 4.1 MEXICO’S MEAN SCORES FOR COMPONENTS OF FINANCIAL CAPABILITY
0 20 40 60 80 100
Monitoring expenses
Attitude toward the future
Saving
Not being impulsive
Covering unexpected expenses
Living within means
Not overspending
Budgeting
Using information
Achievement orientation
Mean score
Source: World Bank and Government of Mexico Financial Capability Survey data.

FINANCIAL CAPABILITY IN MEXICO: RESULTS FROM A NATIONAL SURVEY ON FINANCIAL BEHAVIORS, ATTITUDES, AND KNOWLEDGE
30
TABLE 4.2 FINANCIAL CAPABILITY CLUSTERS IN THE POPULATION
CLUSTER BEHAVIOR AND ATTITUDES CHARACTERISTICS
1. Unsophisticated
money managers
(~22% of
respondents)
Below-average scores on all but two components of
financial capability (not overspending and living within
means). Very low scores for budgeting and monitoring
expenses; low levels of financial inclusion. Relatively
short-term view of finances and limited concern
about old age.
Eighty-three percent low income; many have
variable incomes. More likely not to be formally
employed. Many have low levels of education (47%
with at most primary education or less). Despite an
above-average number of people age 60 or over
(18%), group has the lowest proportion of people
describing themselves as retired (3%).
2. Short-term
money managers
(~33% of
respondents)
Strong scores for components of daily money man-
agement (especially budgeting); poor at saving and
making provisions for the future, particularly for unex-
pected expenses.
Eighty percent low income, more likely to be middle-
aged (age 41–60) and have dependent children. Most
(70%) live in urban areas. Half of them (49%) were
using financial products or services.
3. Young impulsive
spenders (~12% of
respondents)
More impulsive and inclined to overspend; perhaps
as a consequence, has lowest scores as a cluster for
living within means. Best for covering unexpected
expenses, strong at monitoring expenses.
Highest percentage of youth, less likely to have a
dependent child, predominantly secondary educa-
tion or lower. Medium-low incomes, but highest level
of informal employment.
4. Affluent but
disorganized (~9%
of respondents)
Poor budgeters, yet manage to live within means;
least impulsive and most future oriented relative to
the other clusters reporting saving and making plans
for unexpected expenses. Highest level of financial
inclusion.
High income relative to other clusters; group with
highest proportion of individuals with at least sec-
ondary education; high percentage in rural areas.
5. Careful money
managers and
planners (~25% of
respondents)
Above-average scores for all components except
monitoring expenses. Excellent scores for budgeting,
living within means, and using information; most
concerned about the future and old age and most
achievement oriented compared to other clusters.
Steady incomes in the middle of the distribution,
highest education levels, highest percentage with a
partner, highest percentage with a dependent child,
predominantly urban.
financial capability. Figure B.1 in appendix B presents the mean scores for each
cluster across all 10 components of financial capability.
Over half the population falls into Clusters 1 and 2—unsophisticated money managers
and short-term money managers. These two groups had the lowest aggregate financial
capability scores. Individuals in these two clusters were, on average, less educated than
those in other clusters and had the lowest levels of financial inclusion. The unsophis-
ticated money managers, in particular, performed poorly on all but two components
of financial capability (see figure B.1). This cluster contained the highest percentage of
low-income individuals, many of whom live in rural areas, and it had the lowest mean
score for financial knowledge. This cluster also had the lowest level of financial inclu-
sion: only 37 percent of the individuals in the cluster had financial products.
The short-term money managers (Cluster 2) were particularly strong at aspects of day-
to-day money management and budgeting, but weak in terms of saving and making
provisions for the future, particularly for unexpected expenses. As a group, this cluster
had the second lowest income level (80 percent of those in the cluster were in the two
lowest-income quartiles), but the second highest average financial literacy score and a

CHAPTER 4. COMPARING FINANCIAL CAPABILITY
31
majority (62 percent) that had completed secondary education. Compared to the unso-
phisticated money managers (Cluster 1), this cluster was more likely to have financial
products and to be employed in the formal sector. Compared with the other groups,
they were more likely to be middle-aged and to have dependent children.
The remaining 45 percent of the surveyed population fell into three clusters: young
spenders, affluent but disorganized, and careful money managers and planners. The
careful money managers and planners comprised the largest of the three groups,
and displayed above-average performance on all components except for living
within means. This group had the highest proportion of people living with a partner
(73 percent), the highest percentage of people with stable (no seasonal variation)
incomes (36 percent), and the highest percentage having completed tertiary educa-
tion (16 percent) (figure 4.2). The young impulsive spenders cluster had the highest
proportion in formal employment (40 percent), but low scores for living within
means—and, consequently, high scores for covering unexpected expenses as a
coping mechanism. The remaining group, described as affluent but disorganized,
had the highest incomes compared to other groups and the highest level of financial
inclusion, with 61 percent citing the use of financial products. However, with respect
to budgeting and planning for old age, their scores were comparable to those of the
unsophisticated money managers. Figure 4.3 shows how the clusters vary across key
sociodemographic factors.
FIGURE 4.2 CLUSTER SIZE BY EDUCATIONAL ATTAINMENT AND FINANCIAL INCLUSION
441
606
279
189
507
20
40
60
80
100
0 5 10 15 20
Percentage having financial products
Percentage that completed tertiary education
0
Source: World Bank and Government of Mexico Financial Capability Survey data.
Note: Width represents cluster size.

FINANCIAL CAPABILITY IN MEXICO: RESULTS FROM A NATIONAL SURVEY ON FINANCIAL BEHAVIORS, ATTITUDES, AND KNOWLEDGE
32
4.3 REGIONAL VARIATION OF FINANCIAL CAPABILITY
Understanding regional variations in financial behavior and knowledge can enable
authorities to better target interventions to improve financial capability. Levels of devel-
opment across regions in Mexico vary.2 Table 4.3 shows financial capability scores by
region, and figure 4.4 maps these scores.
The Northeast and Northwest regions have relatively stronger scores on most financial
capability components. The Northeast region has high-income states such as Nuevo
Leon and states on the U.S. border such as Chihuahua. This region shows strong finan-
cial management related to living within means and covering unexpected expenses;
it shows relative strength vis-à-vis the other regions, in terms of monitoring expenses,
but has low scores on using information. The Northwest region has high scores for
components including not overspending, saving, and obtaining information, although it
has low scores related to covering unexpected expenses and financial knowledge.
The South/Southeast, Central West, and Central regions show a mixed performance
on the components of financial capability. The South/Southeast region, which contains
2 In this section, the geographic regions of the surveyed states were defined following defini-
tions in the Mexican National Development Plan: Central Region: Distrito Federal, Queretaro,
Morelos, State of Mexico, Hidalgo, Tlaxcala, Central West Region: Colima, Jalisco, Guanajuato,
San Luis Potosi, Michoacan, Zacatecas, Northeast Region: Nuevo Leon, Tamaulipas, Chihuahua,
Northwest Region: Sonora, Sinaloa, South/Southeast Region: Tabasco, Quintana Roo, Puebla,
Veracruz, Guerrero, Oaxaca, Chiapas. Note that the financial capability survey did not cover all
states in Mexico.
FIGURE 4.3 SOCIODEMOGRAPHIC CHARACTERISTICS OF EACH CLUSTER
Female
Age 18–30
Primary education at most
Not formally employed
Has no financial products
Has dependent children
Responsible for choosing products
Cluster 1 Cluster 4Cluster 3Cluster 2 Cluster 5
49 57 53 53 52
32 28 37 26 26
47 38 25 36 30
88 78 60 71 71
63 51 41 39 43
49 57 54 52 57
50 64 79 64 75
Source: World Bank and Government of Mexico Financial Capability Survey data.
Note: Width represents percentage.
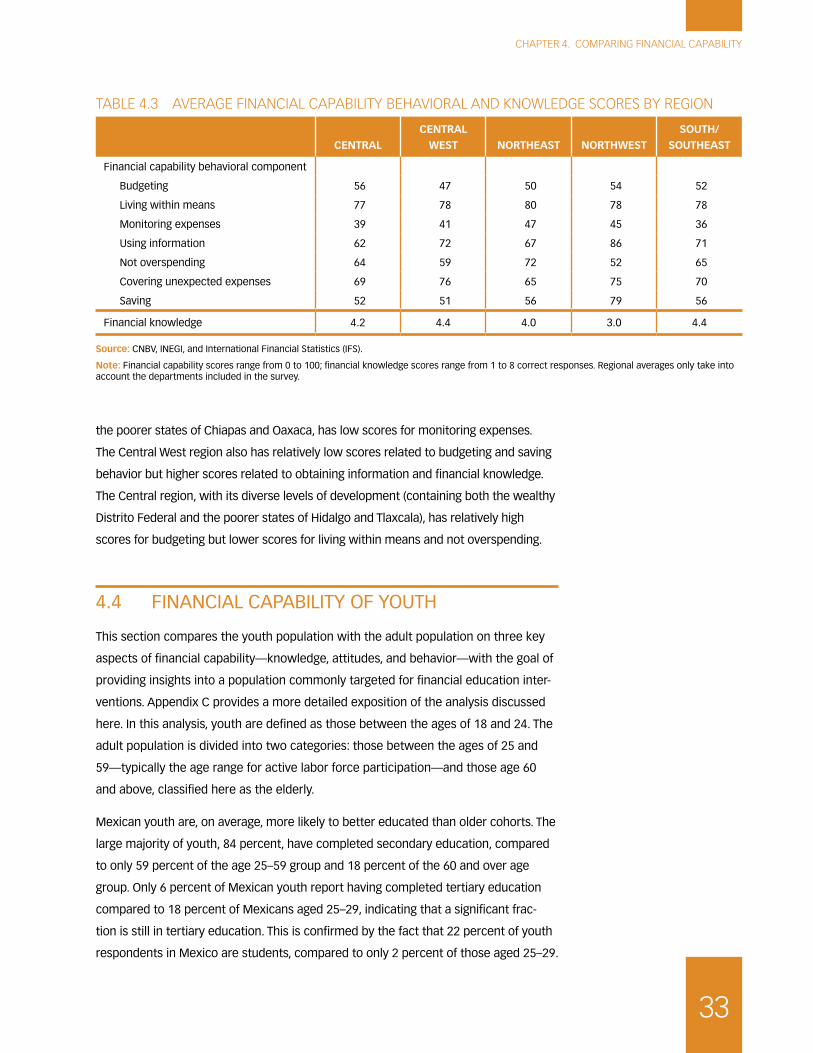
CHAPTER 4. COMPARING FINANCIAL CAPABILITY
33
TABLE 4.3 AVERAGE FINANCIAL CAPABILITY BEHAVIORAL AND KNOWLEDGE SCORES BY REGION
CENTRALCENTRAL
WEST NORTHEAST NORTHWESTSOUTH/
SOUTHEAST
Financial capability behavioral component
Budgeting 56 47 50 54 52
Living within means 77 78 80 78 78
Monitoring expenses 39 41 47 45 36
Using information 62 72 67 86 71
Not overspending 64 59 72 52 65
Covering unexpected expenses 69 76 65 75 70
Saving 52 51 56 79 56
Financial knowledge 4.2 4.4 4.0 3.0 4.4
Source: CNBV, INEGI, and International Financial Statistics (IFS).
Note: Financial capability scores range from 0 to 100; financial knowledge scores range from 1 to 8 correct responses. Regional averages only take into account the departments included in the survey.
the poorer states of Chiapas and Oaxaca, has low scores for monitoring expenses.
The Central West region also has relatively low scores related to budgeting and saving
behavior but higher scores related to obtaining information and financial knowledge.
The Central region, with its diverse levels of development (containing both the wealthy
Distrito Federal and the poorer states of Hidalgo and Tlaxcala), has relatively high
scores for budgeting but lower scores for living within means and not overspending.
4.4 FINANCIAL CAPABILITY OF YOUTH
This section compares the youth population with the adult population on three key
aspects of financial capability—knowledge, attitudes, and behavior—with the goal of
providing insights into a population commonly targeted for financial education inter-
ventions. Appendix C provides a more detailed exposition of the analysis discussed
here. In this analysis, youth are defined as those between the ages of 18 and 24. The
adult population is divided into two categories: those between the ages of 25 and
59—typically the age range for active labor force participation—and those age 60
and above, classified here as the elderly.
Mexican youth are, on average, more likely to better educated than older cohorts. The
large majority of youth, 84 percent, have completed secondary education, compared
to only 59 percent of the age 25–59 group and 18 percent of the 60 and over age
group. Only 6 percent of Mexican youth report having completed tertiary education
compared to 18 percent of Mexicans aged 25–29, indicating that a significant frac-
tion is still in tertiary education. This is confirmed by the fact that 22 percent of youth
respondents in Mexico are students, compared to only 2 percent of those aged 25–29.

FINANCIAL CAPABILITY IN MEXICO: RESULTS FROM A NATIONAL SURVEY ON FINANCIAL BEHAVIORS, ATTITUDES, AND KNOWLEDGE
34
FIGURE 4.4 FINANCIAL CAPABILITY BEHAVIORAL AND KNOWLEDGE SCORES MAPPED BY REGION
a. Budgeting
Northeast
South/Southeast
North-west
CentralWestern
Central
47–4848–5051–5253–56
b. Living within means
Northeast
South/Southeast
North-west
CentralWestern
Central
76–7777–7878–7878–81
c. Monitoring expenses
Northeast
South/Southeast
North-west
CentralWestern
Central
36–3737–3940–4141–47
d. Using information
Northeast
South/Southeast
North-west
CentralWestern
Central
62–6363–6767–7272–87
e. Not overspending
51–5252–5959–6565–73
Northeast
South/Southeast
North-west
CentralWestern
Central
f. Covering unexpected expenses
51–5252–5353–5656–79
Northeast
South/Southeast
North-west
CentralWestern
Central
g. Saving
64–6565–6969–7070–77
Northeast
South/Southeast
North-west
CentralWestern
Central
h. Financial knowledge
2.75–3.03.0–4.04.0–4.254.25–4.5
Northeast
South/Southeast
North-west
CentralCentralWestern
Source: World Bank and Government of Mexico Financial Capability Survey data.

CHAPTER 4. COMPARING FINANCIAL CAPABILITY
35
Overall, Mexican youth are less likely to contribute to the household or to participate
in household financial decision making than adults. The majority of youth, 59 percent,
in the 18–24 age group are still living with parents, compared to only 32 percent
of the slightly older 25–29 year old cohort. Among Mexican youth, 51 percent
contribute to household budgets and only 55 percent participate in financial decision
making. Thirty-seven percent of Mexican youth report they are “mainly” responsible
for their own personal spending, compared to 66 percent of adults aged 25–59 and
63 percent of those age 60 and over. A minority of Mexican youth, 11 percent, report
that they are heads of households and responsible for both personal and household
expenditures.
Although Mexican youth overall have slightly higher scores than Mexican adults on
most measures of financial knowledge, the difference is not statistically significant.
While youth do score higher on some questions of financial knowledge compared to
the 60 and over age group, their financial knowledge is largely on par with adults in
the age 25–59 groups (figure 4.5). Eighty-five percent of Mexican youth are able to do
simple division, compared to 81 percent of adults aged 25–59. But only 74 percent
of those age 60 and over can do simple division. Younger age groups are more likely
to understand how the value of money decreases due to inflation: 58 percent of
both youth and adults aged 25–59 indicated that they understand the time value of
money (inflation) relative to only 46 percent of those age 60 and over. Younger age
groups are also more likely to be familiar with the concept of portfolio diversification
FIGURE 4.5 FINANCIAL KNOWLEDGE BY AGE GROUP
0 20 40 60 80 100
Percentage providing correct answer
18–24
25–59
60 and over
Division
Time value of money
Interest rate
Principal plus interest
Compound interest
Inflation definition
Risk and return
Portfolio diversification
Source: World Bank and Government of Mexico Financial Capability Survey data.

FINANCIAL CAPABILITY IN MEXICO: RESULTS FROM A NATIONAL SURVEY ON FINANCIAL BEHAVIORS, ATTITUDES, AND KNOWLEDGE
36
compared to the 60 and over age group. This is not surprising given that the average
educational level of youth is higher than in older age groups.
Responses to questions about time preferences indicate that youth are more
concerned about the future than are older age groups. Attitudes form a crucial link
between knowledge and behaviors. Of particular interest in looking at youth financial
capability is how youth prioritize short-term versus longer-term needs, how impulsive
they are, and how oriented they are toward achievement. Only 37 percent of youth
strongly agree with the statement that the future will take care of itself, compared to
45 percent of adults and 63 percent of the elderly (figure 4.6). However, this concern
does not appear to translate into planning for longer-term needs, as indicated by the
positive response rate to questions about living for the present and having a short-
term focus.
Youth tend to score lower, overall, on financial behaviors than older age groups,
but the differences are not significant for all types of behaviors (figure 4.7). The key
difference between youth and older age groups is on overspending. Mexican youth
find it significantly more difficult to not overspend compared to older age groups.
On the indicators of sound financial management—such as budgeting and being
able cover unexpected expenses—youth score significantly worse than adults
aged 25–59, but are on par with those age 60 and over. Two factors may contribute
to the lower scores on these aspects of financial behavior. One is that youth face
FIGURE 4.6 PERCENTAGE AGREEING WITH EACH STATEMENT BY AGE GROUP
18–24
25–59
≥ 60
“The future will takecare of itself.”
Agreestrongly
Agree tosome extent
Disagree tosome extent
Disagreestrongly
“I live more for todaythan for tomorrow.”
0 20 40 60 80 100
“I only focus onthe short term.”
Percent
18–24
25–59
≥ 60
18–24
25–59
≥ 60
Source: World Bank and Government of Mexico Financial Capability Survey data.
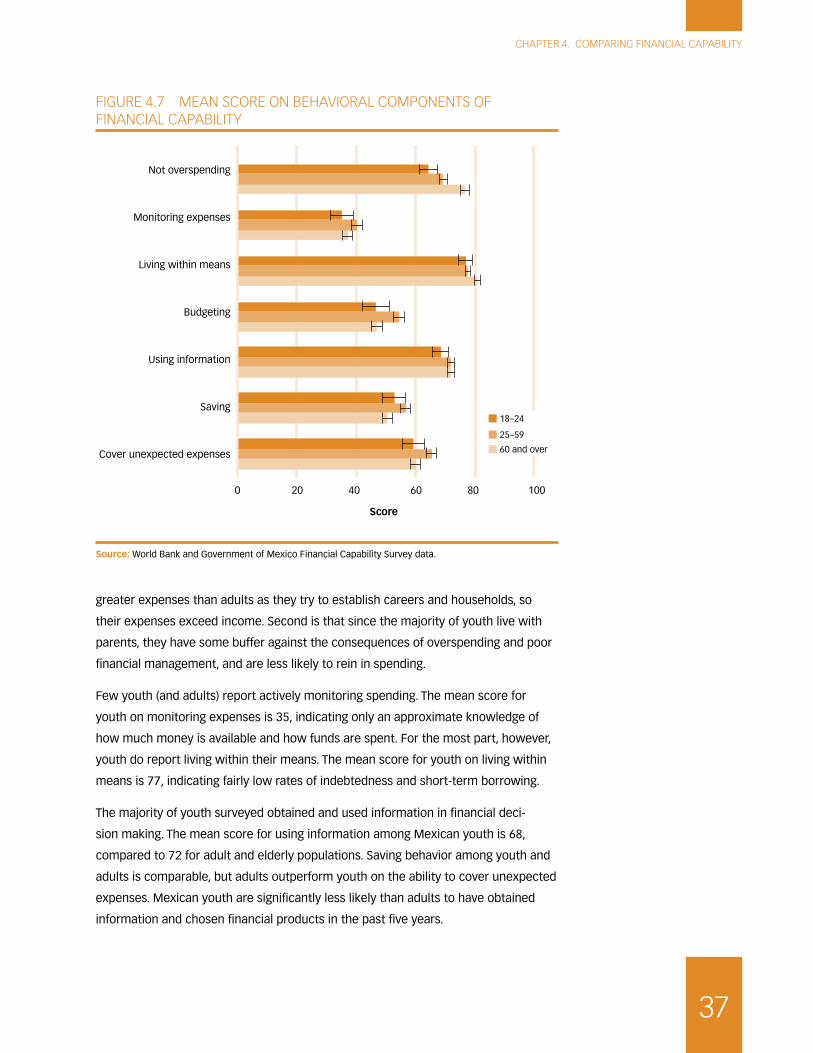
CHAPTER 4. COMPARING FINANCIAL CAPABILITY
37
FIGURE 4.7 MEAN SCORE ON BEHAVIORAL COMPONENTS OF FINANCIAL CAPABILITY
0 20 40 60 80
Cover unexpected expenses
Saving
Using information
Budgeting
Living within means
Monitoring expenses
Not overspending
Score
100
18–24
25–59
60 and over
Source: World Bank and Government of Mexico Financial Capability Survey data.
greater expenses than adults as they try to establish careers and households, so
their expenses exceed income. Second is that since the majority of youth live with
parents, they have some buffer against the consequences of overspending and poor
financial management, and are less likely to rein in spending.
Few youth (and adults) report actively monitoring spending. The mean score for
youth on monitoring expenses is 35, indicating only an approximate knowledge of
how much money is available and how funds are spent. For the most part, however,
youth do report living within their means. The mean score for youth on living within
means is 77, indicating fairly low rates of indebtedness and short-term borrowing.
The majority of youth surveyed obtained and used information in financial deci-
sion making. The mean score for using information among Mexican youth is 68,
compared to 72 for adult and elderly populations. Saving behavior among youth and
adults is comparable, but adults outperform youth on the ability to cover unexpected
expenses. Mexican youth are significantly less likely than adults to have obtained
information and chosen financial products in the past five years.


39
CHAPTER 5
I nternational comparisons
The financial capability survey utilized for Mexico was also applied in six other
countries that were selected to receive funding to implement this first set of
surveys on financial capability. Mexico was selected from a pool of applicant coun-
tries—along with Armenia, Colombia, Lebanon, Nigeria, Turkey, and Uruguay—by the
Russia Trust Fund for Financial Literacy and Education to participate in the process
of developing and piloting these financial capability surveys. These comparator
countries were linked by an interest in piloting a new survey instrument rather than
by shared or similar socioeconomic conditions. This chapter compares the financial
capability of the Mexicans surveyed to those surveyed in these other countries.
The international comparisons rely on 10 components of financial capability, rather
than a single financial capability score. Analysis revealed that it was not possible
to develop a single index score for financial capability by combining scores on the
10 components of financial capability.1 Figure 5.1 compares Mexican responses with
those provided in other countries (where available) on each component.
Compared to survey participants in the other six countries, the Mexican respondents
indicated stronger saving behavior. They scored higher on average on a composite of
questions measuring the inclination to save and to have provisions for unexpected
major expenses. Mean scores for other components such as monitoring expenses,
using information, and achievement orientation were similar to those found in the
other countries surveyed.
However, Mexicans’ budgeting activity and attitude toward the future were less
pronounced than in other countries. Mexico’s budgeting score—measuring the
extent to which people plan how to use their money and whether they stick to their
plans—was lower than for any of the other countries for which data were collected,
with the exception of Lebanon. Similarly, Mexicans also expressed more of an inclina-
tion to a short-term planning horizon relative to other countries except for Armenia.
Latin American comparators Colombia and Uruguay—although they scored slightly
1 For further explanation, see footnote 1 in chapter 4.

FINANCIAL CAPABILITY IN MEXICO: RESULTS FROM A NATIONAL SURVEY ON FINANCIAL BEHAVIORS, ATTITUDES, AND KNOWLEDGE
40
FIGURE 5.1 CROSS-COUNTRY COMPARISON OF COMPONENTS OF FINANCIAL CAPABILITY
0
20
40
60
80
100
Mexico Lebanon Uruguay Turkey Armenia Colombia Nigeria
a. Budgeting
0
20
40
60
80
Mexico Lebanon Uruguay Turkey Armenia Colombia Nigeria
f. Covering unexpected expenses
0
20
40
60
80
100
Lebanon Uruguay Turkey Mexico Armenia Colombia Nigeria
b. Living within means
0
20
40
60
Mexico Lebanon Uruguay Turkey Armenia Colombia Nigeria
h. Attitude toward the future
0
20
40
60
Mexico Lebanon Uruguay Turkey Armenia Colombia Nigeria
g. Saving
0
10
20
30
40
50
60
70
Mexico Lebanon Uruguay Turkey Armenia Colombia Nigeria
c. Monitoring spending
0
20
40
60
80
Mexico Lebanon Uruguay Turkey Armenia Colombia Nigeria
i. Not being Impulsive
0
20
40
60
80
100
Mexico Lebanon Uruguay Turkey Armenia Colombia Nigeria
e. Not overspending
0
20
40
60
80
100
Mexico Lebanon Uruguay Turkey Armenia Colombia Nigeria
d. Using information
j. Achievement orientation
0
20
40
60
80
100
Mexico Lebanon Uruguay Turkey Armenia Colombia Nigeria
Source: Kempson, Perotti, and Scott 2013.

CHAPTER 5. INTERNATIONAL COMPARISONS
41
higher than Mexico in terms of attitude toward the future—were also biased toward
the short term.
The countries for which financial capability data are available show diverse socio-
economic conditions—particularly related to educational attainment, structure of
employment, and income flows. As shown in table 5.1, some characteristics were
similar across countries, such as the higher proportion of women than men in the
survey samples (53 percent in Mexico). Other characteristics, such as the share
of survey respondents with completed secondary education varied widely—from
20 percent in Nigeria to 55 percent in Mexico to 69 percent in Armenia—indicating
major differences in educational attainment. Both Mexico and Colombia had low
TABLE 5.1 SUMMARY STATISTICS OF KEY SOCIODEMOGRAPHIC VARIABLES
VARIABLE
ARMENIA COLOMBIA LEBANON MEXICO NIGERIA TURKEY URUGUAY
MEAN SD MEAN SD MEAN SD MEAN SD MEAN SD MEAN SD MEAN SD
Female 0.66 0.48 0.63 0.48 0.55 0.50 0.53 0.50 0.51 0.50 0.50 0.50 0.53 0.50
Age 18–30 0.26 0.44 0.27 0.45 0.30 0.46 0.29 0.46 0.26 0.44 0.36 0.48 0.29 0.45
Age 60+ 0.23 0.42 0.16 0.37 0.14 0.35 0.14 0.35 0.15 0.36 0.10 0.31 0.20 0.40
Primary ed. at most 0.02 0.14 0.34 0.47 0.27 0.45 0.36 0.48 0.66 0.47 0.51 0.50 0.31 0.46
Secondary ed. at most 0.69 0.46 0.45 0.50 0.46 0.50 0.55 0.50 0.20 0.40 0.41 0.49 0.52 0.50
Tertiary education 0.29 0.46 0.21 0.41 0.27 0.44 0.09 0.28 0.13 0.34 0.08 0.27 0.18 0.38
# of hh members 18+ 3.56 1.45 3.19 1.49 3.51 1.50 2.82 1.17 2.94 1.57 3.10 1.48 2.49 1.03
Has dependent children 0.50 0.50 0.61 0.49 0.46 0.50 0.55 0.50 — — 0.52 0.50 — —
Rural area 0.39 0.49 0.34 0.47 0.33 0.47 0.38 0.49 0.71 0.45 0.04 0.20 0.09 0.28
Has financial products 0.81 0.39 0.55 0.50 0.57 0.50 0.51 0.50 0.21 0.42 0.58 0.49 0.87 0.33
Formal employee 0.26 0.44 0.19 0.39 0.31 0.46 0.24 0.43 0.42 0.49 0.22 0.41 0.41 0.49
Informal employee 0.06 0.24 0.06 0.23 0.11 0.31 0.15 0.36 — — 0.08 0.27 0.08 0.28
Self-employed 0.16 0.36 0.10 0.30 0.16 0.36 0.03 0.16 — — 0.08 0.27 0.09 0.29
Unemployed 0.07 0.25 0.03 0.18 0.02 0.13 0.05 0.22 0.08 0.28 0.03 0.17 0.04 0.20
Retired 0.18 0.39 0.05 0.22 0.05 0.21 0.04 0.20 0.36 0.48 0.16 0.37 0.17 0.38
Housework 0.21 0.41 0.25 0.43 0.31 0.46 0.27 0.44 0.02 0.13 0.33 0.47 0.12 0.32
Other 0.01 0.08 0.29 0.45 0.00 0.02 0.15 0.35 0.04 0.20 0.01 0.12 0.04 0.20
Income seasonality:
no income
0.03 0.18 0.07 0.26 0.05 0.22 0.10 0.30 — — 0.15 0.36 0.24 0.43
Income seasonality:
variable income
0.45 0.50 0.63 0.48 0.47 0.50 0.60 0.49 — — 0.24 0.42 0.32 0.47
Income seasonality:
stable income
0.52 0.50 0.30 0.46 0.48 0.50 0.30 0.46 — — 0.62 0.49 0.43 0.50
Source: World Bank and Government of Mexico Financial Capability Survey data.
Note: — = not available; SD = standard deviation.
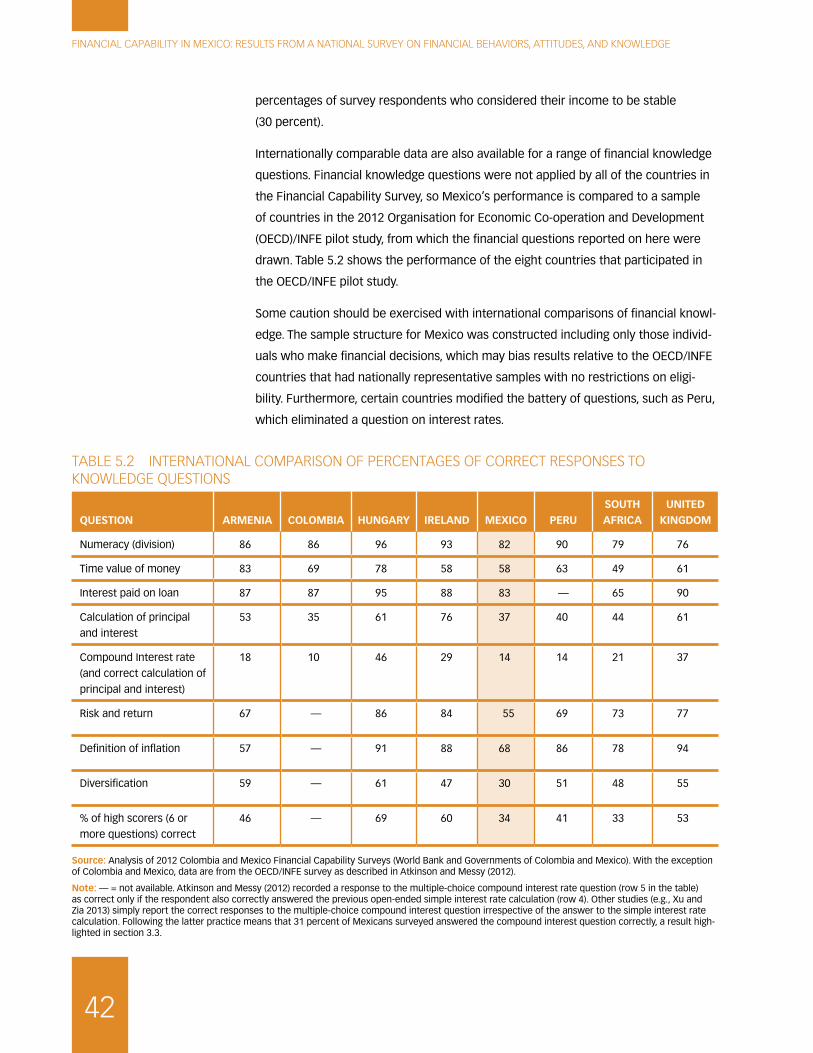
FINANCIAL CAPABILITY IN MEXICO: RESULTS FROM A NATIONAL SURVEY ON FINANCIAL BEHAVIORS, ATTITUDES, AND KNOWLEDGE
42
TABLE 5.2 INTERNATIONAL COMPARISON OF PERCENTAGES OF CORRECT RESPONSES TO KNOWLEDGE QUESTIONS
QUESTION ARMENIA COLOMBIA HUNGARY IRELAND MEXICO PERUSOUTH AFRICA
UNITED KINGDOM
Numeracy (division) 86 86 96 93 82 90 79 76
Time value of money 83 69 78 58 58 63 49 61
Interest paid on loan 87 87 95 88 83 — 65 90
Calculation of principal
and interest
53 35 61 76 37 40 44 61
Compound Interest rate
(and correct calculation of
principal and interest)
18 10 46 29 14 14 21 37
Risk and return 67 — 86 84 55 69 73 77
Definition of inflation 57 — 91 88 68 86 78 94
Diversification 59 — 61 47 30 51 48 55
% of high scorers (6 or
more questions) correct
46 — 69 60 34 41 33 53
Source: Analysis of 2012 Colombia and Mexico Financial Capability Surveys (World Bank and Governments of Colombia and Mexico). With the exception of Colombia and Mexico, data are from the OECD/INFE survey as described in Atkinson and Messy (2012).
Note: — = not available. Atkinson and Messy (2012) recorded a response to the multiple-choice compound interest rate question (row 5 in the table) as correct only if the respondent also correctly answered the previous open-ended simple interest rate calculation (row 4). Other studies (e.g., Xu and Zia 2013) simply report the correct responses to the multiple-choice compound interest question irrespective of the answer to the simple interest rate calculation. Following the latter practice means that 31 percent of Mexicans surveyed answered the compound interest question correctly, a result high-lighted in section 3.3.
percentages of survey respondents who considered their income to be stable
(30 percent).
Internationally comparable data are also available for a range of financial knowledge
questions. Financial knowledge questions were not applied by all of the countries in
the Financial Capability Survey, so Mexico’s performance is compared to a sample
of countries in the 2012 Organisation for Economic Co-operation and Development
(OECD)/INFE pilot study, from which the financial questions reported on here were
drawn. Table 5.2 shows the performance of the eight countries that participated in
the OECD/INFE pilot study.
Some caution should be exercised with international comparisons of financial knowl-
edge. The sample structure for Mexico was constructed including only those individ-
uals who make financial decisions, which may bias results relative to the OECD/INFE
countries that had nationally representative samples with no restrictions on eligi-
bility. Furthermore, certain countries modified the battery of questions, such as Peru,
which eliminated a question on interest rates.
CHAPTER 5. INTERNATIONAL COMPARISONS
43
With respect to financial knowledge, Mexico’s level of correct responses to questions
related to numeracy, the time value of money, and interest paid on a loan was in
line with that of other countries surveyed. However, Mexico had a lower percentage
of correct responses on questions regarding the calculation of a simple interest
rate than all of the countries surveyed with the exception of Colombia. Knowledge
of risk and return and awareness of the benefits of portfolio diversification were
lower than in the other countries surveyed. Knowledge of compound interest was
lower for Mexico than for any of the other countries surveyed except Colombia and
Peru. Mexico also had a relatively small percentage of high scorers on the battery of
questions: just 34 percent of survey respondents answered six or more questions
correctly; this was a lower percentage than for any of the other countries surveyed
except South Africa.


45
CHAPTER 6
Linkages between financial capability and financial inclusion
In Mexico, dialogue and policies related to improving financial capability and finan-
cial knowledge often complement efforts to promote responsible financial inclu-
sion. Understanding the linkages between these issues can facilitate better design
and better targeting of policy interventions. This chapter provides strong evidence
for the linkages between financial knowledge, financial capability, and financial inclu-
sion, as measured by use of formal financial products. It suggests that expanding
financial knowledge and enhancing financial capability are crucial steps toward the
goal of accelerating responsible financial inclusion. Specifically, it finds that financial
knowledge and financial capability are positively associated with the use of formal
financial products such as bank accounts and credit cards. Findings presented here
also suggest that the use of banking correspondents increases access to formal
financial products primarily for individuals with high financial capability or high finan-
cial knowledge, and not for those with low financial capability or knowledge.
6.1 FINANCIAL KNOWLEDGE AND CAPABILITY
A number of studies have found links between financial knowledge and elements
of financial behavior. Using data from the United States, Lusardi and Tufano (2009)
find that individuals who have low measured levels of financial knowledge tend to
pay minimum balances on credit cards, incur late fees on cards, and use informal
sources of credit. Stango and Zinman (2009) show that people who make mistakes
in interest and future value calculations tend to borrow more and save less. Lusardi
and Mitchell (2009) illustrate that people with low levels of financial knowledge think
less about retirement and that most of them have not planned for retirement at
all. A survey of Russian households shows that financial knowledge is significantly
and positively related to retirement planning involving private pension funds and
schemes (Klapper and Panos 2011). In Mexico, Hastings and Tejeda-Ashton (2008)
conducted a survey that reveals that less knowledgeable individuals tend to choose
pension mutual funds with higher fees. The Mexican Financial Capability Survey
provides an opportunity to add to this literature because of the range of data it
collects on both financial knowledge and financial capability.

FINANCIAL CAPABILITY IN MEXICO: RESULTS FROM A NATIONAL SURVEY ON FINANCIAL BEHAVIORS, ATTITUDES, AND KNOWLEDGE
46
In Mexico, a higher financial knowledge score is associated with a higher financial
capability measure for 7 out of 10 components of financial capability. The analysis
examines the relationship between the financial knowledge score and each of the
10 financial capability measures (listed in table 4.1), controlling for several personal
and municipality characteristics that could lead to a spurious relationship between
knowledge and capability (see appendix D for more details on the methodology).
Four of the behavioral components (not overspending, living within means, covering
unexpected expenses, and saving) and all three attitudinal components are corre-
lated with financial knowledge (see table D.1 in appendix D). The other three compo-
nents—budgeting, monitoring expenses, and using information—show no statistically
significant relationship with financial knowledge.
Financial knowledge showed the largest correlation with the not overspending
component, followed by achievement orientation, saving, and living within means.
Figure 6.1 compares the magnitudes of the correlations with financial knowledge
across different components of financial capability by showing correlations bench-
marked by standard deviation.1 The correlations between financial knowledge
and the not being impulsive, attitude toward the future, and covering unexpected
expenses components are smaller and, as discussed above, they are zero for the
other three components.
6.2 FINANCIAL KNOWLEDGE, FINANCIAL CAPABILITY, AND USE OF CREDIT AND SAVINGS
This section uses the financial knowledge and capability component measures
discussed earlier in this report and examines the extent to which they predict
whether an individual or household uses a range of formal and informal financial
services. This analysis focuses on the six most frequently used financial services in
Mexico as reported in the Financial Capability Survey: bank accounts, credit cards,
bank loans, tandas, pawn shop credit, and loans from family or friends. The relation-
ship between financial knowledge or financial capability and use of these products is
measured through a regression analysis described in detail in appendix D. Table 6.1
displays abridged results from this analysis, showing the partial correlation between
1 That is, it shows by how much each financial capability measure increases when the financial
knowledge score increases by one standard deviation (the standard deviation of this score is
1.8), where the increase in the capability measure is scaled to represent percentage points of
the standard deviation of the capability measure. This scaling is used because the same size
increase (e.g., two points) could either be large or small, depending on how much variation
there is in the capability measure. For example, if most people score around 50 on a given
capability component, a 2-point increase would represent a larger magnitude than for a compo-
nent on which most people score between 10 and 90.
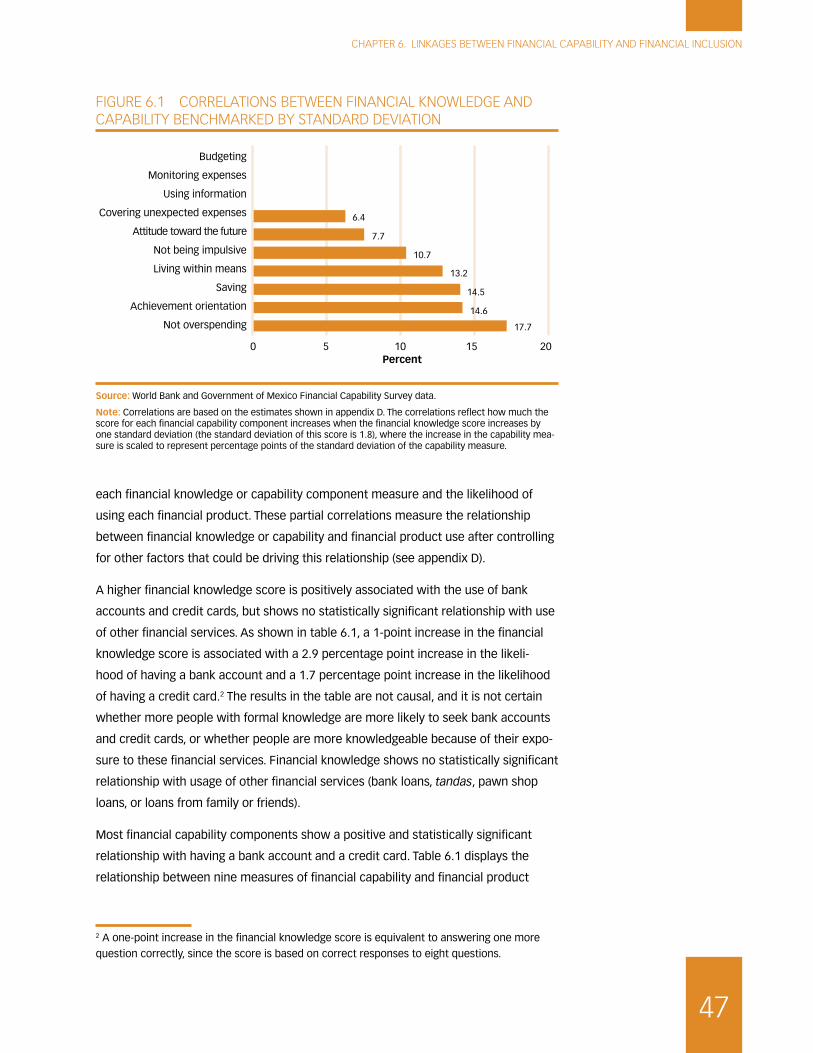
CHAPTER 6. LINKAGES BETWEEN FINANCIAL CAPABILITY AND FINANCIAL INCLUSION
47
each financial knowledge or capability component measure and the likelihood of
using each financial product. These partial correlations measure the relationship
between financial knowledge or capability and financial product use after controlling
for other factors that could be driving this relationship (see appendix D).
A higher financial knowledge score is positively associated with the use of bank
accounts and credit cards, but shows no statistically significant relationship with use
of other financial services. As shown in table 6.1, a 1-point increase in the financial
knowledge score is associated with a 2.9 percentage point increase in the likeli-
hood of having a bank account and a 1.7 percentage point increase in the likelihood
of having a credit card.2 The results in the table are not causal, and it is not certain
whether more people with formal knowledge are more likely to seek bank accounts
and credit cards, or whether people are more knowledgeable because of their expo-
sure to these financial services. Financial knowledge shows no statistically significant
relationship with usage of other financial services (bank loans, tandas, pawn shop
loans, or loans from family or friends).
Most financial capability components show a positive and statistically significant
relationship with having a bank account and a credit card. Table 6.1 displays the
relationship between nine measures of financial capability and financial product
2 A one-point increase in the financial knowledge score is equivalent to answering one more
question correctly, since the score is based on correct responses to eight questions.
FIGURE 6.1 CORRELATIONS BETWEEN FINANCIAL KNOWLEDGE AND CAPABILITY BENCHMARKED BY STANDARD DEVIATION
0 5 10 15 20Percent
Budgeting
Living within means
Monitoring expenses
Using information
Not overspending
Covering unexpected expenses
Saving
Attitude toward the future
Not being impulsive
Achievement orientation
6.4
7.7
10.7
13.2
14.5
14.6
17.7
Source: World Bank and Government of Mexico Financial Capability Survey data.
Note: Correlations are based on the estimates shown in appendix D. The correlations reflect how much the score for each financial capability component increases when the financial knowledge score increases by one standard deviation (the standard deviation of this score is 1.8), where the increase in the capability mea-sure is scaled to represent percentage points of the standard deviation of the capability measure.

FINANCIAL CAPABILITY IN MEXICO: RESULTS FROM A NATIONAL SURVEY ON FINANCIAL BEHAVIORS, ATTITUDES, AND KNOWLEDGE
48
TABLE 6.1 PARTIAL CORRELATIONS BETWEEN FINANCIAL KNOWLEDGE, FINANCIAL CAPABILITY COMPONENTS, AND USE OF FINANCIAL SERVICES
DEPENDENT VARIABLE: DUMMY VARIABLE INDICATING WHETHER THE INDIVIDUAL HAS/PARTICIPATES IN A
BANK ACCOUNT
CREDIT CARD BANK LOAN TANDA
PAWN SHOP LOAN
LOAN FROM FAMILY OR FRIENDS
Financial knowledge score 0.029*** 0.017** 0.006 0.000 0.005 −0.013
Financial capability component
Budgeting 0.000 0.000 0.006** 0.002 0.001 −0.003
Monitoring expenses 0.011*** 0.010** 0.003 0.002 0.001 −0.010**
Using information 0.010** 0.011*** −0.004 −0.003 −0.006* −0.012**
Not overspending 0.006 −0.008 −0.005 −0.011*** −0.006** −0.015**
Covering unexpected
expenses
0.013*** 0.015*** 0.004* 0.001 0.001 −0.006*
Saving 0.012*** 0.010*** 0.002 0.001 −0.005** −0.008*
Attitude toward the future 0.013*** 0.006 −0.001 −0.001 −0.001 −0.004
Not being impulsive 0.017*** 0.009** −0.002 −0.001 −0.004** −0.001
Achievement orientation 0.014*** 0.008** 0.007** 0.004 0.002 0.009
Financial capability indexa 0.056*** 0.037*** 0.009 0.005 −0.014** −0.033***
Source: World Bank and Government of Mexico Financial Capability Survey data.
Note: See appendix D for sources of control variables and more details. Partial correlations measure the relationship between financial knowledge or capability and financial product usage after controlling for personal and municipality characteristics that could be driving the relationship. Statistical sig-nificance levels: * 10 percent, ** 5 percent, *** 1 percent.
a. Average of components listed above.
usage.3 The results show that positive behaviors related to using information, not
overspending, saving, and not being impulsive are associated with a lower likelihood
of borrowing from a pawn shop or from family or friends.
3 The living within means measure is excluded here since it is in part based on questions that
ask about use of loans and may thus be mechanically correlated with financial product usage.
The other financial capability measures are not based on questions about product usage. In
some developed countries, such as the United States and the United Kingdom, measures of
financial capability have included product usage as a component. However, under the Russia
Financial Literacy and Education Trust Fund project, it was decided to construct measures of
financial capability that do not rely on the use of financial products, as in many developing
countries (including Colombia and Mexico), a large portion of the population does not use any
products, in part because the supply of financial services is often more limited than in devel-
oped countries. See also Kempson, Perotti, and Scott (2013). The numbers are scaled so they
correspond to a 10-point increase in the capability measure. For example, a 10-point increase in
monitoring expenses capability is associated with a 1.1 percentage point increase in the likeli-
hood of having a bank account.

CHAPTER 6. LINKAGES BETWEEN FINANCIAL CAPABILITY AND FINANCIAL INCLUSION
49
Higher financial capability is related to a higher probability of using formal financial
products. The last row of table 6.1 summarizes the results by showing the relation-
ship between product usage and a financial capability index that is the average of
the nine components listed. The results of this index indicate that, overall, higher
financial capability is related to a higher probability of using formal financial products
(bank accounts and credit cards) and a lower probability of using informal credit
(from pawn shops or family or friends). Figure 6.2 illustrates these results by showing
the percentages of individuals with low or high financial capability who have a bank
account, credit card, pawn shop loan, or loan from family or friends. Individuals clas-
sified as low (high) financial capability are those who have a financial capability index
below (above) the median. Individuals with high financial capability are twice as likely
to have a bank account or credit card as individuals with low financial capability.
They are also about 30–40 percent less likely to have a pawn shop loan or a loan
from family or friends.
FIGURE 6.2 USE OF FINANCIAL PRODUCTS BY INDIVIDUALS WITH LOW OR HIGH FINANCIAL CAPABILITY
Bank account
Percentage of individuals with low/high financial capability
Low financial capability High financial capability
30
0
25
20
10
5
8.1 7.6 9.4
26.1
15.4 14.1
5.7
17.9
Credit card Pawn shop loan Loan fromfamily or friends
Source: World Bank and Government of Mexico Financial Capability Survey data.
Note: Low (high) financial capability is defined as having a financial capability index below (above) the median. The index is an average of the nine financial capability components listed in table 6.1. The differences shown in this figure control for personal and municipality characteristics (see appendix D).
6.3 FINANCIAL KNOWLEDGE, FINANCIAL CAPABILITY, ACCESS TO FINANCE, AND FORMAL PRODUCT USAGE
This section analyzes the financial capability data with municipality-level financial
infrastructure data to see if increased access to financial services through banking
correspondents is associated with greater use of financial products and how this
correlates with financial capability. As discussed in chapter 3, only 15 percent of

FINANCIAL CAPABILITY IN MEXICO: RESULTS FROM A NATIONAL SURVEY ON FINANCIAL BEHAVIORS, ATTITUDES, AND KNOWLEDGE
50
those surveyed reported having a formal account at a financial institution, 14 percent
a credit card, and 9 percent a bank loan. A first step for bringing more individuals
into the formal banking system is to provide access points for financial institutions.
Figure 6.3 uses data from the Consejo Nacional de Inclusión Financiera (2011) to
illustrate the distribution of bank branches across the 95 municipalities covered in
the Mexican Financial Capability Survey. As shown, 19 municipalities have no bank
branch at all; most others have between one and three branches per 10,000 adults.
The average number of bank branches per 10,000 adults in the sample is 1.2.
The data set from the Consejo Nacional de Inclusión Financiera also includes infor-
mation on the number of banking correspondents in each municipality. Starting in
2009, banks signed correspondence agreements with retail stores and other insti-
tutions, such as convenience store chains like OXXO and Telecomunicaciones de
México, to provide access to banking services through the store or branch network
of these establishments. The services provided through correspondents vary from
bank to bank, but often include payment services, money withdrawal, money
deposits, and credit card payments (see Consejo Nacional de Inclusión Financiera
2011 for more information). The average number of banking correspondents for the
95 municipalities in the Mexican Financial Capability Survey is 2 per 10,000 adults,
exceeding the 1.2 bank branches per 10,000 adults. Figure 6.3 shows that correspon-
dents provide more bank access points in these municipalities compared to bank
branches. Only 11 municipalities have no correspondents, compared to 19 that have
no bank branch. In addition, 20 municipalities have three or more banking correspon-
FIGURE 6.3 DISTRIBUTION OF BANK BRANCHES AND CORRESPONDENTS ACROSS MUNICIPALITIES
0
10
20
30
40
0 0–1 1–2 2–3 3–4 > 4
Number of municipalities
Number of access points in the municipality (per 10,000 adults)
Bank branch Banking correspondent
19
25
33
14
3 1
11
26
20 18
10 10
Source: Consejo Nacional de Inclusión Financiera 2011.
Note: Data are for the 95 municipalities in the Mexican Financial Capability Survey.

CHAPTER 6. LINKAGES BETWEEN FINANCIAL CAPABILITY AND FINANCIAL INCLUSION
51
dents per 10,000 adults, versus only 4 municipalities with a corresponding number
of bank branches per 10,000 adults. The analysis in table D.4 in appendix D shows
the extent to which the presence of bank branches and banking correspondents in
a municipality is associated with use of formal financial products by respondents to
the Mexican Financial Capability Survey.
Results suggest that banking correspondents increase access to formal financial
products only for individuals with high financial capability or high financial knowl-
edge. The results in table D.4 show no statistically significant relationship between
the number of commercial bank branches in a municipality and the number of indi-
viduals in the survey who use formal financial products. Although the relationship
is not causal, the number of banking correspondents is associated with greater use
of bank accounts and credit cards for individuals with high financial capability or
high financial knowledge. For individuals with low financial capability or low financial
knowledge, neither bank branches nor banking correspondents are associated with
use of financial products, after controlling for other factors, including income. As
discussed earlier, individuals with low financial capability rely more on informal than
formal financial products. The results here suggest that the increase in formal sector
access points through banking correspondents has not been sufficient to integrate
these individuals into the formal financial sector.


53
CHAPTER 7
Conclusions and recommendations
Important challenges related to financial behavior, attitudes, and knowledge have
been identified for different segments of the Mexican population based upon data
from this first nationally representative survey on financial capability.
� Chapter 2 highlights weaknesses in daily money management and planning
processes, finding that 41 percent of those surveyed consistently budget, and
just 20 percent monitor expenses rigorously. Furthermore, it suggests that
many Mexican households are financially strained, with 70 percent reporting
regular or occasional shortages of funds to cover basic expenses and the
majority having no provisions to cover major expenses, planned or unplanned.
Planning for old age is infrequent, with less than a third of the population
under the age of 60 reporting any plans in place to cover old-age expenses.
� Chapter 3 shows gaps in financial inclusion, finding that 49 percent of the
population does not currently use any financial products. Among those who
do, informal loans and accounts at financial institutions are the products
used most commonly. More than 60 percent of those using financial prod-
ucts reported verifying terms and conditions and comparing various products
before making financial decisions. However, only 37 percent of the survey
population was able to do a simple interest rate calculation—an ability that
would be necessary to analyze financial products.
� Chapter 4 describes five distinct clusters within the sample population that
were identified using individual scores for the components of financial capa-
bility. The most common clusters were short-term money managers and unso-
phisticated money managers, which made up 33 percent and 25 percent of
the surveyed population, respectively. One of the smaller clusters consisted of
young impulsive spenders (12 percent of those surveyed).
� Chapter 5 compares the financial capability of Mexicans to respondents in
six other countries and finds that Mexicans have a relatively shorter planning
time horizon and are less likely to plan how they would spend their money.
The Mexicans surveyed did, however, report a fairly high inclination toward
saving behavior relative to the other countries. With respect to formal financial
FINANCIAL CAPABILITY IN MEXICO: RESULTS FROM A NATIONAL SURVEY ON FINANCIAL BEHAVIORS, ATTITUDES, AND KNOWLEDGE
54
knowledge, Mexicans displayed a weaker performance relative to respondents
in most of the other surveyed countries on interest rate calculations, under-
standing of the concept of risk and return, and understanding of portfolio
diversification.
� Chapter 6 provides evidence of linkages between financial knowledge, finan-
cial capability, and financial inclusion, as measured by the use of formal finan-
cial products. The chapter suggests that banking correspondents increase
access to formal financial products primarily for individuals with high finan-
cial capability or high financial knowledge. This finding in turn suggests that
expanding financial knowledge and enhancing financial capability are crucial
steps toward the goal of accelerating responsible financial inclusion.
Increasing the overall financial capability of Mexicans will require a multipronged,
multistakeholder strategy involving improved design of financial management tools
and financial products, targeted financial education to enhance capability, and
supportive regulation ensuring adequate consumer protection. The seven policy
recommendations listed below are based on lessons learned and describe interven-
tions that have been successfully implemented in other countries. Taken together,
they could address the challenges related to financial capability that Mexicans face.
1. Promoting technology that increases timely access to personal finan-
cial information can foster more precise daily money management
and encourage planning behaviors that are missing in many of those
surveyed.
– Designated Mexican authorities and other stakeholders could support the
development of mobile phone– and Internet-based personal finance
tools and their distribution through financial and educational institutions.
These tools can help households track spending by categorizing transac-
tions and motivating saving toward budget goals. In recent years, a number
of tools with web and/or mobile phone interfaces have been developed,
such as HelloWallet, Mint, Pageonce, Rocket, and Juntos Finanzas. In partic-
ular, Juntos Finanzas (which won the 2012 Mexico G20 innovation award
for financial inclusion) is suitable for a range of Mexican households, as it
was developed specifically to help cash-based households, is available in
English and Spanish, and is an SMS (short message service) -based applica-
tion that works with the simplest mobile phones. Financial authorities could
encourage tool developers to partner with financial institutions to promote
the use of these tools among their clients and to develop complementary
tools for personal finance. CONDUSEF recently launched an app supporting
household budgeting. Nearly all of the Mexican population has access to
a mobile phone and a quarter of the Mexican population uses the Internet

CHAPTER 7. CONCLUSIONS AND RECOMMENDATIONS
55
(INEGI 2010), so Internet- and mobile phone–based personal finance tools
are a particularly good way to reach youth, who are disproportionately
active users of these media.
– Financial sector regulators and other relevant authorities could encourage
financial institutions and other stakeholders to use text messages and
social media to relay simple notices and information related to personal
finance, such as managing account balances, loan repayment, adhering to
debt management plans, and savings mobilization. A randomized control
trial in the Philippines found that personalized reminders to repay loans
were associated with timely repayment (Karlan, Moren, and Zinman 2012).
A study of financial institutions in Bolivia, Peru, and the Philippines showed
that letters or text message reminders to save increased the likelihood of
reaching saving goals by 3 percent and the total saved in the reminding
financial institution by 6 percent (Karlan et al. 2012). Some NGOs in India
have provided financial behavior–related content by voicemail in an effort
to reach illiterate populations. This recommendation also has particular
potential to reach the youth population that actively uses mobile phones
and social media. The financial education and behavior messages promoted
through social media should be based upon concepts for which there exists
evidence and general agreement.
2. To address the challenge of too little funds set aside for retirement and
other predictable life events, encourage a culture of voluntary saving.
– Mexican authorities and other stakeholders could consider implementing
media campaigns—e.g., through television programs—to transmit key
messages related to financial capability, such as the need to increase
voluntary saving for retirement. In 2010, 95 percent of Mexicans owned a
TV (INEGI 2010). Developing concise key messages and transmitting them
through mass media interventions could capture the attention of large
segments of the population. For example, those who viewed financial
education messages provided through a popular South African soap opera
had a significantly higher financial knowledge of the issues highlighted in
the soap opera storyline, and were almost twice as likely as those who
did not view the soap opera to borrow from formal sources and were less
likely to engage in gambling (Berg and Zia 2013). Telenovelas (Mexican soap
operas) are highly popular and could be used to spread key messages.
– Financial sector authorities (such as CONDUSEF) could enhance content
related to teachable moments when people might be seeking infor-
mation about financial decisions. A teachable moment could be paying
for education; the purchase of a home; a milestone occasion such as a

FINANCIAL CAPABILITY IN MEXICO: RESULTS FROM A NATIONAL SURVEY ON FINANCIAL BEHAVIORS, ATTITUDES, AND KNOWLEDGE
56
marriage, the birth of a child, or retirement; or even the registering of a
consumer complaint on a financial product. Using a sample of Indonesian
migrants, Doi, McKenzie, and Zia (2012) show that financial education can
have large effects when provided at a teachable moment, but that this
impact varies by training recipient. Duflo and Saez (2011) find positive
impacts of financial education on planning for retirement or investment
portfolio choices, leading to an increase in retirement plan participation.
New Spanish-language content on the U.S. Consumer Financial Protection
Bureau website offers one model of providing clear information at key deci-
sion points.1 It includes information on how to buy a car or a home or pay
for college; this could be used to augment information CONDUSEF currently
offers related to loan cost calculators.
3. Strengthen savings mobilization, particularly to cover unanticipated
financial shocks, by encouraging financial institutions to adopt attractive
product design elements.
– Labeling savings for specific goals is a simple, relatively cheap way to
make gains from a savings account feel tangible and curb tendencies to
overspend. In Colombia, banks such as AV Villas are piloting mobile phone
wallets with different “pockets” named for specific goals (such as vaca-
tions, special events, or education). In Mexico, the mobile wallets provided
by a diverse set of financial institutions, including microfinance institutions,
could be similarly equipped. A randomized controlled trial found that treat-
ment groups in Ghana with access to accounts that individuals labeled
for specific savings goals saved 31 percent more on average than the
control group (Karlan et al. 2012). A Peruvian financial institution created
jigsaw puzzles with pictures of savings goals (such as a child in school
or a vehicle). The group receiving a puzzle piece for each deposit was
2.3 percentage points more likely to meet its savings commitment than the
control group (Karlan et al. 2009).
– Commitment savings accounts enable users to voluntarily restrict access
to their savings for a set period of time, helping them establish discipline
while avoiding the distraction of less valuable daily purchases. For example,
after one year, individuals in the Philippines who gave up access to their
savings for a set period of time increased their savings 81 percent rela-
tive to a control group (Ashraf, Karlan, and Yin 2006). An experiment that
randomly assigned some Kenyan farmers the choice to commit some of
their earnings immediately to a savings account dedicated to fertilizer
1 Accessible in Spanish at http://www.consumerfinance.gov/es/.

CHAPTER 7. CONCLUSIONS AND RECOMMENDATIONS
57
or wait a few days before committing the funds found that 57 percent of
those who immediately saved in the account purchased fertilizer in the
next planting season, compared with 30 percent in the control group (Duflo,
Kremer, and Robinson 2006). Finally, a deferred payment scheme that
utilizes future dated mobile payments (i.e., the ability to send money to
oneself at a future date), has been proposed as the functional equivalent of
traditional commitment savings for mobile phones. The customer’s funds
would not be accessible until the date is reached, and the future date
would be associated with a purpose in the customer’s mind (Mas 2013).
– Remittance-linked products aligned with the needs of migrant workers
and their families offer the opportunity to move transfers directly into
savings products. Such products could draw on insights from a study of
U.S.-based El Salvador migrants (Ashraf et. al 2011), which found that
savings accounts that offer the remittance senders greater monitoring and
control over their account accumulate the most savings.
– Encouraging recipients of social welfare benefits to save transfers into
their associated bank account rather than withdrawing their entire transfer
at once would support saving among a segment of the population that now
demonstrates relatively low use of formal financial services. For example,
accounts in the state-owned Bank of National Savings and Financial
Services (BANSEFI) opened for Oportunidades social welfare beneficiaries
are underutilized, in large measure because Oportunidades benefits are
not paid into these accounts, even though the bank’s infrastructure (cards
and point-of-sale terminals) is used to effect the payments. The contract
between the Ministry of Social Development (SEDESOL) and BANSEFI
does not permit Oportunidades beneficiaries to delay or receive benefits
partially, or to use money paid into their account to purchase goods elec-
tronically at retail stores. Instead, programs could pay benefits directly
into beneficiary bank accounts, allowing beneficiaries to administer their
funds as they see fit. Social benefit recipients could also be given an easy
account portability option, which would increase competition among banks
and provide incentives to market additional products to beneficiaries and
extend correspondent networks into marginalized communities. A similar
approach might be used for social programs that attempt to alleviate food
insecurity and provide income support to the elderly.
4. Continue to develop financial infrastructure to improve access to
formal financial services for segments of the Mexican population that
are currently not using financial services or that are using suboptimal
informal services.

FINANCIAL CAPABILITY IN MEXICO: RESULTS FROM A NATIONAL SURVEY ON FINANCIAL BEHAVIORS, ATTITUDES, AND KNOWLEDGE
58
– Mexican governmental authorities could enact regulatory changes that
allow additional financial institutions, such as financial cooperatives
and deposit-taking microfinance institutions (popular financial soci-
eties—SOFIPOs) to operate through bank correspondents. This autho-
rization would strengthen financial access, as most retail correspondent
chains do not extend into slums or peri-urban areas or smaller towns.
Today, Telecomm (a government agency) is the only Mexican banking
correspondent chain that reaches smaller towns. Authorities could allow
deposit-taking SOFIPOs and the cooperatives that are present in those
areas to sign up banking correspondents on the same terms as do banks
(i.e., on a fully funded, real-time basis). In this way, these financial institu-
tions could expand geographically and could offer more convenient service
to their customers. Note that permitting SOFIPOs and cooperatives to
engage as banking correspondents would require changes in their respec-
tive governing laws. Relatedly, financial institutions, including public entities,
could consider assigning additional networks to operate bank correspon-
dents. For example, full utilization of the extensive network of Diconsa
subsidized rural food stores, Pemex gas stations, and cajas de ahorro would
expand the potential for basic savings.
– Efforts to widen the scope of transactions executed through bank
correspondents would support financial inclusion. Although the opening
of low-risk deposit accounts is permitted by regulation, few banks are
opening these accounts through correspondents. Currently, many banking
agents deliver a limited range of operations, so access and usage points
are restricted. Building the business case for financial institutions to offer
additional financial products and services through correspondents is a key
challenge.
– Mexican government authorities could strengthen regulations to build a
stronger, more open mobile payments network. For example, regulations
to support the interoperability of the mobile payment system would
help ensure that consumers can execute transactions irrespective of the
mobile network operator or bank chosen. Currently, certain mobile financial
services are not interoperable with other telecommunications providers
or even with other banks, limiting market growth. Promoting new busi-
ness models that support the growth of a mobile payments network, such
as mobile point-of-sale schemes, has shown promise in other developing
economies; these are now being rolled out in Mexico as well.
– Scaling up promising programs to expand financial access to rural
areas would increase opportunities for Mexicans to save and participate
CHAPTER 7. CONCLUSIONS AND RECOMMENDATIONS
59
in other formal financial transactions. A recent Telecomm pilot project in
Oaxaca found that, following installation of mobile network communica-
tion infrastructure and the provision of mobile phones to the population,
48 percent of those in the pilot became “savers” with balances exceeding
Mex$100, and 33 percent became active users of mobile financial services
(CGAP 2013). Participants were provided with instruction on how to use
mobile financial services—another example of taking advantage of a teach-
able moment to provide financial education.
– Mexican authorities could promote the marketing of basic accounts. In
2007, the Mexican Congress approved a law that made it mandatory for
all institutions that receive money deposits to offer basic payroll accounts.
There are now some 24 million basic accounts, the majority of which are
associated with payroll collection for formal employees. Through “mystery
shopper” visits to financial institutions, Gine, Martinez-Cuellar, and Mazer
(forthcoming) find that, although Mexican law requires basic savings
accounts to be offered at all banks, such accounts were not offered to a
single shopper in more than 100 visits to institutions—despite these low-
cost products being a good match for the needs of many of the consumers
in the exercise. These bank accounts may not be having the intended
impact on savings access for low-income consumers; this situation could
be improved through more specific marketing rules so providers make
consumers aware of the product’s existence.
– Encourage programs supporting linkages from informal to formal prod-
ucts—e.g., between tandas and banks. In Egypt, the rotating savings
and credit association model was combined with bank insurance to
protect member savings in case a member defaults (El-Gamal et. al 2011).
Similarly, India’s National Bank for Rural Development has had a program
in place since 1992 to link informal self-help groups (groups that collect
small amounts of savings from members) with banks. The banks deal with
the group rather than individuals, thereby helping to minimize the transac-
tion costs on these relatively small deposits while paying a market rate of
interest.
5. Support consumer protection interventions that help mitigate the effects
of limited formal financial knowledge of segments of the Mexican popu-
lation.
– Relevant Mexican authorities could require regulated financial institutions
to incorporate research on good practices for disclosure and pricing
regimes for financial consumers. A study of the use of AFORES (retirement
investment funds) in Mexico finds that workers with low financial knowl-

FINANCIAL CAPABILITY IN MEXICO: RESULTS FROM A NATIONAL SURVEY ON FINANCIAL BEHAVIORS, ATTITUDES, AND KNOWLEDGE
60
edge are better able to analyze and compare the fees charged by funds
when these are presented as total costs in pesos rather than as an annual
percentage rate (Hastings and Tejada-Ashton 2008). A study executed by
the Consultative Group to Assist the Poor (CGAP), CONDUSEF, and the
World Bank notes similar findings regarding consumer understanding of
percentages; it also finds that even sales agents for financial products had
poor knowledge of the definitions of key terms required to be disclosed to
consumers, such as total annual cost or total annual earnings for savings
and credit cards (Gine, Martinez-Cuellar, and Mazer forthcoming). In
consumer credit products, total annual cost should be expressed as “total
amount you pay,” with the amount due expressed in pesos rather than as a
percentage value. Other interventions suggested by the researchers include
having banks present sample user profiles for new customers that best
approximate their behavior (e.g., light user versus heavy user) to help them
make more decisions across product features more easily. Mexican authori-
ties could also consider interventions related to promoting impulse control,
such as requiring credit card companies to allow users to place lower ceil-
ings on charges than those approved by the credit card company.
– Developing market conduct regulations governing banking transactions
occurring outside the traditional banking infrastructure will be critical. As
new methods of transactions develop—such as mobile banking—or new
types of correspondents arise, the relevant Mexican authorities may need
to adapt regulations to reflect these new channels.
6. School-based financial education programs could address the deficien-
cies in financial behaviors and knowledge identified in this report, but
should be designed and implemented carefully given the mixed impact
of global interventions to date.
– Mexican authorities could consider carefully designed school-based
programs to offer opportunities to educate youth on a regular basis before
they make key financial decisions. Current dialogue about the Mexican
public educational system includes discussion of increased time for class-
room instruction and increased opportunities for experiential education—
both of which offer opportunities for financial education curricula. Insights
from existing school-based financial education programs could inform this
design. For example, Bruhn et al. (2013) conducted a randomized evaluation
of a financial education program in Brazilian public high schools that incor-
porated modules into different aspects of the curriculum and integrated
assignments that involved family budgeting. They find positive effects
on knowledge, attitudes, and behaviors, including a 24 percent increase

CHAPTER 7. CONCLUSIONS AND RECOMMENDATIONS
61
in student savings rates and spillovers to parents such as a 17 percent
increase in the number of parents who track monthly expenses. School-
based education programs could be coupled with programs promoting
responsible use of financial products, such as the opening of savings
accounts for youth. Once designed, courses can also be transmitted in tele-
secundarias, which provide secondary education through television broad-
casts in areas that are rural or otherwise difficult to access.
– Mexican authorities should consider the mixed evidence on the impact of
financial education programs within their planned policy framework for
financial education. Programs provided by financial institutions are partic-
ularly challenging. Bruhn, Ibarra, and McKenzie (2013) describe a financial
literacy course offered by a financial institution in Mexico City and find that
take-up of voluntary programs is extremely low and that the benefits of
the training were partial (a 9 percent increase in financial knowledge and
a 9 percent increase in savings outcomes but no impact on credit card
behavior, retirement saving, or borrowing). While financial literacy courses
may be beneficial for some segments of the population (such as individuals
with higher levels of education, who are accustomed to learning in a class-
room setting), other types of interventions may be needed to reach the
broader population.
7. Sustained analysis is needed to support the Mexican financial capability
agenda.
– Building on the baseline of the comprehensive financial capability data set
underlying this report, Mexican authorities could consider monitoring a
smaller subset of questions from the Financial Capability Survey over
time, possibly as part of ENIF. If properly designed, such a survey could
provide the opportunity to test the impact of program interventions over
time. More frequent monitoring and evaluation could be considered by
utilizing the G20-recommended indicators related to financial capability
that are currently under development.
– Mexican authorities could also opt to participate in the next round of
the OECD’s Programme for International Student Assessment (PISA)
financial literacy exercise. This participation would increase the body
of knowledge on financial literacy strengths and weaknesses of the youth
population, and permit Mexico to benchmark its youth to peers in other
OECD countries.
– Additional research could explore linkages between the Financial Capability
Survey and other Mexican data sources.


63
APPENDIX A
Construction of financial capability scores
The text in sections A.1 and A.2 is taken from Kempson, Perotti, and Scott (2013:
58–61), a publication of the Russia Financial Literacy and Education Trust Fund. The
main objective of the Russia Financial Literacy and Education Trust Fund measure-
ment project was to develop indicators of financial capability that are as neutral as
possible with respect to culture and to education or income levels. One of the key
questions to be answered through empirical analysis was the possibility to construct
valid measures that can be used for comparisons across countries.
A.1 IDENTIFYING FINANCIAL CAPABILITY COMPONENTS
The aim of the analysis is to construct a score Sc for each component c of financial
capability (c = 1,…, C, where the number of components C is unknown) as a linear
combination of the (standardized) variables V1,V2,…, VK contained in the data set,
which have correlation matrix ∑:
S wV
wV
wV
c c c cKK K
K1
1 1
12
2 2
2
=− µσ
+− µσ
+− µσ
where μi and σi denote, respectively, the mean and standard deviation of Vi, and
the weights w are unknown. A key advantage of factor analysis is that the weights
attributed to each component are not determined in advance, but are calculated
through empirical analysis and therefore reflect the importance of each variable in
the context of interest; low- and middle-income countries for this project. A specific
weight wci (which denotes the importance of the ith variable for component c) can
be zero, meaning that variable i is not relevant for a specific component c. In short,
this means that neither the number nor the nature of the components is determined
a priori. For example, if there are 10 variables in the data set, it might be that two
components exist, where the first is a combination of the 1st, 3rd, and 10th variables
only, and the other variables are relevant for the second component. By looking at
which specific variables are relevant for a particular component, it is possible to
identify the nature of the component. The results of this analysis are then compared
to the manifestations of financial capability that emerged from the focus groups. If

FINANCIAL CAPABILITY IN MEXICO: RESULTS FROM A NATIONAL SURVEY ON FINANCIAL BEHAVIORS, ATTITUDES, AND KNOWLEDGE
64
the components are comparable to the focus group concepts, they can be consid-
ered reliable measures for these concepts.
Several procedures exist to extract components from data. A frequently applied
method is PCA [principal component analysis], which captures all of the variance of
the variables and is the most adequate technique when the measurement scales
are not yet validated. PCA is based on maximization of the variance of S1 to find
the weights for the first component (w11, …, w1K), maximizing the variance of S2 to
find the weights of the second component (w21, …, w2K), and so on, subject to the
constraint that the sum of the squared weights for each component be equal to
one. The weights that solve this maximization problem are a function of the matrix
of correlations between the components, and of its eigenvalues and eigenvectors.
This method produces a matrix Λ of factor loadings, which represent the correlation
between each variable and the components. The columns of this matrix are equal to
the eigenvectors of the correlation matrix ∑, scaled by the square root of the corre-
sponding eigenvalue.
Alternative extraction methods include principal factoring (reducing the variance
explained by the components to the shared variance among the variables, not total
variance), and maximum likelihood (aimed at reproducing the correlation matrix).
Principal factoring is preferred when a clear a priori structure for the scales and
constructs in the analysis is assumed. Maximum likelihood has the advantage of
being able to test the statistical fit of the component solution. A completely different
method is confirmatory factor analysis, in which the structural relationships between
the variables are determined a priori and tested using maximum likelihood estima-
tion. Since the goal of the present project was to develop measure(s) of financial
capability, an exploratory type of analysis was favored; hence PCA was selected as
the main analysis technique.
PCA extracts as many components as there are variables in the correlation matrix,
in order of decreasing explained variance. Typically, the first few components explain
a large percentage of the variance, say over 50 percent. At some point, the marginal
contribution of a component becomes too low and the remaining components are
omitted. One common criterion to decide about the number of components to be
retained is that a component have an eigenvalue greater than one, meaning that the
component explains more than the average variance explained by each component.
Another criterion, often applied in combination with the eigenvalue criterion, is the
scree test, in which the eigenvalues are plotted against the components. Since the
principal components are ordered from high to low, the eigenvalues at first drop very
quickly, then level off. Usually there is a break in the slope of the line drawn through
the first few eigenvalues and the slope of the line drawn through the remaining

APPENDIX A. CONSTRUCTION OF FINANCIAL CAPABILITY SCORES
65
eigenvalues. The “kink” between the two lines indicates the cutoff point for compo-
nents: those before the kink are retained and those after it are omitted.
It is recommended that at least three measures be included in the PCA, several of
which should be substantially correlated. To test whether the set of chosen variables
is adequate for PCA, Kaiser’s measure of sampling adequacy is usually calculated
and a value over 0.60 is considered adequate (Tabachnick and Fidell 2001). For
the analysis, the Kaiser measure was calculated and a value higher than 0.60 was
obtained except for one component of capability (using information, for which it was
0.56).
Although the principal components explain the common variance among the vari-
ables, the component weights, shown in the component loading matrix, cannot be
interpreted easily. The initial PCA solution represents the variables in the orthogonal
component space. By rotating the space, the variables can be represented such that
they are maximally related to certain components, indicating convergent validity, and
minimally to other components, indicating discriminant validity. Rotation results in
high weights for some components and low weights for other components for the
same variable. The rotated component loading matrix can be interpreted more easily,
since typically each component is related to a particular set of variables, and not to
the remaining variables. The interpretation then follows from the nature of the high-
loaded variables. For example, a component that is highly related to questions such
as “When you receive money, do you plan how it will be used?,” “Do you plan exactly
how you will use the money or only make a rough plan?,” and “Do you keep to the
plan you made for spending your money?” might be interpreted as “budgeting.” Rota-
tion may be accomplished in many different ways, the main ones being orthogonal
rotation, assuming that the components are unrelated, and oblique, in which case
the components are allowed to be correlated. If the structure of the data is not
known beforehand, it is good practice to run PCA with oblique rotation first, and if
the component correlations are low (e.g., below 0.32), to present the orthogonal
rotation, effectively neglecting the low correlations (Tabachnick and Fidell 2001).
Interpretation problems arise if the same variable has more than one high loading, in
which case the components cannot be interpreted uniquely. Sometimes a solution is
to drop such a variable from the analysis.
To assess the reliability of the components, the standard Cronbach’s alpha is used as
a measure of reliability based on the number of items related to a component (the
more items, the higher the internal consistency will be) and on the average correla-
tion between the items. Cronbach’s alpha varies between 0 and 1, and values higher
than 0.65 are typically considered to denote satisfactory reliability. In this project,
the Cronbach’s alpha calculated for the components was higher than 0.65 except for

FINANCIAL CAPABILITY IN MEXICO: RESULTS FROM A NATIONAL SURVEY ON FINANCIAL BEHAVIORS, ATTITUDES, AND KNOWLEDGE
66
two components (using information and not being impulsive, for which it was 0.37
and 0.61, respectively).
The results of the analysis showed that 10 components could be identified in each
country and that their composition was comparable across countries. Two addi-
tional components were identified but only applied to subgroups of the population
(people under 60 years, and people who choose financial products personally). These
components are described in more detail in chapter 6 of Kempson, Perotti, and Scott
(2013)].
A.2 CONSTRUCTING COMPONENT SCORES
Once a group of variables is identified as loading on the same component, a single
score can be calculated for each individual with respect to that component, by
weighting each variable by the coefficients obtained through the PCA. The most
commonly used procedure to obtain the coefficients w is the regression approach…
which calculates the matrix of score coefficients as Λ∑−1.
The component scores are standardized (have zero mean and unit variance) and
in principle may run from −∞ to +∞. However, because the range of values of the
observed variables is limited, the range of component scores is also limited. One
more easily interpretable way of presenting the component scores consists of
rescaling them between extremes formed by the responses of an extremely inca-
pable person (who would score 0) and responses of an extremely capable person
(who would score 100). This procedure amounts to having the questionnaire
completed (hypothetically) by two such extreme persons, then calculating their
respective component scores to be used for rescaling. The rescaling formula is
S* = 100*(S − a)/(b − a)
with S the original component score, a the minimum score, and b the maximum
score.
A.3 COMPARING FINANCIAL CAPABILITY
Regression analysis was used to examine the extent to which respondents’ indi-
vidual characteristics were associated with each of the 10 components of financial
capability. Table A.1 lists the sample summary statistics for the covariates used in
the regressions. All are binary variables (equal to 1 if the category applies to the
respondent, equal to 0 otherwise), except for the number of adults in the household
and the financial knowledge score. The means presented for the binary variables are
interpreted as follows: for example, if “female” is on average equal to 0.53, then this
means 53 percent of the sample are women.

APPENDIX A. CONSTRUCTION OF FINANCIAL CAPABILITY SCORES
67
TABLE A.1 SAMPLE STATISTICS FOR KEY SOCIODEMOGRAPHIC VARIABLES
VARIABLE MEAN STANDARD DEVIATION
Female 0.53 0.50
Age 18–30 0.29 0.46
Age 31–40 0.25 0.43
Age 41–50 0.19 0.40
Age 51–60 0.12 0.33
Age 60+ 0.14 0.35
Primary education at most 0.36 0.48
Secondary education 0.55 0.50
Tertiary education 0.09 0.28
# household members 18+ 2.82 1.17
Living with a partner 0.69 0.46
Has dependent children 0.55 0.50
Rural area 0.38 0.49
Income group 1 0.37 0.48
Income group 2 0.34 0.47
Income group 3 0.17 0.37
Income group 4 0.13 0.33
Has financial products 0.51 0.50
E1: Formal employee 0.24 0.43
E2: Informal employee 0.15 0.36
E3: Self-employed 0.03 0.16
E4: Unemployed 0.05 0.22
E5: Waiting for busy season 0.02 0.14
E6: Student 0.04 0.19
E7: Retired 0.04 0.20
E8: Sick 0.01 0.12
E9: Housework 0.27 0.44
E10: Other 0.15 0.35
Financial literacy score 2.79 1.27
Responsible for day to day 0.74 0.44
Responsible for planning 0.75 0.44
Responsible for choosing financial product 0.66 0.74
Income seasonality: no income 0.10 0.30
Income seasonality: variable income 0.60 0.49
Income seasonality: stable income 0.30 0.46
Source: World Bank and Government of Mexico Financial Capability Survey data.
Note: n = 2,022.


69
APPENDIX B
Segmenting the population using cluster analysis
This appendix draws on analysis from Kempson, Perotti, and Scott (2013) summa-
rizing results from all of the countries in the Russia Financial Literacy and Education
Trust Fund financial capability project. Cluster analysis was used by the project team
to segment the population into groups with comparable levels of capability. This
iterative procedure aggregates individuals into groups that have shared attributes
distinguishing them from others in the population (in this case, similar financial capa-
bility strengths and weaknesses). This approach was used, for example, in the United
Kingdom and in the Netherlands. The clustering process consists of two steps: prox-
imity analysis (to calculate dissimilarity measures between respondents) and hierar-
chical cluster analysis (to determine the number of clusters). The steps are described
below, as per Kempson, Perotti, and Scott (2013: 64).
B.1 PROXIMITY ANALYSIS
This step is only required if a single measure of financial capability cannot be
developed. In this case, individuals need to be compared along many dimensions,
by calculating a dissimilarity measure that takes into account all the dimensions.
Several methods can be used to calculate dissimilarity, but a very common one is the
squared Euclidean distance, defined as
d X Y X Y( , ) ( )i ii
2∑= −
with Xi and Yi the values of the ith variable for individuals X and Y. In other words, the
distance between two observations is calculated as the sum of the squared differ-
ences between the values of the observations. Note that this measure should not be
interpreted as an overall index of capability, but simply as a practical method to iden-
tify individuals who have similar capability scores across the different dimensions.
B.2 HIERARCHICAL CLUSTER ANALYSIS
The distances between the respondents serve as a starting point for the hierarchical
cluster analysis to determine the number of clusters or groups of respondents. The
procedure initially assigns each of the N respondents to a separate cluster, so that
in the first iteration there are N clusters. In each of a maximum of N−1 consecu-
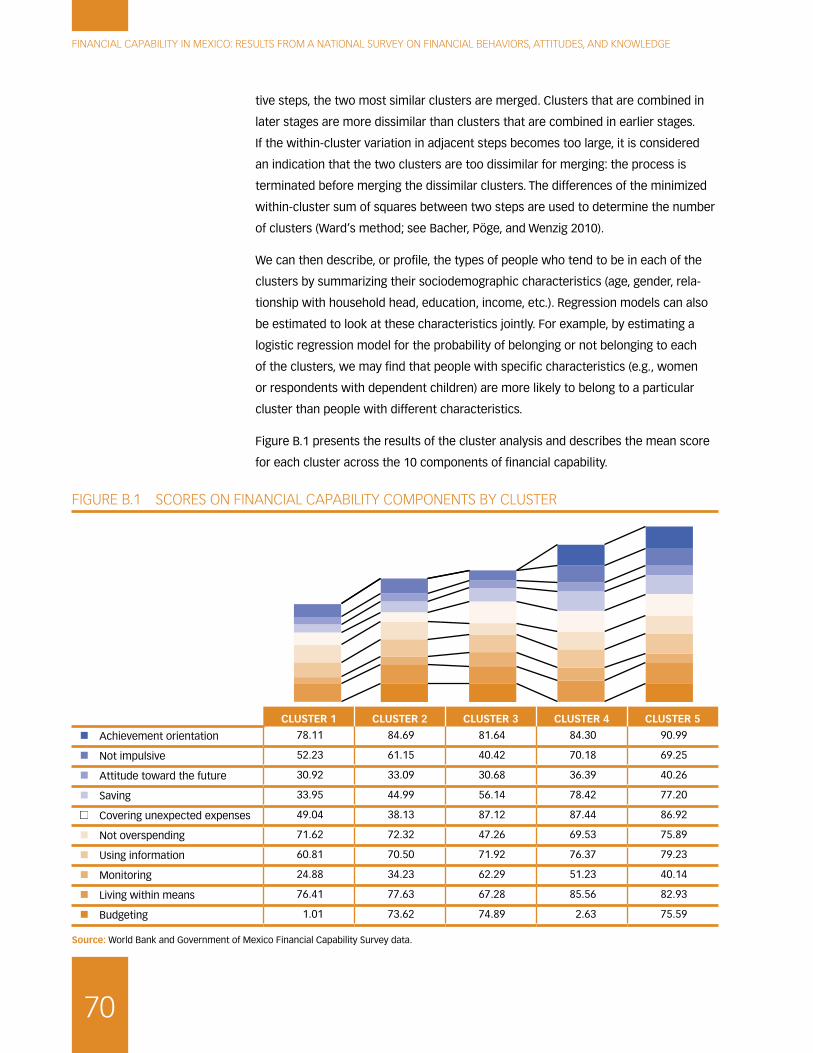
FINANCIAL CAPABILITY IN MEXICO: RESULTS FROM A NATIONAL SURVEY ON FINANCIAL BEHAVIORS, ATTITUDES, AND KNOWLEDGE
70
tive steps, the two most similar clusters are merged. Clusters that are combined in
later stages are more dissimilar than clusters that are combined in earlier stages.
If the within-cluster variation in adjacent steps becomes too large, it is considered
an indication that the two clusters are too dissimilar for merging: the process is
terminated before merging the dissimilar clusters. The differences of the minimized
within-cluster sum of squares between two steps are used to determine the number
of clusters (Ward’s method; see Bacher, Pöge, and Wenzig 2010).
We can then describe, or profile, the types of people who tend to be in each of the
clusters by summarizing their sociodemographic characteristics (age, gender, rela-
tionship with household head, education, income, etc.). Regression models can also
be estimated to look at these characteristics jointly. For example, by estimating a
logistic regression model for the probability of belonging or not belonging to each
of the clusters, we may find that people with specific characteristics (e.g., women
or respondents with dependent children) are more likely to belong to a particular
cluster than people with different characteristics.
Figure B.1 presents the results of the cluster analysis and describes the mean score
for each cluster across the 10 components of financial capability.
FIGURE B.1 SCORES ON FINANCIAL CAPABILITY COMPONENTS BY CLUSTER
CLUSTER 1 CLUSTER 2 CLUSTER 3 CLUSTER 4 CLUSTER 5
� Achievement orientation 78.11 84.69 81.64 84.30 90.99
� Not impulsive 52.23 61.15 40.42 70.18 69.25
� Attitude toward the future 30.92 33.09 30.68 36.39 40.26
� Saving 33.95 44.99 56.14 78.42 77.20
� Covering unexpected expenses 49.04 38.13 87.12 87.44 86.92
� Not overspending 71.62 72.32 47.26 69.53 75.89
� Using information 60.81 70.50 71.92 76.37 79.23
� Monitoring 24.88 34.23 62.29 51.23 40.14
� Living within means 76.41 77.63 67.28 85.56 82.93
� Budgeting 1.01 73.62 74.89 2.63 75.59
Source: World Bank and Government of Mexico Financial Capability Survey data.
71
This appendix compares the youth population, aged 18–24, with the adult population,
on financial behavior, attitudes, and knowledge with the goal of providing insights
into a population that is commonly targeted for financial education interventions.
Young people are entering an increasingly complex financial services market due
to technological advances, and financial deregulation. Parents are not uniformly
equipped to transmit sound financial management skills. Research shows that finan-
cial capability is strongly correlated with family economic and educational levels, and
those inequalities in financial capability persist across generations (Lusardi, Mitchell,
and Curto 2010). Higher-income and urban populations are typically more likely to
access financial services. For poorer parents, their educational levels—and conse-
quently their financial knowledge—may be lower than that of their children.
The age range of respondents in the Mexican Financial Capability Survey is 18–97,
with a median age of 39. For this analysis, “youth” is defined as those between the
ages of 18 and 24. The adult population is divided into two categories, those between
the ages of 25 and 59—typically the age range for active labor force participation—
and those aged 60 and over, classified here as the elderly.
C.1 EDUCATION, EMPLOYMENT, AND PARTICIPATION IN FINANCIAL DECISION MAKING
Mexican youth are, on average, more likely to be better educated than older cohorts
(figure C-1). A large majority of youth (84 percent) has completed secondary educa-
tion, compared to only 66 percent of the age 25–29 group and 68 percent of the
age 30–39 group. Twenty-two percent of youth respondents in Mexico are students,
compared to only 2 percent of those aged 25–29.
The majority of youth is employed in the formal or informal sector, or is studying
(figure C-2). Formal sector employment peaks for the age 25–29 group: this
sector employs 22 percent of youth and 42 percent of adults age 25–29. Formal
employment rates hover around 30 percent for the age 30–49 group, after which
rates decline sharply to 16 percent for the age 50–59 group. A significant propor-
tion—17 percent—of Mexican youth is employed in the informal/self-employed
sectors. Thirty-four percent of young Mexican women in the age 18–24 group report
APPENDIX C
Youth financial capability

FINANCIAL CAPABILITY IN MEXICO: RESULTS FROM A NATIONAL SURVEY ON FINANCIAL BEHAVIORS, ATTITUDES, AND KNOWLEDGE
72
no employment outside the home. The proportion of women in homemaker roles
increases significantly with age, rising to 52 percent of women aged 25–60 and to
67 percent of women aged 60 and over.
Mexican youth are less likely to contribute to the household or to participate in
household financial decision making than adults. Youth aged 18–24 are the age
group least likely to contribute to the household budget and participate in household
financial decision making. Only 51 percent of the age 18–24 group contributes to the
household budget, and only 55 percent participates in financial decision making in
FIGURE C.1 EDUCATIONAL ATTAINMENT BY AGE
Percent
0
20
40
60
80
100
18–24 25–29 30–39 40–49 50–59 60–69 70–79 ≥ 80
Primary
Secondary
Tertiary
Source: World Bank and Government of Mexico Financial Capability Survey data.
FIGURE C.2 EMPLOYMENT OF YOUTH (AGED 18–24)
Self-employed, farming3%
Looking for work10%
Waiting forbusy season
3%
Sick/disabled
< 1%
Employed,formal sector
22%
Studying21%
Housewife/work/caregiver
18%
Other9%
Employed,informal
14%
Source: World Bank and Government of Mexico Financial Capability Survey data.
Note: n = 267 (136 male; 131 female).
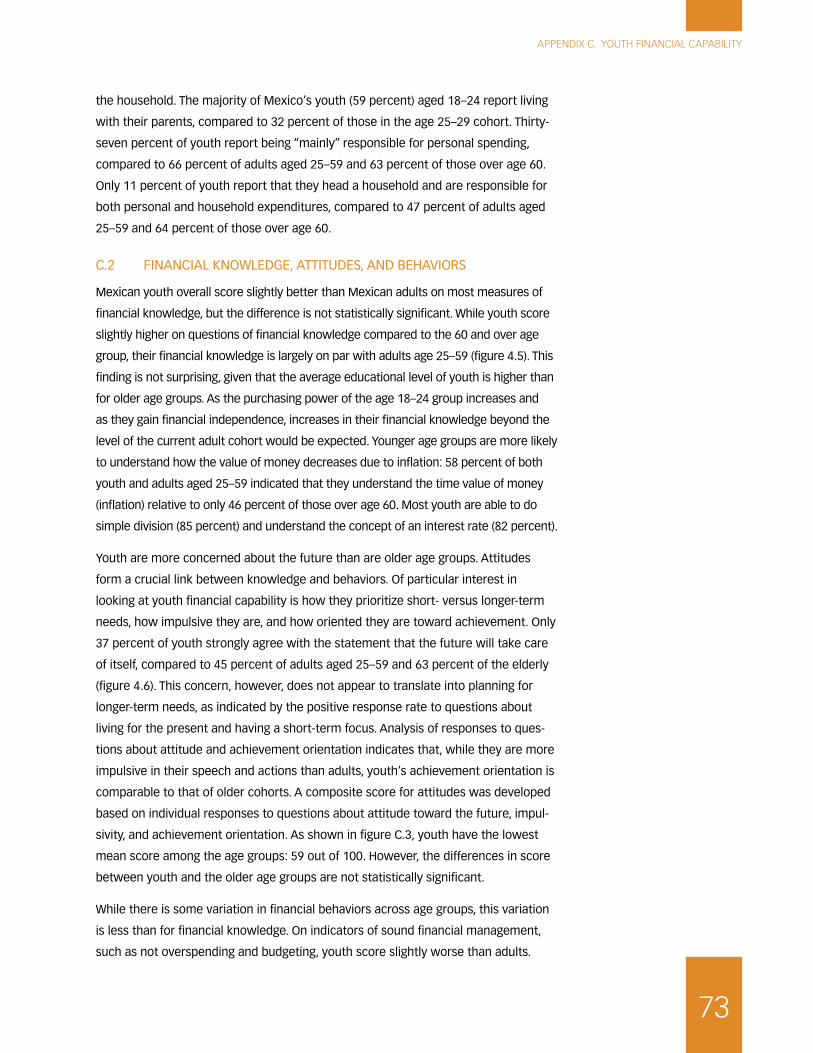
APPENDIX C. YOUTH FINANCIAL CAPABILITY
73
the household. The majority of Mexico’s youth (59 percent) aged 18–24 report living
with their parents, compared to 32 percent of those in the age 25–29 cohort. Thirty-
seven percent of youth report being “mainly” responsible for personal spending,
compared to 66 percent of adults aged 25–59 and 63 percent of those over age 60.
Only 11 percent of youth report that they head a household and are responsible for
both personal and household expenditures, compared to 47 percent of adults aged
25–59 and 64 percent of those over age 60.
C.2 FINANCIAL KNOWLEDGE, ATTITUDES, AND BEHAVIORS
Mexican youth overall score slightly better than Mexican adults on most measures of
financial knowledge, but the difference is not statistically significant. While youth score
slightly higher on questions of financial knowledge compared to the 60 and over age
group, their financial knowledge is largely on par with adults age 25–59 (figure 4.5). This
finding is not surprising, given that the average educational level of youth is higher than
for older age groups. As the purchasing power of the age 18–24 group increases and
as they gain financial independence, increases in their financial knowledge beyond the
level of the current adult cohort would be expected. Younger age groups are more likely
to understand how the value of money decreases due to inflation: 58 percent of both
youth and adults aged 25–59 indicated that they understand the time value of money
(inflation) relative to only 46 percent of those over age 60. Most youth are able to do
simple division (85 percent) and understand the concept of an interest rate (82 percent).
Youth are more concerned about the future than are older age groups. Attitudes
form a crucial link between knowledge and behaviors. Of particular interest in
looking at youth financial capability is how they prioritize short- versus longer-term
needs, how impulsive they are, and how oriented they are toward achievement. Only
37 percent of youth strongly agree with the statement that the future will take care
of itself, compared to 45 percent of adults aged 25–59 and 63 percent of the elderly
(figure 4.6). This concern, however, does not appear to translate into planning for
longer-term needs, as indicated by the positive response rate to questions about
living for the present and having a short-term focus. Analysis of responses to ques-
tions about attitude and achievement orientation indicates that, while they are more
impulsive in their speech and actions than adults, youth’s achievement orientation is
comparable to that of older cohorts. A composite score for attitudes was developed
based on individual responses to questions about attitude toward the future, impul-
sivity, and achievement orientation. As shown in figure C.3, youth have the lowest
mean score among the age groups: 59 out of 100. However, the differences in score
between youth and the older age groups are not statistically significant.
While there is some variation in financial behaviors across age groups, this variation
is less than for financial knowledge. On indicators of sound financial management,
such as not overspending and budgeting, youth score slightly worse than adults.
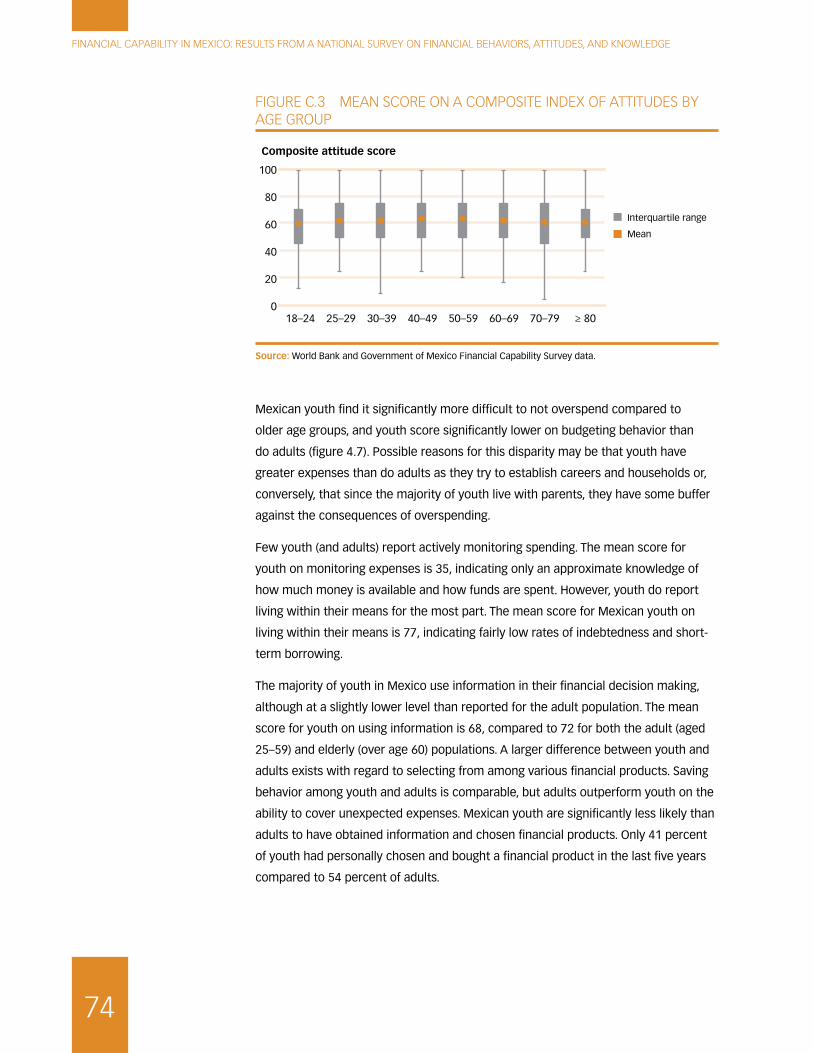
FINANCIAL CAPABILITY IN MEXICO: RESULTS FROM A NATIONAL SURVEY ON FINANCIAL BEHAVIORS, ATTITUDES, AND KNOWLEDGE
74
FIGURE C.3 MEAN SCORE ON A COMPOSITE INDEX OF ATTITUDES BY AGE GROUP
Composite attitude score
0
20
40
60
80
100
18–24 25–29 30–39 40–49 50–59 60–69 70–79 ≥ 80
Mean
Interquartile range
Source: World Bank and Government of Mexico Financial Capability Survey data.
Mexican youth find it significantly more difficult to not overspend compared to
older age groups, and youth score significantly lower on budgeting behavior than
do adults (figure 4.7). Possible reasons for this disparity may be that youth have
greater expenses than do adults as they try to establish careers and households or,
conversely, that since the majority of youth live with parents, they have some buffer
against the consequences of overspending.
Few youth (and adults) report actively monitoring spending. The mean score for
youth on monitoring expenses is 35, indicating only an approximate knowledge of
how much money is available and how funds are spent. However, youth do report
living within their means for the most part. The mean score for Mexican youth on
living within their means is 77, indicating fairly low rates of indebtedness and short-
term borrowing.
The majority of youth in Mexico use information in their financial decision making,
although at a slightly lower level than reported for the adult population. The mean
score for youth on using information is 68, compared to 72 for both the adult (aged
25–59) and elderly (over age 60) populations. A larger difference between youth and
adults exists with regard to selecting from among various financial products. Saving
behavior among youth and adults is comparable, but adults outperform youth on the
ability to cover unexpected expenses. Mexican youth are significantly less likely than
adults to have obtained information and chosen financial products. Only 41 percent
of youth had personally chosen and bought a financial product in the last five years
compared to 54 percent of adults.

75
APPENDIX D
Methodology to analyze linkages between financial capability and financial inclusion
D.1 RELATIONSHIP BETWEEN FINANCIAL KNOWLEDGE AND FINANCIAL CAPABILITY
To analyze the relationship between financial knowledge and financial capability,
table D.1 displays the results from 10 separate ordinary least squares regressions of
the following form:
FinancialCapabilityi,m = + FinancialKnowledgei,m + Xi,m + Zm + i,m (1)
where FinancialCapability is 1 of 10 measures of financial capability (see full list in
table D.1), FinancialKnowledge is the financial knowledge score (see definition in
table D.5), X is a set of individual control variables (see table D.7), and Z is a set of
municipality control variables (see table D.8). The control variables are included to
isolate the relationship between financial knowledge and capability that is not driven
by these other variables. The standard errors of the regression are clustered at the
municipality level.
The numbers reported in the first row of table D.1 are the coefficients from the 10
regressions. That is, they show the partial correlations between financial knowledge
and each measure of capability after controlling for personal and municipality char-
acteristics that could be driving the relationship. The sizes of the correlations repre-
sent the increase in each financial capability measure for a one-point increase in the
financial knowledge score (as described below, the financial knowledge score runs
from 0 to 8, representing the number of correct answers to five financial knowledge
questions, while the financial capability measures are scaled from 0 to 100).
Figure 6.1 in chapter 6 graphically displays the results in table D.1. The numbers
plotted in this figure show by how much each financial capability measure increases
when the financial knowledge score increases by one standard deviation (the stan-
dard deviation of this score is 1.8), where the increase in the capability measure is
scaled to represent percentage points of the standard deviation of the capability
measure.

FINANCIAL CAPABILITY IN MEXICO: RESULTS FROM A NATIONAL SURVEY ON FINANCIAL BEHAVIORS, ATTITUDES, AND KNOWLEDGE
76
(continued)
TABLE D.1 RELATIONSHIP BETWEEN FINANCIAL KNOWLEDGE AND FINANCIAL CAPABILITY
VARIABLE
DEPENDENT VARIABLE: FINANCIAL CAPABILITY
BUDGETINGMONITORING
EXPENSESUSING INFOR-
MATIONNOT OVER-SPENDING
LIVING WITHIN MEANS
Financial knowledge score 1.536 (0.987) 0.772 (0.801) 0.530 (0.472) 2.712*** (0.619) 1.359*** (0.479)
Female 4.910*** (1.857) 1.592 (1.499) 0.536 (1.187) 1.166 (1.190) 1.238 (0.922)
Middle aged (35−39) 2.433 (1.726) −0.481 (1.657) 0.989 (1.137) 4.653*** (1.532) 1.444 (1.274)
Old age (60+) 4.953* (2.947) 5.098** (2.422) 2.694 (1.877) 6.814*** (2.287) 5.330*** (1.296)
Married 1.017 (2.026) −3.244* (1.784) −0.335 (1.124) −1.123 (1.510) 1.178 (0.968)
Secondary education 1.376 (2.525) 1.580 (2.114) −2.384 (1.533) -4.842*** (1.623) −1.706 (1.061)
Higher education 7.205*** (2.713) 1.625 (2.130) −0.865 (1.721) −8.145*** (2.126) 1.390 (1.323)
Formal job 8.980*** (3.157) 5.984** (2.615) 2.770 (2.027) −5.425** (2.533) −0.227 (1.784)
Employed −1.572 (2.300) 0.281 (2.171) −2.571 (1.748) −1.526 (1.963) −1.788 (1.372)
Medium income 1.803 (2.278) 5.109** (2.460) 3.293* (1.703) 3.056* (1.739) 2.708*** (0.955)
High income 9.038** (3.820) 19.801*** (3.026) 10.272*** (1.992) 0.695 (2.613) 1.981 (1.857)
Household questions 16.431*** (4.075) 13.201*** (3.344) 10.883*** (2.682) −1.268 (3.167) −2.618 (2.082)
Rural location −8.353* (4.902) −1.583 (4.051) −3.475 (2.439) −0.682 (3.157) 2.733* (1.657)
Bank branches/10,000 adults −0.240 (2.167) −2.699 (1.724) −1.102 (1.213) −3.544** (1.747) −0.605 (0.939)
Correspondents/10,000 adults −1.808 (1.319) −1.742* (0.905) −0.731 (0.605) 1.415 (1.055) 0.765* (0.441)
GDP per capita (million pesos) 34.657 (78.120) 33.744 (45.979) 16.395 (30.938) −59.161 (44.693) −20.463 (26.396)
Central West region −7.784 (7.116) 2.893 (3.752) 7.415*** (2.856) 8.854* (4.594) 1.052 (2.502)
Northeast region −4.204 (3.766) 8.192* (4.395) −0.214 (2.999) 0.397 (4.655) 0.908 (3.193)
Northwest region 6.144 (7.775) 8.395 (6.723) 10.005** (4.189) 29.342*** (5.044) −2.311 (3.061)
South/Southeast region −2.388 (3.800) −6.031* (3.597) 1.890 (2.654) 9.633*** (3.279) −0.072 (2.304)
Constant 26.413*** (8.784) 23.678*** (7.015) 57.525*** (4.788) 56.806*** (4.908) 69.899*** (3.864)
R−squared 0.082 0.125 0.073 0.142 0.045
Observations 1,834 1,834 1,834 1,834 1,834

APPENDIX D. METHODOLOGY TO ANALYZE LINKAGES BETWEEN FINANCIAL CAPABILITY AND FINANCIAL INCLUSION
77
TABLE D.1 RELATIONSHIP BETWEEN FINANCIAL KNOWLEDGE AND FINANCIAL CAPABILITY (continued)
VARIABLE
DEPENDENT VARIABLE: FINANCIAL CAPABILITY
COVERING UNEXPECTED
EXPENSES SAVING
ATTITUDE TOWARD THE
FUTURENOT BEING IMPULSIVE
ACHIEVEMENT ORIENTATION
Financial knowledge score 1.114* (0.590) 2.583*** (0.629) 1.123** (0.505) 1.739*** (0.638) 1.744*** (0.387)
Female 1.830 (1.325) 2.272 (1.442) −1.169 (1.179) 1.860 (1.370) −1.259 (1.032)
Middle aged (35–39) 1.850 (1.472) −0.517 (1.924) 0.448 (1.437) 5.233*** (1.824) −0.182 (1.004)
Old age (60+) 2.269 (2.801) 2.229 (3.067) −2.860 (2.003) 7.556*** (2.366) −0.760 (1.748)
Married 1.226 (1.365) 1.663 (1.855) 0.340 (1.362) 1.893 (1.488) 1.261 (1.055)
Secondary education 1.340 (1.972) 0.339 (1.907) 3.344** (1.641) 0.609 (1.729) −0.783 (1.445)
Higher education 1.938 (2.536) 2.610 (2.427) 4.526** (2.052) 3.413* (1.958) 0.031 (1.713)
Formal job −0.094 (2.533) 4.716 (2.895) 0.350 (2.294) −3.198 (2.500) 2.189 (2.150)
Employed 3.170 (2.046) −2.234 (2.460) −2.396 (1.841) −1.150 (1.990) −1.516 (1.825)
Medium income 2.519 (1.912) 8.468*** (2.434) 3.466** (1.545) 1.600 (1.724) 3.746*** (1.280)
High income 13.961*** (2.212) 20.515*** (2.294) 3.571 (2.555) 3.606 (2.678) 5.775*** (1.811)
Household questions 12.411*** (3.490) 11.519*** (3.124) 3.690 (2.747) 1.415 (3.704) 4.723** (2.091)
Rural location 4.461 (2.736) −3.339 (3.330) −0.220 (2.603) 2.351 (2.887) −2.007 (2.226)
Bank branches/10,000 adults 0.589 (1.429) −1.534 (1.703) −0.538 (1.395) −1.331 (1.294) −2.215 (1.351)
Correspondents/10,000 adults −0.842 (0.823) − 1.337 (0.813) 1.121* (0.637) 1.156* (0.604) 0.594 (0.533)
GDP per capita (million pesos) −7.433 (41.997) −3.762 (56.610) −90.654** (42.47) −65.438* (38.549) 40.333* (23.652)
Central West region − 6.291* (3.487) −2.639 (3.991) −10.812***(3.466) 6.067 (4.017) 2.192 (2.545)
Northeast region 5.416 (3.959) 6.961 (4.417) 1.713 (3.995) −6.153* (3.729) −10.092***(3.120)
Northwest region −11.252** (5.592 31.576*** (8.202) 3.232 (5.774) 4.544 (4.755) 13.930*** (2.560)
South/Southeast region −2.687 (3.459) −1.488 (4.141) −2.430 (3.603) 2.072 (3.327) 2.529 (2.015)
Constant 39.851*** (5.746) 28.977*** (6.143) 26.738*** (5.174) 41.938*** (6.385) 71.041*** (3.900)
R−squared 0.078 0.160 0.066 0.056 0.112
Observations 1,834 1,834 1,834 1,834 1,834
Source: World Bank and Government of Mexico Financial Capability Survey data.
Note: Robust standard errors, clustered at the municipality level, in parentheses. Statistical significance levels: * 10 percent, ** 5 percent, *** 1 percent.

FINANCIAL CAPABILITY IN MEXICO: RESULTS FROM A NATIONAL SURVEY ON FINANCIAL BEHAVIORS, ATTITUDES, AND KNOWLEDGE
78
D.2 RELATIONSHIP BETWEEN FINANCIAL KNOWLEDGE, FINANCIAL CAPABILITY, AND PRODUCT USAGE
To analyze the relationship between financial knowledge, financial capability, and
product usage, table 6.1 in chapter 6 displays the results from 66 separate ordinary
least squares regressions (6 product usage measures multiplied by 11 financial
knowledge or capability measures) of the following form:
ProductUsagei,m = + FinancialCapabilityi,m + Xi,m + Zm + i,m (2)
where ProductUsage is a dummy variable indicating whether the individual i in
municipality m reports having the financial product (see full list of product usage
dummy variables in table D.6), FinancialCapability is a measure of financial knowl-
edge or capability (see full list in table D.5), X is a set of individual control variables
(see table D.7), and Z is a set of municipality control variables (see table D.8). The
control variables are included to isolate the relationship between financial capability
and product usage that is not driven by these other variables. The standard errors of
the regression are clustered at the municipality level.
The numbers reported in table 6.1 are the coefficients from the 66 regressions.
Due to space constraints, not all coefficients from all 66 regressions are reported,
but tables D.2 and D.3 display the full regressions for the financial knowledge score
and the financial capability index. The first row of coefficients in each of these tables
corresponds to the coefficients reported in in table 6.1. The remaining rows show the
coefficients that are not reported in the main text.
Figure 6.2 in chapter 6 plots the percentage of individuals with low financial educa-
tion who report having each financial product, where low financial capability is
defined as having a financial capability index below the median. The bars for indi-
viduals with high financial capability are computed as the percentage of individuals
with low financial education who report having each financial product plus the coef-
ficient from the following regression multiplied by 100 (for each financial product):
ProductUsagei,m = + HighFinancialCapabilityi,m + Xi,m + Zm + i,m (3)
where all variables are defined as in equation (2), except that HighFinancialCapability
is an indicator variable for the individual having a financial capability index above the
median. The standard errors of the regression are clustered at the municipality level.
The coefficient in equation (3) represents the difference in product usage across
individuals with high and low financial capability, after controlling for individual and
municipality characteristics that could be driving this difference.

APPENDIX D. METHODOLOGY TO ANALYZE LINKAGES BETWEEN FINANCIAL CAPABILITY AND FINANCIAL INCLUSION
79
TABLE D.2 FINANCIAL KNOWLEDGE AND USE OF FINANCIAL PRODUCTS
VARIABLE
DEPENDENT VARIABLE: DUMMY VARIABLE INDICATING WHETHER THE INDIVIDUAL HAS/PARTICIPATES IN A
BANK ACCOUNT CREDIT CARD BANK LOAN TANDA
PAWN SHOP LOAN
LOAN FROM FAMILY OR FRIENDS
Fin. knowledge
score
0.029*** (0.007) 0.017** (0.008) 0.006 (0.005) 0.000 (0.005) 0.005 (0.004) −0.013 (0.009)
Female −0.003 (0.021) −0.008 (0.018) −0.025* (0.015) 0.055*** (0.017) −0.020 (0.014) −0.011 (0.017)
Middle aged
(35−39)
0.089*** (0.019) 0.076*** (0.018) 0.048*** (0.015) −0.006 (0.016) 0.007 (0.018) −0.011 (0.023)
Old age (60+) 0.142*** (0.025) 0.081*** (0.028) 0.039* (0.021) −0.030 (0.022) −0.010 (0.022) −0.080** (0.033)
Married −0.008 (0.017) 0.008 (0.016) −0.016 (0.014) 0.009 (0.018) −0.004 (0.012) 0.007 (0.021)
Secondary ed. 0.020 (0.019) 0.055*** (0.019) 0.045** (0.019) 0.038* (0.020) 0.031* (0.017) 0.003 (0.031)
Higher ed. 0.108*** (0.026) 0.106*** (0.026) 0.051** (0.021) 0.001 (0.020) −0.007 (0.021) −0.005 (0.038)
Formal job 0.094*** (0.028) 0.100*** (0.033) 0.060** (0.030) −0.029 (0.023) −0.057** (0.027) −0.070* (0.036)
Employed −0.046** (0.021) −0.024 (0.022) −0.019 (0.019) −0.004 (0.020) 0.039* (0.022) 0.022 (0.028)
Med. income 0.080*** (0.020) 0.014 (0.017) 0.034** (0.015) −0.018 (0.021) 0.004 (0.016) −0.047 (0.029)
High income 0.206*** (0.034) 0.191*** (0.037) 0.105*** (0.029) 0.010 (0.026) −0.013 (0.022) −0.098** (0.038)
HH questions 0.017 (0.034) 0.045 (0.029) 0.048* (0.025) 0.064*** (0.021) −0.029 (0.033) 0.007 (0.051)
Rural location −0.013 (0.032) −0.017 (0.040) −0.037 (0.030) 0.008 (0.023) −0.033* (0.019) 0.025 (0.040)
Branches/
10,000 adults
−0.004 (0.017) 0.016 (0.015) 0.011 (0.015) −0.007 (0.013) −0.002 (0.012) −0.033 (0.022)
Corr./10,000
adults
0.012 (0.009) 0.014 (0.010) −0.006 (0.006) 0.010 (0.006) −0.005 (0.005) 0.005 (0.011)
GDP per capita
(million pesos)
0.375 (0.554) 0.449 (0.561) 0.290 (0.271) 0.367 (0.250) 0.219 (0.304) 0.141 (0.536)
Central West 0.071* (0.043) 0.103** (0.048) 0.012 (0.024) 0.050 (0.032) −0.028 (0.030) 0.037 (0.043)
Northeast 0.068 (0.046) −0.013 (0.034) 0.025 (0.041) −0.033 (0.031) −0.002 (0.030) 0.022 (0.053)
Northwest −0.028 (0.071) −0.037 (0.077) 0.024 (0.072) −0.088** (0.038) 0.084 (0.052) 0.196** (0.079)
South/SE 0.063** (0.025) 0.052 (0.034) 0.057** (0.027) 0.021 (0.027) −0.012 (0.027) 0.056 (0.044)
Constant −0.244*** (0.069) −0.231*** (0.071) −0.079 (0.049) −0.012 (0.037) 0.118** (0.048) 0.322*** (0.077)
R−squared 0.182 0.184 0.072 0.031 0.020 0.039
Observations 1,834 1,834 1,834 1,834 1,834 1,834
Source: World Bank and Government of Mexico Financial Capability Survey data.
Note: Robust standard errors, clustered at the municipality level, in parentheses. Statistical significance levels: * 10 percent, ** 5 percent, *** 1 percent.

FINANCIAL CAPABILITY IN MEXICO: RESULTS FROM A NATIONAL SURVEY ON FINANCIAL BEHAVIORS, ATTITUDES, AND KNOWLEDGE
80
TABLE D.3 FINANCIAL CAPABILITY AND USE OF FINANCIAL PRODUCTS
VARIABLE
DEPENDENT VARIABLE: DUMMY VARIABLE INDICATING WHETHER THE INDIVIDUAL HAS/PARTICIPATES IN A
BANK ACCOUNT CREDIT CARD BANK LOAN TANDA
PAWN SHOP LOAN
LOAN FROM FAMILY OR FRIENDS
Financial capa-
bility index
0.056*** (0.008) 0.037*** (0.010) 0.009 (0.006) −0.005 (0.007) −0.014** (0.006) −0.033*** (0.011)
Female −0.012 (0.020) −0.007 (0.017) −0.023 (0.015) 0.061*** (0.017) −0.012 (0.013) −0.002 (0.020)
Middle aged
(35−39)
0.074*** (0.019) 0.066*** (0.016) 0.042*** (0.015) −0.004 (0.015) 0.010 (0.017) 0.000 (0.022)
Old age (60+) 0.119*** (0.024) 0.066** (0.027) 0.029 (0.019) −0.024 (0.021) −0.008 (0.021) −0.065* (0.033)
Married −0.006 (0.016) 0.005 (0.016) −0.012 (0.014) 0.013 (0.017) −0.002 (0.012) 0.016 (0.022)
Secondary ed. 0.027 (0.018) 0.054*** (0.017) 0.042** (0.018) 0.038* (0.020) 0.031** (0.015) −0.011 (0.029)
Higher ed. 0.116*** (0.025) 0.101*** (0.026) 0.050** (0.021) 0.005 (0.017) −0.000 (0.020) −0.000 (0.036)
Formal job 0.091*** (0.026) 0.093*** (0.033) 0.051* (0.029) −0.026 (0.022) −0.053** (0.026) −0.068* (0.036)
Employed −0.042** (0.020) −0.018 (0.021) −0.013 (0.018) −0.003 (0.019) 0.040** (0.020) 0.029 (0.029)
Med. income 0.061*** (0.020) 0.004 (0.017) 0.036** (0.014) −0.013 (0.020) 0.013 (0.016) −0.037 (0.031)
High income 0.156*** (0.032) 0.167*** (0.038) 0.102*** (0.027) 0.021 (0.028) 0.007 (0.021) −0.073* (0.039)
HH questions −0.024 (0.034) 0.012 (0.028) 0.038 (0.025) 0.071*** (0.020) −0.017 (0.031) 0.044 (0.051)
Rural location −0.005 (0.033) −0.014 (0.039) −0.038 (0.030) 0.007 (0.022) −0.038** (0.019) 0.020 (0.039)
Branches/
10,000 adults
0.004 (0.016) 0.016 (0.014) 0.009 (0.014) −0.006 (0.013) −0.006 (0.012) −0.034 (0.023)
Corr./10,000
adults
0.015 (0.009) 0.015 (0.010) −0.005 (0.006) 0.008 (0.007) −0.004 (0.005) 0.004 (0.012)
GDP per capita
(million pesos)
0.431 (0.551) 0.511 (0.540) 0.256 (0.253) 0.478** (0.241) 0.190 (0.309) 0.245 (0.590)
Central West 0.076* (0.043) 0.093** (0.047) 0.012 (0.023) 0.043 (0.029) −0.031 (0.029) 0.038 (0.044)
Northeast 0.050 (0.041) −0.022 (0.031) 0.017 (0.038) −0.033 (0.031) −0.005 (0.031) 0.020 (0.055)
Northwest −0.123 (0.077) −0.091 (0.079) 0.004 (0.070) −0.086** (0.036) 0.089 (0.055) 0.236*** (0.078)
South/SE 0.067*** (0.024) 0.053* (0.031) 0.052** (0.026) 0.018 (0.025) −0.012 (0.027) 0.044 (0.044)
Constant −0.401*** (0.076) −0.332*** (0.080) −0.094 (0.059) −0.001 (0.050) 0.198*** (0.059) 0.405*** (0.098)
R−squared 0.195 0.190 0.069 0.032 0.023 0.042
Observations 1,935 1,935 1,935 1,935 1,935 1,935
Source: World Bank and Government of Mexico Financial Capability Survey data.
Note: Robust standard errors, clustered at the municipality level, in parentheses. Statistical significance levels: * 10 percent, ** 5 percent, *** 1 percent.

APPENDIX D. METHODOLOGY TO ANALYZE LINKAGES BETWEEN FINANCIAL CAPABILITY AND FINANCIAL INCLUSION
81
Tables D.4 displays the results from three separate ordinary least squares regres-
sions (one for each formal financial product) of the following form:
ProductUsagei,m = + HighFinancialCapabilityi,m + 1HighFinancialCapabilityi,m ×
BankBranchesm + 2LowFinancialCapabilityi,m × BankBranchesm +
1HighFinancialCapabilityi,m × Correspondentsm + 2LowFinancialCapabilityi,m ×
Correspondentsm + Xi,m + Zm + i,m (4)
where all variables are defined as in equation (2), but instead of including control
variables for bank branches per 10,000 adults or correspondents per 10,000 adults,
the regression includes four interaction terms between (1) number of bank branches
per 10,000 adults in the municipality times an indicator variable for the individual
having high financial capability or knowledge, (2) number of bank branches per
10,000 adults in the municipality times an indicator variable for the individual having
low financial capability or knowledge, (3) number of correspondents per 10,000
adults in the municipality times an indicator variable for the individual having high
financial capability or knowledge, and (4) number of correspondents per 10,000
adults in the municipality times an indicator variable for the individual having low
financial capability or knowledge. The standard errors of the regression are clustered
at the municipality level.
Table D.4 reports the coefficients 1, 2, 3, and 4 that represent the partial correla-
tion between bank branches or correspondents and financial product usage for indi-
viduals with high or low financial capability (or knowledge), respectively.

FINANCIAL CAPABILITY IN MEXICO: RESULTS FROM A NATIONAL SURVEY ON FINANCIAL BEHAVIORS, ATTITUDES, AND KNOWLEDGE
82
TABLE D.4 PARTIAL CORRELATIONS BETWEEN FINANCIAL ACCESS POINTS AND USE OF FINANCIAL PRODUCTS, BY FINANCIAL CAPABILITY AND FINANCIAL KNOWLEDGE LEVELS
DEPENDENT VARIABLE: DUMMY VARIABLE INDICATING WHETHER THE INDIVIDUAL HAS A
BANK ACCOUNT CREDIT CARD BANK LOAN
By financial capability level
Bank branches per 10,000 adults ×
Individuals with high financial capability
0.011 (0.027) 0.041 (0.026) 0.021 (0.021)
Bank branches per 10,000 adults ×
Individuals with low financial capability
−0.013 (0.011) −0.016 (0.011) −0.005 (0.013)
Banking correspondents per 10,000 adults
× Individuals with high financial capability
0.026* (0.016) 0.032** (0.014) 0.004** (0.009)
Banking correspondents per 10,000 adults
× Individuals with low financial capability
0.005 (0.007) 0.002 (0.008) −0.004 (0.007)
By financial knowledge level
Bank branches per 10,000 adults ×
Individuals with high financial capability
−0.013 (0.024) 0.021 (0.022) −0.001 (0.021)
Bank branches per 10,000 adults ×
Individuals with low financial capability
0.003 (0.015) 0.009 (0.017) 0.023 (0.017)
Banking correspondents per 10,000 adults
× Individuals with high financial capability
0.029** (0.014) 0.025* (0.013) −0.008 (0.007)
Banking correspondents per 10,000 adults
× Individuals with low financial capability
−0.003 (0.007) 0.003 (0.009) −0.004 (0.008)
Sources: Consejo Nacional de Inclusión Financiera 2011; World Bank and Government of Mexico Financial Capability Survey data (see below for details and sources of control variables).
Note: Regressions include the following control variables (see tables below for definitions): female, middle-aged, old age, married, secondary education, higher education, formal job, employed, medium income, high income, household questions, rural location, bank branches per 10,000 adults, corre-spondents per 10,000 adults, GDP per capita (million pesos), and region dummy variables. Robust standard errors in parentheses. Statistical significance levels: * 10 percent, ** 5 percent, *** 1 percent.

APPENDIX D. METHODOLOGY TO ANALYZE LINKAGES BETWEEN FINANCIAL CAPABILITY AND FINANCIAL INCLUSION
83
TABLE D.5 MEXICAN FINANCIAL LITERACY SURVEY VARIABLE DEFINITIONS: FINANCIAL KNOWLEDGE AND FINANCIAL CAPABILITY
VARIABLE DEFINITION
Financial knowledge index Number of correct answers to eight financial
knowledge questions (index from 0 to 8)
Nine components of financial capability
(budgeting, monitoring expenses, using
information, not overspending, covering
unexpected expenses, saving, attitude
toward the future, not impulsive, achieve-
ment orientation)
As defined in previous chapters (scale from 0
to 100)
Financial capability index Simple average of nine financial capability
components listed above (scale from 0 to 100)
TABLE D.6 MEXICAN FINANCIAL LITERACY SURVEY VARIABLE DEFINITIONS: FINANCIAL PRODUCT USAGE
VARIABLE DEFINITION
Bank
account
Based on question d_1_6
Dummy variable indicating whether the respondent reports having a “Cuenta
bancaria (o con otra institución financiera)”
Credit card Based on question d_1_7
Dummy variable indicating whether the respondent reports having a “Tarjeta
de crédito”
Bank loan Based on questions d_1_5
Dummy variable indicating whether the respondent reports having a “Crédito
personal (bancario) o crédito nomina”
Tanda Based on question d_1_10
Dummy variable indicating whether the respondent reports having “Tandas”
Pawn shop Based on question d_1_9
Dummy variable indicating whether the respondent reports having “Empeño”
Loan from
family or
friends
Based on question d_1_11
Dummy variable indicating whether the respondent reports having “Prés-
tamos de familiares o amigos”
FINANCIAL CAPABILITY IN MEXICO: RESULTS FROM A NATIONAL SURVEY ON FINANCIAL BEHAVIORS, ATTITUDES, AND KNOWLEDGE
84
TABLE D.7 MEXICAN FINANCIAL LITERACY SURVEY VARIABLE DEFINITIONS: INDIVIDUAL CONTROL VARIABLES
VARIABLE DEFINITION
Female Based on question r_2
Dummy variable indicating whether the individual is female
Age Based on question r_4
Two dummy variables indicating whether the individual is middle-aged (35–59) or old (over 59); young (18–34) is
the omitted category in the regressions
Marital status Based on question f_2
Dummy variable indicating whether the individual is married
Education Based on question r_8
Two dummy variables indicating whether the individual has completed secondary or higher education; primary
education or less is the omitted category
Employment Based on question f_5
One dummy variable indicating whether the individual works (either as an employee or self-employed); another
dummy variable indicating whether the individual has a formal sector job
Income Based on question f_23_mx
Two dummy variables indicating whether the household has a medium (Mex$3,000—Mex$5,000) or high
(> Mex$5,000) income level; low income (< Mex$3,000) is the omitted category
Survey
questions
Based on question a_6
Dummy variable indicating whether the individual answered questions about the financial products that he or
she personally uses or that the household uses
Rural location Dummy variable indicating whether the individual lives in a rural area
Region Four dummy variables indicating whether the individual lives in the Central West, Northeast, Northwest, or
South/Southeast of Mexico; Central Mexico is the omitted category
TABLE D.8 MEXICAN FINANCIAL LITERACY SURVEY MUNICIPAL-LEVEL VARIABLE DEFINITIONS AND SOURCES
VARIABLE DEFINITION SOURCE
GDP per capita Value added (sum across all industries) divided by total
population (million pesos)
Value added from INEGI
2009; population from INEGI
2005
Bank branches per 10,000 adults Number of commercial bank branches divided by number of
adults living in the municipality times 10,000
Consejo Nacional de Inclu-
sión Financiera 2011
Correspondents per 10,000 adults Number of banking correspondents divided by number of
adults living in the municipality times 10,000

85
APPENDIX E
Literature review: financial knowledge, capability, and behavior
A number of studies have investigated the relationship between financial knowledge
and financial behavior. Using data from the United States, Lusardi and Tufano (2009)
find that individuals who have low measured levels of financial knowledge tend to
pay minimum balances on credit cards, incur late fees on cards, and use informal
sources of credit. Stango and Zinman (2009) show that people who make mistakes
in interest and future value calculations tend to borrow more and save less. Lusardi
and Mitchell (2009) illustrate that people with low levels of financial knowledge think
less about retirement and that most of them have not planned for retirement at
all. A survey of Russian households shows that financial knowledge is significantly
and positively related to retirement planning involving private pension funds and
schemes (Klapper and Panos 2011). And in Mexico, Hastings and Tejeda-Ashton
(2008) conducted a survey that reveals that less knowledgeable individuals tend to
choose mutual pension funds with higher fees.
These studies tend to measure financial literacy based on questions that test knowl-
edge of the time value of money (inflation), interest rates, compounding, and risk
diversification, although the specific measures used vary from study to study (see
also Xu and Zia 2012 for a discussion of different measures of financial knowledge).
Most studies do not aim to measure financial capability in addition to financial
knowledge, and thus there is little existing evidence about the relationship between
financial capability and financial behavior.
One caveat with the studies mentioned above is that these results are not neces-
sarily causal. They show a correlation between proxies for financial knowledge and
outcomes of interest, but these correlations may simply reflect unobserved charac-
teristics of individuals such as their numeracy, ability, parental background, or other
such features. Although some studies try to measure these characteristics and try to
account for them in the analysis, some of these features may not be measurable and
can thus potentially bias the results.
A growing literature tries to address this issue by relying on quasi-experimental or
experimental variation in the provision of financial education programs to measure
the impact of financial knowledge on financial behavior. The context of these studies

FINANCIAL CAPABILITY IN MEXICO: RESULTS FROM A NATIONAL SURVEY ON FINANCIAL BEHAVIORS, ATTITUDES, AND KNOWLEDGE
86
varies widely—for example, in terms of the economic environment and the type of
individuals targeted through the financial education programs.
Compulsory financial education classes taught in high schools have been the subject
of a number of studies. Bernheim, Garrett, and Maki (2001) use exogenous varia-
tion in high school financial education mandates across U.S. states to show that
students exposed to financial education classes save more as adults. However, Cole
and Shastry (2008) cast doubt on these findings, showing that they are not robust
to controlling for state-fixed effects and examining effects over time. Shorter-term
evidence comes from Bruhn et al. (2013), who conducted a randomized experi-
ment providing financial education in Brazilian public high schools. They find positive
effects on financial knowledge, attitudes, and behaviors, and an increase in savings
rates. These impacts are small in absolute magnitude: a 3 percentage point increase
in knowledge, and a 1 percentage point increase in savings. In Germany, Lührmann,
Serra-Garcia, and Winter (2012) find teenagers given financial literacy training show
increased interest in and knowledge of financial matters, and save more in a hypo-
thetical task, but they do not measure actual savings.
Other studies have focused on providing financial education to working adults, recog-
nizing the differences in households’ financial needs and exposure across developed
and developing countries. The literature in developed countries tends to study the
impact of financial education on planning for retirement or investment portfolio
choices. Duflo and Saez (2011) show that participation in seminars discussing retire-
ment savings leads to an increase in retirement plan participation.
In the developing country context, impact evaluations of financial literacy training
have studied the unbanked, insurance take-up, and migrants. One of the first papers
to examine the impact of financial education in a developing country was by Cole,
Sampson, and Zia (2011). The authors implemented a field experiment in Indonesia
where they offered randomly selected unbanked households a financial education
course geared toward opening a bank savings account. They find that the financial
education course had no effect on the likelihood of opening a bank savings account
in the full sample, but it had modest effects for uneducated and financially illiterate
households. Cai (2011) used a randomized experiment to show that farmers in rural
China are more likely to take up crop insurance and become less price sensitive after
attending financial education sessions.
Gibson, McKenzie, and Zia (2012); Doi, McKenzie, and Zia (2012); and Seshan and
Yang (2012) analyze how providing information and financial education affects
the behavior of migrants and their households. Gibson, McKenzie, and Zia (2012)
work with migrants in New Zealand and Australia, and find that financial educa-
tion increases knowledge about remittance transaction costs but does not lead
to changes in the amount of remittances sent or use of the cheapest remittance

APPENDIX E. LITERATURE REVIEW: FINANCIAL KNOWLEDGE, CAPABILITY, AND BEHAVIOR
87
method. Using a sample of Indonesian migrants, Doi, McKenzie, and Zia (2012) find
that impacts on financial knowledge, behavior, and savings are largest when both the
migrants and their families receive financial education. The results show that finan-
cial education can have large effects when provided at a teachable moment, but that
this impact varies according to who is receiving the training. Seshan and Yang (2012)
find that Indian migrants in Qatar increase savings after financial education training,
but only if they had low financial knowledge to begin with.
Overall, the literature thus finds a positive relationship between financial knowl-
edge and use of formal financial products. Impact evaluations of financial education
courses suggest that this relationship is, at least in part, causal. However, these
evaluations also highlight that financial education courses often only lead to behavior
change for certain groups of individuals—such as those who had low knowledge to
begin with—but not for others. In addition, the measured impacts are often small,
and participation rates in financial education courses tend to be low. The small
effects and low participation rates suggest that classroom-style workshops may not
be the best way of conveying financial education to adults, who may not have the
time or motivation to attend such workshops. The literature is now moving toward
exploring whether innovative channels for providing financial education can affect
behavior. Ongoing studies in India, Peru, South Africa, and the United States (among
others) are testing whether the provision of information via videos, radio, mass
media, or video games is effective in improving individuals’ financial decisions (see,
e.g., Berg and Zia 2013).
Finally, while literature has mostly focused on financial knowledge so far, it has also
touched on concepts related to specific financial capability. Some of the financial
education courses studied through impact evaluations try to teach techniques to
improve budgeting and monitoring of expenses. For example, Bruhn et al. (2013) find
that a comprehensive financial education program in Brazilian high schools leads to
an increase in the percentage of students and parents who make a list of expenses.
The program also increased saving rates. Other studies have examined the relation-
ship between time preferences and saving behavior. Brown, Chua, and Camerer
(2009) conducted a behavioral laboratory experiment and find that individuals with
present-biased preferences have a tendency to overspend. Ashraf, Karlan, and Yin
(2006) show that commitment savings accounts can help increase savings for indi-
viduals with present-biased preferences. However, more research is needed to inves-
tigate the relationship between different components of financial capability and the
use of different financial products.

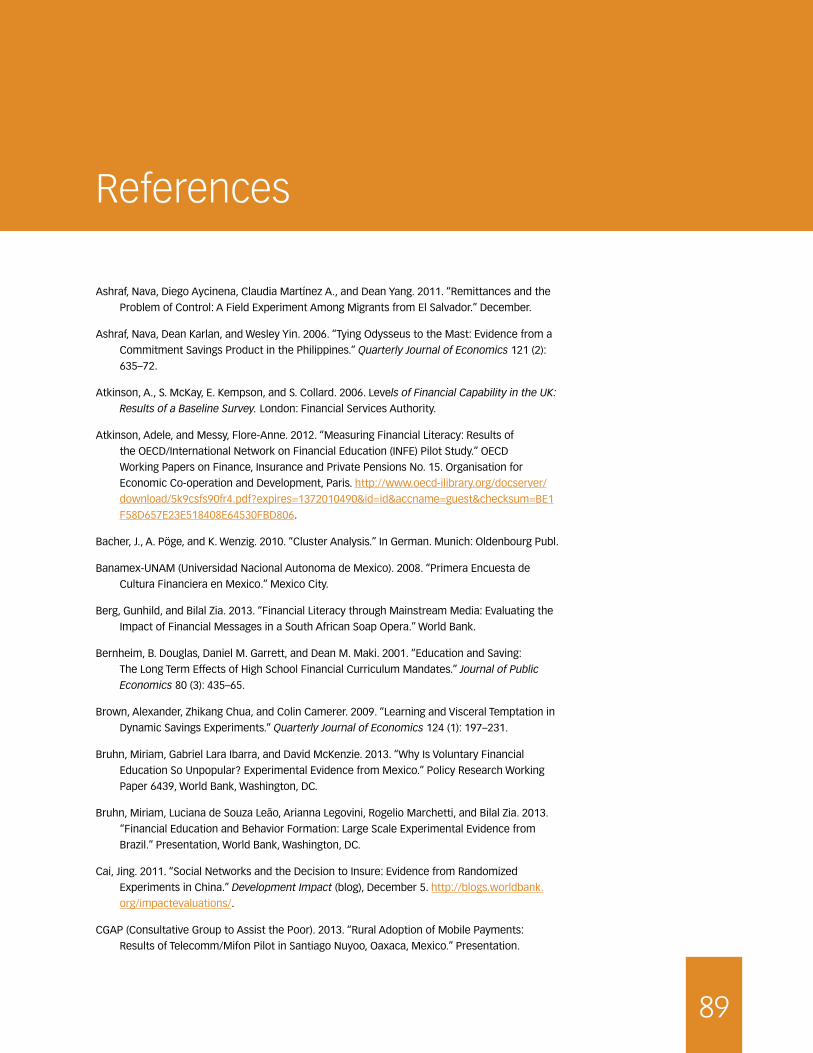
89
References
Ashraf, Nava, Diego Aycinena, Claudia Martínez A., and Dean Yang. 2011. “Remittances and the
Problem of Control: A Field Experiment Among Migrants from El Salvador.” December.
Ashraf, Nava, Dean Karlan, and Wesley Yin. 2006. “Tying Odysseus to the Mast: Evidence from a
Commitment Savings Product in the Philippines.” Quarterly Journal of Economics 121 (2):
635–72.
Atkinson, A., S. McKay, E. Kempson, and S. Collard. 2006. Levels of Financial Capability in the UK:
Results of a Baseline Survey. London: Financial Services Authority.
Atkinson, Adele, and Messy, Flore-Anne. 2012. “Measuring Financial Literacy: Results of
the OECD/International Network on Financial Education (INFE) Pilot Study.” OECD
Working Papers on Finance, Insurance and Private Pensions No. 15. Organisation for
Economic Co-operation and Development, Paris. http://www.oecd-ilibrary.org/docserver/
download/5k9csfs90fr4.pdf?expires=1372010490&id=id&accname=guest&checksum=BE1
F58D657E23E518408E64530FBD806.
Bacher, J., A. Pöge, and K. Wenzig. 2010. “Cluster Analysis.” In German. Munich: Oldenbourg Publ.
Banamex-UNAM (Universidad Nacional Autonoma de Mexico). 2008. “Primera Encuesta de
Cultura Financiera en Mexico.” Mexico City.
Berg, Gunhild, and Bilal Zia. 2013. “Financial Literacy through Mainstream Media: Evaluating the
Impact of Financial Messages in a South African Soap Opera.” World Bank.
Bernheim, B. Douglas, Daniel M. Garrett, and Dean M. Maki. 2001. “Education and Saving:
The Long Term Effects of High School Financial Curriculum Mandates.” Journal of Public
Economics 80 (3): 435–65.
Brown, Alexander, Zhikang Chua, and Colin Camerer. 2009. “Learning and Visceral Temptation in
Dynamic Savings Experiments.” Quarterly Journal of Economics 124 (1): 197–231.
Bruhn, Miriam, Gabriel Lara Ibarra, and David McKenzie. 2013. “Why Is Voluntary Financial
Education So Unpopular? Experimental Evidence from Mexico.” Policy Research Working
Paper 6439, World Bank, Washington, DC.
Bruhn, Miriam, Luciana de Souza Leão, Arianna Legovini, Rogelio Marchetti, and Bilal Zia. 2013.
“Financial Education and Behavior Formation: Large Scale Experimental Evidence from
Brazil.” Presentation, World Bank, Washington, DC.
Cai, Jing. 2011. “Social Networks and the Decision to Insure: Evidence from Randomized
Experiments in China.” Development Impact (blog), December 5. http://blogs.worldbank.
org/impactevaluations/.
CGAP (Consultative Group to Assist the Poor). 2013. “Rural Adoption of Mobile Payments:
Results of Telecomm/Mifon Pilot in Santiago Nuyoo, Oaxaca, Mexico.” Presentation.

FINANCIAL CAPABILITY IN MEXICO: RESULTS FROM A NATIONAL SURVEY ON FINANCIAL BEHAVIORS, ATTITUDES, AND KNOWLEDGE
90
CNBV (Comisión Nacional Bancaria y de Valores). 2009. “Reporte de Inclusión Financiera 1.”
Mexico City. http://www.cnbv.gob.mx/Inclusi%C3%B3n/Paginas/Reportes.aspx.
—. 2013. “Reporte de Inclusión Financiera 4.” Mexico City. http://www.cnbv.gob.mx/
Inclusi%C3%B3n/Paginas/Reportes.aspx.
CNBV/INEGI (Comisión Nacional Bancaria y de Valores and Instituto Nacional de Estadística y
Geografía). 2012. “National Survey for Financial Inclusion: Descriptive Analysis of the Results.”
Mexico City.
Cole, Shawn A., Thomas Sampson, and Bilal Zia. 2011. “Prices or Knowledge? What Drives Demand
for Financial Services in Emerging Markets?” The Journal of Finance 66 (6): 1933–67.
Cole, Shawn A., and Gauri Kartini Shastry. 2008. “Smart Money: The Effect of Education,
Cognitive Ability, and Financial Literacy on Financial Market Participation.” Harvard
Business School Working Paper No. 09071, Harvard University, Cambridge, MA.
Consejo Nacional de Inclusión Financiera. 2011. “Base de Datos de Inclusión Financiera, Cuarto
Reporte de Inclusión Financiera.” http://www.cnbv.gob.mx/Inclusión/Documents/Bases%20
de%20Datos/Base%20de%20Datos%20IF%20201112.xlsx.
Doi, Yoko, David McKenzie, and Bilal Zia. 2012. “Who You Train Matters: Identifying
Complementary Effects of Financial Education on Migrant Households.” Policy Research
Working Paper 6157, World Bank, Washington, DC.
Duflo, Esther, and Emmanuel Saez. 2011. “The Role of Information and Social Interactions in
Retirement Plan Decisions: Evidence from a Randomized Experiment.” Quarterly Journal of
Economics 118 (3): 815–42.
Duflo, Esther, Michael Kremer, and Jonathan Robinson. 2006. “Understanding Technology
Adopting: Fertilizer in Western Kenya—Evidence from Field Experiments.” Unpublished
working paper.
El-Gamal, Mahmoud, Mohamed El-Komi, Dean Karlan, and Adam Osman. 2011. “Bank Insured
Rosca for Microfinance: Experimental Evidence from Egypt.” Rice University Department of
Economics.
Fornero, Elsa, and Chiara Monticone. 2011. “Financial Literacy and Pension Plan Participation in
Italy.” Journal of Pension Economics and Finance 10 (4): 547–64.
Gibson, John, David McKenzie, and Bilal Zia. 2012. “The Impact of Financial Literacy Training for
Migrants.” Policy Research Working Paper 6073, World Bank, Washington, DC.
Gine, Xavier, Cristina Martinez-Cuellar, and Rafe Mazer. Forthcoming. “Evaluating the
Effectiveness of Mexico’s Credit and Savings Disclosure Reforms.”
Hastings, Justine, and Lydia Tejeda-Ashton. 2008. “Financial Literacy, Information, and Demand
Elasticity: Survey and Experimental Evidence from Mexico.” NBER Working Paper No.
14538, National Bureau of Economic Research, Cambridge, MA.
Hastings, Justine, and Olivia Mitchell. 2010. “How Financial Literacy and Impatience Shape
Retirement Wealth and Investment Behaviors.” University of Michigan Working Paper 2010-233.
Heimann, Ursula, and Sergio Gómez Sainz. 2009. “Mapping of Financial Education Initiatives in
Mexico.” Sparkassenstiftung für international Kooperation.
Huston, Sandra J. 2010. “Measuring Financial Literacy.” Journal of Consumer Affairs 44 (2): 296–316.
ILO (International Labour Organization). 2011. Global Employment Trends 2011: The Challenge
of a Jobs Recovery. http://www.ilo.org/global/publications/books/WCMS_150440/lang--en/
index.htm.
REFERENCES
91
INEGI (Instituto Nacional de Estadística y Geografía). 2005. “Conteo de Población y Vivienda
2005.” http://www.inegi.org.mx/est/contenidos/proyectos/ccpv/cpv2005/default.aspx.
—. 2009. “Censos Económicos 2009.” http://www.inegi.org.mx/est/contenidos/espanol/
proyectos/censos/ce2009/.
—. 2010. “Censo de Población y Vivienda 2010.” http://www.censo2010.org.mx/.
Karlan, Dean, Melanie Morten, and Jonathan Zinman. 2012. “A Personal Touch: Text Messaging
for Loan Repayment.” NBER Working Paper No. 17952, National Bureau of Economic
Research, Cambridge, MA.
Karlan, Dean, Margaret McConnell, Sendhil Mullainathan, and Jonathan Zinman. 2009. “Limited
Attention and the Salience of Savings.” Working paper.
–. 2012. “Getting to the Top of Mind: How Reminders Increase Savings.” Yale University. http://
karlan.yale.edu/p/Top%20of%20Mind%202012mar.pdf.
Kempson, Elaine, Valeria Perotti, and Kinnon Scott. 2013. Measuring Financial Capability: A New
Instrument and Results from Low- and Middle-Income Countries. Washington, DC: World
Bank.
Klapper, Leora, and Georgios A. Panos. 2011. “Financial Literacy and Retirement Planning: The
Russian Case.” Policy Research Working Paper No. 5827, World Bank, Washington, DC.
Lührmann, M., M. Serra-Garcia, and J. Winter. 2012. “The Effects of Financial Literacy Training:
Evidence from a Field Experiment with German High-School Children.”University of Munich
Working Paper 201224, University of Munich, Munich.
Lusardi, Annamaria. 2011. “Americans’ Financial Capability.” NBER Working Paper No. 17103,
National Bureau of Economic Research, Cambridge, MA.
Lusardi, Annamaria, and Olivia S. Mitchell. 2009. “How Ordinary Consumers Make Complex
Economic Decisions: Financial Literacy and Retirement Readiness.” Dartmouth University.
http://www.dartmouth.edu/~alusardi/Papers/LusardiMitchellOrdinaryConsumers.pdf.
—. 2011. “Financial Literacy and Planning: Implications for Retirement Wellbeing.” In O. S.
Mitchell and A. Lusardi, eds., Financial Literacy: Implications for Retirement Security and
the Financial Marketplace, 17–39. Oxford: Oxford University Press.
—. 2013. “The Economic Importance of Financial Literacy: Theory and Evidence.” NBER
Working Paper No. 18952, National Bureau of Economic Research, Cambridge, MA.
Lusardi, Annamaria, Olivia Mitchell, and Vilsa Curto. 2010. “Financial Literacy among the Young.”
Journal of Consumer Affairs 44: 358–80.
Lusardi, Annamaria, and Peter Tufano. 2009. “Debt Literacy, Financial Experience and Over-
indebtedness.” NBER Working Paper No. 14808, National Bureau of Economic Research,
Cambridge, MA.
Mandell, L., and L. S. Klein. 2007. “Motivation and Financial Literacy.” Financial Services Review
16: 106–16.
Mas, Ignacio. 2013. “Beyond Products: Building Integrated Customer Experiences on Mobile
Phones.” In J. Ledgerwood, ed., The New Microfinance Handbook: A Financial Market
System Perspective, chapter 13. Washington, DC: World Bank.
Sekita, Shizuka. 2011. “Financial Literacy and Retirement Planning in Japan.” Journal of Pension
Economics and Finance 10 (4): 637–56.

FINANCIAL CAPABILITY IN MEXICO: RESULTS FROM A NATIONAL SURVEY ON FINANCIAL BEHAVIORS, ATTITUDES, AND KNOWLEDGE
92
Seshan, Ganesh, and Dean Yang. 2012. “Transnational Household Finance: A Field
Experiment on the Cross-Border Impacts of Financial Education for Migrant Workers.”
http://www-personal.umich.edu/~deanyang/papers/seshan%20yang%202012%20
transnational%20household%20finance.pdf.
Stango, Victor, and Jonathan Zinman. 2009. “Exponential Growth Bias and Household Finance.”
Journal of Finance 64 (6): 2807–49.
Tabachnick, B. G., and L. S. Fidell. 2001. Using Multivariate Statistics. Boston: Allyn and Bacon.
Xu, Lisa, and Bilal Zia. 2012. “Financial Literacy Around the World. An Overview of the Evidence
with Practical Suggestions for the Way Forward.” Policy Research Working Paper 6107,
World Bank, Washington, DC.


MINISTRY OF FINANCE OF THE RUSSIAN FEDERATION
COMISIÓN NACIONAL PARA LA DEFENSA DE LOS USUARIOS DE LAS
INSTITUCIONES FINANCIERAS


