Download - World Bank Ben Eijbergen
11
The Forgotten Sector: The Forgotten Sector: Sanitation and Sanitation and Sewerage in the Sewerage in the PhilippinesPhilippines
Ben EijbergenBen Eijbergen
Infrastructure Sector CoordinatorInfrastructure Sector Coordinator
World Bank Office ManilaWorld Bank Office Manila

22
The Forgotten Sector: The Forgotten Sector: Sanitation and Sewerage Sanitation and Sewerage in the Philippinesin the Philippines
Sector overview and performanceSector overview and performance
Policy and institutional frameworkPolicy and institutional framework
Market structure of water service Market structure of water service providersproviders
Investment needs and financingInvestment needs and financing
Main issuesMain issues
RecommendationsRecommendations

33
Sector Overview Sector Overview
SanitationSanitation – interventions (usually – interventions (usually construction of facilities such as latrines) construction of facilities such as latrines) that improve management of excreta; that improve management of excreta; on-site facilities such as toilets and septic on-site facilities such as toilets and septic tankstanks
SewerageSewerage – the entire system of – the entire system of wastewater collection, treatment and wastewater collection, treatment and disposal; pipe networks to off-site disposal; pipe networks to off-site treatment and disposaltreatment and disposal
Sanitation and sewerage investment Sanitation and sewerage investment usually lumped with water supply usually lumped with water supply

44
Sector OverviewSector Overview
Indiscriminate disposal of wastewater is one Indiscriminate disposal of wastewater is one main reason for degradation of water qualitymain reason for degradation of water quality
Adverse effects:Adverse effects:
– HealthHealth: Spread of disease-causing bacteria & : Spread of disease-causing bacteria & virusesviruses
– Aquatic ecosystemAquatic ecosystem: Decline in fishery production : Decline in fishery production due to pollution due to pollution
– AestheticsAesthetics: Poor quality of water makes water unfit : Poor quality of water makes water unfit for recreation for recreation

55
Sector OverviewSector Overview
HealthHealth In 1996-2000 approximately 31% In 1996-2000 approximately 31% of illnesses monitored were of illnesses monitored were attributed to waterborne sourcesattributed to waterborne sources
PhP3.3 billion PhP3.3 billion per year in per year in avoidable avoidable health costhealth cost
Aquatic Aquatic ecosysteecosystemm
Fish yields reported to have Fish yields reported to have declined by 30%- 5% due to declined by 30%- 5% due to sedimentation and silt pollution; sedimentation and silt pollution;
PhP17 billion PhP17 billion lost due to lost due to degradation of degradation of fisheries fisheries environmentenvironment
TourismTourism Decline in occupancy (e.g. Decline in occupancy (e.g. Boracay island in 1997 due to Boracay island in 1997 due to high levels of coliform); high levels of coliform);
P47 billion for P47 billion for avoidable avoidable losses in losses in tourismtourism
OthersOthers Damage claims due to Damage claims due to environmental degradation (e.g. environmental degradation (e.g. income and livelihood)income and livelihood)Overall economic loss due to water pollution: $1.3 billion a yearOverall economic loss due to water pollution: $1.3 billion a year
66
Sector PerformanceSector Performance
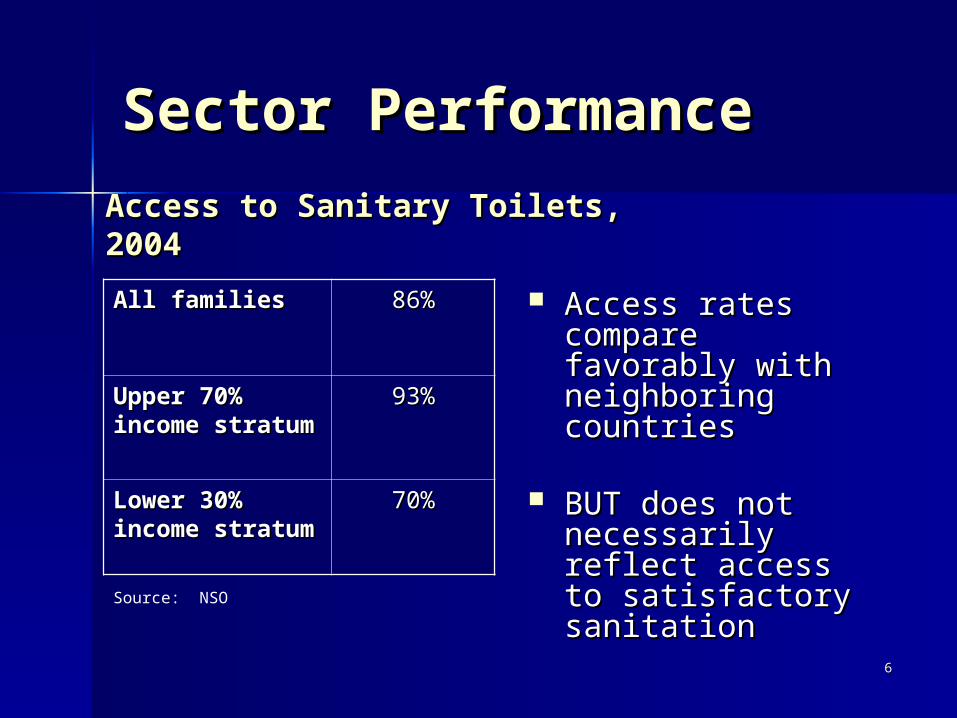
Source: NSO
Access to Sanitary Toilets, Access to Sanitary Toilets, 20042004
All familiesAll families 86%86%
Upper 70% Upper 70% income income stratumstratum
93%93%
Lower 30% Lower 30% income income stratumstratum
70%70%
Access rates Access rates compare favorably compare favorably with neighboring with neighboring countries countries
BUT does not BUT does not necessarily reflect necessarily reflect access to access to satisfactory satisfactory sanitationsanitation

77
Sector PerformanceSector Performance
0 20 40 60 80 100
Hong Kong OsakaSeoul
Chengdu Tashkent
Kuala LumpurShanghai
Delhi Karachi
Ulaanbaatar Phnom Penh
Colombo Dhaka
KathmanduHo Chi Minh City
Manila Jakarta
Vientiane
Sewerage Access, Selected Asian Cities, Sewerage Access, Selected Asian Cities, 2001/20022001/2002
Percent
Only about 4% Only about 4% of the of the population had population had access to access to sewerage in sewerage in 20002000
Outside Metro Outside Metro Manila, access Manila, access to sewerage to sewerage network almost network almost non-existent non-existent
Source: Asian Development Bank. 2004. Water in Asian Cities: Utilities Performance and Society Views. Manila.

88
Main Laws and Main Laws and RegulationsRegulations
19591959 National Plumbing CodeNational Plumbing Code
19751975 Sanitation CodeSanitation Code
19761976 Water Code; establishment of NWRBWater Code; establishment of NWRB
19771977 National Building Code;National Building Code;
Philippine Environmental CodePhilippine Environmental Code
19911991 Local Government CodeLocal Government Code
Shifted responsibility of water supply Shifted responsibility of water supply and sanitation services to LGUsand sanitation services to LGUs
20042004 Clean Water ActClean Water Act
99
Government Institutions Government Institutions Involved in Involved in Sanitation and SewerageSanitation and Sewerage
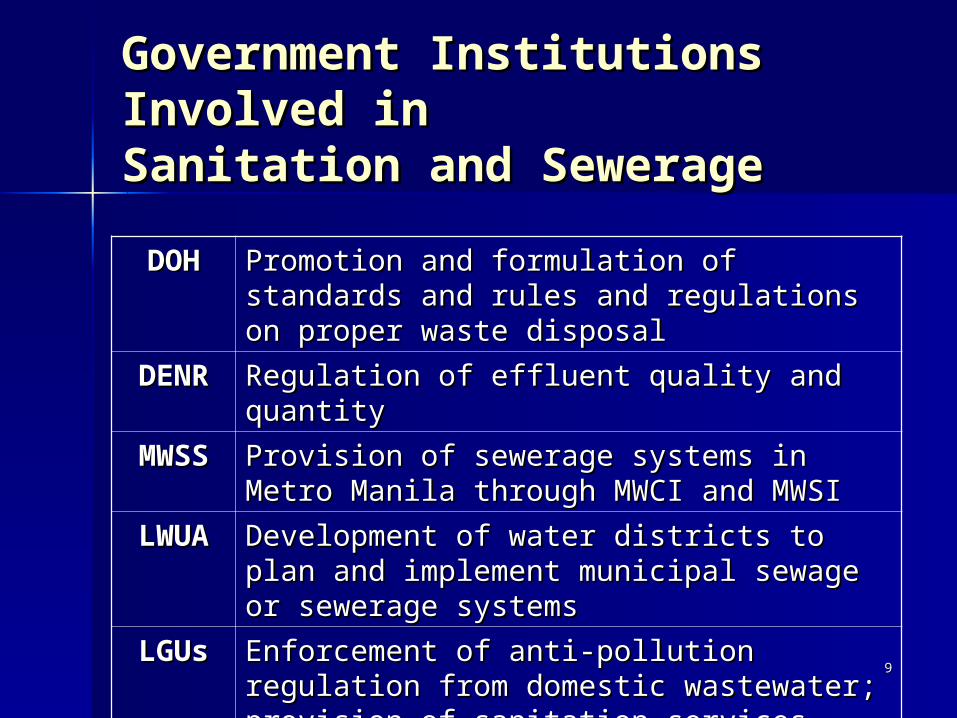
DOHDOH Promotion and formulation of standards Promotion and formulation of standards and rules and regulations on proper waste and rules and regulations on proper waste disposaldisposal
DENRDENR Regulation of effluent quality and quantity Regulation of effluent quality and quantity
MWSSMWSS Provision of sewerage systems in Metro Provision of sewerage systems in Metro Manila through MWCI and MWSIManila through MWCI and MWSI
LWUALWUA Development of water districts to plan and Development of water districts to plan and implement municipal sewage or sewerage implement municipal sewage or sewerage systemssystems
LGUsLGUs Enforcement of anti-pollution regulation Enforcement of anti-pollution regulation from domestic wastewater; provision of from domestic wastewater; provision of sanitation servicessanitation services

1010
Market Structure of Market Structure of Water Service ProvidersWater Service Providers
Institutional Institutional fragmentationfragmentation
– At utility level: At utility level: proliferation of proliferation of provider models provider models and their small and their small sizessizes
– At national level: At national level: fragmentation of fragmentation of oversight oversight responsibilitiesresponsibilities
WDs 14%
PU 10%
LGU/ CBO 20%
LGU/CBO - 35%
79% with access to formal levels of service 21% no access
Complementary services provided by SSIPs and/or Self Provision
44% Level 310%
Level 225% Level 1
Private wells Tankered/vended
waterPiped supply
SSIPs and/or self provision by
households - 21%
Legend:CBO = community-based organization LGU = local government unitPUs = private operatorsSSIP = small-scale independent providerWDs = local water districts
Level 1 = a protected well or a developed spring with an outlet but without a distribution system
Level 2 = a piped system with communal faucets Level 3 = a piped system with individual household taps
1111
Investment Needs and Investment Needs and FinancingFinancing
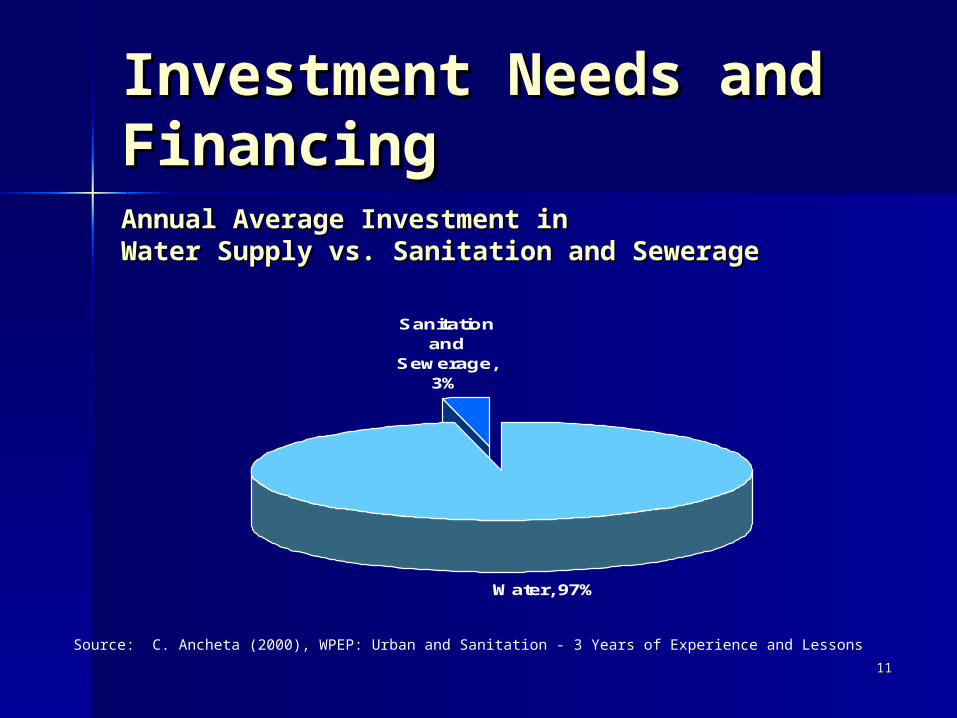
Water, 97%
Sanitation and
Sewerage, 3%
Source: C. Ancheta (2000), WPEP: Urban and Sanitation - 3 Years of Experience and Lessons
Annual Average Investment inAnnual Average Investment inWater Supply vs. Sanitation and SewerageWater Supply vs. Sanitation and Sewerage

1212
Investment Needs and Investment Needs and FinancingFinancing
CoveragCoverage Areae Area
Population Population
(in million)(in million)Service Coverage Service Coverage
(in million) (in million) Investment Investment
requirement requirement
(in PhP B)(in PhP B)
20052005 20152015 20052005 20152015 20052005 20152015
UrbanUrban 48.85 48.85 (58%)(58%)
55.58 55.58 (60%)(60%)
9.77 9.77 (20%)(20%)
27.79 27.79 (50%)(50%)
55.6955.69 158.40158.40
RuralRural 35.37 35.37 (42%)(42%)
37.06 37.06 (40%)(40%)
17.69 17.69 (50%)(50%)
18.53 18.53 (50%)(50%)
50.4250.42 52.8152.81
Sub-Sub-TotalTotal
84.22 84.22 (100%)(100%)
92.64 92.64 (100%)(100%)
27.46 27.46 (33%)(33%)
46.32 46.32 (50%)(50%)
106.11106.11 211.21211.21
Program SupportProgram Support
Operating Costs UrbanOperating Costs Urban 3.913.91 11.1211.12
Operating Costs RuralOperating Costs Rural 6.286.28 6.586.58
TotalTotal 130.09130.09 256.37256.37Notes: Investment requirement was computed based on constant 2002 rates. Support activities were estimated at 13% of the Capital Cost.Source: ADB, 2001
1313
Main IssuesMain Issues
Lack of leadership; no identified lead Lack of leadership; no identified lead authority on sanitation authority on sanitation
Low priority given by the National Low priority given by the National Government and LGUsGovernment and LGUs
Low demand due to inadequate Low demand due to inadequate information on appropriate sanitation information on appropriate sanitation practicespractices
Underinvestment and lack of financingUnderinvestment and lack of financing
1414
RecommendationsRecommendations
Reinforce public awareness-building measures Reinforce public awareness-building measures regarding the impacts of inadequate S&S regarding the impacts of inadequate S&S
Review and clarify accountability for planning, Review and clarify accountability for planning, construction, operation and regulation of S&S construction, operation and regulation of S&S infrastructureinfrastructure
Assist LGUs and local utilities develop Assist LGUs and local utilities develop strategies and plans for sanitation strategies and plans for sanitation improvementimprovement
Allocate funding from the government to Allocate funding from the government to provide incentives for LGUs and utilities in provide incentives for LGUs and utilities in sewerage investmentssewerage investments


