
THE ROLE OF BANKS IN TAKEOVERS
Victoria Ivashina Vinay B. Nair
Anthony Saunders Nadia Massoud Roger Stover
S-FI-05-01
Working Paper Series FINANCIAL INSTITUTIONS Research Group

The Role of Banks in Takeovers
Victoria Ivashina*
Vinay B. Naira
Anthony Saunders*
Nadia Massoud**
Roger Stover^
This version: January 2005
The authors thank Yakov Amihud, Allen Berger, Andrew Metrick and Randall Morck for helpfuldiscussions; and seminar participants at New York University and the Australasia Conference for Bankingand Finance for comments.* Stern School of Business, New York Universitya The Wharton School, University of Pennsylvania** School of Business, University of Alberta^ Iowa State University

1
Abstract
To transfer loans from one debtor to another debtor, banks might transmit
borrower information which is collected in the lending process to potential
acquirers. In this paper, we investigate the importance of banks in the
effectiveness of the takeover mechanism and hence in corporate governance.
Using unsolicited takeovers between 1992 and 2003, we find that bank lending
intensity and bank client network (the number of firms that the bank deals with)
have a significant and positive effect on the probability of a borrower firm
becoming a target. We find that this effect is enhanced in cases where the target
and acquirer have a relationship with the same bank and is robust to the
inclusion of several firm characteristics including the presence of large external
shareholders. Moreover, takeover completion rates are positively related to
bank lending intensity. Finally, we find that the equity market views takeovers
where the target and the acquirer deal with the same bank more positively
relative to takeovers with no bank involvement. Overall, the evidence supports
the view that banks increase the disciplining role of the market for corporate
control.

2
Introduction
As is well known, there is a long literature dating back to Fama (1985) and James
(1987) that views banks as “insiders” to a firm. Specifically, in their role as suppliers
of private debt (bank loans) they gather information that may well be unavailable to
outside investors. Such information collection advantages places them in a position
of acting as firm monitors1
Banks, however, not only gather information but can also facilitate the
transmission of this information to potential acquirers since such transmission can
increase their ability to reallocate bank debt from bad debtors to good debtors. In this
paper, we investigate whether this role of banks is important in affecting the
efficiency of the takeover mechanism.2 Unlike most of the recent corporate
governance literature that views governance emanating from equity-holders or
institutional investors, we examine the corporate governance role of private debt (in
this case, bank debt). In particular, we examine the role of bank loans and their
associated information production in impacting the takeover probability of firms.
In what follows the paper focuses on unsolicited takeovers, excluding those cases
where the takeovers are initiated by a firm that puts itself up for sale (see Boone and
1 Thus, a large number of studies have shown that bank loan announcements of loan renewals are taken aspositive signals by investors in the capital markets and vice-versa for loan sales (see, e.g., Dahiya, Puri andSaunders, 2004).
2 Esterbrook and Fishel (1991) and Jensen (1993) argue that takeovers constitute the critical mechanism inthe US and the UK without which managerial discretion cannot be controlled. Gompers, Ishii and Metrick(2003) and Cremers and Nair (2004) show a significant link between firm value, equity returns andtakeover vulnerability.

3
Mulherin, 2004).3 In such cases, the governance role of banks we highlight is less
relevant. Moreover, a bank’s informational role in unsolicited takeovers is potentially
more identifiable than in takeovers in general. In the latter case lending activity may
be related to financing a consensual agreement by the target to be takenover. We
examine the impact of bank lending intensity on the probability that a firm will be
subject to a takeover attempt using a sample of unsolicited targets among Compustat
firms over the 1992 to 2003 period. We document several findings consistent with a
positive information-based corporate governance role of banks in impacting the
probability of unsolicited takeovers.
First, we find that greater bank lending intensity is associated with a higher
likelihood of a borrower firm receiving an unsolicited takeover bid. Second, we find
that those firms having lending relationships with banks that have fewer clients are
less likely to be subject to an unsolicited takeover attempt.4 Third, we find that the
role of bank lending intensity in predicting unsolicited takeover attempts is stronger
for those takeovers where the target and acquirer have a relationship with the same
bank. Fourth and finally, we find that a greater intensity of the bank lending
relationship is related to a higher probability of takeover bid completion.
In addition to the above, we examine the robustness of our results in the context
of corporate governance mechanisms emanating from equity-holders. Interestingly,
the role of equity-holder governance (takeover defenses and monitoring shareholders)
in affecting the likelihood of unsolicited takeovers has been a little researched area.
Introducing various measures of equity holder discipline based on managerial
3 Unsolicited takeovers are included in unsolicited takeovers.4 We focus on clients in the same industry since it is in these cases where relationships that generatepotential acquirers are likely to be most important.

4
entrenchment, blockholder stakes and a governance index compiled by Gompers,
Ishii and Metrick (2003), we find that our results supporting a bank-debt related
governance mechanism are robust.
Overall, our evidence is consistent with a role for banks in facilitating takeovers
through information production via bank lending and the transmission of this
information to potential acquirers. Our findings add to the literature on predicting
takeover targets following Palepu (1986) and others.5 We find that in addition to
factors such as leverage, industry, asset structure, and firm value, bank lending
intensity as well as the presence of external blockholders are important in predicting
takeover targets.
The documented ‘information intermediary’ role of banks is not without
controversy. Indeed, there have been recent lawsuits in which target firms (or
potential target firms) have sued their own bank over the transfer of “private”
information regarding the firm to an outside acquirer. It might be noted that since
regulation does not prohibit commercial banks from providing M&A advisory
services nor is there a law against a bank “switching sides” and acting against its
client in the role of advisor to an unsolicited bidder, the Courts tend to look at case
law to assess the merits of such complaints. Thus, the case filed by security systems
company ADT Ltd against its long time lender Chase Manhattan Corp in February
1997 received particular attention as it was expected to set a precedent on lenders
“duty of loyalty” to their borrowers. ADT claimed that Chase’s managing directors
5 Also see Stulz (1988), Mikkelson and Megan (1989), Ambrose and Meggison(1992), Song and Walking(1993).

5
repeatedly promised not to assist in any unsolicited attempt to takeover the company.6
At the time of the filing of the complaint, ADT had $1.1 billion in debt outstanding
that it would have been forced to repay immediately if it lost the case (including a
repayment of its loans to Chase). Four months after the case filing the court dismissed
most of ADTs claims ruling that “a bank has no per se obligation to refrain from
such participation, and that plaintiff has not pleaded the existence of a fiduciary
relationship which might give rise to such an obligation.”7
Even though the ADT ruling has reduced the number of similar pleadings there
are other cases relating to similar issues involving banks both in the US and abroad.
Most of these disputes center on the disclosure of confidential lending (loan)
information. For example, in 1999, Mannesmann, the German telecommunications
company, which was the target of an unsolicited takeover bid by Vodafone, sued
Vodafone’s adviser Goldman Sachs arguing that Goldman used private information
generated through a prior lending relationship without Mannesmann’s consent. A
British court later dismissed the case, calling it “hopeless.”8 For similar reasons, in
2000, Dime Bancorp sued Salomon Smith Barney on the grounds that it acted as an
adviser to North Fork Bancorp in its unsolicited takeover attempt. This case was also
dismissed. More recently, in August 2003 auto-parts maker Dana Corp argued that
UBS, which had a prior lending relationship with the company, used confidential
information to help its rival ArvinMeritor Inc. to launch a $2.2 billion unsolicited bid.
This last case is still awaiting the court’s decision.
6 The Wall Street Journal, 11, 1997, “ADT sues Chase for aiding bidder seeking takeover”; Bank LoanReport, February 24, 1997, “ADT sues Chase over Western Resources Financing.”7 ADT Operations, Inc. v Chase Manhattan Bank, N.A. 662 N.Y.S. 2d 190 (1997).8 New York Times, August 5, 2003, “Auto part manufacturer sues banker of an unwanted suitor.”

6
The question thus arises as to whether these demands are economically founded
or are they just part of a target’s effort to thwart an unsolicited bid that is common in
unsolicited takeover battles? In order to shed light on such claims of ‘conflicts of
interest,’ we look at how investors in the equity market react to unsolicited takeover
announcements, when the same bank has a lending relationship with both the target
and the acquirer. We find that the abnormal return to the target shareholders around
the bid announcement date is more positive in the case where the same bank has a
relationship with both the acquirer and the target than where the target and acquirer
do not have a relationship with the same bank. At the same time the abnormal return
for acquirers shows no significant difference between lending relationship based
takeovers and non relationship based takeovers. From an overall economic efficiency
perspective we find that bank relationship-linked unsolicited takeovers are not
associated with a value-loss. Thus, even while the bank may be acting in its own best
interests, there is no evidence that suggests these interests directly conflict with
shareholder interests.
We proceed by outlining a simple framework to specify our hypotheses in section
1. In section 2, we discuss the data sources for our study, in particular the source of
our takeover and loan data and the measurement of key variables. Using a sample
based on Compustat, section 3 examines the impact of bank lending intensity and
bank client networks on the probability of an unsolicited takeover attempt occurring,
using control variables from the existing literature on takeover activity in general. In
that section we also present a variety of robustness checks including controlling for
equity-side corporate governance mechanisms. Section 4 looks at how stock market

7
investors perceive unsolicited takeovers where the acquirer is linked to the target via
the same lending bank. Section 5 looks at alternative bank motives and Section 6
concludes.
1. Banks as Information Intermediaries
In this section we specify our hypotheses that if supported would be consistent
with the view that banks act not only as information collectors and monitors but also
as information transmitters in the market for corporate control. If these hypotheses
are not supported, then this latter role of information transmission is unlikely to be
important in affecting the takeover mechanism.
Figure 1 (Panel A) depicts the information intermediary role that a bank plays
among firms in the takeover market. The bank shown (Bank I) has one borrower and
can transfer information about a firm (potential target) to another (bidder A). More
generally, since a bank has lending relationships with many firms, it can transfer
information about an underperforming or poorly managed firm to a number of
potential acquirers. By doing so, the bank can enable the transfer of its loans from
one debtor to another debtor.9 Thus, the more extensive a bank’s information set is,
the greater is the likelihood that an acquirer will appear. Our first hypothesis is then:
H1: Greater bank lending intensity increases the probability of a borrower
being an unsolicited target
If banks act as information intermediaries and actively transfer information to a
potential acquirer rather than simply respond to interest from a potential acquirer,
then a firm is more likely to be a target if it deals with a bank that has many
9 There is now an extensive literature on the role of bank relationships in enhancing information collection.For a survey see Boot (2000).

8
borrowing clients and hence many relationships. In Figure 1 (panel B, I), for example,
if the bank deals with both firm A and firm B, there is an additional potential acquirer
and hence a greater likelihood of being takenover. Similarly (panel B, II), the pool of
potential acquirers is likely to be greater when the target firm deals with both Bank I
and Bank II, each with its own client base. Since a greater pool of potential acquirers
is likely to increase the chance of a bid, we hypothesize that:
H2: The larger the number of firms (client base) that the lending bank(s)
deals with, the greater is the is associated probability of being an unsolicited
takeover target
If a bank acts as an information intermediary between clients, it is also more
likely that the acquirer will appear from among the bank’s clients. Thus, we would
expect to see a significant number of takeovers where the acquirer and the target
share a relationship with the same bank. More importantly, in such takeovers, the
predictive role of bank lending intensity would also be expected to be stronger. This
leads us to our third hypothesis:
H3: The importance of bank lending intensity in predicting unsolicited
takeovers is higher for takeovers where the acquirer and the target share a
relationship with the same bank.
Further, a bank’s information transmission may not only increase the probability
of receiving an unsolicited bid, but may also increase the probability of its
completion. The reasons are two-fold. First, the information produced by the bank
might reduce the uncertainty regarding the target and hence encourage the acquirer to
pursue the target more aggressively. Second, and perhaps more importantly, the bank
9
might also help the acquirer finance the deal. In fact, new loan issuances made to the
acquirer frequently coincide with the unsolicited event. Thus, we hypothesize that:
H4: Bank lending intensity is positively related to the probability of
completing an unsolicited takeover.
2. Data and Methodology
2.1 Sample
In analyzing the impact of bank loans on unsolicited takeovers we employ a
number of data sets. Specifically we focus our hypothesis tests on unsolicited
takeover activity among all firms on the Compustat database over the 1992 to 2003
period. A full description of our data can be found in the Data Appendix.
2.2 Bank Loans, Takeovers and Firm Characteristics
To generate data on bank lenders and loans we use the Loan Pricing
Corporation’s (LPC) DealScan database for individual bank loans. These data track
large loan originations made by banks to generally large companies from 1987 to the
present. Currently, over 139,000 loans have been included in the LPC database with
US loans accounting for 60% of these loans. LPC collects data from SEC filings,
industry contacts and directly from lenders. As LPC has established a reputation for
tracking loans and publishing league tables that rate bankers, e.g. in syndication,
banks have an incentive to voluntarily report their loans. These loans tend to be the
largest and most important loans made by the bank.10 Since bank information is likely
to be related to their lending intensity to a particular firm, we start by assuming that
10 Note that even smaller banks also have an incentive to report their large syndicated loans as these ratings
are important in syndications where smaller banks are often participants.

10
LPC loan activity (normalized by the borrowing firm’s assets) is an appropriate proxy
or indicator of a bank’s incentive to gather information since greater loan activity, all
else equal, implies greater credit risk exposure. Loans to firms that are not reported on
LPC tend to be smaller and less important to the bank concerned. Thus, a firm whose
loans do not appear in the LPC database over our sample period is far less likely to be
subject to bank monitoring than a firm which has received loans that appear in the
LPC database.11
We measure lending intensity by the cumulative credit lines received by a target
in the 3 years prior to an unsolicited takeover bid (i.e., t-4 to t-1, where t is the year of
the takeover bid) divided by the target firm’s assets (t-1). A three year period was
chosen based on two criteria: (1) the period is sufficiently long to establish banking
relationships that produce valuable private information to potential acquirers and (2)
the mean maturity of a loan in the LPC database is approximately three years.12 We
also measure the number of loans received in that period, since each loan is likely to
produce new and relevant credit exposure information to the bank lender.13 Finally,
we also investigate whether the acquirer and target shared a lending relationship (in
the three years prior to a takeover attempt) with the same bank and also compute the
number of clients the takeover target bank had in the same industry. The Appendix
provides further details on how these, and other variables used in the paper, are
constructed.
11 In fact, banks commonly take a portfolio view (based on the law of large numbers) for small and mediumenterprise loans. To ensure that our results are not driven by any omitted loan information, we use anarrower control for the target sample in Section 5 that is matched on firm size in addition to industry.12 The LPC database starts from 1987. We choose to focus on targets from 1992 so that we can useinformation from 1989. We omit the first two years on LPC to ensure widespread reporting of loans bybanks.13 The results using the number of loans are qualitatively similar to those using the loan to asset ratio andare not reported here.

11
2.3 Takeovers
To detect unsolicited takeovers, we use the Securities Data Corporation’s (SDC)
database. This includes all unsolicited bids that indicate an attempt to change
corporate control. To classify takeovers, we look at the first event that triggers the
series of transactions. Therefore, all transactions that are initiated by unsolicited
tender offer are classified as “hostile.” For example, an unsuccessful unsolicited
tender offer followed by a merger would fall into this category.14 We also collect
information on the outcome of the takeover bid in terms of its eventual completion or
non-completion (withdrawal).
2.4 Shareholder Control
While our focus is on governance emanating from bank lending activity we also
collect data on shareholder (equity) control, as it has been argued that unsolicited
takeovers are more likely to occur as shareholder control increases (Shleifer and
Vishny (1986)). We control for a large shareholder corporate governance effect by
using a dummy for the existence of an institutional blockholder, denoted by BLOCK
= 1 if such an institutional blockholder is present and zero otherwise. We define
blockholders to be those institutional shareholders that have more than a 5%
ownership stake in the firm’s outstanding shares. To construct this measure, we use
data on institutional share holdings from Thompson / CDA Spectrum, which collects
quarterly information from SEC 13f filings.15,16 By using institutional blockholdings
14 We do not include open market purchases in our sample.15 The 1978 amendment to the Security and Exchange Act of 1934 requires all institutional investors withmore than $100 million under management to report their shareholdings to the SEC.16 Non-institutional external blockholders are omitted in the study, due to the difficulty of collectingreliable data for such a large sample over this time period. This might potentially bias the test of H1, asbank lending intensity might proxy for the importance of an external individual blockholder. As such

12
rather than simply institutional ownership, we mitigate the problem that institutions
with small equity stakes have little incentive to be involved in firm-specific decisions.
Furthermore, Shleifer and Vishny (1986) argue that blockholders often have
substantial voting control, enabling them to pressure the firm’s management. Such
control rights can be especially valuable in a proxy fight.
2.5 Other Variables
In addition to blockholder control we introduce two additional corporate
governance control mechanisms. The first is a measure of the target firm’s managerial
entrenchment, defined as the percent of shares held by the top firm executives. The
source for these data was ExecuComp. The second is the variable G, the (non-bank
related) governance index as compiled by Gompers, Ishii and Metrick (2001). This
governance index includes various mechanisms such as staggered boards and poison
pills that impact the probability of takeover. Since the index captures managerial
protection, a greater value of the G-index signifies a lower probability of an
unsolicited takeover bid occurring.
In addition to the bank-side information production and equity-side corporate
governance control variables, we introduce a number of other variables in our tests
that have been used in prior literature seeking to explain the probability of takeovers
in general. These variables might also be expected to impact the probability of an
unsolicited takeover bid occurring (see, for example, Hasbrouck (1985), Palepu
(1986), Mikkelson and Partch (1989), Ambrose and Megginson (1992), Song and
Walkling (1993) and Billett (1996) among others). The additional variables
monitoring external blockholders are more likely in small firms, any bias that might arise from such anomission is likely to be small in the sample using S&P firms.

13
introduced based on the extant takeover literature are an industry dummy that
measures whether an unsolicited takeover attempt occurred in the same 4-digit SIC
industry in the year prior to the merger, the return on assets of the firm (adjusted for
the industry median), annual sales growth (adjusted for the industry median), firm
leverage (measured by the book debt to assets ratio), cash (the cash and short-term
investments to assets ratio), firm size (measured as Ln(market equity)), Market/Book
Assets (industry adjusted)17, and asset structure (measured by the property, plant and
equipment to assets ratio).
2.6 Methodology
To analyze the impact of a banking relationship on the probability of
becoming a target, we use a logit methodology. First we identify companies with
valid accounting information that became the target of an unsolicited takeover
between 1992 and 2003.18 To ensure that takeover events are independent we only
include the earliest event in any 4 –year window.19 We find 359 such cases.
We then select companies that were not a target of an unsolicited takeover
attempt in the sample period. We start with all the companies reported in
COMPUSTAT that are not included in the takeover bid sample. We then select only
those firms with the same 4-digit SIC code as the target in the same event year.20
Thus, we first use SIC code (4-digit) and year as matching variables to generate
17 Where market value of assets is defined as total assets plus the market value of common equity minus thebook value of common equity plus deferred taxes.18 Note that takeovers during date t are logistically related to independent variables at the end of year t-1.Therefore, while takeovers are collected from 1992 to 2003, the independent variables are from 1991 to2002.19 Consequently, we are left with only 2 firms that have more than one unsolicited event.20 Targets for which we are unable to find at least one matching control company with valid accountinginformation are dropped.

14
15,530 such control firms.21 Thus, each firm has approximately a 2.3% average
probability of being a target each year. The cumulative probability of becoming a
target between 1992 and 2003 is much higher and equal to 24.4%.22
The key logit variables and their descriptive statistics are more fully described
in the Data Appendix. In addition to a full definition and source of each variable
used in the study we present mean, median and standard deviations of each
explanatory variable for both the whole Compustat sample and the sample excluding
regulatory industries (SIC codes 4 and 6). The key variables of interest in measuring
the impact of bank related effects on the probability of unsolicited mergers are bank
lending intensity (loan intensity) and the measure of the target bank’s relationships
with clients in the same industry as the target firm (Bank Net). As discussed above
the bank loan intensity variable measures the cumulative dollar sum of loans received
over the three years prior to an unsolicited takeover attempt divided by the one-year
lagged target’s assets, i.e., if an unsolicited takeover bid occurred at time t we
measure the cumulative dollar value over the period t-1 to t-4 (a three-year window
lagging the takeover bid by a year) divided by the target firm’s assets at time t -1.23
We also used the absolute number of loans (N) made by the bank to the target during
the same three year window as a robustness check.24
21 Note that we also control for other factors to create the matching sample in the Logit. These includefactors identified as important by Barber and Lyon (1996). Results are presented later (in section 4) in thepaper.22 The probability of being a target between 1992 and 2003 is given by 2.3% + 97.7%. 2.3% + 97.72% + …+ 97.711% 2.3%.
23 The LPC database starts from 1987. We choose to focus on targets from 1992 so that we can useinformation from 1989. We omit the first two years on LPC to ensure widespread reporting of loans bybanks.24 The results using the number of loans are qualitatively similar to those using the loan to asset ratio andare not reported here.

15
In addition the Bank Net industry variable measures the number of different
corporate clients (in the LPC database) the target’s bank(s) had in the same industry
as the target firm (2-digit SIC code) over a three year period prior to the takeover,
scaled by the total amount of loans received by the target firm. Such scaling accounts
for the fact that larger loans tend to have larger lending syndicates.
The Data Appendix also shows the correlation matrix among the logit model
variables. It is important to note that the correlations of both our loan intensity
variables and bank network variables with firm leverage are very small and
insignificantly different from zero, thus reducing concerns of multicollinearity in
regressions that involve both firm leverage and loan intensity.
3. Results
3.1 Bank Lending Intensity and Likelihood of becoming a Target (H1)
Our first set of tests concern the probability of an unsolicited takeover occurring
over the 1992 to 2003 period. A logit model is used to detect the probability of a firm
being the target of an unsolicited bid, where a target firm has a dummy of 1 and zero
otherwise. The target dummy is the dependent variable in the logit model. The
probability of becoming a target in year t is estimated annually by using one-year-
lagged values of the non-lending related independent variables. Table1 shows the
logit test results for the total sample of 359 unsolicited events as well as for the
sample of 273 that exclude the regulated industries
The first column of coefficients reports the results without the bank loan intensity
variable and the second column of coefficients includes it. In addition Wald values
are reported indicating significance at the 10%, 5% and 1% levels respectively. The

16
significant variables in the whole sample panel are the industry dummy, leverage,
cash, market to book, asset structure and loan intensity. Consistent with the notion
that leverage is a takeover deterrent we find that higher leverage reduces the
likelihood of receiving an unsolicited takeover bid. Also consistent with the argument
that firms use their cash to repurchase shares in order to block unsolicited takeovers,
we find that greater cash reduces the likelihood of being takenover. Consistent with
earlier findings we also find that poor performers (low industry adjusted market to
book) and firms with more fixed assets are more likely to be takenover. Finally, we
also find an industry effect consistent with the earlier literature on predicting
takeovers -- the occurrence of a takeover in the previous year reduces the likelihood
of future takeovers in the same industry.
With respect to the key variable of focus under H1, bank loan intensity, this has a
positive and statistically significant effect on the probability of becoming an
unsolicited takeover candidate which in turn is consistent with the presence of a bank
lending related information channel in the unsolicited takeover market. (This result is
robust to the inclusion of the alternative specification of the loan intensity variable
which measures the number (N) of bank loans made to the target over the three years
prior to the unsolicited takeover bid). The economic impact of loan intensity is,
however, small. For example, a firm with a loan to assets ratio of 1 has a 2.1%
probability of being an unsolicited target each year and a firm with no bank loan has a
2.0% probability of being an unsolicited target each year.25 This represents a 1.5%
25 To calculate probabilities we use average variable values. Note that a loan/asset ratio of 1 measure thecumulative loans over the 3 years prior to the merger year (t-4 to t-1) divided by target assets at time t-1.

17
increase in the cumulative probability of becoming an unsolicited target over the
1992-2003 sample period.
While Table 1 evaluates the impact of variables that have been introduced in the
prior literature (in addition to bank loan intensity) in analyzing the determinants of
the probability of unsolicited takeovers occurring, alternative governance
mechanisms -- especially those relating to equity-holders -- may also impact the
probability of unsolicited takeovers. While the prior theoretical literature has raised
this possibility, to the best of our knowledge the importance of these alternative
(equity-based) corporate governance mechanisms in impacting the probability of
unsolicited takeovers have not been investigated.
Table 2A adds three additional corporate governance variables to those in Table
1. These are a measure of insider entrenchment, a measure of institutional
blockholder stakes and a measure of takeover exposure as measured by the Metrick,
et al (2001) corporate governance (G) index. As can be seen from Table 2A, the
number of total observations available for each of these measures varies considerably
as does the number of unsolicited takeover bids. The first three logit models consider
each of the three corporate governance variables separately. The final logit model
(column 4) includes all three together. Overall, it appears that of these three
alternative governance measures, only the institutional blockholder variable
significantly (and positively) impacts the probability of an unsolicited takeover. In
particular, a firm with an institutional blockholder and bank loan to assets ratio of 1
had a 3.3% average probability of being an unsolicited target each year and a firm
with no bank loan and no institutional blockholder had only a 1.2% average
18
probability of being unsolicited target each year. This represents a 20.1% increase in
the cumulative probability of becoming a target over the 1992-2003 period. In the
presence of the blockholder variable loan intensity is positive and significant of at the
10% level in column (3) of Table 2A. However, most of the variables become
insignificant in the presence of all three governance variables (column (4)) reflecting,
in part, the sharp reduction in observations due to limited data on the insider
entrenchment variable and takeover exposure variable for the same target.26
To examine the robustness of this result we also analyzed the basic model
(including the blockholder variable) over a recent sub-period 1999-2003.27 Since the
Dealscan data base has been built up over time and has encompassed an increasing
number of banks it is important to examine the robustness of our results over different
sub-samples. As can be seen over the most recent sub-period, in Table 2B, with
institutional blockholders present, the loan intensity variable is highly significant at
the 1% level and its economic impact indicates that a company with a loan to assets
ratio of 1 and an institutional blockholder presence has a 2.6% annual probability of
being takenover.28
3.2 The Number of Potential Acquirers (H2)
We next test hypothesis H2 -- the importance of the target bank’s client network
in predicting unsolicited takeover bids. Specifically, we examine whether such
takeover bids are increasing in the number of the target bank’s client firms in the
same industry (as the target firm). In calculating Bank Net -- our measure of client
26 Specifically one have 359 targets for just blockholder, but only 71 when we add entrenchment andtakeover exposure (the G-index variable).27 Notice that given that looking at the unsolicited bids over 1999-2003 implies using loan data 1996-2002.28 Here entrenchment and takeover exposure are excluded because of the limited number (only 33) ofobservations on these variables for targets.

19
network -- we consider the clients of all banks that were involved in lending to the
target in the three years prior to the takeover bid. We then detect and aggregate the
number of different firms in the same industry that each of these banks lent to in the
prior three years. Since a larger number of industry-based lending relationships
increases the number of potential acquirers to which the target’s bank (or banks) can
transfer private information, we expect that this variable will have a positive effect on
the probability of being an unsolicited takeover candidate.
Table 3 presents the results for our hypothesis (H2). As can be seen, we find a
positive and statistically significant coefficient (at the 10% level) on the probability of
being an unsolicited takeover target in the full sample resulting from Bank Net (size
of bank client network). Furthermore the loan intensity variable is significant at 5%
level. Specifically, the average client exposure for each firm is 34.26 potential
bidders in the same 2-digit SIC code (not standardized by the loan amount). For this
average client exposure, a firm with a bank loan to assets ratio of 1 faces a 2.1%
annual average probability of becoming a target. If the firm were to deal with an
additional bank of average size (in terms of industry clients) the probability of facing
a takeover increases to 2.2%
To examine the robustness of the results for H2 we matched the non-target firms
with the target firms based on two additional criteria established by Barber and Lyon
(1996). These are return on assets (ROA) and size (Market Equity). The matching
calibration was that target and non-target firms had to have an ROA and size measure
that was not different by more than 10%. Table 4 shows the results for the full

20
Compustat sample controlling for this matching.29 As can be seen Bank Net is
positive and significant at the 1% level and loan intensity is significant30 at the 5%
level. Note also that these variables are significant even in the presence of a strong
blockholder effect (see column 4 of Table 4).
Overall, these results appear to support our hypothesis H2, regarding the
importance of bank lending in predicting takeovers. That is, this probability (while
small) is increasing in the network of different clients (in the same industry) that the
target’s bank deals with. The evidence is thus consistent with a view that banks not
only act as financial intermediaries but also as ‘information intermediaries’ in the
unsolicited takeover market.
3.3 Shared Lending Relationship (H3)
In this sub-section, we test hypothesis (H3), that a bank’s transmission of
information about one client to another client is indeed a major channel that increases
the probability of takeovers. If this hypothesis is supported, we would expect bank
lending intensity to be more important in takeovers where the acquirer deals with (has
a relationship with) the same bank as the target. In addition, we would expect the
economic impact to be more important in this case. We therefore analyze those
unsolicited takeover bids where the bidder and the target have a shared lending
relationship with the same bank.
29 In addition, the matching is also done by industry and year, as before. Using several screens to creatematching targets also addresses another potential bias. While LPC covers most big firms that borrow frombanks, it might be case that some small firms that do not appear on LPC are simply ignored by LPC, andhence are incorrectly assigned a bank loan value of 0. By narrowing down the matching sample, and bylooking at control firms as the same size of the target, we show that the results are not sensitive to such apotential bias.30 If regulated industries are excluded the bank net variable is significant at the 5% level.

21
For the 359 unsolicited takeovers in the Compustat sample, we identified the
acquirer in each and checked if the acquirer had a lending relationship with the
target’s bank and found 71 such cases. In the remaining cases, the acquirer did not
borrow directly from the target’s bank or from a related syndicate member that had
made loans to the target. In these cases, the acquirer and the target had no common
bank(s).
Table 5 looks at the sub-sample of 71 unsolicited takeovers in which the target
firm had a lending relationship with a bank that also had a lending relationship with
the acquirer. Again, firms were matched to these 71 cases based on event year and 4-
digit SIC codes to get 2588 control firms that did not face any takeover attempt. The
dependent variable is Banklink, which has a value of 1 if the target and acquirer have
a common banking relationship and zero otherwise. Focusing again on the bank loan
intensity variable it can be seen that it is statistically significant. Its significance is
also robust to the inclusion/exclusion of the institutional blockholder variable found
earlier to be an important corporate governance mechanism that positively impacts
the probability of unsolicited takeovers.
To see the now greater economic importance of bank lending intensity, note that a
firm with a bank loan to assets ratio of 1 has an annual average probability of 2.0% of
facing a takeover by an acquirer who deals with the target’s bank. On the other hand,
a similar firm with average bank loans to assets ratio (0.18) has a yearly average
probability of 1.5% of facing a takeover by an acquirer who has a relationship with
the target’s bank.31
31 All other variables are at the average levels. For the sample here, ROA –5%, growth 22%, leverage 48%cash 20% and size $167 million, market to book ratio of assets 0.43 and 34% PPE.
22
The combined impact of bank lending intensity and the presence of a blockholder
is even more striking and shows the importance of including equity-related
governance variables in models that attempt to predict takeovers. A firm with an
institutional blockholder and bank loan to assets ratio of 1 had a 3.3% average
probability of receiving an unsolicited bid from a client firm connected to its bank
each year and a firm with no bank loan and no institutional blockholder had only a
0.4% average probability of being an unsolicited target of its bank’s client each year.
This represents a 26.1% increase in the cumulative probability of receiving a bid from
a company that is a client of the same bank over the 1992-2003 period.32
Another interesting observation can be made from Table 5. Perhaps surprisingly,
in contrast to earlier results, higher leverage and a bigger size now tends to make a
firm more likely to be acquired by one of its lending bank’s clients. One reason might
be that banks are more concerned about a poor performing firm precisely when it is
large and is likely to be in distress.33 These are cases the bank might have the highest
gains by the transfer of debt to a good debtor.
Overall, there appears to be support for the argument, made by some target
companies, that bank private information generated in the lending process can be
used to enhance the probability of an unsolicited bid, via information transfer from
the target’s bank(s) to a bank related acquirer. (See for example, the cases of ADT
and Dana Inc. discussed earlier).34
32 Thus, even when the importance of the bank lending intensity variable appears small on an annual basis,it can be substantial when considered cumulatively.33 When banks have a significant loan to a firm that declares bankruptcy, the bank might also face lawsuitsfrom other lenders.34 One might wonder whether the results is due to the possibility that firms in similar industries are likely tobuy each other while at the same time more likely to deal with the same bank. This view only explains why

23
3.4 Bank Relationships and Completion Rates (H4)
We now investigate if bank lending intensity affects the completion rate of
unsolicited takeover attempts which is our fourth hypothesis (H4). Among the 404
events that we detected in our sample, we find that 152 unsolicited attempts were
completed and 252 attempts were not completed (withdrawn). We computed the
means of the different variables in the completed and non-completed samples and
checked for significant differences using a t-test. As can be seen from Table 6, the
bank lending intensity variable is significantly higher in cases of completed
unsolicited events as compared to non-completed unsolicited events. Indeed, for this
sample it is the only statistically significant variable that on a univariate basis
distinguishes completed from non-completed unsolicited takeover bids in our sample.
These univariate tests support hypothesis H4, i.e., that bank lending intensity is
additionally important in unsolicited takeovers, not only by making a firm a more
likely target but also by impacting the completion probability rate of the bid.35
Moreover, the results from a logit regression to predict the probability of completion
given an unsolicited attempt produced similar results. 36
4. Market Reaction
The results discussed above in Section 3 for H1 to H4 suggest that banks not only
act as financial intermediaries in effecting fund flows but also as information
intermediaries. This supports the claims made by some firms that their lenders have
a significant fraction of the takeovers witness a lending bank common to the acquirer and the target butcannot explain the importance of the bank’s ‘lending intensity’.35 It is also notable that even if an acquirer appears from outside the bank’s client base, banks can play arole in completion rates after the announcement date.
36 Results available on request.
24
transferred private information to a potential acquirer. However, as discussed earlier,
whether there exist “conflicts of interest” and thus costs to target stockholders is far
from clear. In this section we investigate the impact of a bank’s information
intermediary role on a target and acquirers shareholders. In particular, we investigate
whether the potential transfer of information by a bank regarding a target client to
another client harms the target’s investors. We also investigate whether the transfer
benefits acquirer investors. We first divide the Compustat unsolicited takeover
sample based on whether or not the acquirer and the target shared a lending
relationship with the same bank. The two sub-samples of takeovers have respectively
79 and 322 firms in them. We then investigate if there are any differences in
shareholder reaction to these two classes of takeovers around announcement dates.
Table 7 presents the abnormal returns, for both classes of takeovers, for two event
windows around the announcement dates: -1 to +1 and +2 to +10, where date 0 is the
bid announcement date. Using a standard event study we find that the abnormal
returns to the target shareholders to be more positive around bid announcement dates
for those 79 targets that share a bank relationship with the acquirer (Bank Link = 1)
compared to those 322 that don’t (Bank Link = 0). Specifically, shareholder reaction
is 20.37% during the event window [-1, +1], when the target and the acquirer share a
lending relationship with the same bank, compared to 16.4% when there is no shared
relationship. This difference of 4.23% is significant at the 10% level. For the event
window [+2,+10], the shareholder reaction is 0.63% higher for unsolicited takeover
bids with bank involvement compared to when the target and the acquirer have no
common bank (this difference is insignificant).
25
We also analyzed the impact on acquirer investors of linked and non-linked
takeovers. As can be seen both are insignificantly different from zero although for
the event window [+2, +10] the shareholder reaction is 0.69% higher for bidders with
bank involvement compared to when the target and the acquirer have no common
bank. Consequently, given the weak positive effect of bank linked takeover bids on
target returns and the zero impact on acquirer returns, the results are consistent with
no efficiency loss resulting from banks role in takeovers. That is, not only do target
investors enjoy a small net gain as a result of a banks relationship with outside firms
there also appears to be a “value-added” gain overall.
5. Bank Motives
In addition to market announcement effects, we also attempt to shed more light on
the bank’s motives in order to verify whether the bank’s interests are in conflict with
those of the target firm’s shareholders. In particular, the bank might transmit
information about one client to another so as to increase the probability of
transferring loans from an ex-ante bad borrower to an ex-ante good borrower. To
check this we focus on cases where both the acquirer and the target had a lending
relationship with the same bank and compare their accounting performance and
market to book ratios. Consistent with the notion that acquirers tend to be better
“performers” than targets we find that they have higher return on assets, return on
equity, net profit margins and market to book ratios than targets (see Table 8, Panel

26
A). This suggests that debt does get transferred from an ex-ante bad debtor to a
relatively good debtor.
However, since targets of unsolicited takeovers tend to be poor performers in
general, the finding above does not shed light on the bank’s positive role in the
takeover mechanism. It is thus interesting to see whether banks improve the
efficiency of the takeover mechanism by detecting poor performance before it is
manifested in the accounting measures. If banks do indeed detect problems in the firm
early, then we would expect to find performance differences between targets that are
acquired by their bank’s client and targets that are acquired by a firm without a
lending relationship with the borrower’s bank. We compare performance differences
between these two categories of targets and find some evidence consistent with the
notion that relationship banks might detect performance declines early. Specifically,
we find that although all targets perform poorly, targets acquired by their bank’s
clients are relatively better performers, i.e., have better ROA, ROE and profit margins
than targets without any bank involvement. That is, relationship banks appear to
intervene earlier to protect their loan exposures via the takeover mechanism.
To the extent that banks do transfer debt from bad debtors to good debtors, the
bank’s role in the takeover channel might benefit shareholders. However, there are
other potential motives that might hurt a target’s shareholders. These would arise if
either a bank (1) transfers information to the acquirer because it benefits from the
financing of the takeover and/or (2) bank transfers information to the acquirer
because it benefits from the fees for an advisory role in the transaction. Since both

27
motives are independent of the target’s condition or quality, they are more likely to
hurt target shareholders.
To examine the potentially adverse impact of the financing motive among cases
where the acquirer and the target had a lending relationship with the same bank, we
first collect data on whether the acquirer received a new loan from the bank in the
same year as an unsolicited bid was announced. Among the 88 cases for which we
were able to obtain these data, there were 23 such cases. We further checked the
purpose of each loan and found that in only 11 cases was a loan issued for the
purpose of financing a takeover. While this suggests that financing may not be a
predominant motive, we checked to see whether there were differences in target
performance based on whether the acquirer received a loan to finance the takeover or
not. We find that targets who receive a takeover bid from an acquirer that received a
loan from the target’s bank, performed no differently, than other targets. (see Table 9,
Panel A).37
With respect to the second alternative motive, advisory fees, we find no
evidence that advisory fees are an important motive. Table 9, panel B, compares the
target performance for those cases where the target's bank acted as the advisor to the
bidder and those where it did not. Overall, there is significant difference between
these two categories. However, this general insignificance might be due to the small
number of observations detected. Specifically in only 148 cases in our sample the
name of the advisor was reported. Among these cases, there were only 13 cases where
a bank with a lending relationship with the target acted as an advisor to the acquirer.
One possible reason for this low number might be a concern by banks that an explicit 37 Differences reflect rounding to 2 decimal places.

28
advisory role, alongside a lending role, might make it more likely that they would be
involved in litigation based on a conflicts of interest argument.
6. Conclusion
This paper is the first to establish the role of a private debt or a bank lending
channel in corporate governance via the takeover channel. We show that: (1) bank
lending intensity has a significant and positive effect on the probability of a firm
becoming an unsolicited target, (2) the number of same industry client firms that a
bank deals with is positively and significantly related to the takeover probability of a
borrower firm, (3) the importance of bank lending intensity in predicting an
unsolicited takeover is higher for those takeovers where the acquirer and the target
shared a lending relationship with the same bank, and (4) unsolicited takeover
completion rates are positively related to bank lending intensity. In addition, we find
that unsolicited target shareholders react more positively when the target and the
acquirer share a lending relationship with the same bank compared to those
unsolicited takeovers where the target and the acquirer do not have a common
banking relationship.
These results are consistent with a role for banks in effecting the probability of
unsolicited takeovers via a lending-related information channel. In addition the equity
channel – operating primarily through blockholder stakes -- is also found to impact
the probability of unsolicited takeovers. Although the blockholder impact appears
more important, the bank lending channel effects are robust to the inclusion of equity
blockholders.

29
From a policy perspective the growing penetration of banks into the merger
advisory and investment banking arena in the U.S. since the passage of the Financial
Services Modernization Act of 1999, along with a recent surge in takeovers, implies
that the disciplining (or governance) role of banks is likely to become even more
prominent and controversial in the future.

30
References
Allen, L., J. Jagtiani, S. Peristiani, and A. Saunders (2004), "The Role of Bank Advisorsin Mergers and Acquisitions," Journal of Money Credit and Banking 36(2), 197-224.
Ambrose, Brent W., and William L. Meggison, 1992, The role of asset structure,ownership structure, and takeover defenses in determining acquisition likelihood, Journalof Financial and Quantitative Analysis 27 (4), 575-589).
Barber, Brand M., and John D. Lyon, 1996, Detecting abnormal operating performance:The empirical power and specification of test statistics, Journal of Financial Economics41, 359-399.
Billett, M. T. (1996), “Targeting capital structure: The relationship between risky debtand the firm’s likelihood of being acquired”, Journal of Business 69, 173-192.
Boot, Arnoud (2000), “Relationship Banking: What Do We Know?” Journal of FinancialIntermediation 9, 7-25.
Cremers, K.J.M. and V.B.Nair (2004), “Governance Mechanisms and Equity Prices”,Journal of Finance, (forthcoming).
Dahiya, S., M. Puri and A. Saunders (2003), “Bank Borrowers and Loan Sales: NewEvidence on the Uniqueness of Bank Loans”, Journal of Business, 76 (4), 563-582.
Fama, E.F. (1985), “What’s different about banks”, Journal of Monetary Economics, 15(1), 29-39.
Gompers, P.A. and A. Metrick (2001), “Institutional Investors and Equity Prices”, TheQuarterly Journal of Economics, 116(1), 229-259.
Gompers, P.A., J.L. Ishii, and A. Metrick (2003), “Corporate governance and equityprices,” The Quarterly Journal of Economics, 118(1), 107-155.
Hasbrouck, Joel, 1985, The characteristics of takeover targets, Journal of Banking andFinance 9, 351-362.
Inderst, R., and H.Mueller (2004), “Tender Offers and Leverage”, Quarterly Journal ofEconomics, (forthcoming).
James, C. (1987), “Some evidence on the uniqueness of bank loans”, Journal ofFinancial Economics, 19 (2), 217-235.

31
John, K. and S. Kedia (2004), “Design of Corporate Governance: Role of OwnershipStructure, Takeovers, Bank Debt and Large Shareholder Monitoring”, NYU workingpaper.
Harris, M. and A. Raviv (1988), “Corporate Control Contests and Capital Structure,”Journal of Financial Economics, 55-86.
McLaughlin, R. and H. Mehran (1995), “Regulation and the market for corporate control:Hostile tender offers for electric and gas utilities”, Journal of Regulatory Economics 8,181-204.
Mikkelson, Wayne H., and M. Megan partch, 1989, Managers voting rights and corporatecontrol, Journal of Financial Economics 25, 263-290.
Mitchell, M.L. and K. Lehn (1990), “Do Bad Bidders Become Good Targets?”, Journalof Political Economy, 98 (2), 372-398.
Palepu, Krishna G., 1986, Predicting takeover targets, Journal of Accounting Economics8, 3-35.
Shleifer, A and R.Vishny (1986), “Large Shareholders and Corporate Control,” Journalof Political Economy.
Shleifer, A and R.Vishny (1997), “A Survey of Corporate Governance,” Journal ofFinance, 52, 737-783.
Song, Moon H., and Ralph A. Walkling, 1993, The impact of Managerial ownership onacquisition attempts and target shareholder wealth, Journal of Financial and QuantitativeAnalysis 28(4), 439-457.
Stulz, R.M. (1988), “Managerial Control of Voting Rights: Financing Policies and theMarket for Corporate Control,” Journal of Financial Economics, 25-54.

32
FIGURE 1
BANKS AS INFORMATION INTERMEDIARIES
Panel A
Panel B
I
II
BIDDER A
BIDDERSC& D
BIDDERSA & B
BANK IPOTENTAL
TARGET
BIDDER B
BANK I
BANK II
POTENTALTARGET
BIDDER A
BANK IPOTENTAL
TARGET

33
DATA APPENDIX
Table A1: Variable Description
Variable Source Description
ROA Compustat EBITD /Total Assets: Data18 / Data6Sales growth Compustat ΔSales / Sales: ΔData12 / Data12
Leverage Compustat Book Debt/Total Assets: [Data6 - (Data60 + Data74)]/Data6
Cash Compustat Cash and Short-Term Investments /Total Assets: Data1/ Data6Ln(Equity) Compustat Ln (Market Equity) : Ln (Data25 * Data199)
Market/Book Assets Compustat Market Assets/Book Assets: [Data6 -(Data60+Data74) +Data25*Data199]/Data6
Asset Structure (PPE) Compustat Property, Plant and Equipment / Total Assets: Data7/ Data6
Institutional Blockholder Spectrum Institutional(13f) Holdings
Indicator equal to 1 if there is an institution holding over 5% of thecompany’s shares.
Insider Entrenchment S&P ExecuComp Percentage of shares held by reported executives.
Takeover Exposure A. Metrick websiteGovernance Index Data
(24-G), where G is the governance index as defined by Gompers, Ishii andMetrick (2003).
Loan Intensity LPC: Dealscan Total amount of loans issued to the company over the 3-year windowprevious to the event (t-4 through t-1) standardized by the total assets (t-1).
Loan Intensity (N) LPC: Dealscan Total number of loans issued to the company over the 3-year windowprevious to the event (t-4 through t-1) standardized by the total assets (t-1).
Bank Link LPC: Dealscan Indicator equal to 1 if target and bidder had a lending relationship with thesame bank over the 3-year window previous to the event at any tier level.We look at the banks present in the original loan syndicate.
Bank Size LPC: Dealscan Number of different clients that borrow from the bank over 3-year window.(See Table A2)
Bank Net LPC: Dealscan Proxy for number of potential bidders that a company is exposed to throughits lending relationships. It is defined as the sum of Bank Size across all thedifferent banks that a company interacts with over 3-year window scaled bythe total amount of loans received. (See Table A3)
Industry Bank Net LPC: Dealscan Proxy for number of the potential bidders in the same 2-digit SIC code that acompany is exposed to through its lending relationships. It is defined as thesum of industry specific Bank Size across all the different banks that acompany interacts with over 3-year window scaled by the total amount ofloans received. (See Table A3)

34
TABLE A2: SIZE OF THE BANK’S CLIENT NETWORK
This table looks at the size of the bank’s client network defined as the number of different clients that received a loanover the past 3 years. We say that the bank granted a loan if it was member of the lending syndicate at any tier level.These numbers are based on all information available in DealScan thus including not only commercial and investmentbanks but also all institutions that participate in the primary syndicated loan market. Calculation of the size of thebank’s client net is the first step in computing Bank Net variable.
TABLE A3: BANK NET DISCRIPTIVE STATISTICS
This table presents descriptive statistics for the Bank Net variable. Bank Net is calculated for each company andmeasures the number of different companies that interact with the same banks. It is computed by adding the size of thebank’s client network (as defined in the Table A2), across the different banks with which a company had a lendingrelationship over the past 3 years. While Bank Net presents the general number of different clients Bank Net Industryonly counts companies that are in the same 2-digit SIC code as the company for which the variable is computed. Thesenumbers are based on the sub-sample of the firms that were target of hostile takeover and the control sample with validaccounting information available in Compustat and that have at least one loan identified in DealScan in the respective3-year window.
Year 1991 1992 1993 1994 1995 1996 1997 1998 1999 2000 2001 2002
Mean 17.5 16.9 19 23.9 29.9 33.2 35.8 34 31.5 29.9 29.6 28
Median 2 2 2 2 2 2 2 2 2 2 2 2
Max 1099 1303 1654 2129 2535 2962 3484 3853 3890 3662 3369 3117
Top 1% 356 408 488 651 822 855 978 945 838 802 774 742
Number of Banks 1153 1385 1643 1868 1984 2307 2664 2963 3257 3224 3403 3584
Bank Net Bank Net Industry(2-digit SIC Code)
Number of Banksin the Net
Year Mean Median Max Mean Median Max Mean Median
1991 2114 1340 12642 70 29 882 6.4 3
1992 2385 1404 14845 73 32 990 6.2 3
1993 3132 1799 21781 87 39 1061 6.2 3
1994 4471 2680 30206 111 50 1252 6.4 3
1995 6119 3646 39996 140 66.5 1556 6.9 4
1996 7771 4478 49429 167 81 1924 7.1 4
1997 9619 5515 57845 194 92 2329 7.6 4
1998 10285 6297 64341 211 106 2494 7.8 4
1999 10577 7082 62425 234 116 2809 8.3 4
2000 9608 6450 58071 228 102 2901 8.3 4
2001 9908 6512 63421 238 105 2824 8.8 5
2002 9602 6680 60157 220 106 2561 8.7 5

35
TABLE A4: DESCRIPTIVE STATISTICSThis table presents descriptive statistics for the all Compustat based sample 1992-2003. Industry dummy is equal one ifthere was an unsolicited takeover in a firm’s 4-digit SIC industry in the year prior to the year of observation. ROA(Adjusted) is industry median adjusted return on assets. Sales growth (Adjusted) is industry median adjusted annual rate ofchange in the firm’s net sales. Leverage is book debt to asset ratio. Cash is cash and short-term investments to assetsratio. Firm size is proxied by Ln(Equity), the natural logarithm of the market equity. Market/Book Assets (Adjusted) is theindustry median adjusted ratio of market to book value of assets, where market assets are defined as total assets plusmarket value of common stock minus book common equity and differed taxes. PPE is property, plant and equipment toassets ratio. Institutional Blockholder is a dummy variable assigned the value one if at least one institutional investorholds more than 5% of the companies stock and zero otherwise. Loan Intensity is a cumulative credit line issued duringthe 3 years previous to the year of the analysis scaled by the total assets. Loan intensity (N) is the total number of loansissued to the firm in the past 3 years. Bank Net is total size of the banks that have relationship with the company asmeasured by the number of different clients in the same industry. Bank Net is measured over past 3 years and scaled bythe cumulative credit line. Compustat sample includes all the firms that were target of unsolicited takeover and firmswith the same 4-digit SIC code as the target and valid accounting information in the same event year. Regulatedindustries include industries identified with 1-digit SIC categories 4 and 6.Panel A: Sample Characteristics
Compustat sample
(N= 15,889) Excluding regulated industries
(N=10,606)Variable Mean Std. Dev. Median Mean Std. Dev. Median
Industry dummy 0.37 0.48 0 0.41 0.49 0
ROA (Adjusted) -0.05 0.44 0.00 -0.07 0.51 0.02
Sales growth (Adjusted) 0.18 0.81 0.00 0.22 0.93 0.01
Leverage 0.54 0.29 0.53 0.41 0.24 0.39
Cash 0.20 0.23 0.09 0.26 0.26 0.17
Ln (Equity) 4.74 2.18 4.54 4.59 2.20 4.46
Market/Book Assets (Adjusted) 0.43 3.00 -0.01 0.60 3.54 -0.08
Asset Structure (PPE) 0.22 0.26 0.10 0.27 0.26 0.16
Institutional Blockholder 0.43 0.50 0 0.46 0.50 0
Loan intensity 0.11 0.69 0 0.14 0.82 0
Loan intensity (N) 0.39 1.10 0 0.46 1.19 0
Bank Net 11.12 142.39 0 14.48 172.85 0
Industry Bank Net 0.29 4.09 0 0.37 4.96 0Panel B: Correlation Coefficients
1 2 3 4 5 6 7 8 9 10 11 12
1 Industry dummy
2 ROA (Adjusted) -0.046a
3 Sales growth (Adjusted) -0.011 -0.054a
4 Leverage -0.082a -0.029a -0.127a
5 Cash 0.089a -0.079a 0.145a -0.542a
6 Ln (Equity) -0.108a 0.195a 0.073a -0.008 -0.020b
7 Market/Book Assets (Adjusted) -0.003 -0.051a 0.152a -0.115a 0.185a 0.161a
8 Asset Structure (PPE) -0.013c -0.001 -0.007 -0.169a -0.254a 0.064a -0.029a
9 Institutional Blockholder 0.039a 0.094a -0.003 -0.086a 0.060a 0.208a -0.018b -0.002
10 Loan intensity -0.008 0.016b -0.001 -0.002 -0.064a 0.009 -0.019b 0.090a 0.058a
11 Loan intensity (N) -0.032a 0.059a -0.008 0.039a -0.161a 0.232a -0.031a 0.193a 0.182a 0.387a
12 Bank Net 0.006 0.013 -0.008 -0.008 -0.014c 0.015c -0.008 0.031a 0.028a 0.024a 0.076a
13 Industry Bank Net 0.009 0.009 -0.003 -0.009 -0.002 0.013c -0.006 0.019b 0.023a 0.020b 0.066a 0.980a
a, b and c stand for significance at the 1% , 5% and 10% levels.

36
TABLE 1
LIKELIHOOD OF FACING AN UNSOLICITED BID (H1)
This table presents results of the maximum likelihood estimates of the logit model for the Compustat based sample forthe sample period 1992-2003. The dependent variable is a dummy (Target) equal to one if the company is target of anattempted unsolicited takeover. Key explanatory variable is Loan Intensity defined as cumulative credit line issuedduring the 3 years previous to the year of the analysis scaled by the total assets. Industry dummy is equal one if therewas an unsolicited takeover in a firm’s 4-digit SIC industry in the year prior to the year of observation. ROA (Adjusted) isindustry median adjusted return on assets. Sales growth (Adjusted) is industry median adjusted annual rate of change inthe firm’s net sales. Leverage is book debt to asset ratio. Cash is cash and short-term investments to assets ratio. Firmsize is proxied by Ln(Equity), the natural logarithm of the market equity. Market/Book Assets (Adjusted) is the industrymedian adjusted ratio of market to book value of assets, where market assets are defined as total assets plus marketvalue of common stock minus book common equity and differed taxes. PPE is property, plant and equipment to assetsratio. All independent variables are measure at the end of the fiscal year previous to the takeover event. Compustatsample includes all the firms that were target of unsolicited takeover and firms with the same 4-digit SIC code as thetarget and valid accounting information in the same event year. Regulated industries include industries identified with1-digit SIC categories 4 and 6. The point estimates and Wald chi-square statistics for the year effects are not reportedthough they are included in the regression and they are all significant at 1% level.
Whole Compustat Sample Excluding Regulated Industries
Variable Coeff Wald Coeff Wald Coeff Wald Coeff Wald
Industry dummy -0.68 24.7 *** -0.68 24.6 ***-0.87 28.2 *** -0.87 28.1 ***
ROA (Adjusted) 0.22 1.9 0.21 1.9 0.49 3.1 * 0.50 3.1 *
Sales growth (Adjusted) -0.15 2.3 -0.16 2.3 -0.16 2.2 -0.17 2.3
Leverage -0.66 7.9 *** -0.65 7.8 ***0.36 1.4 0.35 1.3
Cash -1.17 10.4 *** -1.16 10.2 ***-1.46 13.4 *** -1.45 13.1 ***
Ln (Equity) 0.01 0.1 0.01 0.2 0.04 2.0 0.04 2.0
Market/Book Assets (Adjusted) -0.22 15.9 *** -0.22 15.8 ***-0.19 12.4 *** -0.19 12.4 ***
Asset Structure (PPE) 0.46 4.5 ** 0.44 4.3 **-0.12 0.2 -0.12 0.2
Loan intensity ---- ---- 0.08 5.5 ** ---- ---- 0.07 3.5 *
Observations 15,889 10,606
Targets 359 273
*** Indicates p value of 1%** Indicates p value of 5%* Indicates p value of 10%

37
TABLE 2A
LIKELIHOOD OF FACING AN UNSOLICITED BID WITH ADDITIONAL CORPORATE
GOVERANCE VARIABLES (H1)
This table analyses robustness of the results in Table 1 to Insider Entrenchment, Institutional Blockholder and TakeoverExposure. It presents results of the maximum likelihood estimates of the logit model for the Compustat based samplefor the sample period 1992-2003. The dependent variable is a dummy (Target) equal to one if the company is target ofan attempted unsolicited takeover. Insider Entrenchment is defined as percent of company’s shares held by executives.Institutional Blockholder is a dummy variable assigned the value one if at least one institutional investor holds morethan 5% of the companies stock and zero otherwise. Takeover Exposure is (24-G), where G is governance index asdefined by Gompers, Ishii and Metrick (2001). The key variable is Loan Intensity defined as cumulative credit lineissued during the 3 years previous to the year of the analysis scaled by the total assets. The number of totalobservations available for each of these measures varies considerably as does the number of unsolicited takeover bids.The first three logit models consider each of the three corporate governance variables separately. The final logit model(column 4) includes all three together. The rest of the variables are the same as in Table 1 Sample includes all the firmsthat were target of unsolicited takeover and the control sample with valid accounting information in the same eventyear available in Compustat. The point estimates and Wald chi-square statistics for the year effects are not reportedthrough they are included in the regression.
Model 1 2 3 4
Variable Coeff Wald Coeff Wald Coeff Wald Coeff Wald
Industry dummy -0.92 6.0 ** -0.72 28.2 *** -0.52 1.7 -0.71 2.2ROA (Adjusted) -0.22 0.2 0.20 1.3 0.22 0.1 -0.79 0.7Sales growth (Adjusted) -0.48 1.5 -0.14 1.8 -0.60 1.2 -0.53 0.9Leverage 0.14 0.0 -0.50 4.4 ** -1.10 2.9 * -0.57 0.5Cash -1.37 1.8 -1.17 10.1 *** -1.55 1.9 -0.64 0.2Ln (Equity) -0.09 1.5 -0.04 2.0 -0.15 3.7 * -0.15 2.0Market/Book Assets (Adjusted) -0.23 2.3 -0.20 12.8 *** -0.27 2.2 -0.20 0.9Asset Structure (PPE) 0.42 0.7 0.48 4.9 ** 0.13 0.1 0.66 1.0Insiders entrenchment -0.05 1.3 ---- ---- ---- ---- -0.05 1.0Institutional Blockholder ---- ---- 0.99 71.2 *** ---- ---- 1.60 12.8 ***
Takeover Exposure ---- ---- ---- ---- -0.09 3.9 ** -0.06 1.2Loan intensity 0.37 3.3 ** 0.06 3.3 * 0.29 2.3 0.14 0.4
Observations 1,190 15,889 924 647Targets 95 359 87 71
*** Indicates p value of 1%** Indicates p value of 5%* Indicates p value of 10%

38
TABLE 2B
ROBUSTNESS CHECK, 1999-2003 (H1)
This table analyses robustness of the results in Table 2A to accuracy of DealScan reporting. To examine the robustnessof this result we also analyzed the basic model (including the blockholder variable) over a recent sub-period 1999-2003. Since the Dealscan database has been built up over time and has encompassed an increasing number of banks itis important to examine the robustness of our results over different sub-samples. Control sample is constructed as inTable 2A. As before, the dependent variable is a dummy (Target) equal to one if the company is target of an attemptunsolicited takeover. The key variable is Loan Intensity defined as cumulative credit line issued during the 3 yearsprevious to the year of the analysis scaled by the total assets. The rest of the variables are the same as in Table 2A.Sample includes all the firms that were target of unsolicited takeover and the control sample with valid accountinginformation in the same event year available in Compustat. The point estimates and Wald chi-square statistics for theyear effects are not reported through they are included in the regression.
Model 1 2
Variable Coeff Wald Coeff Wald
Industry dummy -0.77 16.6 *** -0.78 17.4 ***
ROA (Adjusted) 0.17 1.0 0.17 0.9Sales growth (Adjusted) -0.13 0.9 -0.11 0.7Leverage -0.73 4.0 ** -0.61 2.8 *
Cash -0.89 3.0 * -0.90 3.0 *
Ln (Equity) -0.03 0.6 -0.07 3.0 *
Market/Book Assets (Adjusted) -0.12 3.4 * -0.11 2.5Asset Structure (PPE) 0.93 7.6 *** 0.93 7.6 ***
Institutional Blockholder ---- ---- 0.75 18.1 ***
Loan intensity 0.15 7.7 *** 0.16 8.0 ***
Observations 8,380 8,380Targets 158 158
*** Indicates p value of 1%** Indicates p value of 5%* Indicates p value of 10%

39
TABLE 3
THE IMPACT OF A BANK’S CLIENT NETWORK (H2)
This table presents results of the maximum likelihood estimates of the logit model for the Compustat based sample forthe sample period 1992-2003. Of specific interest is Bank Net variable. Bank Net is total size of the banks that haverelationship with the company as measured by the number of different clients in the same industry. Bank Net ismeasured in a 3-year window and at any tier of syndication. Because larger loans tend to have larger number of banksin the syndicate Bank Net is scaled by the total amount of loans issued to the company. Loan Intensity is a cumulativecredit line issued during the 3 years previous to the year of the analysis scaled by the total assets. The dependentvariable is a dummy (Target) equal to one if the company is target of an attempted unsolicited takeover. Industrydummy is equal one if there was an unsolicited takeover in a firm’s 4-digit SIC industry in the year prior to the year ofobservation. ROA (Adjusted) is industry median adjusted return on assets. Sales growth (Adjusted) is industry medianadjusted annual rate of change in the firm’s net sales. Leverage is book debt to asset ratio. Cash is cash and short-terminvestments to assets ratio. Firm size is proxied by Ln(Equity), the natural logarithm of the market equity. Market/BookAssets (Adjusted) is the industry median adjusted ratio of market to book value of assets, where market assets are definedas total assets plus market value of common stock minus book common equity and differed taxes. PPE is property,plant and equipment to assets ratio. All independent variables are measure at the end of the fiscal year previous to thetakeover event. Sample includes all the firms that were target of unsolicited takeover and the control sample with validaccounting information in the same event year available in Compustat. The point estimates and Wald chi-squarestatistics for the year effects are not reported through they are included in the regression. .
Variable Coeff. Wald
Industry dummy -0.68 24.8 ***
ROA (Adjusted) 0.21 1.9Sales growth (Adjusted) -0.15 2.3Leverage -0.65 7.8 ***
Cash -1.16 10.2 ***
Ln (Equity) 0.01 0.1Market/Book Assets (Adjusted) -0.22 15.8 ***
Asset Structure (PPE) 0.44 4.2 **
Loan intensity 0.08 5.5 **
Bank Net 0.01 3.1 *
Observations 15,889Targets 359
*** Indicates p value of 1%** Indicates p value of 5%* Indicates p value of 10%

40
TABLE 4
ROBUSTNESS TEST, USING BARBER AND LYONS’ (1996) TO MATCH WITHIN 10% OF
ROA OF 10% LN(EQUITY) (H2)
This table analyses robustness of the results in Table 3 to a different sample construction method. Control sample(companies that were not target of unsolicited takeover) is constructed using Barber and Lyon (1996) case controlmatching methodology. Controls are matched to the cases with the same 2-digit SIC, with ROA within 10% range ofthe case and assets within 30%. Because sample is matched based on ROA and size these two variables are notincluded in the regression. As before, the dependent variable is a dummy (Target) equal to one if the company is targetof an attempted unsolicited takeover. The key variable is Loan Intensity defined as cumulative credit line issued duringthe 3 years previous to the year of the analysis scaled by the total assets. The rest of the variables are the same as inTable 2. Sample includes all the firms that were target of unsolicited takeover and the control sample with validaccounting information in the same event year available in Compustat. The point estimates and Wald chi-squarestatistics for the year effects are not reported through they are included in the regression.
Model 1 2 3 4
Variable Coeff. Wald Coeff. WaldCoeff
.Wald Coeff. Wald
Industry dummy 0.13 1.0 0.12 0.8 0.14 1.0 0.13 0.8Sales growth (Adjusted) -0.07 0.2 -0.05 0.1 -0.07 0.2 -0.05 0.1Leverage -0.55 4.1 ** -0.29 1.1 -0.49 3.2 * -0.23 0.7Cash 0.52 1.5 0.64 2.3 0.56 1.8 0.68 2.6Market/Book Assets (Adjusted) -0.34 26.6 *** -0.35 27.5 *** -0.33 26.0 *** -0.34 26.9 ***
Asset Structure (PPE) 1.76 48.8 *** 1.86 53.3 *** 1.76 48.4 *** 1.86 52.6 ***
Institutional Blockholder ---- ---- 0.74 38.0 *** ---- ---- 0.74 37.6 ***
Loan intensity 0.10 5.7 ** 0.10 5.2 ** 0.10 5.4 ** 0.10 4.8 **
Bank Net ---- ---- ---- ---- 0.06 10.7 *** 0.06 11.4 ***
Observations 15,852 15,852 15,852 15,852Targets 328 328 328 328
*** Indicates p value of 1%** Indicates p value of 5%* Indicates p value of 10%

41
TABLE 5BANKS AS INFORMATION INTERMEDIARIES (H3)
This table presents results of the maximum likelihood estimates of the logit model for the Compustat based sample1992-2003. For the 359 unsolicited takeovers in the Compustat sample, we identified the acquirer in each and checkedif the acquirer had a lending relationship with the target’s bank and found 71 such cases. The dependent variable is adummy (Bank Link) assigned the value one if the company was a subject of an attempted unsolicited takeover by raiderwho is a client of the same bank. We consider a company to be a client of a particular bank if they had a lendingrelationship in the previous three years. Key explanatory variable is Loan Intensity defined as cumulative credit lineissued during the 3 years previous to the year of the analysis scaled by the total assets. Bank Net is total size of thebanks that have relationship with the company as measured by the number of different clients in the same industry.Bank Net is measured in a 3-year window and at any tier of syndication. Because larger loans tend to have largernumber of banks in the syndicate Bank Net is scaled by the total amount of loans issued to the company. Industrydummy is equal one if there was an unsolicited takeover in a firm’s 4-digit SIC industry in the year prior to the year ofobservation. ROA (Adjusted) is industry median adjusted return on assets. Sales growth (Adjusted) is industry medianadjusted annual rate of change in the firm’s net sales. Leverage is book debt to asset ratio. Cash is cash and short-terminvestments to assets ratio. Firm size is proxied by Ln(Equity), the natural logarithm of the market equity. Market/BookAssets (Adjusted) is the industry median adjusted ratio of market to book value of assets, where market assets are definedas total assets plus market value of common stock minus book common equity and differed taxes. PPE is property,plant and equipment to assets ratio. All independent variables are measure at the end of the fiscal year previous to thetakeover event. Sample includes all the firms that were target of unsolicited takeover and the control sample with validaccounting information in the same event year available in Compustat. The point estimates and Wald chi-squarestatistics for the year effects are not reported through they are included in the regression.
Model 1 2 3 4
Variable Coeff. Wald Coeff. Wald Coeff. Wald Coeff. Wald
Industry dummy -0.07 0.0 -0.24 0.3 -0.05 0.0 -0.22 0.2ROA (Adjusted) 0.51 0.4 0.33 0.1 0.34 0.2 0.18 0.0Sales growth (Adjusted) -0.54 2.4 -0.59 2.4 -0.55 2.6 -0.60 2.5Leverage 1.35 4.3 * 1.45 4.5 ** 1.30 4.1 ** 1.44 4.5 **
Cash -3.71 7.3 *** -3.44 6.1 ** -3.74 7.3 *** -3.38 5.9 **
Ln (Equity) 0.24 16.7 *** 0.24 12.2 *** 0.25 18.0 *** 0.25 13.4 ***
Market/Book Assets (Adjusted) -0.41 5.9 ** -0.50 6.5 *** -0.41 6.0 ** -0.52 6.9 ***
Asset Structure (PPE) -0.43 0.7 -0.20 0.1 -0.43 0.7 -0.18 0.1Institutional Blockholder ---- ---- 1.79 30.7 *** ---- ---- 1.79 30.7 ***
Loan intensity 0.33 8.0 *** 0.26 4.0 ** 0.32 7.7 *** 0.26 3.9 **
Bank Net ---- ---- ---- ---- 0.09 3.4 * 0.10 3.8 *
Observations 2,659 2,659 2,659 2,659Targets 71 71 71 71
*** Indicates p value of 1%** Indicates p value of 5%* Indicates p value of 10%

42
TABLE 6
PROBABILITY OF COMPLETION OF AN UNSOLICITED BID (H4)
This table presents results of the unvariate analysis of the probability of completion of an unsolicited bid in the sampleof 404 unsolicited targets identified in Comopustat between 1992-2003. The sample is divided into completed andincomplete bids. Among the 404 events that we detected in our sample, we find that 152 unsolicited attempts werecompleted and 252 attempts were not completed (withdrawn). Analyzed variables are: Industry dummy is equal one ifthere was an unsolicited takeover in a firm’s 4-digit SIC industry in the year prior to the year of observation. ROA(Adjusted) is industry median adjusted return on assets. Sales growth (Adjusted) is industry median adjusted annual rate ofchange in the firm’s net sales. Leverage is book debt to asset ratio. Cash is cash and short-term investments to assetsratio. Firm size is proxied by Ln(Equity), the natural logarithm of the market equity. Market/Book Assets (Adjusted) is theindustry median adjusted ratio of market to book value of assets, where market assets are defined as total assets plusmarket value of common stock minus book common equity and differed taxes. PPE is property, plant and equipment toassets ratio. Institutional Blockholder is a dummy variable assigned the value one if at least one institutional investorholds more than 5% of the companies stock and zero otherwise. Loan Intensity is a cumulative credit line issued duringthe 3 years previous to the year of the analysis scaled by the total assets. Bank Net is measured over past 3 years andscaled by the cumulative credit line. Bank Link assigned the value one if the company was a subject of an attemptedunsolicited takeover by raider who is a client of the same bank. We consider a company to be a client of a particularbank if they had a lending relationship in the previous three years. All variables are measure at the end of the yearprevious to the takeover event. Sample includes all the firms that were target of unsolicited takeover and the controlsample with valid accounting information in the same event year available in Compustat.
*** Indicates p value of 1%** Indicates p value of 5%* Indicates p value of 10%
Completed Withdrawn
Variable Mean Mean Diff. T-ratio
Industry dummy 0.28 0.22 0.05 1.23ROA (Adjusted) 0.00 -0.01 0.00 0.37Sales growth (Adjusted) 0.10 0.05 0.05 1.02Leverage 0.52 0.54 -0.02 -0.67Cash 0.14 0.14 0.01 0.30Ln (Equity) 4.77 4.71 0.07 0.35Market/Book Assets (Adjusted) -0.18 -0.07 -0.11 -1.11Asset Structure (PPE) 0.26 0.28 -0.02 -0.91Institutional Blockholder 0.66 0.64 0.03 0.52Loan intensity 0.30 0.17 0.13 2.46
**
Bank Net 0.80 0.60 0.20 0.91Bank Link 0.22 0.18 0.04 0.95
Observations 152 252

43
TABLE 7
MARKET REACTION TO BANK INVOLVEMENT IN TAKEOVERS
This table presents mean cumulative abnormal return for two sets of unsolicited takeovers identified usingCompustat between 1992-2003: (1) unsolicited takeovers where target and acquirer are clients of the samebank (BNKLINK=1) and (2) unsolicited takeovers where target and acquirer don’t interact with a commonbank (BNKLINK=0), where BNKLINK is a dummy variable assigned the value one if the company was asubject of an attempted unsolicited takeover by raider who is client of the same bank. A company is said tobe a client of a particular bank if in the previous three years it had loans issued by this bank. Event study isconducted using value weighted market model.
BNKLINK=1 BNKLINK=0
EventWindow
MeanCAR
T ratioMeanCAR
T ratio Diff. T-ratio
Panel A: Target’s stock reaction[-1; +1] 20.37% 8.32 *** 16.14% 13.66 *** 4.23% 1.56 *
[+2; +10] 0.55% 0.67 -0.08% -0.13 0.63% 0.61
Observations 79 322
Panel B: Acquirer’s stock reaction[-1; +1] -0.68% -0.88 -0.83% -1.47 * 0.15% 0.15
[+2; +10] -0.16% -0.19 -0.86% -1.08 0.69% 0.59
Observations 69 125
*** Indicates p value of 1%** Indicates p value of 5%* Indicates p value of 10%

44
TABLE 8
BANK ‘S MOTIVES, ACQUIRER AND TARGET PERFORMANCE
This table analyses bank’s motives for transmission of information by looking at the differences inperformance. Panel A presents differences in performance between target and bidder in the sub-samplewhere BNKLINK =1, that is where the company was a subject of an attempted unsolicited takeover byraider who is client of the same bank. Panel B presents differences in target performance for those caseswhere the company was a subject of an attempted unsolicited takeover by raider who is client of the samebank and for those cases where raider and target where not clients of the same bank. A company is said tobe a client of a particular bank if in the previous three years it had loans issued by this bank. ROA (Adj.)and ROE (Adj.) are the industry median adjusted return on assets and equity respectively. Net Profit Margin(Adj.) is the industry median adjusted ratio of income before extraordinary items to sales. Market/Book(Adj.) is the industry median adjusted ratio of market to book value of assets, where market assets aredefined as total assets plus market value of common stock minus book common equity and differed taxes.
PANEL A: BNKLNK=1 TARGET ACQUIRER
Mean T-ratio Mean T-ratio Diff. T-ratio
ROA (Adj.) 0.01 1.05 0.04 3.77 ** -0.03 -2.08 **
ROE (Adj.) -0.02 -0.53 0.06 2.94 *** -0.08 -1.86 **
Net Profit Margin (Adj.) -0.01 -0.30 0.05 3.72 *** -0.06 -2.55 ***
Market / Book (Adj.) -0.15 -1.72 ** 0.28 1.72 ** -0.43 -2.33 **
PANEL B: PERFORMANCE OF TARGETS
BNKLINK=1 BNKLINK=0
Mean T-ratio Mean T-ratio Diff. T-ratio
ROA (Adj.) 0.01 1.05 -0.01 -1.74 ** 0.02 1.85 *
ROE (Adj.) -0.02 -0.53 -0.16 -3.98 *** 0.14 2.47 **
Net Profit Margin (Adj.) -0.01 -0.30 -0.14 -3.10 *** 0.13 2.77 ***
Market / Book (Adj.) -0.15 -1.72 ** -0.10 -1.71 ** -0.05 -0.45
*** Indicates p value of 1%** Indicates p value of 5%* Indicates p value of 10%
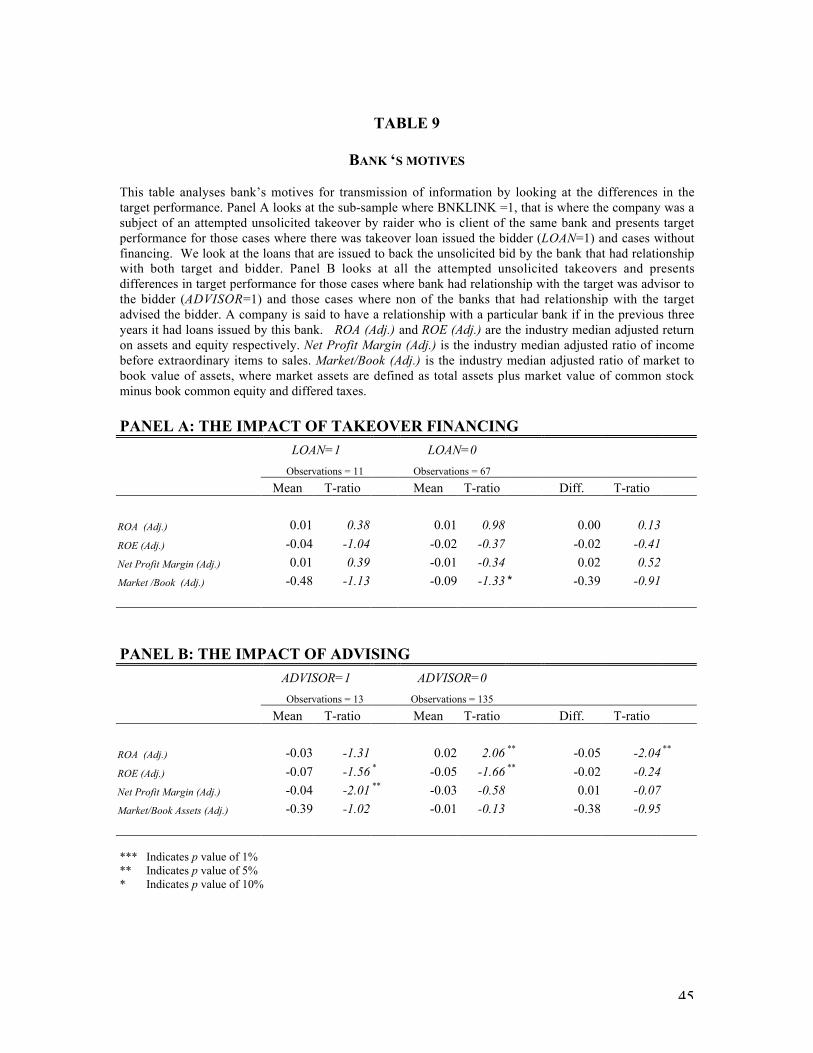
45
TABLE 9
BANK ‘S MOTIVES
This table analyses bank’s motives for transmission of information by looking at the differences in thetarget performance. Panel A looks at the sub-sample where BNKLINK =1, that is where the company was asubject of an attempted unsolicited takeover by raider who is client of the same bank and presents targetperformance for those cases where there was takeover loan issued the bidder (LOAN=1) and cases withoutfinancing. We look at the loans that are issued to back the unsolicited bid by the bank that had relationshipwith both target and bidder. Panel B looks at all the attempted unsolicited takeovers and presentsdifferences in target performance for those cases where bank had relationship with the target was advisor tothe bidder (ADVISOR=1) and those cases where non of the banks that had relationship with the targetadvised the bidder. A company is said to have a relationship with a particular bank if in the previous threeyears it had loans issued by this bank. ROA (Adj.) and ROE (Adj.) are the industry median adjusted returnon assets and equity respectively. Net Profit Margin (Adj.) is the industry median adjusted ratio of incomebefore extraordinary items to sales. Market/Book (Adj.) is the industry median adjusted ratio of market tobook value of assets, where market assets are defined as total assets plus market value of common stockminus book common equity and differed taxes.
PANEL A: THE IMPACT OF TAKEOVER FINANCING
LOAN=1 LOAN=0
Observations = 11 Observations = 67
Mean T-ratio Mean T-ratio Diff. T-ratio
ROA (Adj.) 0.01 0.38 0.01 0.98 0.00 0.13
ROE (Adj.) -0.04 -1.04 -0.02 -0.37 -0.02 -0.41
Net Profit Margin (Adj.) 0.01 0.39 -0.01 -0.34 0.02 0.52
Market /Book (Adj.) -0.48 -1.13 -0.09 -1.33 * -0.39 -0.91
PANEL B: THE IMPACT OF ADVISING
ADVISOR=1 ADVISOR=0
Observations = 13 Observations = 135
Mean T-ratio Mean T-ratio Diff. T-ratio
ROA (Adj.) -0.03 -1.31 0.02 2.06 ** -0.05 -2.04 **
ROE (Adj.) -0.07 -1.56 * -0.05 -1.66 ** -0.02 -0.24
Net Profit Margin (Adj.) -0.04 -2.01 ** -0.03 -0.58 0.01 -0.07
Market/Book Assets (Adj.) -0.39 -1.02 -0.01 -0.13 -0.38 -0.95
*** Indicates p value of 1%** Indicates p value of 5%* Indicates p value of 10%

The Rodney L. White Center for Financial Research The Wharton School
University of Pennsylvania 3254 Steinberg Hall-Dietrich Hall
3620 Locust Walk Philadelphia, PA 19104-6367
(215) 898-7616
(215) 573-8084 Fax http://finance.wharton.upenn.edu/~rlwctr
The Rodney L. White Center for Financial Research is one of the oldest financial research centers in the country. It was founded in 1969 through a grant from Oppenheimer & Company in honor of its late partner, Rodney L. White. The Center receives support from its endowment and from annual contributions from its Members. The Center sponsors a wide range of financial research. It publishes a working paper series and a reprint series. It holds an annual seminar, which for the last several years has focused on household financial decision making. The Members of the Center gain the opportunity to participate in innovative research to break new ground in the field of finance. Through their membership, they also gain access to the Wharton School’s faculty and enjoy other special benefits.
Members of the Center 2004 – 2005
Directing Members
Aronson + Johnson + Ortiz, LP Geewax, Terker & Company
Goldman, Sachs & Co. Hirtle, Callaghan & Co.
Morgan Stanley Merrill Lynch
The Nasdaq Educational Foundation The New York Stock Exchange, Inc.
Twin Capital
Founding Members
Ford Motor Company Fund Merrill Lynch, Pierce, Fenner & Smith, Inc.
Oppenheimer & Company Philadelphia National Bank
Salomon Brothers Weiss, Peck and Greer


