
www.esri.ie
Working Paper No. 370
January 2011
Shapley Values for Assessing Research Production and Impact of Schools and Scholars
Richard S.J. Tola,b,c,d
Abstract: Performance measures of individual scholars tend to ignore the context. I introduce contextualised metrics: cardinal and ordinal pseudo-Shapley values that measure a scholar’s contribution to (perhaps power over) her own school and her market value to other schools should she change job. I illustrate the proposed measures with business scholars and business schools in Ireland. Although conceptually superior, the power indicators imply a ranking of scholars within a school that is identical to the corresponding conventional performance measures. The market value indicators imply an identical ranking within schools and a very similar ranking between schools. The ordinal indices further contextualise performance measures and thus deviate further from the corresponding conventional indicators. As the ordinal measures are discontinuous by construction, a natural classification of scholars emerges. Averaged over schools, the market values offer little extra information over the corresponding production and impact measures. The ordinal power measure indicates the robustness or fragility of an institution’s place in the rank order. It is only weakly correlated with the concentration of publications and citations.
Key words: Rankings, individuals, departments
Corresponding Author: [email protected]
Acknowledgements: I am grateful to all who helped improve the database by checking their entries. I had useful discussions on this subject with Frances Ruane. a Economic and Social Research Institute, Dublin, Ireland b Institute for Environmental Studies, Vrije Universiteit, Amsterdam, The Netherlands c Department of Spatial Economics, Vrije Universiteit, Amsterdam, The Netherlands d Department of Economics, Trinity College, Dublin, Ireland
ESRI working papers represent un-refereed work-in-progress by researchers who are solely responsible for the content and any views expressed therein. Any comments on these papers will be welcome and should be sent to the author(s) by email. Papers may be downloaded for personal use only.

2
Shapley Values for Assessing Research Production and Impact of Schools and Scholars
1. Introduction
Measuring the academic quality of schools and scholars is now routine practice. Scholars
are ranked according to their output or citations to their work, typically with some
correction for quality. The ranking apart, scholars are evaluated without context, with in
reality scholars are affiliated to schools and part of communities. Schools are ranked
according to some aggregation of the scores of their members (Kalaitzidakis et al.
2003;Nederhof 2008;Nederhof and Noyons 1992;Zhu et al. 1991).1 However, some
institutions are carried by a single, exceptional individual, while other institutions have a
large number of good researchers (Crewe 1988). This has implications for the power
relations within an institution and for the robustness of its ranking to job mobility. The
contextualised performance indicators for individual scholars proposed in this paper,
when aggregated to schools, measure fragility and robustness of the performance of
schools. The proposed indices thus complement standard measures of academic quality.
The proposed measures are variations of standard ones in economics. The starting point is
the Shapley value (Shapley 1953), which measures the average contribution of an agent
to any coalition. Instead of any coalition, I use the existing schools. Value is measured
cardinally (i.e., the score of the school) and ordinally (i.e., the rank of the school). As far
as I know, I am the first to propose this.2
I use the normalised Herfindahl-Hirschman Index (HHI) to measure concentration
(Herfindahl 1951;Hirschman 1964).3 While not new (Cox and Chung 1991;Rubin and
Chang 2003), this is not common in the scientometric literature.4
1 Of course, university departments have wider responsibilities than research (Coronini and Mangematin 1999). 2 A search on Shapley in abstracts of papers published in Scientometrics returns nothing. 3 See (Lee 2010) for a discussion of alternative concentration measures.
3
While the new indicators constitute the main contribution of this paper, the application is
interesting too. I illustrate the new measures using data on business schools and business
scholars in Ireland. Business research is rarely evaluated (Harzing 2005;Hodder and
Hodder 2010;Hogan 1990;Kao and Pao 2009;Vieira and Teixeira 2010).
The paper continues as follows. Section 2 specifies the indicators and presents the data.
Section 3 applies this to business schools and business scholars in Ireland and discusses
the results. Section 4 concludes.
2. Methods and Data
2.1. Methods
Let us consider the number of publications P as an indicator for the production of a
scholar, and the number of citations C as an indicator for the quality or impact of the
research. These are standard indicators, but they are devoid of any context: The
performance of a scholar depends only on her own publications and citations.5 When
individual researchers are ranked according to these indicators, a context emerges – but
individuals are treated as independent of one another. In reality, however, scholars group
together in schools.
(Shapley 1953) introduced a measure for the contribution of an agent (scholar) to a
coalition (school). The Shapley value of an agent equals the average contribution of that
agent to any coalition. I here define the value of a coalition as the average number of
publications or citations. The contribution of a researcher is then the change in the
coalition’s value should this researcher leave or join the coalition. I only consider existing
institutions, rather than any coalition, and therefore refer to this indicator as a pseudo-
Shapley value. Following the convention in the analysis of cartels (d'Aspremont et al.
1983), I further assume that scholars make decisions independently of other scholars
about whether to change affiliation or retire.
4 A search on HHI in abstracts of papers published in Scientometrics returned one paper on research performance (Yang et al. 2010). 5 (de Witte and Rogge 2010) introduce a metric for publication efficiency which combines individual and environmental characteristics.
The pseudo-Shapley value S for the number of publications of a researcher r in institution
1 is defined as:
(1)
11 1
21 1
contribution to own school contribution to other schools
1 1:1 1= 1
⎡ ⎤⎡ ⎤ ⎛ ⎞⎛ ⎞= − − + + −⎢ ⎥⎢ ⎥ ⎜ ⎟⎜ ⎟− +⎝ ⎠ ⎝ ⎠⎣ ⎦ +⎣ ⎦
∑14444244443 1444442444443
Iir r
r ii i i
nn p pS p p pI n n I n n ip
where ni is the number of members of institution i, I is the number of institutions, and ip is
the average number of publications per researcher at institution i. Institutions can be
ordered at will so that (1) defines Sr for researcher in any school.
Equation (1) splits the pseudo-Shapley value into two components. The first component
is the actual indicator value for the school minus the indicator value in case scholar r
departs.6 The second component is the indicator value in case scholar r joins another
school minus the actual indicator value, averaged for the other schools.
The two components are more insightful that the pseudo-Shapley value itself. The first
component is a measure of the power of an individual scholar over her school. The
second component is a measure of the contribution a scholar would make to the
competition, that is, a measure of the market value.
Let us therefore define two new indicators, power P and market value M, as follows:
(2) 1
1 1
1 11
⎛ ⎞= −⎜ ⎟−⎝ ⎠
rr
pP pI n n
(3) 2
11=
−=
+∑I
r ir
i i
p pMI n
Note that Pr+Mr=Sr. Equation (2) equals the first component of Equation (1), and
Equation (3) its second component; in both cases, the equations were simplified.
Equations (1-3) are defined for publication numbers, but the same definitions hold for
citation numbers, or quality-weighted publication numbers, or indeed any individual
performance indicator that would be averaged to assess the school performance.
6 Note that in the definition of the Shapley value actors are not evaluated relative to an existing coalition structure. This is another reason why the proposed measure is a pseudo-Shapley value.
4

In Equations (1-3), the contribution of a scholar is defined as her contribution to an
indicator score of a school. One may also consider the contribution of a researcher to the
rank of any existing institution.7 This could be referred to as an ordinal pseudo-Shapley
value8 and it is split into an ordinal power indicator and an ordinal market indicator.
In fact, the ordinal power and market indicators contain more information than the
ordinal Shapley values. The ordinal Shapley value measures the change in rankings
should a scholar leave a school to join another. This would push one school up in the
rankings, and another one down. Indeed, the net change in rankings of all schools is zero.
In the application below, for individual scholars, I report the number of publications, the
number of citations, the cardinal power and market indicators (based on both publications
and citations), and the ordinal power and market indicators (based on both publications
and citations).
For schools, I report the average number of publication and citations, and the average
cardinal and ordinal power and market indicators.9 A high value of the average power
measure indicates that a few scholars contribute most of the publications or citations of a
school – because individual scholars would have low power over their school if all their
colleagues perform equally well.
I compare the school’s power indicator to the Herfindahl-Hirschman Index (HHI), which
is a standard measure for the concentration of market share. The HHI is defined as the
sum of the squared shares:
(4)
2
1 1
;= =
⎛ ⎞= =⎜ ⎟
⎝ ⎠∑ ∑
n ni
ii i
pHHI p pp
where pi is the number of publications (say) and n is the number of scholars (including
the ones that did not publish). The HHI lies between 1/n and one. The HHI would be one
if a single scholar authored all publications of a school (monopoly). The HHI would be
1/n if all scholars in a school published the same number of papers. Because institutions
differ in size, I use the normalized HHI: 7 This is intuitively clear, but notationally messy. I therefore skip the formalization. 8 I therefore refer to the indicators S, P, and M as cardinal pseudo-Shapley values. 9 Note that the average cardinal power indicators are included for completeness only. The cardinal power index is an individual’s contribution to the average. Its average is zero.
5

(5)
2min
min1min
1 1* ;1 =
− ⎛ ⎞= = ⎜ ⎟− ⎝ ⎠∑
n
i
HHI HHIHHI HHI =HHI n n
HHI* lies between zero and one, regardless of n.
There is no reason to assume that the HHI and the power indicator will yield similar
results. The HHI is quadratic in a scholar’s number of publications and inversely
proportional to the square of the school’s publications. The power indicator also increases
with a scholar’s publications and decreases with her school’s number, but the
relationships are linear. 2.2. Data
I illustrate the above indicators with business scholars and business schools on the island
of Ireland. Business schools are hard to define. Some universities have an entity called
“school of business”, but other institutions mix business studies with other disciplines, or
spread business studies over a number of schools. Table 1 shows, for each of the 11
institutions,10 the schools (colleges, faculties) and their departments (schools, groups).
There are two contentious issues. First, it is difficult to draw a line between business
studies and economics. The topics are closely connected and often taught together. This
study includes those economists who teach in business schools, but excludes other
economists. The other issue is tourism. In two institutions, tourist studies are part of the
business school, while elsewhere tourist studies are placed in other departments or indeed
in a separate department. Here, tourism scholars are included if they teach in a business
school.
For this study, business scholars are scholars who are employed in the business schools as
defined in Table 1. People were identified as listed on the websites in early September
2010. There is no reason to believe that these lists are accurate. Indeed, several errors
were uncovered (and corrected) during the data vetting process (see below). However, it
is the only source of information available.
10 There are also a number of business schools that only teach. These are excluded from the current study.
6

7
There are a total of 748 business scholars in Ireland. In addition, business schools employ
administrative staff, teaching and research assistants, and PhD students – all of whom
were excluded (if so identified). Business schools also have a large number of adjunct
faculty – typically, senior business people who teach a few classes a year – while some
business schools also host research staff from companies. These people were excluded
too.
748 is a substantial number of scholars, each of which has to be assessed individually.11
For that reason, a simple method is used. Data were collected from Scopus12 only. Scopus
has a much broader coverage than the Web of Science13 for recent years (but a limited
coverage before 1996). As Irish business scholars tend to be relatively young and tend to
publish outside the core journals, Scopus is a more appropriate source of data. See also
(Vieira and Gomes 2009). Nonetheless, some journals are not covered in Scopus,
including a number of particular importance to business scholars in Ireland (e.g.,
Administration, Irish Journal of Management, Irish Marketing Journal, Irish Marketing
Review). Google Scholar 14 (and thus Publish and Perish (Harzing 2010)15 and
Scholarometer16) has a wider coverage than Scopus and would thus be more appropriate
for business scholars (Mingers and Lipitakis 2010). However, Google Scholar suffers
from a lack of quality control on publications and citations.17
Four statistics were gathered from Scopus: year of first publication, number of
publications, number of citations, and h-index (Hirsch 2005). People’s name, affiliation,
specialization, degree, rank, and sex were also recorded. Here, I only use publications,
citations, and affiliations.
The data are available at:
https://docs.google.com/leaf?id=0Bz17rNCpfuDNNTA2MGZmNTQtZmYxNS00YTU3
LWI0ODItZmVjMDllYWFiY2Qw&hl=en 11 Note that the database contains another 124 individuals who were erroneously included. 12 http://www.scopus.com/home.url 13 http://www.isiwebofknowledge.com/ 14 http://scholar.google.com/ 15 http://www.harzing.com/pop.htm 16 http://scholarometer.indiana.edu/ 17 For instance, Publish and Perish returns over 500 papers for the current author, whose CV counts less than 200 publications.

8
The data have been cross-checked with CVs when online. Three preliminary versions of
the data were published at IrishEconomy18, with an explicit invitation to correct data
where needed. Heads of departments were all notified of the exercise and invited to
comment. This vetting process led to substantial changes in the data – people and indeed
departments were added; administrative, adjunct and trainee staff were removed; and
publication and citation records were corrected.
The actual performance of business schools and scholars is discussed in detail in a
companion paper (Tol 2010). I here focus on the information contained in the new
indicators.
3. Results
3.1. Scholars
Equation (2) has that the power indicator is linear in the number of publications or
citations, with the slope equal to the inverse of the number of schools times the number of
scholars in a school. The intercept equals the average number of publications or citations
in the school, divided by the number of schools. That is, both the intercept and the slope
are different between schools but identical within schools. Because of this, the power
ranking within schools is the same as the publication/citation ranking within schools.
Figure 1 shows the cardinal power indicators for the 748 business scholars in Ireland,
plotted against the number of publications and citations. Power over the own school
increases with production and influence, but the rate differs between schools. TCD is the
smallest school and has therefore the steepest incline. UU and DIT are the largest
schools, and the slope is thus the shallowest. Very productive or influential TCD scholars
therefore have a greater power than equally productive or influential UU scholars.
Figure 2 shows the ordinal power indices. The pattern is very different from that in
Figure 1. Rank changes are integer, so average rank changes are discontinuous. Like the
18 http://www.irisheconomy.ie/index.php/2010/10/18/assessing-business-schools-and-business-scholars/ http://www.irisheconomy.ie/index.php/2010/10/18/assessing-business-schools-and-business-scholars/ http://www.irisheconomy.ie/index.php/2010/11/01/business-schools-and-scholars-3/
9
cardinal power indicators, the ordinal power indicators increase in the number of
publications and citations. However, the context is much more important. While some
TCD scholars have a great impact on the score of their small school, TCD is so far ahead
of the other business schools that only one scholar could, by departing affect its ranking
on publications – and none could affect TCD’s ranking on citations. DCU’s performance,
on the other hand, is similar to some of its competitors and a number of DCU scholars
could affect its ranking by departure.
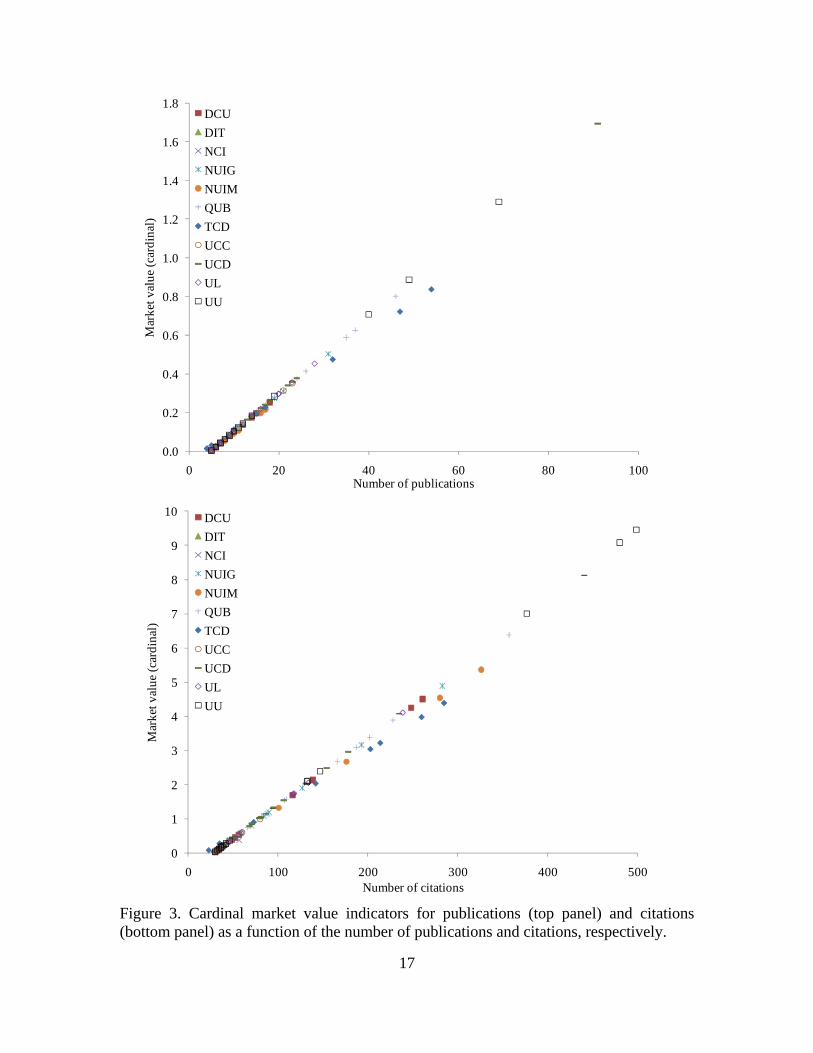
Equation (3) has that market value is linear in the number of publications or citations.
The intercept depends on the average number of publications or citations in all schools
but one’s own and on the number of scholars in those schools. The slope depends on the
number of scholars in other schools. One would therefore expect that all scholars are on
roughly the same line. Figure 3 confirms this: Market value rise linearly with the number
of either publications or citations, and there is little difference between schools. The slope
varies between 0.0165 for TCD (the smallest school) and 0.0202 for DIT (the largest
school). This is intuitive: Scholars from larger schools have fewer outside opportunities
and thus a greater impact. Differences are small, however.
Figure 4 shows the ordinal market value indicators. The indicator is discontinuous.
Market value increases with the number of publications and citations. However, scholars
from some schools need to publish more / be cited more to command the same market
value as do scholars of other schools. If a scholar moves from one school to another, the
impact on the ranking depends on her productivity / influence, the initial score and size of
either schools, and their position relative to other schools. With so many variables, the
pattern is highly non-linear and hard to interpret and predict.
Consider, for instance, the four scholars (one at NUIG, two at QUB, and one at UU) with
an ordinal market value based on publications of 0.64. Their publication numbers range
from 31 to 49. The discretisation of the ranking groups them together for a single market
value. There is another QUB scholar with an ordinal market value of 0.73 and 46
publications. He scores better than his QUB fellows with 35 and 37 papers. He also
scores better than the UU scholar with 49 publications. The reason is that ranks change if
the QUB scholar moves to UU; but not if the UU scholar moves to QUB. The market

10
value indicator captures part of the context in a way that simple publication or citation
numbers cannot. 3.2. Schools
Table 2 shows the performance indicators for the 11 business schools in Ireland. The
smallest school employs only 20 scholars, the largest 147. Average publication numbers
range from 0.2 to 10.9 published papers per scholar, and average citations from 0.7 to
63.3 citations per scholar.
The average cardinal power indicator is zero. The average ordinal power indicator ranges
from -2.28 to +2.22 for publications and from -4.81 to 0.07 for citations. A negative value
indicates that the school’s rank would improve if the average scholar departs. A positive
value indicates that the departure of the average scholar would lead to a lower rank – the
average scholar could use this threat to exert power. There are also schools with an
average power index of zero – that is, the departure of the average scholar would not
affect the ranking. Zero values are more prevalent near the top and bottom of the
publication and citation ranks, because ranks can change in one direction only.
Table 2 also shows the Herfindahl-Hirschman Indices which range from 0.03 to 0.24 for
publications and from 0.05 to 0.90 for citations. Citations are more concentrated than
publications, except for UCD.
Figure 5 plots the concentration indices against the power indices. Although there is a
suggestion of some relationship – greater concentration and greater power seem to go
together – the two indicators clearly measure different things. NCI, for instance, has an
extremely high concentration of citations. However, as NCI is ranked last on citations,
highly-cited researchers at NCI cannot exert any influence over NCI’s rank. Publications
are less concentrated at NCI, but as NCI is ranked 10th, the (threatened) departure of a
highly productive scholar would (potentially) affect NCI’s publication rank.
Table 2 further shows the average market value indicators, both cardinal and ordinal.
Figure 6 plots the market value indices against the number of publications and citations.
Cardinal market value is linear in the number. This is true for the individual scores (cf.
Figure 3), and therefore also for the average scores. Ordinal market value tends to
increase with the number, but a richer pattern emerges because ordinal values take

11
context into account. Figure 4 shows that there is a different association between
publications / citations and market value for scholars at different schools. Figure 6
confirms this.
4. Discussion and conclusion
Current performance measures of individual scholars ignore the context of scholarship. I
introduce pseudo-Shapley values that measure a scholar’s contribution to (or power over)
her own school and her value to other schools should they hire her. I illustrate the
proposed measures with business scholars and business schools in Ireland. Although
conceptually superior, the power indicators lead to an identical ranking of scholars within
a school as conventional performance measures would, while the market value indicators
lead to an identical ranking within schools and a very similar ranking between schools. I
introduce both cardinal and ordinal indicators. The ordinal indices further contextualise
performance measures and thus deviate more from conventional indicators. Furthermore,
as the ordinal measures are discontinuous by construction, a natural classification of
scholars emerges. Averaged over schools, the ordinal and particularly the cardinal market
values offer little extra information over the average publication and citation numbers.
The ordinal power measure gives, for the first time, an indication of the robustness or
fragility of an institution’s place in the rank order. It is only weakly correlated with the
Herfindal-Hirschman concentration index of publications and citations.
The proposed measures open up new avenues for research. Do scholars prefer to work in
schools in which they are powerful, or would they rather work in a place where their
average colleague outperforms them (so that they maximise learning)? This cannot be
answered with a cross-section (as used in this paper); panel data are required to separate
cause and effect. Is the ranking of fragile schools (according to the measures proposed
here) indeed more volatile? This would again require data for multiple years.
The measures themselves can be further refined too. Particularly, I used publications and
citations numbers for scholars, and their averages for schools. The mathematics is
therefore rather straightforward. The power and market value indicators could be defined
from more complex performance measures too, such as the h-index (Hirsch 2005).

12
Furthermore, I assume that scholars are individuals, and negotiate as such with their
schools. It is not uncommon, however, for a team of scholars to move from one school to
another. Pseudo-Shapley values naturally generalise to this case – indeed, the actual
Shapley value is defined for any coalition – but this was not considered here. All this is
deferred to future research.

13
Table 1. Business schools assessed in this study.
Acronym Institution School and department DCU Dublin City University Business School
• accounting • economics, finance and entrepreneurship • human resources management • management • marketing
DIT Dublin Institute of Technology College of Business • accounting and finance • management • marketing • retail and services management
NCI National College of Ireland School of Business NUIG National University of Ireland at Galway School of Business and Economics
• economics • accountancy, finance and information
systems • management • marketing
NUIM National University of Ireland at Maynooth
School of Business • management School of Economics, Finance and Accounting
QUB Queen’s University Belfast Management School TCD Trinity College Dublin School of Business UCC University College Cork Faculty of Commerce
• accounting and finance • business information systems • food business and development • management and marketing
UCD University College Dublin School of Business • accountancy • management information systems • industrial relations and human resources • marketing • management • banking and finance • corporate governance
UL University of Limerick Business School • accounting and finance • economics • management and marketing • personnel and employment relations
UU University of Ulster Business School • accounting • business, retail and financial services • hospitality and tourism management • international business • management • marketing, entrepreneurship and strategy
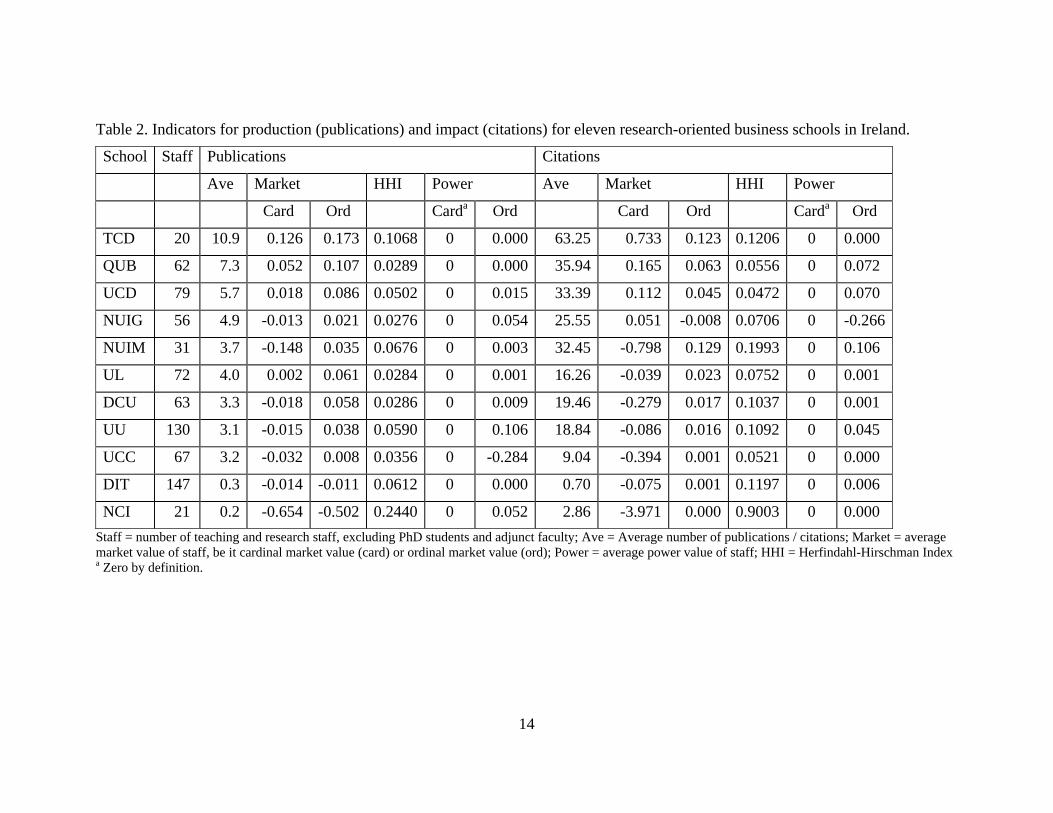
Table 2. Indicators for production (publications) and impact (citations) for eleven research-oriented business schools in Ireland.
School Staff Publications Citations
Ave Market HHI Power Ave Market HHI Power
Card Ord Carda Ord Card Ord Carda Ord
TCD 20 10.9 0.126 0.173 0.1068 0 0.000 63.25 0.733 0.123 0.1206 0 0.000
QUB 62 7.3 0.052 0.107 0.0289 0 0.000 35.94 0.165 0.063 0.0556 0 0.072
UCD 79 5.7 0.018 0.086 0.0502 0 0.015 33.39 0.112 0.045 0.0472 0 0.070
NUIG 56 4.9 -0.013 0.021 0.0276 0 0.054 25.55 0.051 -0.008 0.0706 0 -0.266
NUIM 31 3.7 -0.148 0.035 0.0676 0 0.003 32.45 -0.798 0.129 0.1993 0 0.106
UL 72 4.0 0.002 0.061 0.0284 0 0.001 16.26 -0.039 0.023 0.0752 0 0.001
DCU 63 3.3 -0.018 0.058 0.0286 0 0.009 19.46 -0.279 0.017 0.1037 0 0.001
UU 130 3.1 -0.015 0.038 0.0590 0 0.106 18.84 -0.086 0.016 0.1092 0 0.045
UCC 67 3.2 -0.032 0.008 0.0356 0 -0.284 9.04 -0.394 0.001 0.0521 0 0.000
DIT 147 0.3 -0.014 -0.011 0.0612 0 0.000 0.70 -0.075 0.001 0.1197 0 0.006
NCI 21 0.2 -0.654 -0.502 0.2440 0 0.052 2.86 -3.971 0.000 0.9003 0 0.000 Staff = number of teaching and research staff, excluding PhD students and adjunct faculty; Ave = Average number of publications / citations; Market = average market value of staff, be it cardinal market value (card) or ordinal market value (ord); Power = average power value of staff; HHI = Herfindahl-Hirschman Index
a Zero by definition.
14

-0.10
-0.05
0.00
0.05
0.10
0.15
0.20
0.25
0 20 40 60 80 1
Pow
er o
ver o
wn
scho
ol (c
ardi
nal)
Number of publications
00
DCUDITNCINUIGNUIMQUBTCDUCCUCDULUU
-0.4
-0.2
0.0
0.2
0.4
0.6
0.8
1.0
1.2
0 100 200 300 400 500
Pow
er o
ver o
wn
scho
ol (c
ardi
nal)
Number of citations
DCUDITNCINUIGNUIMQUBTCDUCCUCDULUU
Figure 1. Cardinal power indicators for publications (top panel) and citations (bottom panel) as a function of the number of publications and citations, respectively.
15

-1.0
-0.5
0.0
0.5
1.0
1.5
2.0
0 20 40 60 80 1Pow
er o
ver o
wn
scho
ol (o
rdin
al)
Number of publications
00
DCUDITNCINUIGNUIMQUBTCDUCCUCDULUU
-1.0
-0.5
0.0
0.5
1.0
1.5
2.0
0 100 200 300 400 500Pow
er o
ver o
wn
scho
ol (o
rdin
al)
Number of citations
DCUDITNCINUIGNUIMQUBTCDUCCUCDULUU
Figure 2. Ordinal power indicators for publications (top panel) and citations (bottom panel) as a function of the number of publications and citations, respectively.
16
0.0
0.2
0.4
0.6
0.8
1.0
1.2
1.4
1.6
1.8
0 20 40 60 80
Mar
ket v
alue
(car
dina
l)
Number of publications100
DCUDITNCINUIGNUIMQUBTCDUCCUCDULUU
0
1
2
3
4
5
6
7
8
9
10
0 100 200 300 400 500
Mar
ket v
alue
(car
dina
l)
Number of citations
DCUDITNCINUIGNUIMQUBTCDUCCUCDULUU
Figure 3. Cardinal market value indicators for publications (top panel) and citations (bottom panel) as a function of the number of publications and citations, respectively.
17

0.0
0.2
0.4
0.6
0.8
1.0
1.2
1.4
1.6
1.8
2.0
0 20 40 60 80
Mar
ket v
alue
(ord
inal
)
Number of publications100
DCUDITNCINUIGNUIMQUBTCDUCCUCDULUU
0.0
0.2
0.4
0.6
0.8
1.0
1.2
1.4
0 100 200 300 400 500
Mar
ket v
alue
(ord
inal
)
Number of citations
DCUDITNCINUIGNUIMQUBTCDUCCUCDULUU
Figure 4. Ordinal market value indicators for publications (top panel) and citations (bottom panel) as a function of the number of publications and citations, respectively.
18

0.0
0.2
0.4
0.6
0.8
1.0
0.00
0.05
0.10
0.15
0.20
0.25
-0.60 -0.50 -0.40 -0.30 -0.20 -0.10 0.00 0.10 0.20 0.30
Con
cent
ratio
n of
cita
tions
Con
cent
ratio
n of
pub
licat
ions
Average power over own school
PublicationsCitations
Figure 5. The Herfindahl-Hirschman Index of concentration of publications (left axis) and citations (right axis) as a function of the average power indicator.
19

-0.10
-0.05
0.00
0.05
0.10
0.15
0.20
-0.10
-0.05
0.00
0.05
0.10
0.15
0.20
0 2 4 6 8 10 12
Mar
ket v
alue
Average number of publications
CardinalOrdinal
-0.12
-0.08
-0.04
0.00
0.04
0.08
0.12
0.16
-0.6
-0.4
-0.2
0.0
0.2
0.4
0.6
0.8
0 10 20 30 40 50 60 70
Mar
ket v
alue
Average number of citations
CardinalOrdinal
Figure 6. The average market value (cardinal – left axis; ordinal – right axis) as a function of the number of publications (top panel) and citations (bottom panel).
20

21
References Coronini, R. and V.Mangematin (1999), 'From individual scientific visibility to collective competencies: The example of an academic department in the social sciences', Scientometrics, 45, (1), pp. 55-80.
Cox, R.A.K. and K.H.Chung (1991), 'Patterns of research output and author concentration in the economics literature', Review of Economics and Statistics, 73, (4), pp. 740-747.
Crewe, I. (1988), 'Reputation, research and reality: The publication records of UK departments of politics, 1978-1984', Scientometrics, 14, (3-4), pp. 235-250.
d'Aspremont, C., A.Jacquemin, J.J.Gabszewicz, and J.A.Weymark (1983), 'On the Stability of Collusive Price Leadership', Canadian Journal of Economics, 16, (1), 17-25.
de Witte, K. and N.Rogge (2010), 'To publish or not to publish? On the aggregation and drivers of research performance', Scientometrics, 85, (3), pp. 657-680.
Harzing, A.-W. (2005), 'Australian Research Output in Economics and Business: High Output, Low Impact?', Australian Journal of Management, 30, (2), 183-200.
Harzing, A.-W. (2010), The Publish or Perish Book -- Tour Guide to Effective and Responsible Citation Analysis Tarma Software Research, Melbourne.
Herfindahl, O. C. (1951), Concentration in the Steel Industry, PhD Thesis, Department of Economics, Colombia University.
Hirsch, J.E. (2005), 'An Index to Quantify an Individual's Scientific Research Output', Proceedings of the National Academy of Science, 102, 16569-16572.
Hirschman, A.O. (1964), 'The paternity of an index', American Economic Review, 54, (5), p. 761.
Hodder, A.P.W. and C.Hodder (2010), 'Research culture and New Zealand's performance-based research fund: Some insights from bibliographic compilations of research outputs', Scientometrics, 84, (3), pp. 887-901.
Hogan, T.J. (1990), 'A measure of accounting faculties and doctoral programs', Scientometrics, 19, (3-4), pp. 207-221.
Kalaitzidakis, P., T.P.Mamuneas, and T.Stengos (2003), 'Rankings of Academic Journals and Institutions in Economics', Journal of the European Economic Association, 1, (6), 1346-1366.
Kao, C. and H.L.Pao (2009), 'An evaluation of research performance in management of 168 Taiwan universities', Scientometrics, 78, (2), pp. 261-277.
Lee, G.J. (2010), 'Assessing publication performance of research units: Extensions through operational research and economic techniques', Scientometrics, 84, (3), pp. 717-734.

22
Mingers, J. and E.A.E.C.Lipitakis (2010), 'Counting the citations: A comparison of Web of Science and Google Scholar in the field of business and management', Scientometrics, 85, (2), pp. 613-625.
Nederhof, A.J. (2008), 'Policy impact of bibliometric rankings of research performance of departments and individuals in economics', Scientometrics, 74, (1), pp. 163-174.
Nederhof, A.J. and E.C.M.Noyons (1992), 'Assessment of the international standing of university departments' research: A comparison of bibliometric methods', Scientometrics, 24, (3), pp. 393-404.
Rubin, R.M. and C.F.Chang (2003), 'A bibliometric analysis of health economics articles in the economics literature: 1991-2000', Health Economics, 12, (5), pp. 403-414.
Shapley, L.S. (1953), 'A value for n-person games', in Contributions to the Theory of Games, Volume II, vol. 28 H.W. Kuhn and A.W. Tucker (eds.), Princeton University Press, Princeton, pp. 307-317.
Tol, R.S.J. (2010), The research output of business schools and business scholars in Ireland, Working Paper 364 ,Economic and Social Research Institute, Dublin.
Vieira, E.S. and J.A.N.F.Gomes (2009), 'A comparison of Scopus and Web of science for a typical university', Scientometrics, 81, (2), pp. 587-600.
Vieira, P.C. and A.A.C.Teixeira (2010), 'Are finance, management, and marketing autonomous fields of scientific research? An analysis based on journal citations', Scientometrics, 85, (3), pp. 627-646.
Yang, S., F.Ma, Y.Song, and J.Qiu (2010), 'A longitudinal analysis of citation distribution breadth for Chinese scholars', Scientometrics, 85, (3), pp. 755-765.
Zhu, J., A.J.Meadows, and G.Mason (1991), 'Citations and departmental research ratings', Scientometrics, 21, (2), pp. 171-179.
23
Year Number
Title/Author(s)
ESRI Authors/Co-authors Italicised
2011
369 Determinants of Vegetarianism and Partial Vegetarianism
in Ireland Eimear Leahy, Seán Lyons, Richard S.J. Tol
368 Modified Ramsey Discounting for Climate Change Richard S.J. Tol 367 A Cost-Benefit Analysis of the EU 20/20/2020 Package Richard S.J. Tol 366 The Distributional Effects of Value Added Tax in Ireland
Eimear Leahy, Seán Lyons, Richard S.J. Tol 2010 365 Explaining International Differences in Rates of
Overeducation in Europe Maria A. Davia, Seamus McGuinness and Philip, J.
O’Connell
364 The Research Output of Business Schools and Business Scholars in Ireland
Richard S.J. Tol 363 The Effects of the Internationalisation of Firms on
Innovation and Productivity Iulia Siedschlag, Xiaoheng Zhang and Brian Cahill
362 Too much of a good thing? Gender, ‘Concerted cultivation’
and unequal achievement in primary education Selina McCoy, Delma Byrne, Joanne Banks
361 Timing and Determinants of Local Residential Broadband Adoption: Evidence from Ireland
Seán Lyons 360 Determinants of Vegetarianism and Partial Vegetarianism
in the United Kingdom Eimear Leahy, Seán Lyons and Richard S.J. Tol

24
359 From Data to Policy Analysis: Tax-Benefit Modelling using SILC 2008 Tim Callan, Claire Keane, John R. Walsh and Marguerita Lane
358 Towards a Better and Sustainable Health Care System – Resource Allocation and Financing Issues for Ireland Frances Ruane
357 An Estimate of the Value of Lost Load for Ireland Eimear Leahy and Richard S.J. Tol 356 Public Policy Towards the Sale of State Assets in Troubled
Times: Lessons from the Irish Experience Paul K Gorecki, Sean Lyons and Richard S. J. Tol 355 The Impact of Ireland’s Recession on the Labour Market
Outcomes of its Immigrants Alan Barrett and Elish Kelly 354 Research and Policy Making Frances Ruane 353 Market Regulation and Competition; Law in Conflict: A
View from Ireland, Implications of the Panda Judgment Philip Andrews and Paul K Gorecki 352 Designing a property tax without property values: Analysis
in the case of Ireland Karen Mayor, Seán Lyons and Richard S.J. Tol 351 Civil War, Climate Change and Development: A Scenario
Study for Sub-Saharan Africa Conor Devitt and Richard S.J. Tol 350 Regulating Knowledge Monopolies: The Case of the IPCC Richard S.J. Tol 349 The Impact of Tax Reform on New Car Purchases in
Ireland Hugh Hennessy and Richard S.J. Tol 348 Climate Policy under Fat-Tailed Risk:
An Application of FUND David Anthoff and Richard S.J. Tol 347 Corporate Expenditure on Environmental Protection Stefanie A. Haller and Liam Murphy

25
346 Female Labour Supply and Divorce: New Evidence from Ireland
Olivier Bargain, Libertad González, Claire Keane and Berkay Özcan
345 A Statistical Profiling Model of Long-Term Unemployment
Risk in Ireland Philip J. O’Connell, Seamus McGuinness, Elish Kelly 344 The Economic Crisis, Public Sector Pay, and the Income
Distribution Tim Callan, Brian Nolan (UCD) and John Walsh 343 Estimating the Impact of Access Conditions on
Service Quality in Post Gregory Swinand, Conor O’Toole and Seán Lyons 342 The Impact of Climate Policy on Private Car Ownership in
Ireland Hugh Hennessy and Richard S.J. Tol 341 National Determinants of Vegetarianism Eimear Leahy, Seán Lyons and Richard S.J. Tol 340 An Estimate of the Number of Vegetarians in the World Eimear Leahy, Seán Lyons and Richard S.J. Tol 339 International Migration in Ireland, 2009 Philip J O’Connell and Corona Joyce 338 The Euro Through the Looking-Glass:
Perceived Inflation Following the 2002 Currency Changeover
Pete Lunn and David Duffy 337 Returning to the Question of a Wage Premium for
Returning Migrants Alan Barrett and Jean Goggin 2009 336 What Determines the Location Choice of Multinational
Firms in the ICT Sector? Iulia Siedschlag, Xiaoheng Zhang, Donal Smith 335 Cost-benefit analysis of the introduction of weight-based
charges for domestic waste – West Cork’s experience Sue Scott and Dorothy Watson 334 The Likely Economic Impact of Increasing Investment in

26
Wind on the Island of Ireland Conor Devitt, Seán Diffney, John Fitz Gerald, Seán Lyons
and Laura Malaguzzi Valeri 333 Estimating Historical Landfill Quantities to Predict Methane
Emissions Seán Lyons, Liam Murphy and Richard S.J. Tol 332 International Climate Policy and Regional Welfare Weights Daiju Narita, Richard S. J. Tol, and David Anthoff 331 A Hedonic Analysis of the Value of Parks and
Green Spaces in the Dublin Area Karen Mayor, Seán Lyons, David Duffy and Richard S.J. Tol 330 Measuring International Technology Spillovers and
Progress Towards the European Research Area Iulia Siedschlag 329 Climate Policy and Corporate Behaviour Nicola Commins, Seán Lyons, Marc Schiffbauer, and
Richard S.J. Tol 328 The Association Between Income Inequality and Mental
Health: Social Cohesion or Social Infrastructure Richard Layte and Bertrand Maître 327 A Computational Theory of Exchange:
Willingness to pay, willingness to accept and the endowment effect
Pete Lunn and Mary Lunn 326 Fiscal Policy for Recovery John Fitz Gerald 325 The EU 20/20/2020 Targets: An Overview of the EMF22
Assessment Christoph Böhringer, Thomas F. Rutherford, and Richard
S.J. Tol 324 Counting Only the Hits? The Risk of Underestimating the
Costs of Stringent Climate Policy Massimo Tavoni, Richard S.J. Tol 323 International Cooperation on Climate Change Adaptation
from an Economic Perspective Kelly C. de Bruin, Rob B. Dellink and Richard S.J. Tol

27
322 What Role for Property Taxes in Ireland? T. Callan, C. Keane and J.R. Walsh 321 The Public-Private Sector Pay Gap in Ireland: What Lies
Beneath? Elish Kelly, Seamus McGuinness, Philip O’Connell 320 A Code of Practice for Grocery Goods Undertakings and An
Ombudsman: How to Do a Lot of Harm by Trying to Do a Little Good
Paul K Gorecki 319 Negative Equity in the Irish Housing Market David Duffy 318 Estimating the Impact of Immigration on Wages in Ireland Alan Barrett, Adele Bergin and Elish Kelly 317 Assessing the Impact of Wage Bargaining and Worker
Preferences on the Gender Pay Gap in Ireland Using the National Employment Survey 2003
Seamus McGuinness, Elish Kelly, Philip O’Connell, Tim Callan
316 Mismatch in the Graduate Labour Market Among
Immigrants and Second-Generation Ethnic Minority Groups Delma Byrne and Seamus McGuinness 315 Managing Housing Bubbles in Regional Economies under
EMU: Ireland and Spain Thomas Conefrey and John Fitz Gerald 314 Job Mismatches and Labour Market Outcomes Kostas Mavromaras, Seamus McGuinness, Nigel O’Leary,
Peter Sloane and Yin King Fok 313 Immigrants and Employer-provided Training Alan Barrett, Séamus McGuinness, Martin O’Brien
and Philip O’Connell 312 Did the Celtic Tiger Decrease Socio-Economic Differentials
in Perinatal Mortality in Ireland? Richard Layte and Barbara Clyne 311 Exploring International Differences in Rates of Return to
Education: Evidence from EU SILC Maria A. Davia, Seamus McGuinness and Philip, J.
O’Connell

28
310 Car Ownership and Mode of Transport to Work in Ireland Nicola Commins and Anne Nolan 309 Recent Trends in the Caesarean Section Rate in Ireland
1999-2006 Aoife Brick and Richard Layte 308 Price Inflation and Income Distribution Anne Jennings, Seán Lyons and Richard S.J. Tol 307 Overskilling Dynamics and Education Pathways Kostas Mavromaras, Seamus McGuinness, Yin King Fok 306 What Determines the Attractiveness of the European Union
to the Location of R&D Multinational Firms? Iulia Siedschlag, Donal Smith, Camelia Turcu, Xiaoheng
Zhang 305 Do Foreign Mergers and Acquisitions Boost Firm
Productivity? Marc Schiffbauer, Iulia Siedschlag, Frances Ruane 304 Inclusion or Diversion in Higher Education in the Republic
of Ireland? Delma Byrne 303 Welfare Regime and Social Class Variation in Poverty and
Economic Vulnerability in Europe: An Analysis of EU-SILC Christopher T. Whelan and Bertrand Maître 302 Understanding the Socio-Economic Distribution and
Consequences of Patterns of Multiple Deprivation: An Application of Self-Organising Maps
Christopher T. Whelan, Mario Lucchini, Maurizio Pisati and Bertrand Maître
301 Estimating the Impact of Metro North Edgar Morgenroth 300 Explaining Structural Change in Cardiovascular Mortality in
Ireland 1995-2005: A Time Series Analysis Richard Layte, Sinead O’Hara and Kathleen Bennett 299 EU Climate Change Policy 2013-2020: Using the Clean
Development Mechanism More Effectively Paul K Gorecki, Seán Lyons and Richard S.J. Tol 298 Irish Public Capital Spending in a Recession

29
Edgar Morgenroth 297 Exporting and Ownership Contributions to Irish
Manufacturing Productivity Growth Anne Marie Gleeson, Frances Ruane 296 Eligibility for Free Primary Care and Avoidable
Hospitalisations in Ireland Anne Nolan 295 Managing Household Waste in Ireland:
Behavioural Parameters and Policy Options John Curtis, Seán Lyons and Abigail O’Callaghan-Platt 294 Labour Market Mismatch Among UK Graduates;
An Analysis Using REFLEX Data Seamus McGuinness and Peter J. Sloane 293 Towards Regional Environmental Accounts for Ireland Richard S.J. Tol , Nicola Commins, Niamh Crilly, Sean
Lyons and Edgar Morgenroth 292 EU Climate Change Policy 2013-2020: Thoughts on
Property Rights and Market Choices Paul K. Gorecki, Sean Lyons and Richard S.J. Tol 291 Measuring House Price Change David Duffy 290 Intra-and Extra-Union Flexibility in Meeting the European
Union’s Emission Reduction Targets Richard S.J. Tol 289 The Determinants and Effects of Training at Work:
Bringing the Workplace Back In Philip J. O’Connell and Delma Byrne 288 Climate Feedbacks on the Terrestrial Biosphere and the
Economics of Climate Policy: An Application of FUND Richard S.J. Tol 287 The Behaviour of the Irish Economy: Insights from the
HERMES macro-economic model Adele Bergin, Thomas Conefrey, John FitzGerald and Ide
Kearney 286 Mapping Patterns of Multiple Deprivation Using
Self-Organising Maps: An Application to EU-SILC Data for

30
Ireland Maurizio Pisati, Christopher T. Whelan, Mario Lucchini and
Bertrand Maître 285 The Feasibility of Low Concentration Targets:
An Application of FUND Richard S.J. Tol 284 Policy Options to Reduce Ireland’s GHG Emissions
Instrument choice: the pros and cons of alternative policy instruments
Thomas Legge and Sue Scott 283 Accounting for Taste: An Examination of Socioeconomic
Gradients in Attendance at Arts Events Pete Lunn and Elish Kelly 282 The Economic Impact of Ocean Acidification on Coral Reefs Luke M. Brander, Katrin Rehdanz, Richard S.J. Tol, and
Pieter J.H. van Beukering 281 Assessing the impact of biodiversity on tourism flows: A
model for tourist behaviour and its policy implications Giulia Macagno, Maria Loureiro, Paulo A.L.D. Nunes and
Richard S.J. Tol 280 Advertising to boost energy efficiency: the Power of One
campaign and natural gas consumption Seán Diffney, Seán Lyons and Laura Malaguzzi Valeri 279 International Transmission of Business Cycles Between
Ireland and its Trading Partners Jean Goggin and Iulia Siedschlag 278 Optimal Global Dynamic Carbon Taxation David Anthoff 277 Energy Use and Appliance Ownership in Ireland Eimear Leahy and Seán Lyons 276 Discounting for Climate Change David Anthoff, Richard S.J. Tol and Gary W. Yohe 275 Projecting the Future Numbers of Migrant Workers in the
Health and Social Care Sectors in Ireland Alan Barrett and Anna Rust 274 Economic Costs of Extratropical Storms under Climate

31
Change: An application of FUND Daiju Narita, Richard S.J. Tol, David Anthoff 273 The Macro-Economic Impact of Changing the Rate of
Corporation Tax Thomas Conefrey and John D. Fitz Gerald 272 The Games We Used to Play
An Application of Survival Analysis to the Sporting Life-course
Pete Lunn 2008 271 Exploring the Economic Geography of Ireland Edgar Morgenroth 270 Benchmarking, Social Partnership and Higher
Remuneration: Wage Settling Institutions and the Public-Private Sector Wage Gap in Ireland
Elish Kelly, Seamus McGuinness, Philip O’Connell 269 A Dynamic Analysis of Household Car Ownership in Ireland Anne Nolan 268 The Determinants of Mode of Transport to Work in the
Greater Dublin Area Nicola Commins and Anne Nolan 267 Resonances from Economic Development for Current
Economic Policymaking Frances Ruane 266 The Impact of Wage Bargaining Regime on Firm-Level
Competitiveness and Wage Inequality: The Case of Ireland Seamus McGuinness, Elish Kelly and Philip O’Connell 265 Poverty in Ireland in Comparative European Perspective Christopher T. Whelan and Bertrand Maître 264 A Hedonic Analysis of the Value of Rail Transport in the
Greater Dublin Area Karen Mayor, Seán Lyons, David Duffy and Richard S.J. Tol 263 Comparing Poverty Indicators in an Enlarged EU Christopher T. Whelan and Bertrand Maître 262 Fuel Poverty in Ireland: Extent,
Affected Groups and Policy Issues

32
Sue Scott, Seán Lyons, Claire Keane, Donal McCarthy and Richard S.J. Tol
261 The Misperception of Inflation by Irish Consumers David Duffy and Pete Lunn 260 The Direct Impact of Climate Change on Regional Labour
Productivity Tord Kjellstrom, R Sari Kovats, Simon J. Lloyd, Tom Holt,
Richard S.J. Tol 259 Damage Costs of Climate Change through Intensification of
Tropical Cyclone Activities: An Application of FUND
Daiju Narita, Richard S. J. Tol and David Anthoff 258 Are Over-educated People Insiders or Outsiders?
A Case of Job Search Methods and Over-education in UK Aleksander Kucel, Delma Byrne 257 Metrics for Aggregating the Climate Effect of Different
Emissions: A Unifying Framework Richard S.J. Tol, Terje K. Berntsen, Brian C. O’Neill, Jan S.
Fuglestvedt, Keith P. Shine, Yves Balkanski and Laszlo Makra
256 Intra-Union Flexibility of Non-ETS Emission Reduction
Obligations in the European Union Richard S.J. Tol 255 The Economic Impact of Climate Change Richard S.J. Tol 254 Measuring International Inequity Aversion Richard S.J. Tol 253 Using a Census to Assess the Reliability of a National
Household Survey for Migration Research: The Case of Ireland
Alan Barrett and Elish Kelly 252 Risk Aversion, Time Preference, and the Social Cost of
Carbon David Anthoff, Richard S.J. Tol and Gary W. Yohe 251 The Impact of a Carbon Tax on Economic Growth and
Carbon Dioxide Emissions in Ireland Thomas Conefrey, John D. Fitz Gerald, Laura Malaguzzi

33
Valeri and Richard S.J. Tol 250 The Distributional Implications of a Carbon Tax in Ireland Tim Callan, Sean Lyons, Susan Scott, Richard S.J. Tol and
Stefano Verde 249 Measuring Material Deprivation in the Enlarged EU Christopher T. Whelan, Brian Nolan and Bertrand Maître 248 Marginal Abatement Costs on Carbon-Dioxide Emissions: A
Meta-Analysis Onno Kuik, Luke Brander and Richard S.J. Tol 247 Incorporating GHG Emission Costs in the Economic
Appraisal of Projects Supported by State Development Agencies
Richard S.J. Tol and Seán Lyons 246 A Carton Tax for Ireland Richard S.J. Tol, Tim Callan, Thomas Conefrey, John D. Fitz
Gerald, Seán Lyons, Laura Malaguzzi Valeri and Susan Scott
245 Non-cash Benefits and the Distribution of Economic
Welfare Tim Callan and Claire Keane 244 Scenarios of Carbon Dioxide Emissions from Aviation Karen Mayor and Richard S.J. Tol 243 The Effect of the Euro on Export Patterns: Empirical
Evidence from Industry Data Gavin Murphy and Iulia Siedschlag 242 The Economic Returns to Field of Study and Competencies
Among Higher Education Graduates in Ireland Elish Kelly, Philip O’Connell and Emer Smyth 241 European Climate Policy and Aviation Emissions Karen Mayor and Richard S.J. Tol 240 Aviation and the Environment in the Context of the EU-US
Open Skies Agreement Karen Mayor and Richard S.J. Tol 239 Yuppie Kvetch? Work-life Conflict and Social Class in
Western Europe Frances McGinnity and Emma Calvert

34
238 Immigrants and Welfare Programmes: Exploring the
Interactions between Immigrant Characteristics, Immigrant Welfare Dependence and Welfare Policy
Alan Barrett and Yvonne McCarthy 237 How Local is Hospital Treatment? An Exploratory Analysis
of Public/Private Variation in Location of Treatment in Irish Acute Public Hospitals
Jacqueline O’Reilly and Miriam M. Wiley 236 The Immigrant Earnings Disadvantage Across the Earnings
and Skills Distributions: The Case of Immigrants from the EU’s New Member States in Ireland
Alan Barrett, Seamus McGuinness and Martin O’Brien 235 Europeanisation of Inequality and European Reference
Groups Christopher T. Whelan and Bertrand Maître 234 Managing Capital Flows: Experiences from Central and
Eastern Europe Jürgen von Hagen and Iulia Siedschlag 233 ICT Diffusion, Innovation Systems, Globalisation and
Regional Economic Dynamics: Theory and Empirical Evidence
Charlie Karlsson, Gunther Maier, Michaela Trippl, Iulia Siedschlag, Robert Owen and Gavin Murphy
232 Welfare and Competition Effects of Electricity
Interconnection between Great Britain and Ireland Laura Malaguzzi Valeri 231 Is FDI into China Crowding Out the FDI into the European
Union? Laura Resmini and Iulia Siedschlag 230 Estimating the Economic Cost of Disability in Ireland John Cullinan, Brenda Gannon and Seán Lyons 229 Controlling the Cost of Controlling the Climate: The Irish
Government’s Climate Change Strategy Colm McCarthy, Sue Scott 228 The Impact of Climate Change on the Balanced-Growth-
Equivalent: An Application of FUND David Anthoff, Richard S.J. Tol

35
227 Changing Returns to Education During a Boom? The Case
of Ireland Seamus McGuinness, Frances McGinnity, Philip O’Connell 226 ‘New’ and ‘Old’ Social Risks: Life Cycle and Social Class
Perspectives on Social Exclusion in Ireland Christopher T. Whelan and Bertrand Maître 225 The Climate Preferences of Irish Tourists by Purpose of
Travel Seán Lyons, Karen Mayor and Richard S.J. Tol 224 A Hirsch Measure for the Quality of Research Supervision,
and an Illustration with Trade Economists Frances P. Ruane and Richard S.J. Tol 223 Environmental Accounts for the Republic of Ireland: 1990-
2005 Seán Lyons, Karen Mayor and Richard S.J. Tol 2007 222 Assessing Vulnerability of Selected Sectors under
Environmental Tax Reform: The issue of pricing power J. Fitz Gerald, M. Keeney and S. Scott 221 Climate Policy Versus Development Aid
Richard S.J. Tol 220 Exports and Productivity – Comparable Evidence for 14
Countries The International Study Group on Exports and Productivity 219 Energy-Using Appliances and Energy-Saving Features:
Determinants of Ownership in Ireland Joe O’Doherty, Seán Lyons and Richard S.J. Tol 218 The Public/Private Mix in Irish Acute Public Hospitals:
Trends and Implications Jacqueline O’Reilly and Miriam M. Wiley
217 Regret About the Timing of First Sexual Intercourse: The
Role of Age and Context Richard Layte, Hannah McGee
216 Determinants of Water Connection Type and Ownership of
Water-Using Appliances in Ireland Joe O’Doherty, Seán Lyons and Richard S.J. Tol

36
215 Unemployment – Stage or Stigma? Being Unemployed During an Economic Boom Emer Smyth
214 The Value of Lost Load Richard S.J. Tol 213 Adolescents’ Educational Attainment and School
Experiences in Contemporary Ireland Merike Darmody, Selina McCoy, Emer Smyth
212 Acting Up or Opting Out? Truancy in Irish Secondary
Schools Merike Darmody, Emer Smyth and Selina McCoy
211 Where do MNEs Expand Production: Location Choices of
the Pharmaceutical Industry in Europe after 1992 Frances P. Ruane, Xiaoheng Zhang
210 Holiday Destinations: Understanding the Travel Choices of
Irish Tourists Seán Lyons, Karen Mayor and Richard S.J. Tol
209 The Effectiveness of Competition Policy and the Price-Cost
Margin: Evidence from Panel Data Patrick McCloughan, Seán Lyons and William Batt
208 Tax Structure and Female Labour Market Participation:
Evidence from Ireland Tim Callan, A. Van Soest, J.R. Walsh
![Computing Approximate Pure Nash Equilibria in Shapley ... · arXiv:1710.01634v2 [cs.GT] 27 Nov 2017 Computing Approximate Pure Nash Equilibria in Shapley Value Weighted Congestion](https://cdn.vdocuments.us/doc/165x107/5e6f2eb75ba3ca7ed40a34d7/computing-approximate-pure-nash-equilibria-in-shapley-arxiv171001634v2-csgt.jpg)


