
Southwest Florida Workforce Overview Study
2015
May 2016
Prepared by the Research Team:
School of Business & Technology
Johnson School of Business
Regional Economic Research Institute Lutgert College of
Business
www.fgcu.edu/cob/reri/wfn

Workforce Overview Study: 2015
Workforce Now Page i
WORKFORCE NOW INITIATIVE
2015 Workforce Overview Study
PREFACE Workforce Now is a regional research initiative to identify current and future talent requirements for the five counties of Southwest Florida. The initiative was created in October 2012 as an outcome of discussions following the Education Summits produced by The News-Press Media Group. It is envisioned as a systematic, strategic multi-year focus on understanding and meeting critical workforce needs. The initiative is designed to provide better information on workforce gaps including skills, knowledge, and characteristics desired by regional employers. The plan is to provide a continuous stream of labor force information to employers and educational institutions and to look for ways to create dialogue and new partnerships between businesses and educational institutions. The quality of the regional workforce is a primary competitive factor in the region’s ability to grow and prosper in a global marketplace. This report is an annual overview of the Southwest Florida labor market that identifies the mix of industries, the industry growth trends, current employment gaps, and the average annual projected demand for regional occupations through 2022. It also defines the size of the regional employment gaps and identifies areas for further research. This information will help students, parents, businesses, and educators make more informed decisions about careers, employees, and programs.
This project and report would not be possible without the assistance of the Florida Department of Economic Opportunity and the generous support of the founding Workforce Now investors:
The News-Press Media Group
Partnership for Collier's Future Economy – Opportunity Naples
The Lee County Industrial Development Authority
The Southwest Florida Workforce Development Board
Arthrex, Inc.
Busey Bank
Chico's FAS, Inc. Florida Gulf Coast University Florida Southwestern State College
Hodges University
Manhattan Construction

Workforce Overview Study: 2015
Workforce Now Page ii
The authors would like to thank Sarah Owen, President and CEO of the Southwest Florida Community Foundation, for leading this effort and to its numerous sponsors. We would also like to acknowledge Mei-Mei Chan, the former President and Publisher of the News-Press Media Group, whose past leadership and influence helped shape Workforce Now into such an important ongoing research effort, and Dr. Gary Jackson, whose contributions to previous Workforce Overview studies added tremendous value to this project. Florida Gulf Coast University, Florida Southwestern State College, and Hodges University provided the research leadership and staff to complete this third Workforce Now annual overview report. The views expressed in the report and any errors contained are those of the authors and not of the institutions or companies that supported or participated in the Workforce Now project. The Workforce Now Reports are available at:
www.fgcu.edu/cob/reri/wfn/.
Christopher Westley John Meyer Aysegul Timur
Dr. Christopher Westley Dr. John Meyer Dr. Aysegul Timur Director Dean Dean Regional Economic Research Institute
School of Business & Technology
Johnson School of Business Hodges University
Lutgert College of Business Florida Gulf Coast University
Florida Southwestern State College
TABLE OF CONTENTS
For more information on the Workforce Now initiative, contact Sara Owen, President & CEO of the Southwest Florida Community Foundation, at [email protected] or 239 274-5900, or Chris Westley, Director of the Regional Economic Research Institute, Florida Gulf Coast University, at [email protected] or 239 590-7090.
Workforce Overview Study: 2015
Workforce Now Page iii
Table of Contents
Preface ............................................................................................................................. i
Executive Summary ........................................................................................................ v
1.0 Introduction .............................................................................................................. 1
2.0 Employment and Income Ranked by Industry .......................................................... 2
3.0 Southwest Florida Industry Mix Compared to the State of Florida ........................... 7
4.0 Southwest Florida’s Fastest and Slowest Growth Industries, 2010 to 2014 ........... 10
5.0 Projected Industry Employment Growth for Southwest Florida 2014-2022 ............ 14
6.0 Southwest Florida Occupational Employment Gaps for November 2015 ................ 17
7.0 Southwest Florida Current Employment Gaps by Major Occupational Group ......... 24
8.0 Southwest Florida Long-term Average Annual Employment Growth by Occupation 2014 to 2022 ................................................................................................................. 30
9.0 Top Growth Occupations by Minimum Educational Requirement ........................... 38
10.0 Herfindahl-Hirschman Index .................................................................................. 49
Summary/Conclusions .................................................................................................. 52

Workforce Overview Study: 2015
Workforce Now Page iv
RESEARCH TEAM Florida Gulf Coast University
Dr. Christopher Westley is the Director of the Regional Economic Research
Institute at Florida Gulf Coast University and a Professor of Economics.
Florida Southwestern State College
Dr. John Meyer is the Dean of the School of Business and Technology at Florida
Southwestern State College.
Hodges University
Dr. Aysegul Timur is the Dean of the Johnson School of Business and a
Professor of Economics.

Workforce Overview Study: 2015
Workforce Now Page v
EXECUTIVE SUMMARY
This is the third annual Southwest Florida workforce overview study providing
key information about industries, occupations, employment gaps, and projected job
growth. The study is divided into three major sections:
Historic, current, and projected employment by industry
Current (December 2015) employment gaps by occupation
Projected employment demand by occupation
This information can be used by key stakeholders throughout the region to define
the size of the regional employment gaps. In addition, the information will help
students, parents, businesses, and educators make more informed decisions about
careers, employees, and programs. Finally, the study helps researchers target future
areas of investigation that will be needed to identify the regional specific skills, tasks,
knowledge, abilities, and work activities for the occupational gaps identified by this
study.
The study was started in the middle of November 2015 and was completed by
the end of that year. Primary data collection and analysis were conducted by Dr.
Christopher Westley and the Regional Economic Research Institute at Florida Gulf
Coast University. The predominant source of workforce data for the study was the
Florida Department of Economic Opportunity. Final report development, editing, and
formatting was supported by the Workforce Now team. The Southwest Florida region is
defined as Charlotte, Collier, Glades, Hendry, and Lee Counties.

Workforce Overview Study: 2015
Workforce Now Page vi
KEY FINDINGS
Historic, Current, and Projected Employment by Industry
Economic recovery continues with employment and unemployment rates reaching levels closer to normal long-term values;
Southwest Florida has 543,906 employed workers, compared to 9.16 million employed in Florida;
The average annual Southwest Florida wage is $38,852 compared to $44,810 for Florida and $51,296 for the nation;
The largest industries by employment are retail trade (19.0%), accommodation and food services (15.5%), health care and social assistance (14.1%), construction (9.9%), and administrative and waste services (7.1%);
The largest industries by wage income are health care and social assistance (18.1%), retail trade (13.8%), construction (10.3%), accommodation and food services (8.4%), and professional and technical services (8.3%);
The fastest growing industries between 2010 and 2014 as measured by employment are accommodation and food services (10,656), retail trade (8,731), construction (7,574), health care and social assistance (4,825), and administrative and waste services (4,567);
The slowest growth industries from 2010 to 2014 have been utilities (24), information (113), mining, quarrying, and natural gas extraction (122), and finance and insurance (299);
The fastest growth industries between 2014 and 2022 are projected to be construction adding 1,675 jobs per year, health care and social assistance adding 1,460 jobs per year, retail trade adding 991 jobs per year, accommodations and food services adding 872 jobs per year, and self-employed and unpaid family workers adding 549 jobs per year.

Workforce Overview Study: 2015
Workforce Now Page vii
Current Employment Gaps by Occupation (December 2015) The Florida Department of Economic Opportunity study/data identified 3,372 current employment gap positions for Southwest Florida, signifying a decline of one-third (or 1,638 positions) from the figure reported in the Workforce Overview Study for 2014.
The top 10 employment gaps where demand is estimated to be greater than supply are shown in the following table. Four of the top 10 occupations are in the health care industry, which compares from two of the top 10 in the previous report. These include registered nurses, retail supervisors, retail salespersons, supervisors for food preparation and serving, construction trades supervisors, maintenance and repair workers, speech language pathologists, landscaping and groundskeepers, medical and health services managers, and physical therapists. The median wage varies from $10.59 per hour to $46.17 per hour.
The Current Top 10 Short-Term Employment Gaps for Southwest Florida
Occupation Current
Supply Gap Current
Employment Median Wage
Minimum Education
Registered Nurses -534 8,762 29.28 Associate
First-Line Supervisors of Retail Sales Workers
-397 8,481 18.73 PS Adult Voc
Retail Salespersons -384 23,266 10.81 HS/GED
First-Line Supervisors of Food Preparation and Serving Workers
-344 3,670 16.69 PS Adult Voc
First-Line Supervisors of Construction Trades and Extraction Workers
-174 2,516 25.94 Associate
Maintenance and Repair Workers, General
-170 4,715 15.82 PS Adult Voc
Speech-Language Pathologists -165 395 36.77 Master's or higher
Landscaping and Groundskeeping Workers
-147 11,155 10.59 Less HS/GED
Medical and Health Services Managers
-137 724 46.17 Bachelor's
Physical Therapists -133 929 39.78 Doctorate
Registered nurses had the largest employment gap of -534. This field did not make the top 10 list in the most previous workforce overview (in October 2014). On average, each 10 jobs filled are worth an additional $585,600 in income;
First line supervisors of retail salespersons had the next highest employment gap of -397. On average, each 10 jobs filled are worth an additional $374,600 in income;
Retail salespersons made up the next highest employment gap of -384. On average, for each 10 jobs filled, income would rise by $216,200;

Workforce Overview Study: 2015
Workforce Now Page viii
First line supervisors in the food prep industry’s employment gap was -344. For each 10 positions filled, $333,800 in additional income is earned;
First line supervisors in the construction trades’ employment gap was -174. For each 10 positions filled, income would rise by $518,800;
Maintenance and repair trades’ employment gap was -170. On average, each 10 jobs filled would raise income by $316,400;
Speech language pathologists’ employment gap came next, registering -165. For each 10 vacancies filled, additional income of $735,400 would be generated;
Another sign of the regional recovery is an employment gap for landscaping and groundskeeping occupations of -147 positions. For each 10 job vacancies filled, additional income of $211,800 would be generated;
Another occupational group is medical and health services management occupations. The study identified an employment gap of -137. On average, for each 10 job vacancies filled, additional income of $923,400 would be generated;
Other employment gaps were found in physical therapists, wholesale sales representatives, first line supervisors of mechanics and repairers, carpenters, financial services sales agents, tellers, insurance sales agents, computer systems analysts, janitors, occupational therapists, and medical secretaries.
Projected Employment Demand by Occupation
The top 10 projected high demand regional growth occupations for 2014 to 2022 are shown in the following table. The top growth occupation is retail salespersons with an average annual demand for 1,199 employees per year. This is followed by waiters and waitresses at 1,001 employees per year, cashiers at 708 employees per year, food preparation and serving workers at 555 employees per year, and landscaping and groundskeeping workers at 463 employees per year. The next five highest occupations in demand are registered nurses, carpenters, office clerks, customer service representatives, and secretaries and administrative assistants.

Workforce Overview Study: 2015
Workforce Now Page ix
The Top 10 Long-Term Growth Occupations Southwest Florida 2014-2022
Occupation Average Annual Growth
Current Employment
Median Wage
Minimum Education
Retail Salespersons 1,199 23,266 $ 10.81 HS/GED
Waiters and Waitresses 1,001 14,685 $ 9.10 Less HS/GED
Cashiers 708 12,132 $ 9.43 HS/GED
Combined Food Prep and Servicing Workers 555 11,644 $ 9.02 Less HS/GED
Landscaping and Groundskeeping Workers 463 11,155 $ 10.59 Less HS/GED
Registered Nurses 449 8,762 $ 29.28 Some College
Carpenters 399 6,265 $ 17.12 PS Adult Voc
Office Clerks, General 345 7,723 $ 12.37 HS/GED
Customer Service Representatives 323 6,670 $ 13.31 PS Adult Voc
Secretaries and Administrative Assistants 305 10,572 $ 14.71 PS Adult Voc
The study finally looked at long-run occupational growth by identifying the fastest-growing occupations by the minimal educational requirement including:
Post-Secondary Adult Vocational or Higher
Some College or Higher
Bachelor’s Degree or Higher
Master’s Degree or Higher
The Fastest Growing Occupations Requiring Post-Secondary Adult Vocational Training The top projected adult vocational education growth occupations are shown in the following table. These represent positions in sales, construction, health care, and maintenance and are expected to grow between 168 and 399 positions for each year from 2014 to 2022.

Workforce Overview Study: 2015
Workforce Now Page x
The Top 10 Adult Vocational Growth Occupations Southwest Florida 2014-2022
Occupation Average Annual Growth
Current Employment
Median Wage
Minimum Education
Carpenters 399 6,265 $17.12 Adult Voc.
Customer Service Representatives 323 6,670 $13.31 Adult Voc.
Secretaries and Administrative Assistants, Except Legal, Medical, and Executive 305 10,572 $14.71 Adult Voc.
First-Line Supervisors of Retail Sales Workers 304 8,481 $18.73 Adult Voc.
Nursing Assistants 258 5,704 $12.57 Adult Voc.
Cooks, Restaurant 240 6,107 $11.21 Adult Voc.
Painters, Construction and Maintenance 200 3,123 $14.13 Adult Voc.
Real Estate Sales Agents 196 4,614 $18.41 Adult Voc.
Sales Representatives, Wholesale and Manufacturing, Except Technical and Scientific Products 177 4,061 $20.29 Adult Voc.
Maintenance and Repair Workers, General 168 4,715 $15.82 Adult Voc.
The Fastest Growing Occupations Requiring “Some College” The top projected “some college” education growth occupations are shown in the following table. These represent positions in health care, technology, and construction and are expected to grow between 111 and 449 positions for each year from 2014 to 2022.
The Top 8 Some College Growth Occupations
Southwest Florida 2014-2022
Occupation Average Annual Growth
Current Employment
Median Wage
Minimum Education
Registered Nurses 449 8,762 $29.28 Some College
First-Line Supervisors of Construction Trades and Extraction Workers 182 2,516 $25.94 Some College
Bookkeeping, Accounting, and Auditing Clerks 179 5,393 $16.06 Some College
First-Line Supervisors of Office and Administrative Support Workers 176 3,744 $22.61 Some College
Construction Managers 141 3,557 $32.92 Some College
Farmers, Ranchers, and Other Agricultural Managers 139 7,201 $28.69 Some College
General and Operations Managers 117 3,800 $45.92 Some College
Business Operations Specialists, All Other 111 2,672 $26.80 Some College
Workforce Overview Study: 2015
Workforce Now Page xi
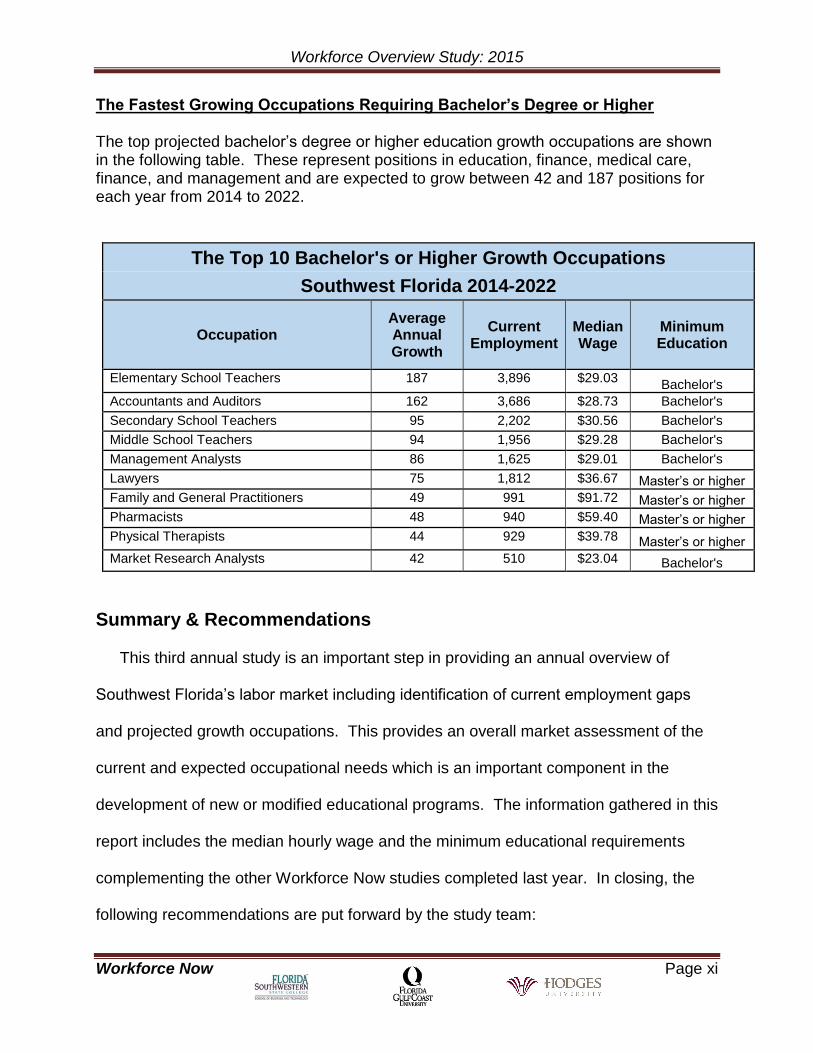
The Fastest Growing Occupations Requiring Bachelor’s Degree or Higher The top projected bachelor’s degree or higher education growth occupations are shown in the following table. These represent positions in education, finance, medical care, finance, and management and are expected to grow between 42 and 187 positions for each year from 2014 to 2022.
The Top 10 Bachelor's or Higher Growth Occupations
Southwest Florida 2014-2022
Occupation Average Annual Growth
Current Employment
Median Wage
Minimum Education
Elementary School Teachers 187 3,896 $29.03 Bachelor's
Accountants and Auditors 162 3,686 $28.73 Bachelor's
Secondary School Teachers 95 2,202 $30.56 Bachelor's
Middle School Teachers 94 1,956 $29.28 Bachelor's
Management Analysts 86 1,625 $29.01 Bachelor's
Lawyers 75 1,812 $36.67 Master’s or higher
Family and General Practitioners 49 991 $91.72 Master’s or higher
Pharmacists 48 940 $59.40 Master’s or higher
Physical Therapists 44 929 $39.78 Master’s or higher
Market Research Analysts 42 510 $23.04 Bachelor's
Summary & Recommendations
This third annual study is an important step in providing an annual overview of
Southwest Florida’s labor market including identification of current employment gaps
and projected growth occupations. This provides an overall market assessment of the
current and expected occupational needs which is an important component in the
development of new or modified educational programs. The information gathered in this
report includes the median hourly wage and the minimum educational requirements
complementing the other Workforce Now studies completed last year. In closing, the
following recommendations are put forward by the study team:

Workforce Overview Study: 2015
Workforce Now Page xii
Recommendations 1. A Southwest Florida Labor Market overview should be completed annually and
timed to use the latest forecasts provided by the Florida Department of Economic
Opportunity.
2. The labor market overviews should identify future research opportunities and
collaborative opportunities for businesses and educators.
3. Further study of the employment gaps is needed to explore local skills, knowledge,
tasks, abilities and activities required to fill the employment gaps and increased
demand.
4. The data show consistency with those of last year. However, there appears to be a
gradual reduction in the median wage and some fluidity in the order and type of
positions listed.

Workforce Overview Study: 2015
Workforce Now Page 1
Southwest Florida Workforce Overview Study 2015
1.0 Introduction
Workforce Now is a recent regional initiative to better understand Southwest
Florida’s labor market including employment gaps, specific skills desired, and forecast
occupational growth. This is the third in a series of Southwest Florida labor market
overviews which are updated annually.
The purpose of this updated report is to conduct retrospective and prospective
data analysis of information and forecasts from the Florida Department of Economic
Opportunity to identify the mix of industries, the industry growth trends, current
employment gaps, and the average annual projected demand for regional occupations
through the year 2022.
The study was started in November 2015 and was completed at the end of that
year. Primary data collection and analysis were conducted by Dr. Christopher Westley
and the Regional Economic Research Institute at Florida Gulf Coast University. The
final report development, editing, and formatting were supported by the Workforce Now
research team. For the purposes of this study, the Southwest Florida region is defined
as Charlotte, Collier, Glades, Hendry, and Lee Counties.

Workforce Overview Study: 2015
Workforce Now Page 2
2.0 Employment and Income Ranked by Industry
The largest industry when ranked by employment is retail trade with 67,067
employees and 19 percent of all employment, as shown in Chart 1 and Table 1 which is
based on the Quarterly Census of Employment and Wages (QCEW). The QCEW
includes information on employees covered by the Florida unemployment insurance so
it does not include workers who are self-employed.
The second largest industry employer is accommodation and food services, with
54,624 employees and 15.5 percent of regional employment. The third largest industry
is health care and social assistance at 49,719, which represents slightly over 14 percent
of the region’s employment. Construction has rebounded from the recession and is the
fourth largest industry with 34,898 employees and almost 10 percent of the region’s
employment. This constitutes a 14-percent increase in construction employment from
2013 to 2014. The top four industries comprise 58.6 percent of the region’s workforce,
which also constitutes an increase compared to 2013’s measure of just over 50 percent.
The fifth largest industry is administrative and waste services employing 24,923 and
with 7.1 percent of the region’s workforce. This industry includes many service-type
occupations.
Southwest Florida has a comparative advantage in weather (sunshine and mild
winter temperatures), beaches, and recreational activities. These quality of life
characteristics are drivers that support the key industries in Southwest Florida, such as
retail trade, health care, accommodation and food services, construction, and support

Workforce Overview Study: 2015
Workforce Now Page 3
services. Population growth has been a strong driver of wealth for the region creating
the need for housing, recreation, and services.
Chart 1 Southwest Florida Employment by Industry 2014
(Percent)
Source: QCEW, Florida Department of Economic Opportunity

Workforce Overview Study: 2015
Workforce Now Page 4
Table 1 Employment by Industry 2014 Southwest Florida
Industry Average Monthly
Employment
Percent of Employment
Retail Trade 67,067 19.0%
Accommodation and Food Services 54,624 15.5%
Health Care and Social Assistance 49,719 14.1%
Construction 34,898 9.9%
Administrative and Waste Services 24,923 7.1%
Professional and Technical Services 18,227 5.2%
Arts, Entertainment, and Recreation 15,079 4.3%
Other Services 14,711 4.2%
Agriculture, Forestry, Fishing & Hunting 12,262 3.5%
Finance and Insurance 10,673 3.0%
Other Industry Sectors 50,127 14.2%
Total, All Industries 352,310 100.0%
Source: QCEW, Florida Department of Economic Opportunity
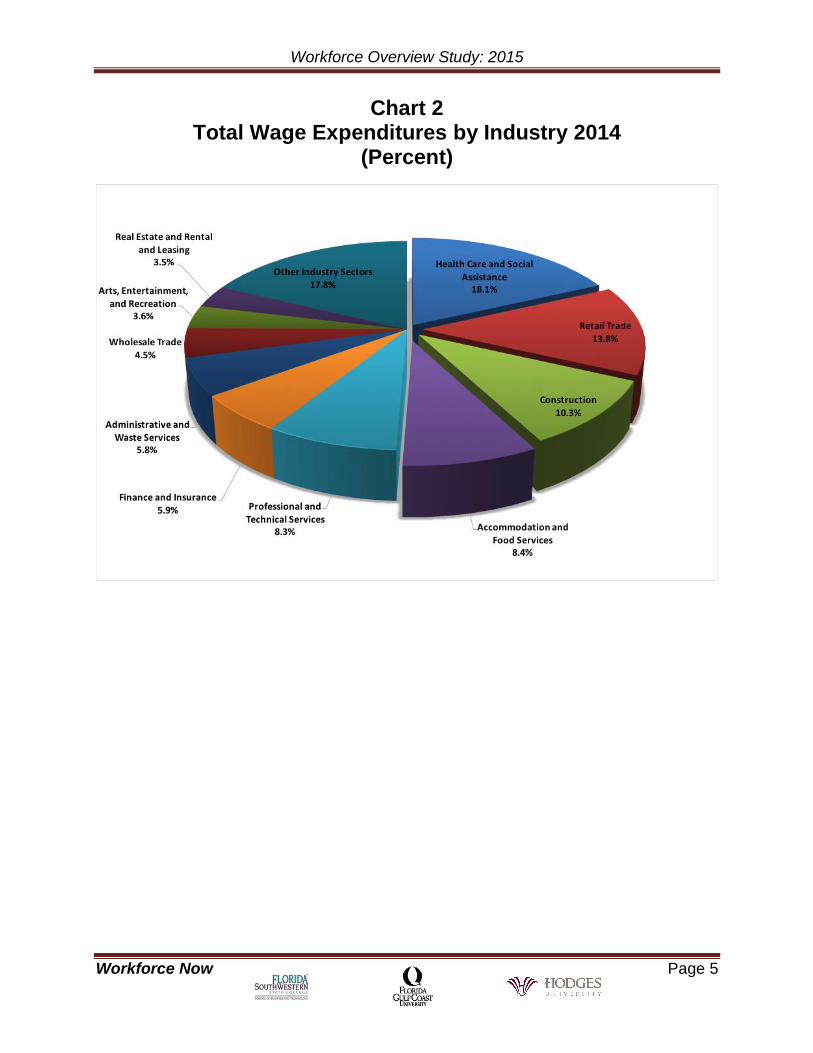
The largest contribution to total wage income is health care and social assistance with
average annual wage expenditures of $2.5 billion which represents 18.1 percent of total
wage expenditures in Southwest Florida. Retail trade is the next largest total wage
expenditure industry with 13.8 percent of the region’s total annual wage and
expenditures of $1.9 billion. The third largest industry measured by total wage
expenditures is construction, with 10.3 percent of the total regional wage expenditures
at $1.4 billion. Accommodation and food services is the fourth largest industry as
measured by total wages at $1.2 billion or 8.4 percent of the region’s total wage
expenditures. The total wage expenditures by industry are shown in Chart 2 and Table
2.
Workforce Overview Study: 2015
Workforce Now Page 5
Chart 2 Total Wage Expenditures by Industry 2014
(Percent)

Workforce Overview Study: 2015
Workforce Now Page 6
Table 2
Average Annual Wage Income by Industry 2014 Southwest Florida
Industry
Average Annual Wage Expenditures
(Billions $)
Percent of Total Wage
Health Care and Social Assistance $2.54 18.1%
Retail Trade $1.89 13.8%
Construction $1.41 10.3%
Accommodation and Food Services $1.15 8.4%
Professional and Technical Services $1.14 8.3%
Finance and Insurance $0.81 5.9%
Administrative and Waste Services $0.79 5.8%
Wholesale Trade $0.62 4.5%
Arts, Entertainment, and Recreation $0.49 3.6%
Real Estate and Rental and Leasing $0.47 3.5%
Other Industry Sectors $2.43 17.8%
Total, All Industries $15.5 100.0%
Source: QCEW, Florida Department of Economic Opportunity

Workforce Overview Study: 2015
Workforce Now Page 7
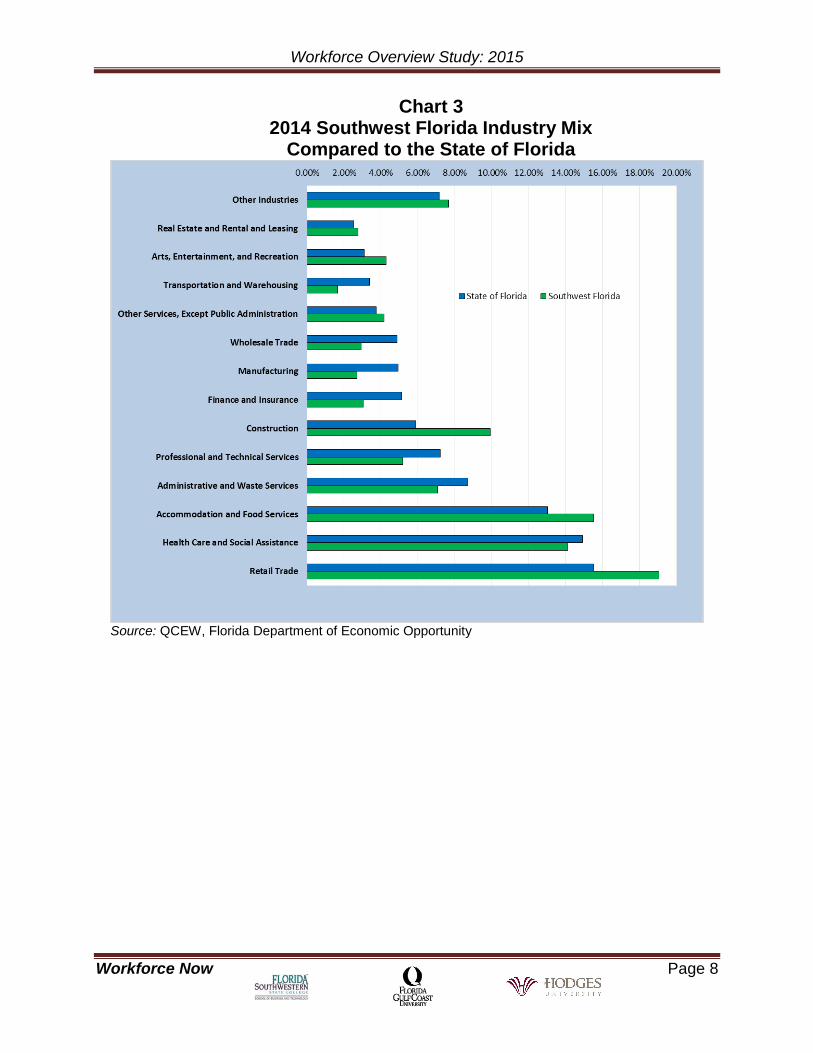
3.0 Southwest Florida Industry Mix Compared to the State of Florida
Southwest Florida has a higher percentage of employees in retail trade,
accommodation and food services, construction, arts, entertainment, and recreation,
other services, and real estate and rental and leasing, compared to the State of Florida,
as shown in Chart 3 and Table 3. Southwest Florida’s competitive advantage as a
preferred location for tourism and retirement certainly helps to explain why the region
differs from the state-level percentages. The largest differentials are in the areas,
respectively, of construction and retail trade.
The region has a smaller percentage of employment than the state in
manufacturing, finance and insurance, professional and technical services, and
wholesale trade. Manufacturing employment in Southwest Florida is only 2.7 percent of
employment, compared to 4.9 percent for the state as whole.
Workforce Overview Study: 2015
Workforce Now Page 8
Chart 3 2014 Southwest Florida Industry Mix
Compared to the State of Florida
Source: QCEW, Florida Department of Economic Opportunity

Workforce Overview Study: 2015
Workforce Now Page 9
Table 3 2014 Southwest Florida Industry Mix
Compared to the State of Florida
(Percent)
Industry State of Florida
Southwest Florida
Retail Trade 15.49% 19.04%
Health Care and Social Assistance 14.90% 14.11%
Accommodation and Food Services 13.01% 15.50%
Administrative and Waste Services 8.69% 7.07%
Professional and Technical Services 7.22% 5.17%
Construction 5.89% 9.91%
Finance and Insurance 5.11% 3.03%
Manufacturing 4.92% 2.70%
Wholesale Trade 4.87% 2.93%
Other Services, Except Public Administration 3.74% 4.18%
Transportation and Warehousing 3.36% 1.64%
Arts, Entertainment, and Recreation 3.08% 4.28%
Real Estate and Rental and Leasing 2.54% 2.76%
Other Industries 7.16% 7.67%
Source: QCEW, Florida Department of Economic Opportunity

Workforce Overview Study: 2015
Workforce Now Page 10
4.0 Southwest Florida’s Fastest and Slowest Growth Industries, 2010 to 2014
Although the economic recovery had been slow-going in Southwest Florida in
2010 and 2011, the strength of the recovery from 2012 through 2014 contributed to an
overall increase in employees in our region by 75,260 employees from December 2010
to December 2014. The fastest-growing industries from 2010 to 2014 were
accommodation and food services, retail trade, construction, health care and social
assistance, and administrative and waste services, as shown in Chart 4.
The slowest-growing industries were utilities, information (media), mining,
quarrying, and oil and natural gas extraction, and finance and insurance, as shown in
Chart 5 and Table 4. Construction shifted from being among the lowest-growing
industries in the five-year period ending in 2013 (reported last year) to one of the fastest
in the five-year period ending in 2014. Given that the recession began as a “housing
bubble” and turned into a financial crisis, it is not surprising that finance, construction,
and utilities are taking longer to recover than some other sectors. However, the data
shows that the region is strongly rebounding, with no industries contracting from 2010
through 2014.

Workforce Overview Study: 2015
Workforce Now Page 11
Chart 4 Fastest Growing Industries
Southwest Florida Employment Change 2010-2014
Source: QCEW, Florida Department of Economic Opportunity

Workforce Overview Study: 2015
Workforce Now Page 12
Chart 5 Slowest Growing Industries
Southwest Florida Employment Change 2010-2014
Source: QCEW, Florida Department of Economic Opportunity

Workforce Overview Study: 2015
Workforce Now Page 13
Table 4 Southwest Florida Employment Change 2010-2014
Industry Title Change
Level Percent
Total, All Industries 53,256 17.8%
Accommodation and Food Services 10,656 24.2%
Retail Trade 8,731 15.0%
Construction 7,574 27.7%
Health Care and Social Assistance 4,825 10.7%
Administrative and Waste Services 4,567 22.4%
Professional and Technical Services 3,764 26.0%
Arts, Entertainment, and Recreation 2,538 20.2%
Manufacturing 1,919 25.3%
Other Services, Except Public Administration 1,599 12.2%
Agriculture, Forestry, Fishing and Hunting 1,460 13.5%
Wholesale Trade 1,381 15.4%
Transportation and Warehousing 1,373 31.1%
Real Estate and Rental and Leasing 877 9.9%
Management of Companies and Enterprises 783 26.7%
Educational Services 471 11.7%
Finance and Insurance 299 2.9%
Mining, Quarrying, and Oil and Gas Extraction 122 89.1%
Information 113 2.3%
Utilities 24 2.1%
Source: QCEW, Florida Department of Economic Opportunity

Workforce Overview Study: 2015
Workforce Now Page 14
5.0 Projected Industry Employment Growth for Southwest Florida 2014-2022
Each year the Florida Department of Economic Opportunity provides an
employment forecast by industry, which is shown in Chart 6 and Table 5. Construction
is projected to be the fastest-growing industry in Southwest Florida, adding an average
of 1,675 employees each year from 2014 to 2022. Health care and social assistance is
projected to add the second largest number of employees, adding 1,460 per year. This
is followed by retail trade at 991 employees per year, accommodation and food services
at 872 employees per year, and self-employed and unpaid family workers at 549
employees per year. Professional, scientific, and technical services are projected to
add 527 employees per year, administrative, support and waste management is
projected to add 526 per year and other services is projected to add 220 per year. Arts,
entertainment, and recreation is projected to grow by 211 employees per year,
wholesale trade by 168 employees per year, management of companies by 150
employees per year, finance and insurance by 147 employees per year, real estate by
146 employees per year, educational services by 142 employees per year, and
manufacturing by 118 employees.

Workforce Overview Study: 2015
Workforce Now Page 15
Chart 6 Projected Average Annual Employment Growth by Industry
for Southwest Florida 2014-2022
Source: Florida Department of Economic Opportunity

Workforce Overview Study: 2015
Workforce Now Page 16
Table 5 Projected Average Annual Employment Change by Industry
Southwest Florida 2014-2022
Industry Average Annual
Increase
Average Annual Percentage
Increase
Construction 1,675 5.0%
Health Care and Social Assistance 1,460 3.0%
Retail Trade 991 1.5%
Accommodation and Food Services 872 1.6%
Self-Employed and Unpaid Family Workers 549 1.2%
Professional, Scientific, and Technical Services 527 2.7%
Administrative and Support and Waste Management 526 2.1%
Other Services 220 1.3%
Arts, Entertainment, and Recreation 211 1.4%
Wholesale Trade 168 1.5%
Management of Companies and Enterprises 150 3.5%
Finance and Insurance 147 1.3%
Real Estate and Rental and Leasing 146 1.5%
Educational Services 142 2.6%
Manufacturing 118 1.3%
Other -35 -0.1%
Source: Florida Department of Economic Opportunity

Workforce Overview Study: 2015
Workforce Now Page 17
6.0 Southwest Florida Occupational Employment Gaps for November 2015
The study team worked with the Florida Department of Economic Opportunity to
identify estimates of the most recent Southwest Florida employment gaps by using
online job postings and graduations to identify November 2015 employment gaps.
Employment gaps are defined as November 2015 demand minus the supply of
applicants and graduates. The overall July employment gap identified by this study
using the Florida Department of Economic Opportunity demand and supply analysis
was approximately 3,372 positions.
Employment gaps are positions that have a regional demand greater than the
estimated supply available for the Southwest Florida market. Some of these positions
will be filled from outside the region, firms may hire less qualified candidates, or the
positions may be left vacant for an extended period of time. It is our hope that
identifying these regional employment gaps can assist parents, students, employers,
and educators in identifying potential opportunities. This section provides charts and
tables identifying the top 50 current employment gaps for Southwest Florida.
The top 10 employment gaps were for registered nurses, first-line supervisors of
retail sales, retail salespersons, first-line supervisors of food preparation and service,
first-line supervisors of construction trades, maintenance and repair workers, speech-
language pathologists, landscaping and groundskeeping workers, medical and health
services managers, and physical therapists, as shown in Chart 7. The employment
gap, current employment level, median wage and minimum educational requirements
for the top 10 employment gaps are shown in Table 6. The median hourly wages

Workforce Overview Study: 2015
Workforce Now Page 18
ranged from $10.59 per hour to $46.17 per hour. The minimum education requirements
for each occupation varied from less than high school to at least a master’s degree.
Chart 7
Top 10 Employment Gaps November 2015 Southwest Florida
Source: Florida Department of Economic Opportunity
Table 6
Top 10 Employment Gaps For Southwest Florida November 2015
Source: Florida Department of Economic Opportunity
No. OccupationCurrent
Supply Gap
Current
Employment
Median
Wage
Minimum
Education
1 Registered Nurses -534 8,762 29.28$ Some College
2 First-Line Supervisors of Retail Sales -397 8,481 18.73$ PS Adult Voc
3 Retail Salespersons -384 23,266 10.81$ HS/GED
4 First-Line Supervisors, Food Prep. & Serv. -344 3,670 16.69$ PS Adult Voc
5 First-Line Supervisors, Construction Trades -174 2,516 25.94$ Some College
6 Maintenance and Repair Workers, General -170 4,715 15.82$ PS Adult Voc
7 Speech-Language Pathologists -165 395 36.77$ Master's or higher
8 Landscaping and Groundskeeping Workers -147 11,155 10.59$ Less HS/GED
9 Medical and Health Services Managers -137 724 46.17$ Bachelor's
10 Physical Therapists -133 929 39.78$ Master's or higher
Workforce Overview Study: 2015
Workforce Now Page 19
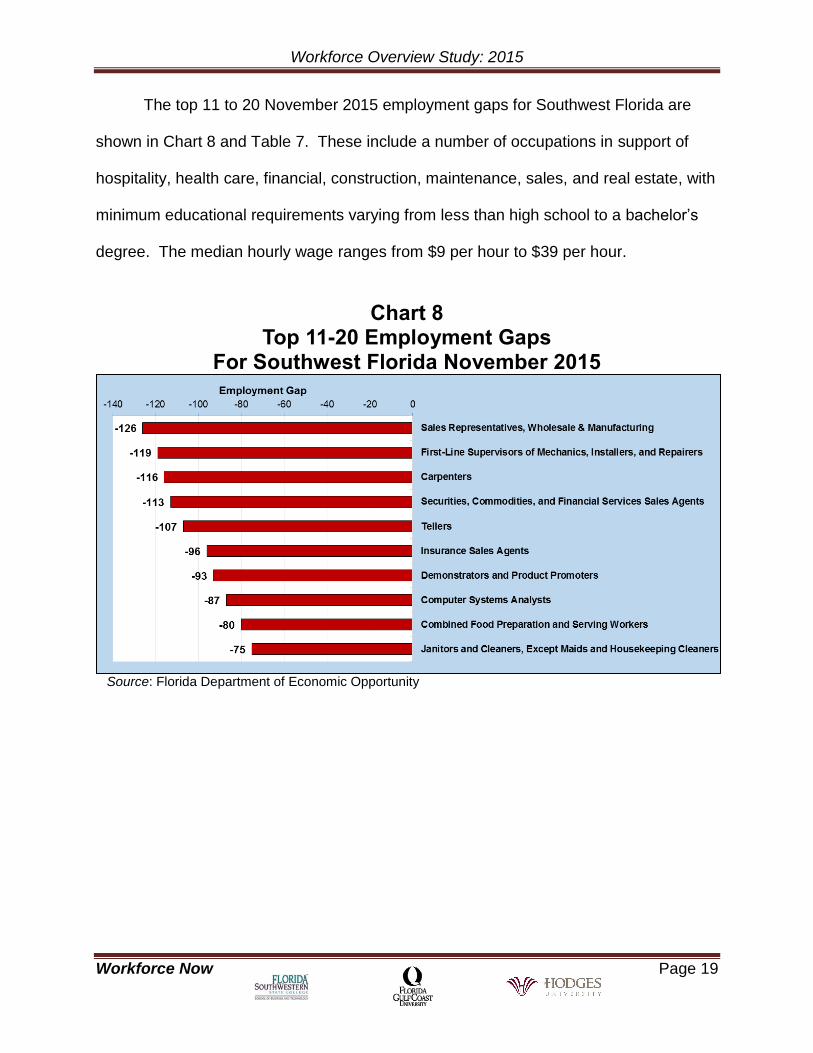
The top 11 to 20 November 2015 employment gaps for Southwest Florida are
shown in Chart 8 and Table 7. These include a number of occupations in support of
hospitality, health care, financial, construction, maintenance, sales, and real estate, with
minimum educational requirements varying from less than high school to a bachelor’s
degree. The median hourly wage ranges from $9 per hour to $39 per hour.
Chart 8 Top 11-20 Employment Gaps
For Southwest Florida November 2015
Source: Florida Department of Economic Opportunity

Workforce Overview Study: 2015
Workforce Now Page 20
Table 7 Top 11-20 Employment Gaps
For Southwest Florida November 2015
Source: Florida Department of Economic Opportunity
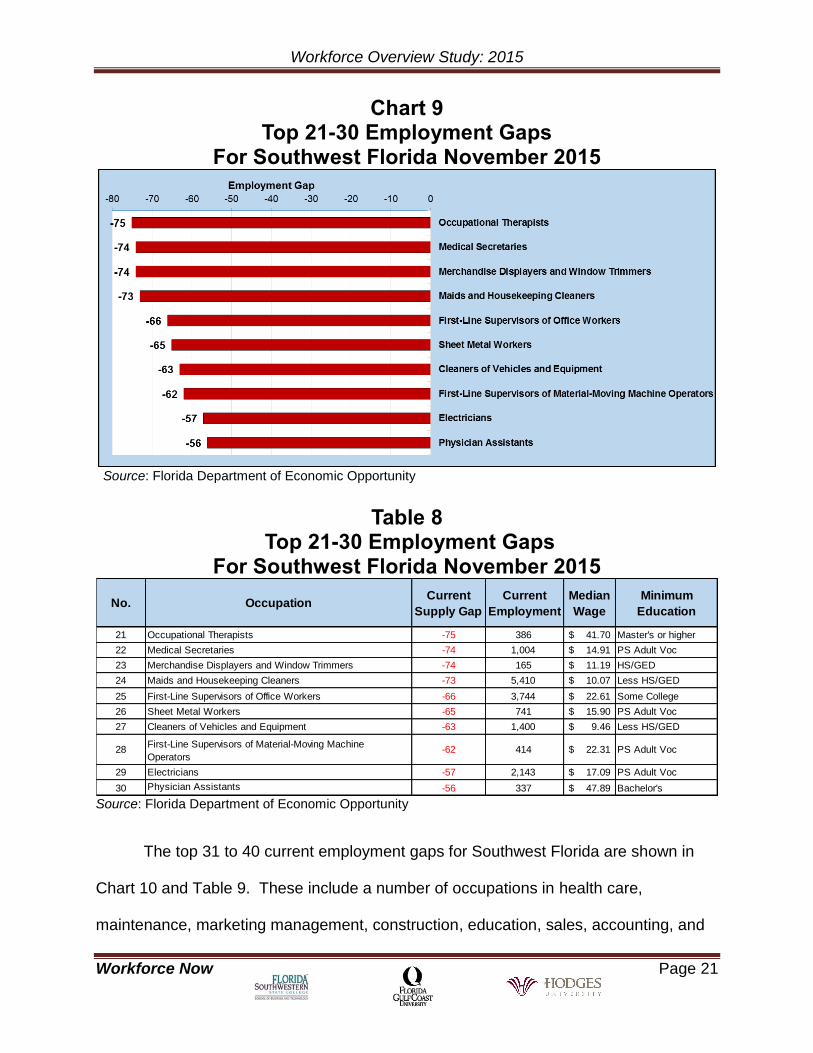
The top 21 to 30 current employment gaps for Southwest Florida are shown in
Chart 9 and Table 8. These include a number of occupations in support of hospitality,
health care, sales, information technology, trades, and transportation. The minimum
education required ranges from less than high school to a master’s degree and the
median hourly wage ranges from $9.46 per hour to $47.89 per hour as shown in Table
8.
No. OccupationCurrent
Supply Gap
Current
Employment
Median
Wage
Minimum
Education
11 Sales Representatives, Wholesale & Manufacturing -126 4,061 20.29$ PS Adult Voc
12First-Line Supervisors of Mechanics, Installers, and
Repairers-119 1,548 26.46$ PS Adult Voc
13 Carpenters -116 6,265 17.12$ PS Adult Voc
14Securities, Commodities, and Financial Services Sales
Agents-113 891 37.30$ Bachelor's
15 Tellers -107 2,250 13.39$ PS Adult Voc
16 Insurance Sales Agents -96 1,524 22.28$ PS Adult Voc
17 Demonstrators and Product Promoters -93 N/R 10.19$ HS/GED
18 Computer Systems Analysts -87 438 38.99$ Some College
19 Combined Food Preparation and Serving Workers -80 11,644 9.02$ Less HS/GED
20Janitors and Cleaners, Except Maids and Housekeeping
Cleaners -75 5,463 10.98$ Less HS/GED
Workforce Overview Study: 2015
Workforce Now Page 21
Chart 9 Top 21-30 Employment Gaps
For Southwest Florida November 2015
Source: Florida Department of Economic Opportunity
Table 8 Top 21-30 Employment Gaps
For Southwest Florida November 2015
Source: Florida Department of Economic Opportunity
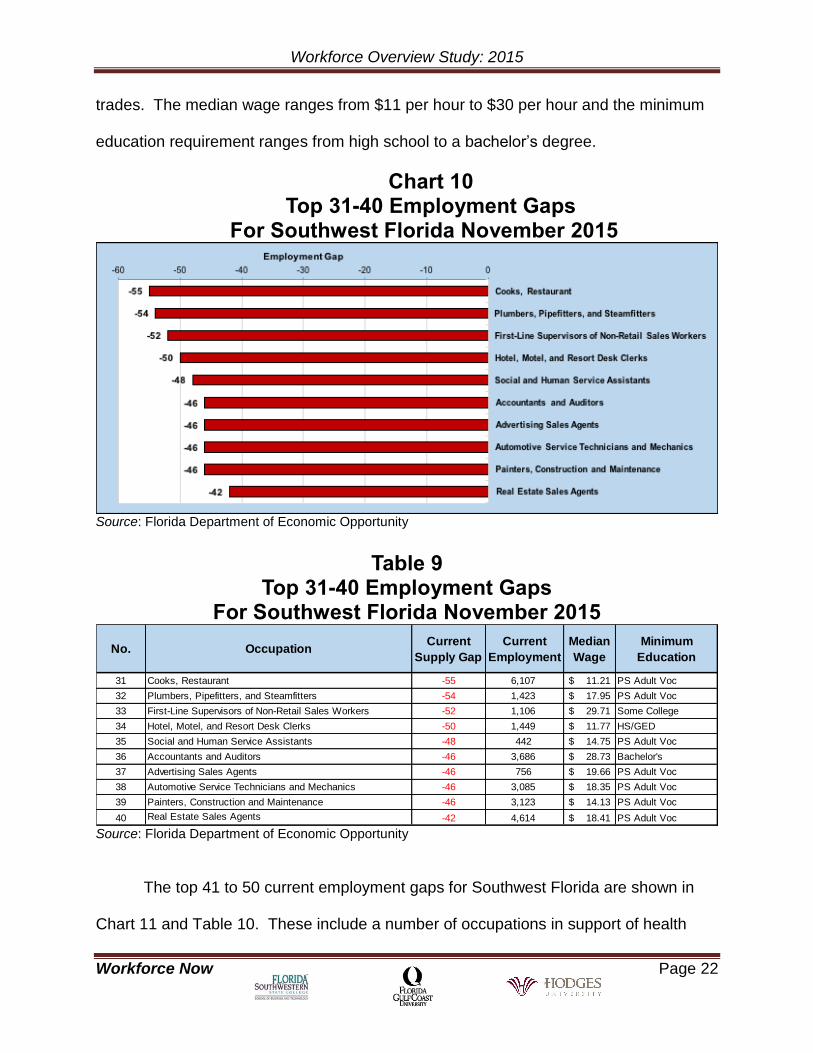
The top 31 to 40 current employment gaps for Southwest Florida are shown in
Chart 10 and Table 9. These include a number of occupations in health care,
maintenance, marketing management, construction, education, sales, accounting, and
No. OccupationCurrent
Supply Gap
Current
Employment
Median
Wage
Minimum
Education
21 Occupational Therapists -75 386 41.70$ Master's or higher
22 Medical Secretaries -74 1,004 14.91$ PS Adult Voc
23 Merchandise Displayers and Window Trimmers -74 165 11.19$ HS/GED
24 Maids and Housekeeping Cleaners -73 5,410 10.07$ Less HS/GED
25 First-Line Supervisors of Office Workers -66 3,744 22.61$ Some College
26 Sheet Metal Workers -65 741 15.90$ PS Adult Voc
27 Cleaners of Vehicles and Equipment -63 1,400 9.46$ Less HS/GED
28First-Line Supervisors of Material-Moving Machine
Operators-62 414 22.31$ PS Adult Voc
29 Electricians -57 2,143 17.09$ PS Adult Voc
30 Physician Assistants -56 337 47.89$ Bachelor's
Workforce Overview Study: 2015
Workforce Now Page 22
trades. The median wage ranges from $11 per hour to $30 per hour and the minimum
education requirement ranges from high school to a bachelor’s degree.
Chart 10 Top 31-40 Employment Gaps
For Southwest Florida November 2015
Source: Florida Department of Economic Opportunity
Table 9 Top 31-40 Employment Gaps
For Southwest Florida November 2015
Source: Florida Department of Economic Opportunity
The top 41 to 50 current employment gaps for Southwest Florida are shown in
Chart 11 and Table 10. These include a number of occupations in support of health
No. OccupationCurrent
Supply Gap
Current
Employment
Median
Wage
Minimum
Education
31 Cooks, Restaurant -55 6,107 11.21$ PS Adult Voc
32 Plumbers, Pipefitters, and Steamfitters -54 1,423 17.95$ PS Adult Voc
33 First-Line Supervisors of Non-Retail Sales Workers -52 1,106 29.71$ Some College
34 Hotel, Motel, and Resort Desk Clerks -50 1,449 11.77$ HS/GED
35 Social and Human Service Assistants -48 442 14.75$ PS Adult Voc
36 Accountants and Auditors -46 3,686 28.73$ Bachelor's
37 Advertising Sales Agents -46 756 19.66$ PS Adult Voc
38 Automotive Service Technicians and Mechanics -46 3,085 18.35$ PS Adult Voc
39 Painters, Construction and Maintenance -46 3,123 14.13$ PS Adult Voc
40 Real Estate Sales Agents -42 4,614 18.41$ PS Adult Voc

Workforce Overview Study: 2015
Workforce Now Page 23
care, finance and banking, construction, information technology, and market research.
The median hourly wage ranges from $9 per hour to $60 per hour and the minimum
education requirement ranges from less than high school to master’s degree.
Chart 11 Top 41-50 Employment Gaps
For Southwest Florida November 2015
Source: Florida Department of Economic Opportunity
Table 10 Top 41-50 Employment Gaps
For Southwest Florida November 2015
Source: Florida Department of Economic Opportunity
No. OccupationCurrent
Supply Gap
Current
Employment
Median
Wage
Minimum
Education
41 Loan Officers -40 553 40.75$ Some College
42 Public Relations Specialists -40 392 23.76$ Bachelor's
43 Dining Room and Cafeteria Attendants and Bartender -37 2,754 9.13$ Less HS/GED
44 Food Service Managers -37 1,186 28.49$ Some College
45 Bus and Truck Mechanics and Diesel Engine Specialists -35 453 19.74$ PS Adult Voc
46 Cost Estimators -35 792 26.36$ Some College
47 Pharmacists -35 940 59.40$ Master's or higher
48Heating, Air Conditioning, and Refrigeration Mechanics
-34 2,214 19.18$ PS Adult Voc
49 Medical and Clinical Laboratory Technologists -34 411 27.44$ Some College
50 Counter and Rental Clerks -33 1,519 11.22$ HS/GED

Workforce Overview Study: 2015
Workforce Now Page 24
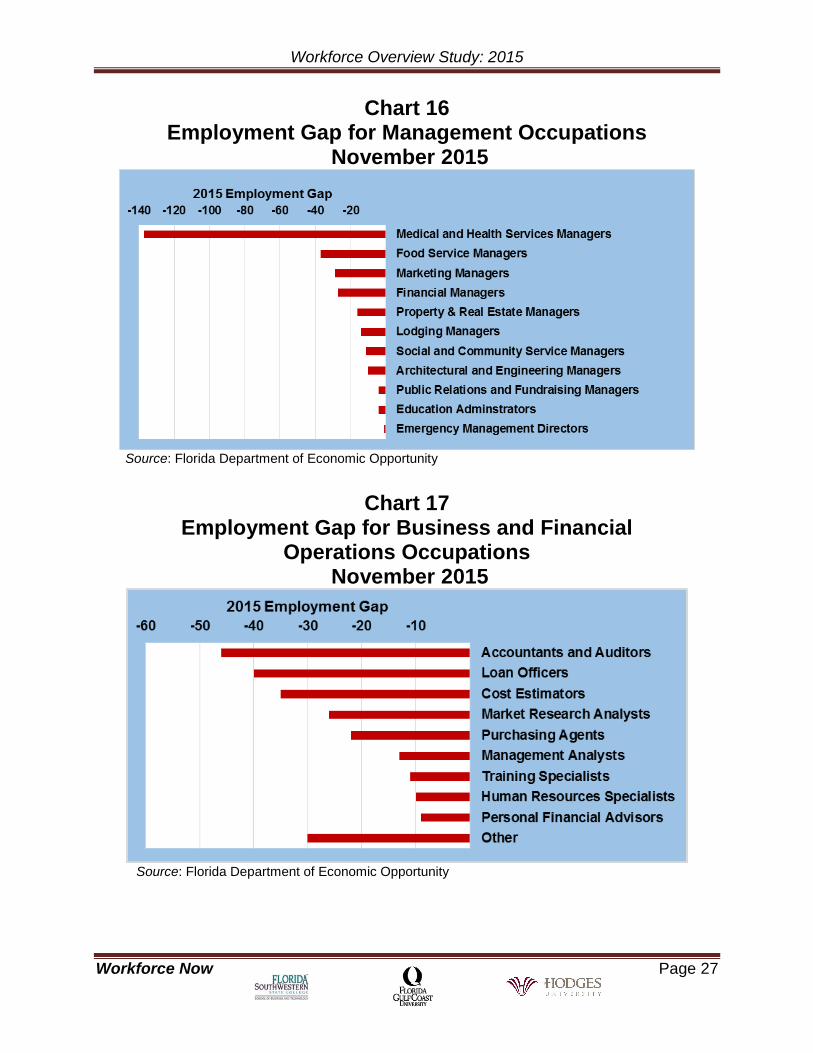
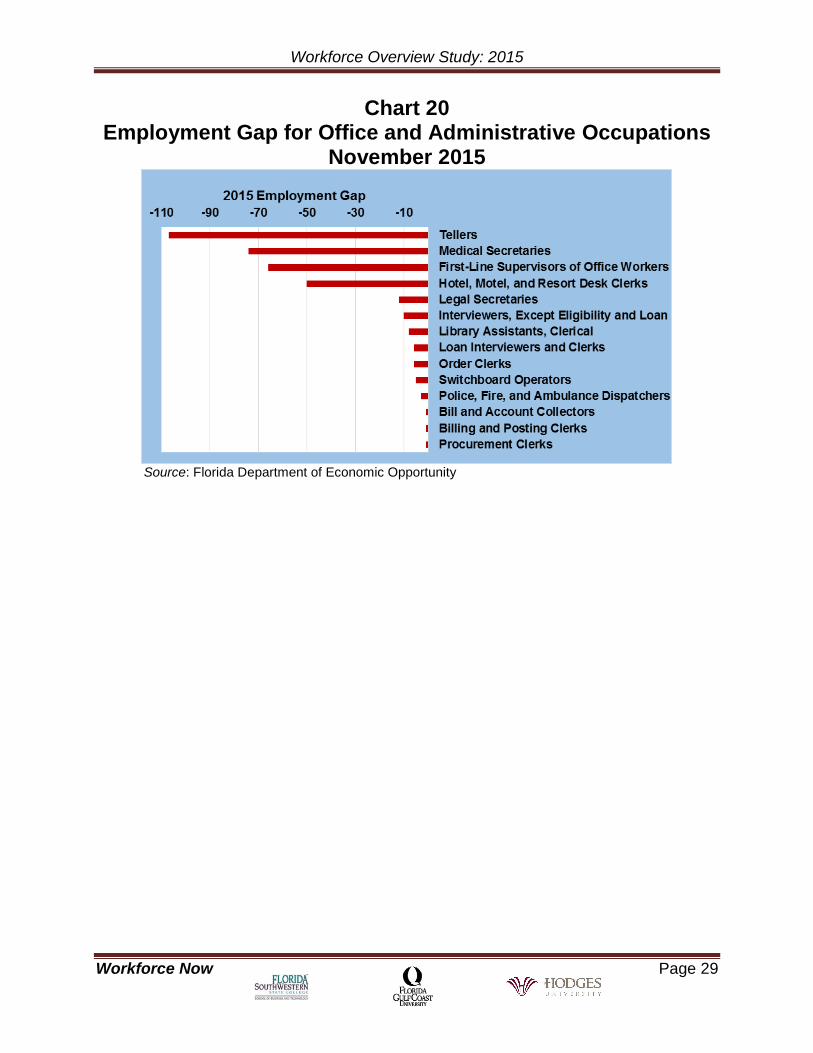
7.0 Southwest Florida Current Employment Gaps by Major Occupational Group
The Southwest Florida employment gaps can also be viewed by major occupational
groups. The largest occupations groups with employment gaps include sales, health
care, construction, installation, maintenance and repair, management, business and
financial operations, computer, architecture and engineering, and office and
administrative. The largest changes from last year’s analysis are the increasing
demands for construction, management, financial, computer, and engineering
occupations. The major occupational groups are shown in Charts 12-20.
Chart 12
Employment Gap for Sales Occupations November 2015
Source: Florida Department of Economic Opportunity

Workforce Overview Study: 2015
Workforce Now Page 25
Chart 13 Employment Gap for Health Care Occupations
November 2015
Source: Florida Department of Economic Opportunity

Workforce Overview Study: 2015
Workforce Now Page 26
Chart 14 Employment Gap for Construction Occupations
November 2015
Source: Florida Department of Economic Opportunity
Chart 15
Employment Gap for Installation, Maintenance, & Repair Occupations
November 2015
Source: Florida Department of Economic Opportunity
Workforce Overview Study: 2015
Workforce Now Page 27
Chart 16 Employment Gap for Management Occupations
November 2015
Source: Florida Department of Economic Opportunity
Chart 17
Employment Gap for Business and Financial Operations Occupations
November 2015
Source: Florida Department of Economic Opportunity

Workforce Overview Study: 2015
Workforce Now Page 28
Chart 18 Employment Gap for Computer Occupations
November 2015
Source: Florida Department of Economic Opportunity
Chart 19
Employment Gap for Architecture and Engineering Occupations
November 2015
Source: Florida Department of Economic Opportunity
Workforce Overview Study: 2015
Workforce Now Page 29
Chart 20 Employment Gap for Office and Administrative Occupations
November 2015
Source: Florida Department of Economic Opportunity

Workforce Overview Study: 2015
Workforce Now Page 30
8.0 Southwest Florida Long-term Average Annual Employment Growth by Occupation 2014 to 2022
The Florida Department of Economic Opportunity provided its forecast average
annual demand for Southwest Florida employees for the period 2014 to 2022. This
forecast provides additional information about expected annual occupational demands
for the region. Information is presented for the top 50 growth occupations along with the
current hourly wage and educational requirements. The top 10 employment growth
occupations are:
1. Retail salespersons
2. Waiters and waitresses
3. Cashiers
4. Food preparation and serving workers
5. Landscaping and groundskeepers
6. Registered Nurses
7. Carpenters
8. Office clerks
9. Customer service representatives
10. Secretaries and administrative assistants
The top 10 growth occupations are shown in Chart 21 and Table 11 and provide
the average annual growth per occupation along with the current median wage and
minimum educational requirement. The top 10 growth occupations primarily reflect
expected increases in retail, tourism, health care, and construction. Three of the top
growth occupations require less than a high school degree, three require a high school
degree or GED, three require adult vocational training, and one requires some college.
Median wage varied from $9 per hour to $30 per hour and was highly correlated with
the required minimum education.

Workforce Overview Study: 2015
Workforce Now Page 31
Chart 21 The Top 10 Long-term Employment Growth Occupations
Southwest Florida for 2014 to 2022
Source: Florida Department of Economic Opportunity
Table 11
Source: Florida Department of Economic Opportunity
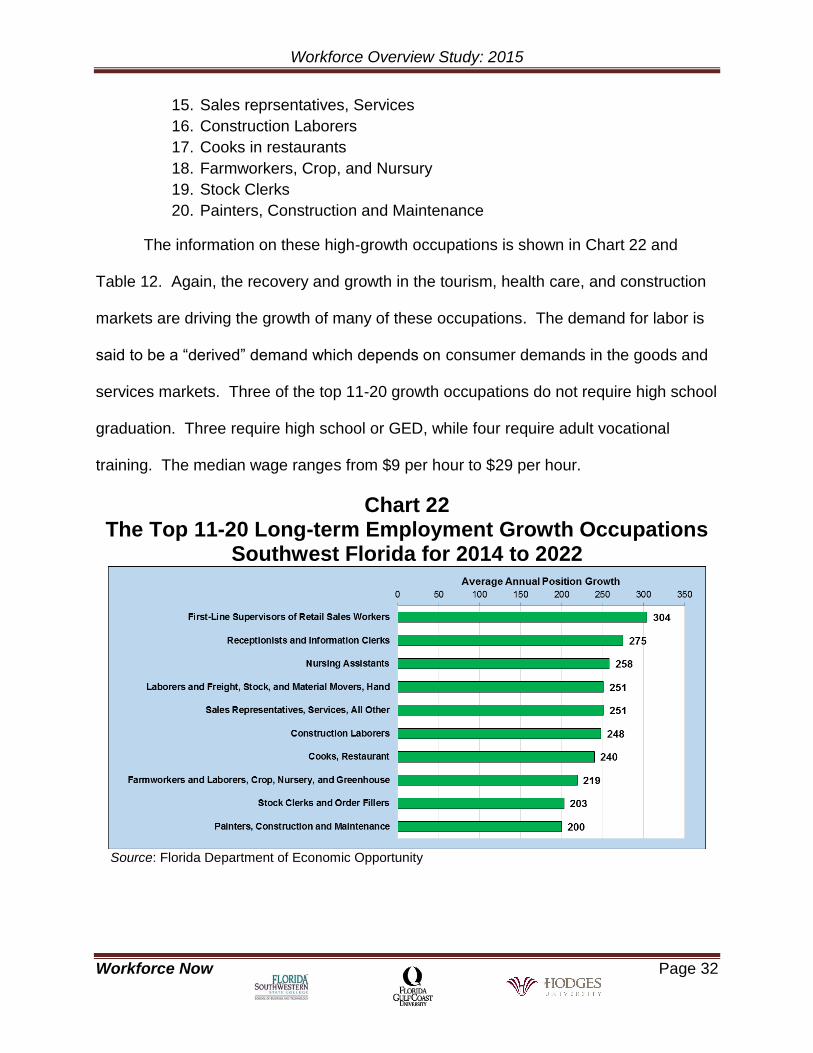
The top 11-20 highest growth occupations for Southwest Florida include:
11. First line supervisors of retail sales workers,
12. Receptionists and Information Clerks
13. Nursing assistants
14. Laborers, Freight and Stock
No. Occupation
Average
Annual
Growth
Current
Employment
Median
Wage
Minimum
Education
1 Retail Salespersons 1,199 23,266 10.81$ HS/GED
2 Waiters and Waitresses 1,001 14,685 9.10$ Less HS/GED
3 Cashiers 708 12,132 9.43$ HS/GED
4Combined Food Preparation and Serving Workers, Including
Fast Food555 11,644 9.02$ Less HS/GED
5 Landscaping and Groundskeeping Workers 463 11,155 10.59$ Less HS/GED
6 Registered Nurses 449 8,762 29.28$ Some College
7 Carpenters 399 6,265 17.12$ PS Adult Voc
8 Office Clerks, General 345 7,723 12.37$ HS/GED
9 Customer Service Representatives 323 6,670 13.31$ PS Adult Voc
10Secretaries and Administrative Assistants, Except Legal,
Medical, and Executive305 10,572 14.71$ PS Adult Voc
Workforce Overview Study: 2015
Workforce Now Page 32
15. Sales reprsentatives, Services
16. Construction Laborers
17. Cooks in restaurants
18. Farmworkers, Crop, and Nursury
19. Stock Clerks
20. Painters, Construction and Maintenance
The information on these high-growth occupations is shown in Chart 22 and
Table 12. Again, the recovery and growth in the tourism, health care, and construction
markets are driving the growth of many of these occupations. The demand for labor is
said to be a “derived” demand which depends on consumer demands in the goods and
services markets. Three of the top 11-20 growth occupations do not require high school
graduation. Three require high school or GED, while four require adult vocational
training. The median wage ranges from $9 per hour to $29 per hour.
Chart 22 The Top 11-20 Long-term Employment Growth Occupations
Southwest Florida for 2014 to 2022
Source: Florida Department of Economic Opportunity

Workforce Overview Study: 2015
Workforce Now Page 33
Table 12
Source: Florida Department of Economic Opportunity
The Top 21-30 Long-term growth occupations for Southwest Florida include:
21. Food preperation workers
22. Real estate sales agents
23. Hosts and hostesses
24. Dishwashers
25. Elementary school teachers
26. Maids and housekeeping cleaners
27. First-line supervisors of construction trades
28. Janitors
29. Bookkeeping, accounting, and auditing clerks
30. Sales representatives of manufacturing
The information on these high-growth occupations is shown in Chart 23 and Table
13. These fast-growth occupations include elemtentary school teachers, accounting
and auditing clerks, and other occupations related to tourism, retail, and real estate
sales. The regional economy is providing significant employment opportuntities for
people with minimal educational attainment. In fact, five of the fast-growth occupations
do not require high school graduation or equivalent. Two require adult vocational
training, two require some college, and one requires a bachelor’s degree or higher. The
No. Occupation
Average
Annual
Growth
Current
Employment
Median
Wage
Minimum
Education
11 First-Line Supervisors of Retail Sales Workers 304 8,481 18.73$ PS Adult Voc
12 Receptionists and Information Clerks 275 4,535 12.72$ HS/GED
13 Nursing Assistants 258 5,704 12.57$ PS Adult Voc
14Laborers and Freight, Stock, and Material Movers, Hand
251 4,849 10.78$ Less HS/GED
15 Sales Representatives, Services, All Other 251 4,089 28.52$ HS/GED
16 Construction Laborers 248 4,877 12.59$ Less HS/GED
17 Cooks, Restaurant 240 6,107 11.21$ PS Adult Voc
18Farmworkers and Laborers, Crop, Nursery, and Greenhouse
219 7,077 9.26$ Less HS/GED
19 Stock Clerks and Order Fillers 203 6,523 11.20$ HS/GED
20 Painters, Construction and Maintenance 200 3,123 14.13$ PS Adult Voc

Workforce Overview Study: 2015
Workforce Now Page 34
median wages ranged from $9 per hour for a dining room attendant and bartender to a
high of $29 per hour for elementary school teachers.
Chart 23 The Top 21-30 Long-term Employment Growth Occupations
Southwest Florida for 2014 to 2022
Source: Florida Department of Economic Opportunity
Table 13
Source: Florida Department of Economic Opportunity
The Top 31-40 highest growth occupations for Southwest Florida include:
No. Occupation
Average
Annual
Growth
Current
Employment
Median
Wage
Minimum
Education
21 Food Preparation Workers 199 3,753 10.42$ Less HS/GED
22 Real Estate Sales Agents 196 4,614 18.41$ PS Adult Voc
23Hosts and Hostesses, Restaurant, Lounge, and Coffee
Shop194 2,022 10.09$ Less HS/GED
24 Dishwashers 191 2,804 9.07$ Less HS/GED
25 Elementary School Teachers, Except Special Education 187 3,896 29.03$ Bachelor's
26 Maids and Housekeeping Cleaners 186 5,410 10.07$ Less HS/GED
27First-Line Supervisors of Construction Trades and
Extraction Workers182 2,516 25.94$ Some College
28Janitors and Cleaners, Except Maids and Housekeeping
Cleaners181 5,463 10.98$ Less HS/GED
29 Bookkeeping, Accounting, and Auditing Clerks 179 5,393 16.06$ Some College
30Sales Representatives, Wholesale and Manufacturing,
Except Technical and Scientific Products 177 4,061 20.29$ PS Adult Voc

Workforce Overview Study: 2015
Workforce Now Page 35
31. First-line supervisors of office workers
32. Maintenance and repair workers
33. Accountants and auditors
34. Dining room or cafeteria attendants and bartenders
35. Licensed practical and vocational nurses
36. Security guards
37. Heating, AC, and refrigeration mechanics
38. Childcare workers
39. First-line supervisors of food preparation and servicing workers
40. Construction managers
The information on these forecast high-growth occupations is shown in Chart 24 and
Table 14. Two of these occupations do not require high school graduation, five require
vocational training, two require some some college and one requires a bachelor’s
degree. The median wage varied from $9 per hour for bartenders to $33 per hour
forconstruction managers.
Chart 24 The Top 31-40 Long-term Employment Growth Occupations
Southwest Florida for 2014 to 2022
Source: Florida Department of Economic Opportunity

Workforce Overview Study: 2015
Workforce Now Page 36
Table 14
Source: Florida Department of Economic Opportunity
The Top 41-50 highest growth occupations for Southwest Florida include:
41. Farmers, ranchers, and other agricultural managers
42. Automotive service technicians and mechanics
43. Electricians
44. Bartenders
45. Home health aides
46. Heavy truck drivers
47. General and operations managers
48. Counter attendants and food concession
49. Amusement and recreational attendants
50. Medical assistants
The information on these forecast high-growth occupations is shown in Chart 25 and
Table 15. Three occupations require less than a high school diploma, five require
vocational training, and two require some college. This forecast is consistent with
recent trends in employment observed on the national level, in which significant job
growth is comprised of positions amenable to part-time labor. Such positions are
especially concentrated in service-dominated economies such as those prevalent in
No. Occupation
Average
Annual
Growth
Current
Employment
Median
Wage
Minimum
Education
31First-Line Supervisors of Office and Administrative Support
Workers176 3,744 22.61$ Some College
32 Maintenance and Repair Workers, General 168 4,715 15.82$ PS Adult Voc
33 Accountants and Auditors 162 3,686 28.73$ Bachelor's
34 Dining Room and Cafeteria Attendants and Bartender 156 2,754 9.13$ Less HS/GED
35 Licensed Practical and Licensed Vocational Nurses 154 2,668 20.38$ PS Adult Voc
36 Security Guards 153 4,185 10.97$ PS Adult Voc
37Heating, Air Conditioning, and Refrigeration Mechanics and
Installers150 2,214 19.18$ PS Adult Voc
38 Childcare Workers 148 2,627 10.19$ PS Adult Voc
39First-Line Supervisors of Food Preparation and Serving
Workers144 3,670 16.69$ PS Adult Voc
40 Construction Managers 141 3,557 32.92$ Some College

Workforce Overview Study: 2015
Workforce Now Page 37
Southwest Florida. The median wage varies from $9 per hour for counter attendants to
$46 per hour for general and operations managers.
Chart 25 The Top 41-50 Long-term Employment Growth Occupations
Southwest Florida for 2014 to 2022
Source: Florida Department of Economic Opportunity
Table 15
Source: Florida Department of Economic Opportunity
No. Occupation
Average
Annual
Growth
Current
Employment
Median
Wage
Minimum
Education
41 Farmers, Ranchers, and Other Agricultural Managers 139 7,201 28.69$ Some College
42 Automotive Service Technicians and Mechanics 137 3,085 18.35$ PS Adult Voc
43 Electricians 131 2,143 17.09$ PS Adult Voc
44 Bartenders 128 2,581 9.07$ Less HS/GED
45 Home Health Aides 124 1,709 11.21$ PS Adult Voc
46 Heavy and Tractor-Trailer Truck Drivers 123 3,153 16.19$ PS Adult Voc
47 General and Operations Managers 117 3,800 45.92$ Some College
48Counter Attendants, Cafeteria, Food Concession, and
Coffee Shop115 1,159 9.07$ Less HS/GED
49 Amusement and Recreation Attendants 114 1,504 9.22$ Less HS/GED
50 Medical Assistants 113 2,436 14.79$ PS Adult Voc

Workforce Overview Study: 2015
Workforce Now Page 38
9.0 Top Growth Occupations by Minimum Educational Requirement
The study looked at long-run occupational growth by identifying the fastest-growing
occupations by the minimal educational requirement including:
Post-Secondary Adult Vocational
Some College
Bachelor’s Degree
Master’s Degree or Higher
The expected top long-run growth occupations requiring a minimum of post-
secondary adult vocational training are carpenters, customer service representatives,
secretaries and administrative assistants, first-line supervisors of retail sales, nursing
assistants, cooks, painters, sales representatives, and maintenance and repair workers,
as shown in Chart 26 and Table 16 along with the median wage and current
employment.

Workforce Overview Study: 2015
Workforce Now Page 39
Chart 26 The Top 10 Adult Vocational
Long-term Employment Growth Occupations Southwest Florida for 2014 to 2022
Source: Florida Department of Economic Opportunity
Table 16
Source: Florida Department of Economic Opportunity
The forecast top 11 to 20 occupations for growth from 2014 to 2022 requiring a
minimum of post-secondary adult vocational training are licensed practical & vocational
nurses, security guards, heating, AC, and refrigeration mechanics and installers,
No. Occupation
Average
Annual
Growth
Current
Employment
Median
Wage
1 Carpenters 399 6,265 17.12$
2 Customer Service Representatives 323 6,670 13.31$
3
Secretaries and Administrative Assistants, Except Legal,
Medical, and Executive 305 10,572 14.71$
4 First-Line Supervisors of Retail Sales Workers 304 8,481 18.73$
5 Nursing Assistants 258 5,704 12.57$
6 Cooks, Restaurant 240 6,107 11.21$
7 Painters, Construction and Maintenance 200 3,123 14.13$
8 Real Estate Sales Agents 196 4,614 18.41$
9
Sales Representatives, Wholesale and Manufacturing, Except
Technical and Scientific Products 177 4,061 20.29$
10 Maintenance and Repair Workers, General 168 4,715 15.82$

Workforce Overview Study: 2015
Workforce Now Page 40
childcare workers, first-line supervisors of food preparation and serving, automotive
service technicians, electricians, home health aides, heavy and tractor-trailer truck
drivers, and medical assistants, as shown in Chart 27 and Table 17.
Chart 27 The Top 11-20 Adult Vocational
Long-term Employment Growth Occupations Southwest Florida for 2014 to 2022
Source: Florida Department of Economic Opportunity
Table 17
Source: Florida Department of Economic Opportunity
No. Occupation
Average
Annual
Growth
Current
Employment
Median
Wage
11 Licensed Practical and Licensed Vocational Nurses 154 2,668 20.38$
12 Security Guards 153 4,185 10.97$
13Heating, Air Conditioning, and Refrigeration Mechanics and
Installers150 2,214 19.18$
14 Childcare Workers 148 2,627 10.19$
15First-Line Supervisors of Food Preparation and Serving Workers
144 3,670 16.69$
16 Automotive Service Technicians and Mechanics 137 3,085 18.35$
17 Electricians 131 2,143 17.09$
18 Home Health Aides 124 1,709 11.21$
19 Heavy and Tractor-Trailer Truck Drivers 123 3,153 16.19$
20 Medical Assistants 113 2,436 14.79$

Workforce Overview Study: 2015
Workforce Now Page 41
The forecast top 10 occupations for growth from 2014 to 2022 requiring a
minimum of “some college” are registered nurses, first-line supervisors of construction
trades, bookkeeping, accounting, and auditing clerks, first-line supervisors of office
support, construction managers, farmers, ranchers and other agricultural managers,
general and operations managers, business operations specialists, property, real
estate, and community association managers, and cost estimators, as shown in Chart
28 and Table 18.
Chart 28
The Top 10 Some College Long-term Employment Growth Occupations
Southwest Florida for 2014 to 2022
Source: Florida Department of Economic Opportunity

Workforce Overview Study: 2015
Workforce Now Page 42
Table 18
Source: Florida Department of Economic Opportunity
The forecast top 11 to 20 occupations for growth from 2014 to 2022 requiring a
minimum of “some college” are recreation workers, human resources specialists,
preschool teachers, food service managers, first-line supervisors of non-retail sales
workers, dental hygienists, managers, graphic designers, emergency medical
technicians and paramedics, and veterinary technologists and technicians, as shown in
Chart 29 and Table 19
No. Occupation
Average
Annual
Growth
Current
Employment
Median
Wage
1 Registered Nurses 449 8,762 29.28$
2First-Line Supervisors of Construction Trades and Extraction
Workers182 2,516 25.94$
3 Bookkeeping, Accounting, and Auditing Clerks 179 5,393 16.06$
4First-Line Supervisors of Office and Administrative Support
Workers176 3,744 22.61$
5 Construction Managers 141 3,557 32.92$
6 Farmers, Ranchers, and Other Agricultural Managers 139 7,201 28.69$
7 General and Operations Managers 117 3,800 45.92$
8 Business Operations Specialists, All Other 111 2,672 26.80$
9 Property, Real Estate, and Community Association Managers 98 2,997 27.05$
10 Cost Estimators 65 792 26.36$

Workforce Overview Study: 2015
Workforce Now Page 43
Chart 29 The Top 11-20 Some College
Long-term Employment Growth Occupations Southwest Florida for 2014 to 2022
Source: Florida Department of Economic Opportunity
Table 19
Source: Florida Department of Economic Opportunity
The forecast top 10 occupations for growth from 2014 to 2022 requiring a
bachelor’s degree include elementary school teachers, accountants and auditors,
secondary school teachers, middle school teachers, management analysts, market
research analysts, medical and health service managers, kindergarden teachers,
No. Occupation
Average
Annual
Growth
Current
Employment
Median
Wage
11 Recreation Workers 54 1,552 11.40$
12 Human Resources Specialists 44 909 23.38$
13 Preschool Teachers, Except Special Education 41 883 11.46$
14 Food Service Managers 40 1,186 28.49$
15 First-Line Supervisors of Non-Retail Sales Workers 39 1,106 29.71$
16 Dental Hygienists 37 627 35.39$
17 Managers, All Other 36 914 36.54$
18 Graphic Designers 34 719 19.40$
19 Emergency Medical Technicians and Paramedics 30 636 17.68$
20 Veterinary Technologists and Technicians 29 497 15.30$

Workforce Overview Study: 2015
Workforce Now Page 44
securities and financial sales agents, and special education teachers. These
occupations along with the current median hourly wage and current employment are
shown in Chart 30 and Table 20.
Chart 30 The Top 10 Bachelor’s Degree
Long-term Employment Growth Occupations Southwest Florida for 2014 to 2022
Source: Florida Department of Economic Opportunity
Table 20
Source: Florida Department of Economic Opportunity
No. Occupation
Average
Annual
Growth
Current
Employment
Median
Wage
1 Elementary School Teachers, Except Special Education 187 3,896 29.03$
2 Accountants and Auditors 162 3,686 28.73$
3Secondary School Teachers, Except Special and
Career/Technical Education95 2,202 30.56$
4Middle School Teachers, Except Special and Career/Technical
Education94 1,956 29.28$
5 Management Analysts 86 1,625 29.01$
6 Market Research Analysts and Marketing Specialists 42 510 23.04$
7 Medical and Health Services Managers 40 724 46.17$
8 Kindergarten Teachers, Except Special Education 39 747 28.24$
9 Securities, Commodities, and Financial Services Sales Agents 39 891 37.30$
10 Special Education Teachers, All Other 38 1,112 32.45$

Workforce Overview Study: 2015
Workforce Now Page 45
The 11 through 20 top growth occupations requiring a minimum of a bachelor’s
degree are teachers and instructors, chief executives, civil engineers, financial
managers, directors of religious activities, personal financial advisors, sales managers,
computer network architects, environmental scientists and specialists, and training and
development specialists, as shown in Chart 31 and Table 21.
Chart 31 The Top 11-20 Bachelor’s degree
Long-term Employment Growth Occupations Southwest Florida for 2014 to 2022
Source: Florida Department of Economic Opportunity

Workforce Overview Study: 2015
Workforce Now Page 46
Table 21
Source: Florida Department of Economic Opportunity
The forecast top 10 occupations for growth from 2014 to 2022 requiring a
master’s degree or higher include lawyers, family and general practitioners,
pharmacists, physical therapists, dentists, health care social workers, nurse
practitioners, occupational therapists, education, guidance and vocational counselors,
and instructional coordinators, as shown in Chart 32 and Table 22.
No. Occupation
Average
Annual
Growth
Current
Employment
Median
Wage
11 Teachers and Instructors, All Other 38 1,043 17.65$
12 Chief Executives 36 832 91.88$
13 Civil Engineers 35 666 36.39$
14 Financial Managers 33 900 48.41$
15 Directors, Religious Activities and Education 29 708 17.40$
16 Personal Financial Advisors 27 659 33.36$
17 Sales Managers 27 522 61.06$
18 Computer Network Architects 25 619 29.19$
19 Environmental Scientists and Specialists, Including Health 24 555 24.12$
20 Training and Development Specialists 24 488 23.35$

Workforce Overview Study: 2015
Workforce Now Page 47
Chart 32 The Top 10 Master’s Degree or Higher
Long-term Employment Growth Occupations Southwest Florida for 2014 to 2022
Source: Florida Department of Economic Opportunity
Table 22
Source: Florida Department of Economic Opportunity
The forecast top 11 to 20 occupations for growth from 2014 to 2022 requiring a
master’s degree or higher include architects, speech-language pathologists,
veterinarians, biochemists and biophysicists, child, family and school social workers,
No. Occupation
Average
Annual
Growth
Current
Employment
Median
Wage
1 Lawyers 75 1,812 36.67$
2 Family and General Practitioners 49 991 91.72$
3 Pharmacists 48 940 59.40$
4 Physical Therapists 44 929 39.78$
5 Dentists, General 36 648 66.33$
6 Healthcare Social Workers 27 415 22.72$
7 Nurse Practitioners 23 410 47.07$
8 Occupational Therapists 23 386 41.70$
9 Educational, Guidance, School, and Vocational Counselors 22 448 30.95$
10 Instructional Coordinators 22 453 21.77$
Workforce Overview Study: 2015
Workforce Now Page 48
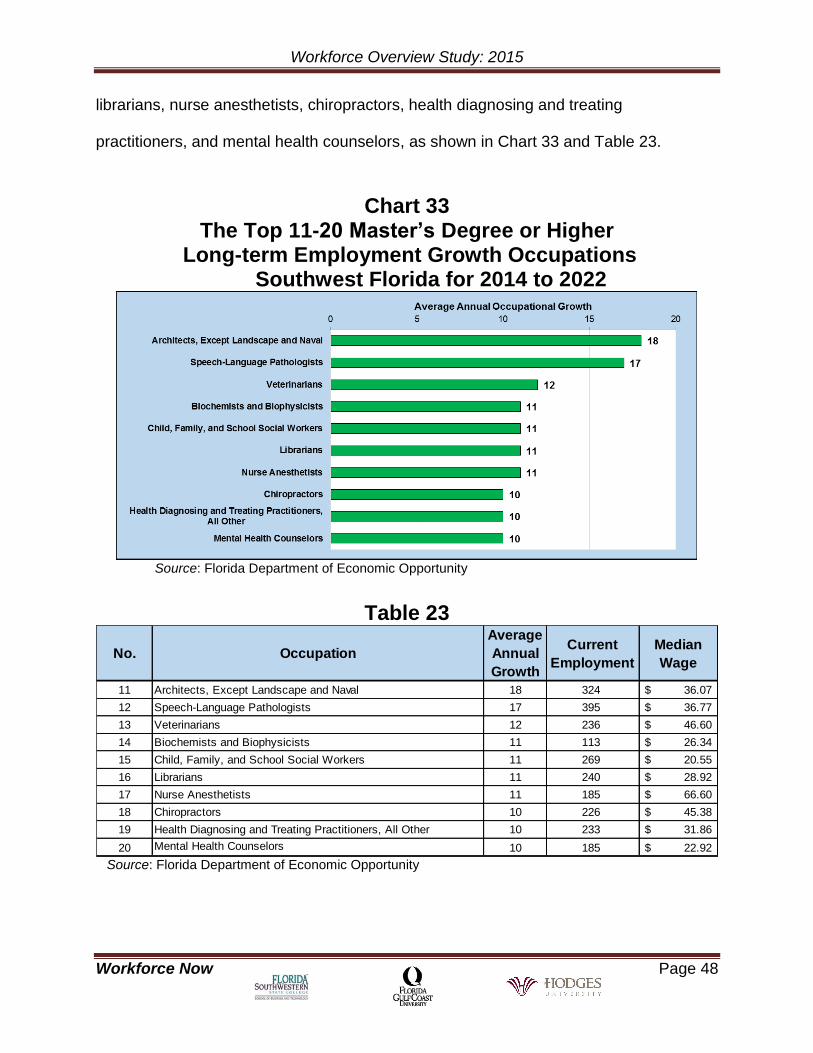
librarians, nurse anesthetists, chiropractors, health diagnosing and treating
practitioners, and mental health counselors, as shown in Chart 33 and Table 23.
Chart 33
The Top 11-20 Master’s Degree or Higher Long-term Employment Growth Occupations
Southwest Florida for 2014 to 2022
Source: Florida Department of Economic Opportunity
Table 23
Source: Florida Department of Economic Opportunity
No. Occupation
Average
Annual
Growth
Current
Employment
Median
Wage
11 Architects, Except Landscape and Naval 18 324 36.07$
12 Speech-Language Pathologists 17 395 36.77$
13 Veterinarians 12 236 46.60$
14 Biochemists and Biophysicists 11 113 26.34$
15 Child, Family, and School Social Workers 11 269 20.55$
16 Librarians 11 240 28.92$
17 Nurse Anesthetists 11 185 66.60$
18 Chiropractors 10 226 45.38$
19 Health Diagnosing and Treating Practitioners, All Other 10 233 31.86$
20 Mental Health Counselors 10 185 22.92$

Workforce Overview Study: 2015
Workforce Now Page 49
10.0 Herfindahl-Hirschman Index Starting with the present edition of the Southwest Florida Workforce Overview
Study, the research team presents findings for the Herfindahl-Hirshman Index applied to
the Southwest Florida workforce.
The HHI is a common economic measure of market concentration, typically used
to gauge the extent to which a given market is served by few large firms (and is
therefore relatively monopolistic) or many small firms (and is therefore relatively
competitive). The higher the measure, the more monopolistic a given market is. For
instance, it would be assumed that the market for health insurance would have a higher
HHI because it is served by fewer and larger firms, whereas the market for commodities
such as cotton have a lower HHI because it is served by many small producers.
The team computed the HHI for Southwest Florida’s workforce in an effort to
track, over time, its degree of workforce diversity based on the assumption that a more
diverse labor market (in which most jobs are spread out among many industries) would
have a lower HHI, and a less diverse one (in which most jobs are concentrated in a few
industries) would have a higher HHI. When applied to firm size and concentration, the
HHI is computed by summing the squared values of the market shares for each of the
firms that comprise a given market. In this case, the research team treats Southwest
Florida’s workforce as a separate market, and sum the squared values of each
industry’s share of the market.
As shown in Chart 34, Southwest Florida’s workforce became less diversified in
the in the years leading up to the 2008 recession (shown in the shaded area). The
increase in concentration from 2002 to 2006 is recorded by the HHI increasing from

Workforce Overview Study: 2015
Workforce Now Page 50
1001 to 1080—an 8 percent increase. However, the decline in concentration that
followed can be explained (partly) by the contraction of the construction industry
(beginning prior to the recession), as well as by reductions in the labor force by other
industries that contributed to workforce concentration during the boom.
Chart 34 Herfindahl-Hirschman Index
Southwest Florida for 2002-2014
Source: Data computed by the RERI, based on annual data obtained from the QCEW.
The HHI’s relative stability in the post-recession years suggest a healthier and
more stable labor market relative to the one that existed during the previous boom. A
key point is not only whether the workforce is diverse enough to weather adverse
economic conditions in the future, but also whether it is growing and dynamic enough to
retain workers who would otherwise leave for better work opportunities elsewhere.
Based on this analysis, it is reasonable to conclude that future increases in the HHI
would suggest our region’s economy will again growing at unsustainable rates. The

Workforce Overview Study: 2015
Workforce Now Page 51
concern is that high HHI measures would signal instability characterized by a tendency
to overheat during boom periods and overcorrect during recessionary periods. Also, we
note that the present range of the HHI (between 1,064 and 1,069 for the five-year period
ending in 2014) is not necessarily ideal and that a more dynamic labor market and a
more resilient regional economy might be characterized by lower HHI measures over
time.

Workforce Overview Study: 2015
Workforce Now Page 52
Summary/Conclusions
Education and training and other activities that improve human capital tend to
lead to greater productivity and higher wages. Twelve percent of the top 50
employment gaps identified an education requirement less than high school with an
average median wage in Southwest Florida of only $11.58 per hour. Adult vocational
training covers a wide range of occupations and represented 42 percent of the top 50
employment gaps identified. The median wage for occupations requiring adult
vocational training was higher at $14.72. Some college or higher including an associate
degree was required by 18 percent of the top 50 employment gaps with a median wage
of $18.79. A bachelor’s degree or higher was a requirement of 10 percent of the top 50
employment gaps identified with a median wage of $26.69 per hour and a master’s
degree or higher was required by 8 percent of the top 50 employment gaps identified,
earning a median wage of $35.32 per hour. Given that the major employment gains
over the last year have occurred in two industries (retail and food service and
accommodation) and that the growth of these jobs far outpaces that of the higher wage-
earning occupations in our area, average wages in Southwest Florida have decreased.
Assuming consistent metrics employed by the Florida Department of Economic
Opportunity year on year, the net result is that the average annual wage in Southwest
Florida has decreased by $751 while the average annual wage in the state has
increased by $1,159 during the same time period.
This study has provided an overview of Southwest Florida’s labor market
including the mix of industries, current employment gaps and forecast growth
occupations. The quality, depth, and diversity of a region’s workforce are critical

Workforce Overview Study: 2015
Workforce Now Page 53
components in fostering economic growth and development. The importance of this
information in understanding what opportunities exist for students, parents, businesses,
and educators will help foster discussion, better decisions, and more collaboration.
Technology and globalization are driving change in our lives and employment
opportunities. The Workforce Now research is designed to provide a continuous flow of
research focused on Southwest Florida’s labor market.


