Download - Women in transition and today: what do they want, realize, and experience in the labor market?

Women in transition and today: what do they want, realize, and experience in the labor market?
Women in transition and today: what do they want, realize,and experience in the labor market?
(with Magdalena Smyk and Lucas van der Velde)
Karolina GorausPhD Candidate
Faculty of Economic SciencesUniversity of Warsaw
Warsaw International Economic Meeting03 July 2015

Women in transition and today: what do they want, realize, and experience in the labor market?
Table of contents
1 Motivation and insights from literature
2 Data and methodology
3 Results
4 Conclusions

Women in transition and today: what do they want, realize, and experience in the labor market?
Motivation and insights from literature
Motivation
Women’s empowerment on the labor market has impact on:
investment in children human capital and health (Attanasio et al. 2002,Doss 2006, Schady et al. 2006, Schady et al. 2009, Rubalcava et al. 2009,Luke and Munschi 2011)
the empowerment of future generations of women (Fortin 2005, Farre andVella 2013)
overall economic development (Klasen 2000, Klasen et al. 2009, Duflo2008)
Trends in the world
Gender inequalities in activity rates are universally decreasing around the world,both in advanced and developing countries (World Development Report, WorldBank, 2012).
Situation in transition countries
Transition economies are the exception where the situation over the last 20years in same cases stagnated, and in some even worsened.

Women in transition and today: what do they want, realize, and experience in the labor market?
Motivation and insights from literature
Gender difference in activity rates in EU-15 and transition countries
Data: Eurostat

Women in transition and today: what do they want, realize, and experience in the labor market?
Motivation and insights from literature
Goals and expectations I
Challenges in accurate measurement of progress in gender equality on thelabour market:
1 labor market outcomes of women that are more similar to men can reflectless discrimination, but can also be fully or partially related to differencesin characteristics
2 positive (or negative) changes might be underestimated because theyaffect only some generations, while the outcomes are often measured forthe whole labour force
3 it is difficult to disentangle the impact of women’s preferences from someexternal factors influencing their decisions
Women in transition and today: what do they want, realize, and experience in the labor market?
Motivation and insights from literature
Goals and expectations II
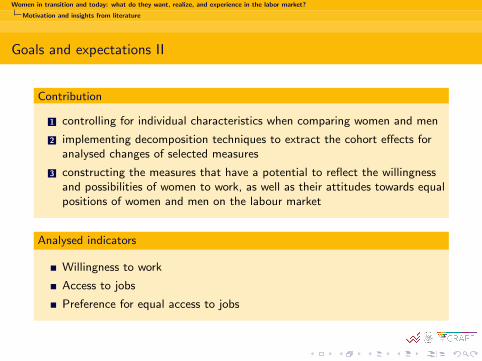
Contribution
1 controlling for individual characteristics when comparing women and men
2 implementing decomposition techniques to extract the cohort effects foranalysed changes of selected measures
3 constructing the measures that have a potential to reflect the willingnessand possibilities of women to work, as well as their attitudes towards equalpositions of women and men on the labour market
Analysed indicators
Willingness to work
Access to jobs
Preference for equal access to jobs

Women in transition and today: what do they want, realize, and experience in the labor market?
Data and methodology
1 Motivation and insights from literature
2 Data and methodology
3 Results
4 Conclusions
Women in transition and today: what do they want, realize, and experience in the labor market?
Data and methodology
Data
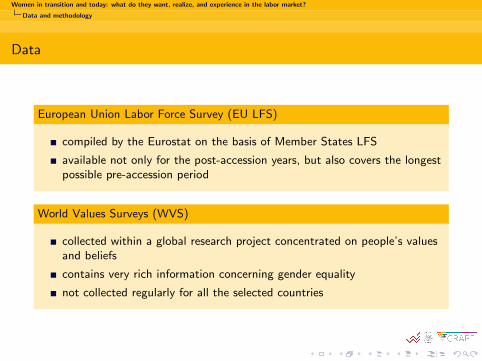
European Union Labor Force Survey (EU LFS)
compiled by the Eurostat on the basis of Member States LFS
available not only for the post-accession years, but also covers the longestpossible pre-accession period
World Values Surveys (WVS)
collected within a global research project concentrated on people’s valuesand beliefs
contains very rich information concerning gender equality
not collected regularly for all the selected countries
Women in transition and today: what do they want, realize, and experience in the labor market?
Data and methodology
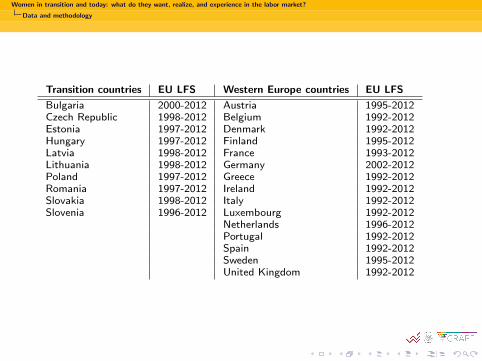
Transition countries EU LFS Western Europe countries EU LFS
Bulgaria 2000-2012 Austria 1995-2012Czech Republic 1998-2012 Belgium 1992-2012Estonia 1997-2012 Denmark 1992-2012Hungary 1997-2012 Finland 1995-2012Latvia 1998-2012 France 1993-2012Lithuania 1998-2012 Germany 2002-2012Poland 1997-2012 Greece 1992-2012Romania 1997-2012 Ireland 1992-2012Slovakia 1998-2012 Italy 1992-2012Slovenia 1996-2012 Luxembourg 1992-2012
Netherlands 1996-2012Portugal 1992-2012Spain 1992-2012Sweden 1995-2012United Kingdom 1992-2012

Women in transition and today: what do they want, realize, and experience in the labor market?
Data and methodology
Transition WVS Western Europe WVScountries countries
Bulgaria 1997,2005 AustriaCzech Republic 1991 BelgiumEstonia 1996, 2011 DenmarkHungary 1982,1998,2009 Finland 1981,1996,2005Latvia 1996 France 2006Lithuania 1997 Germany 1997,2006,2013Poland 1989,1997,2005, 2012 GreeceRomania 1998,2005,2012 IrelandSlovakia 1990,1998 Italy 2005Slovenia 1995,2005,2011 Luxembourg
Netherlands 2006,2012PortugalSpainSweden 1981,1996,1999,2006,2011United Kingdom 1998,2005

Women in transition and today: what do they want, realize, and experience in the labor market?
Data and methodology
Analysed indicators I
Willingness to work1 measure of probability of being active
P(active = 1|gender) = α+β1age+β2edum+β3eduh+β4relation+β5kid+β6urban
2 measure of relative disadvantage of each women in activity on the labormarket (difference between the probability of men with the same set ofcharacteristics to be active, and her probability to be active)
Access to jobsThe same procedure, but we restrict the sample to those individuals whoare (1) wage-employed or (2) actively searching for a job.
Preference for equal access to jobsMeasure of women’s belief in equal participation: ”When jobs are scarce,men should have more right to a job than women”
Women in transition and today: what do they want, realize, and experience in the labor market?
Data and methodology
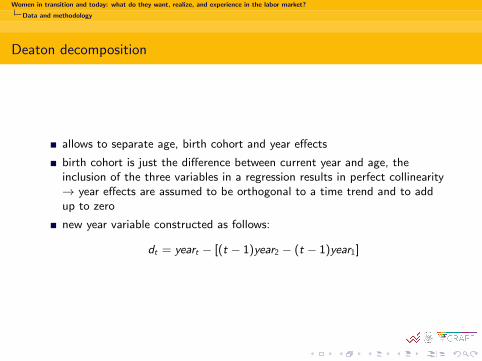
Deaton decomposition
allows to separate age, birth cohort and year effects
birth cohort is just the difference between current year and age, theinclusion of the three variables in a regression results in perfect collinearity→ year effects are assumed to be orthogonal to a time trend and to addup to zero
new year variable constructed as follows:
dt = yeart − [(t − 1)year2 − (t − 1)year1]

Women in transition and today: what do they want, realize, and experience in the labor market?
Results
1 Motivation and insights from literature
2 Data and methodology
3 Results
4 Conclusions

Women in transition and today: what do they want, realize, and experience in the labor market?
Results
Women’s activity rates by age in transition countries
2000: 2010:

Women in transition and today: what do they want, realize, and experience in the labor market?
Results
Women’s activity rates by age in EU15 countries
2000: 2010:
Women in transition and today: what do they want, realize, and experience in the labor market?
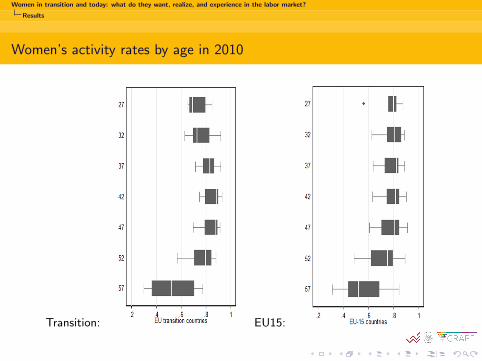
Results
Women’s activity rates by age in 2010
Transition: EU15:

Women in transition and today: what do they want, realize, and experience in the labor market?
Results
Gender differences in willingness to work: cohort effect in Western Europecountries

Women in transition and today: what do they want, realize, and experience in the labor market?
Results
Gender differences in willingness to work: cohort effect in Transitioncountries

Women in transition and today: what do they want, realize, and experience in the labor market?
Results
Gender differences in willingness to work: age effect in Western Europecountries

Women in transition and today: what do they want, realize, and experience in the labor market?
Results
Gender differences in willingness to work: age effect in Transition countries

Women in transition and today: what do they want, realize, and experience in the labor market?
Results
Gender differences in access to jobs
cohort effect in Western Europe countries figure
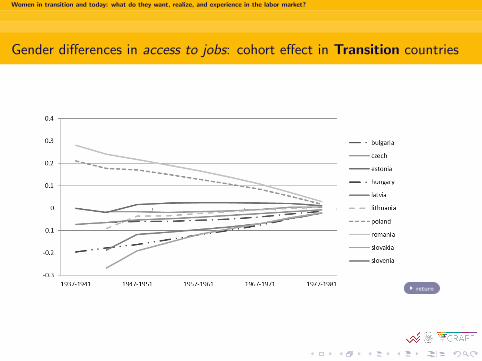
cohort effect in Transition countries figure
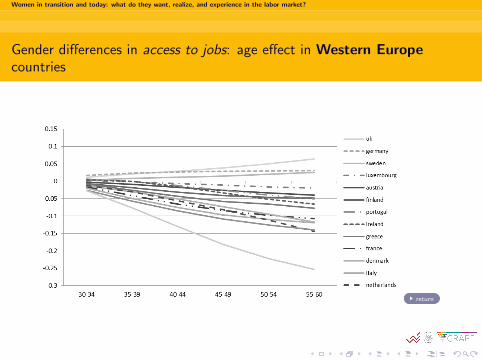
age effect in Western Europe countries figure
age effect in Transition countries figure

Women in transition and today: what do they want, realize, and experience in the labor market?
Results
Willingness to work - results summary
cohort effects
transition country -0.0558*born between 1937-1941 0.245***born between 1947-1951 0.180***born between 1952-1956 0.147***born between 1957-1961 0.111***born between 1962-1966 0.0780***born between 1967-1971 0.0513***born between 1972-1976 0.0258born between 1937-1941 * transition -0.241***born between 1942-1946 * transition -0.213***born between 1947-1951 * transition -0.179***born between 1952-1956 * transition -0.150***born between 1957-1961 * transition -0.115***born between 1962-1966 * transition -0.0854***born between 1967-1971 * transition -0.0566*born between 1972-1976 * transition -0.0201country fixed effects includedconstant 0.0326Observations 219R-squared 0.864
Note: Reference cohort group: born between 1977-1981. Standard errors in parentheses.*** p<0.01, ** p<0.05, * p<0.1

Women in transition and today: what do they want, realize, and experience in the labor market?
Results
Willingness to work - results summary
age effects
transition country -0.0759***age: 30-34 -0.0233*age: 35-39 -0.0657***age: 40-45 -0.106***age: 45-49 -0.141***age: 50-55 -0.175***age: 30-34 * transition -0.00724age: 35-39 * transition 0.0103age: 40-45 * transition 0.0369*age: 45-49 * transition 0.0627***age: 50-55 * transition 0.0876***country fixed effects includedconstant 0.0617***Observations 150R-squared 0.854
Note: Reference age group: 25-29. Standard errors in parentheses.*** p<0.01, ** p<0.05, * p<0.1

Women in transition and today: what do they want, realize, and experience in the labor market?
Results
Preference for equal access to jobs
Table: Percentage of females who answered ”I agree with the statement: when job arescarce, men should have more right to a job than women” - cohort patterns
1936- 1942- 1947- 1952- 1957- 1962- 1967- 1972- 1977-1941 1946 1951 1956 1961 1966 1971 1976 1981
Transition 90s 41.70% 35.10% 36.20% 33.60% 25.10% 24.90% 19.90% 23.50% 16.40%countries 2000s 33.70% 20.70% 25.00% 26.50% 22.80% 21.80% 18.70% 18.10% 18.10%
2010s 31.80% 32.10% 30.20% 24.40% 23.90% 23.70% 19.50% 21.80% 19.20%
Western 90s 25.40% 27.70% 20.50% 18.20% 14.70% 10.80% 9.10% 5.40% 6.40%countries 2000s 21.20% 12.10% 14.20% 8.40% 9.50% 6.70% 9.00% 9.30% 6.70%
2010s 13.60% 12.70% 8.40% 7.90% 7.70% 4.30% 4.90% 3.70% 6.20%

Women in transition and today: what do they want, realize, and experience in the labor market?
Conclusions
Conclusions
in EU-15 countries women born later enjoy a more equal position on thelabour market
women are participating more and their activity rates become more similarto men with similar characteristicswomen attitudes towards equal gender positions on the labour marketchanged in line with the labour market participation and employment rates
the picture for transition economies is much more puzzlingyounger cohorts are more empowered in their views concerning equality onlabour marketgender differences in probabilities to be active are among youngergenerations similar or even bigger than among older generations

Women in transition and today: what do they want, realize, and experience in the labor market?
Gender differences in access to jobs: cohort effect in Western Europecountries
return
Women in transition and today: what do they want, realize, and experience in the labor market?
Gender differences in access to jobs: cohort effect in Transition countries
return
Women in transition and today: what do they want, realize, and experience in the labor market?
Gender differences in access to jobs: age effect in Western Europecountries
return

Women in transition and today: what do they want, realize, and experience in the labor market?
Gender differences in access to jobs: age effect in Transition countries
return


