A weekly publication of the Agricultural Marketing Service www.ams.usda.gov/GTR
September 2, 2021
Contents
Article/ Calendar
Grain
Transportation Indicators
Rail
Barge
Truck
Exports
Ocean
Brazil
Mexico
Grain Truck/Ocean Rate Advisory
Datasets
Specialists
Subscription Information
--------------
The next release is
September 9, 2021
Preferred citation: U.S. Department of Agriculture, Agricultural Marketing Service. Grain Transportation Report. September 2, 2021. Web: http://dx.doi.org/10.9752/TS056.09-02-2021
Grain Transportation Report
Contact Us
WEEKLY HIGHLIGHTS
Hurricane Ida Impacts Freight Traffic Into and out of the Lower Mississippi River
In the wake of Hurricane Ida, which made landfall in Louisiana on August 29, the Mississippi River was closed from Baton Rouge to the
Gulf of Mexico for 5 days. As of today, vessel traffic above Mississippi River mile marker 167.5 near St. James, LA, and south of mile
marker 105 near Bridge City, LA, is open but restricted to daylight hours only. The river remains closed between mile markers 105 and
167.5. The situation is fluid and changing quickly as officials continue assessing channel safety. While constrained by power outages and
limited labor availability, grain elevators are still assessing damage. All interstates are now open in Louisiana, with the exception of two
sections of I-55—a major north/south artery to access LaPlace and New Orleans. However, State officials have asked to keep these
arteries clear for the use of emergency personnel. Railroads report widespread power outages, fallen trees, and major flooding have closed
lanes and inhibited service-restoration efforts. Rail customers should expect delays of 48-72 hours. More than 50 percent of U.S. grain
exports depend on this region to reach overseas markets.
DOT Designates Six New Marine Highway Projects
On August 19, the U.S. Department of Transportation’s Maritime Administration announced the designation of six new marine highway
projects as part of the America’s Marine Highway Program (AMHP). AMHP encourages use of the Nation’s inland waterways for
moving freight and people to save costs and reduce the congestion of land-based transportation. An AMHP designation qualifies projects
on marine highway routes to receive grants when program funding is available. One newly designated project—the Missouri River
Container on Barge Project—will expand options for transporting goods: a new service will allow the river to accommodate barges
carrying containers (including those with agricultural commodities). The project will affect movements originating from ports and
terminals in Central Missouri, destined to ocean ports on the U.S. Gulf.
Port of Houston Signs Agreement for $1.1 Billion Channel Expansion
On August 19, the Port of Houston and U.S. Army Corps of Engineers signed a partnership agreement on a $1.1 billion project to expand
the Houston Ship Channel. Along the channel’s 26-mile Galveston Bay reach, the project will widen the Houston Ship Channel from 530
feet to a total 700 feet wide and deepen upstream segments from 45 feet to a total 46.5 feet deep. The deeper, wider channel will allow
safe passage of larger vessels, accommodating an estimated additional 1,400 vessels per year. According to USDA, in 2017, bulk grain
export shipments accounted for 62 percent of total U.S. waterborne agricultural exports through the Port of Houston, a key grain export
port.
Snapshots by Sector
Export Sales
For the week ending August 19, unshipped balances of wheat, corn, and soybeans totaled 10.5 million metric tons (mmt). This was 13
percent lower than last week and 16 percent lower than the same time last year. Net corn export sales were 0.007 mmt, down 97 percent
from the past week. Net soybean export sales were 0.075 mmt, up 11 percent from the previous week. Net weekly wheat export sales
were 0.116 mmt, down 62 percent from last week.
Rail
U.S. Class I railroads originated 18,098 grain carloads during the week ending August 21. This was a 7-percent decrease from the
previous week, 20 percent less than last year, and 19 percent lower than the 3-year average.
Average September shuttle secondary railcar bids/offers (per car) were $15 below tariff for the week ending August 26. This was $35
more than last week and $819 lower than this week last year. There were no non-shuttle bids/offers this week.
Barge
For the week ending August 28, barged grain movements totaled 289,938 tons. This was 28 percent lower than the previous week and
69 percent lower than the same period last year.
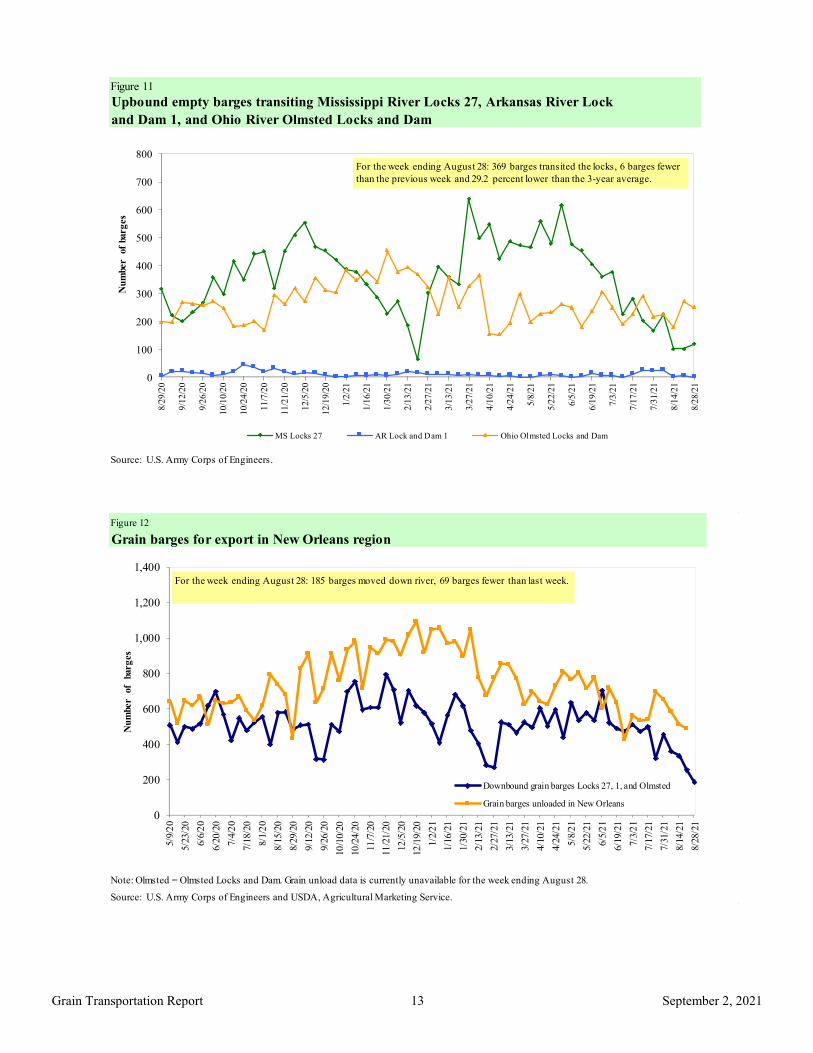
For the week ending August 28, 185 grain barges moved down river—69 fewer barges than the previous week.
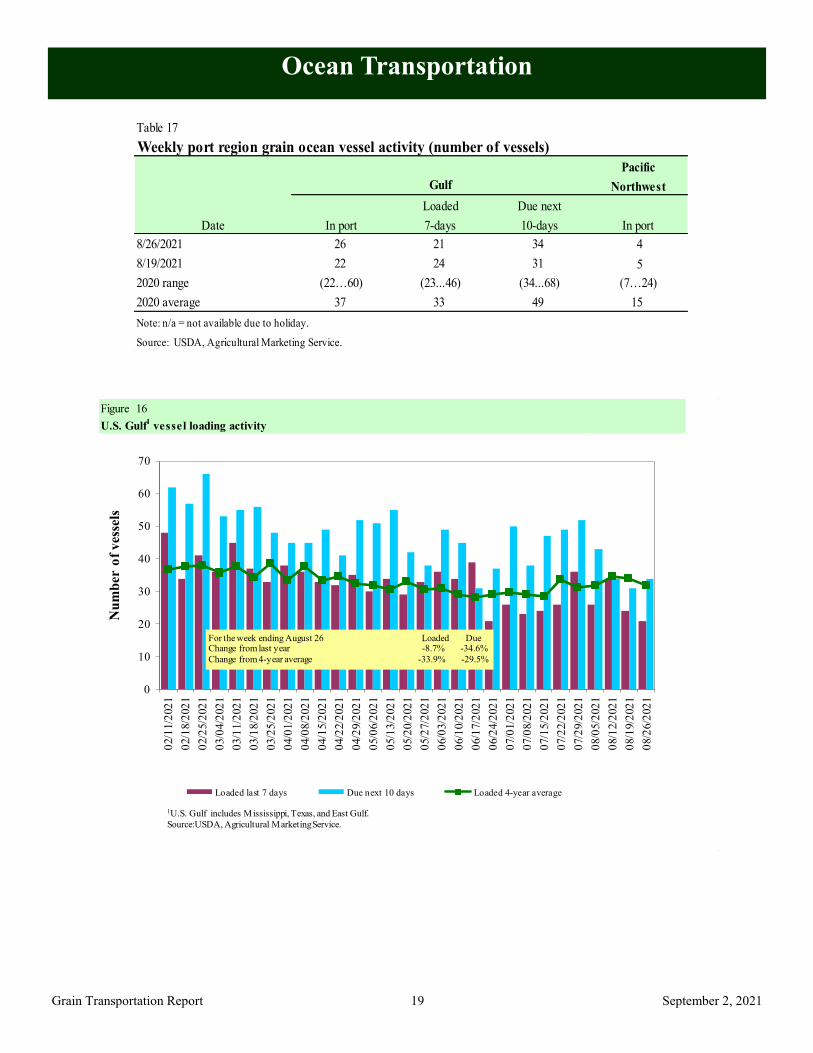
Ocean
For the week ending August 26, 21 oceangoing grain vessels were loaded in the Gulf—9 percent fewer than the same period last year.
Within the next 10 days (starting August 27), 34 vessels were expected to be loaded—35 percent fewer than the same period last year.
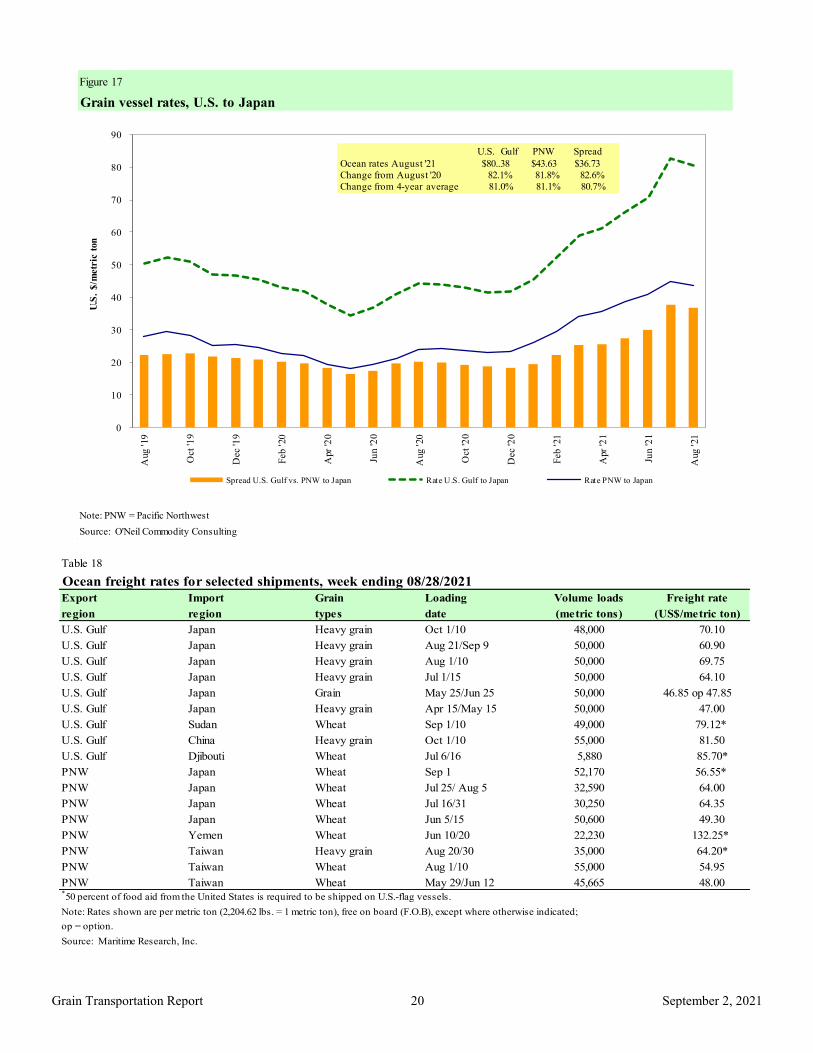
As of August 26, the rate for shipping a metric ton (mt) of grain from the U.S. Gulf to Japan was $82.00. This was 1 percent more than
the previous week. The rate from the Pacific Northwest to Japan was $44.50 per mt, 1 percent more than the previous week.
Fuel
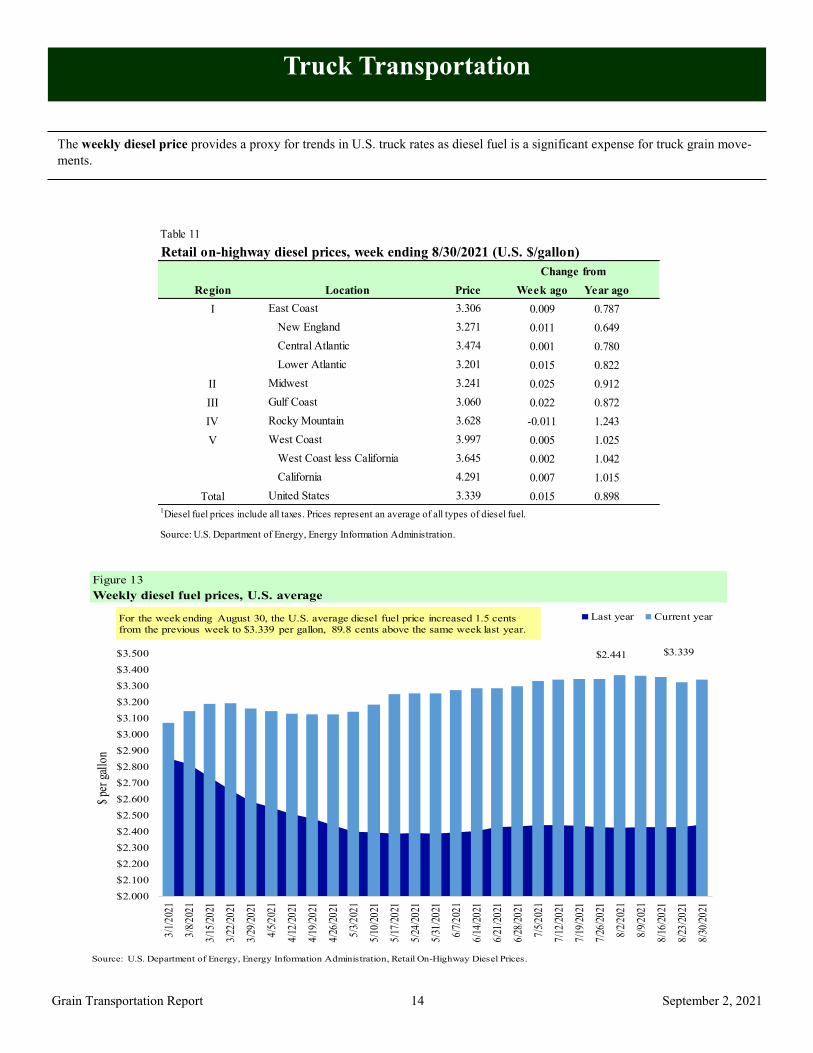
For the week ending August 30, the U.S. average diesel fuel price increased by 1.5 cents from the previous week to $3.339 per gallon,
89.8 cents above the same week last year.

September 2, 2021
Grain Transportation Report 2
Feature Article/Calendar
Transportation of U.S. Wheat Exports to Mexico
From an agricultural trade perspective, Mexico and the United States have a longstanding mutually beneficial
relationship. Since 2010, Mexico is one of the largest, if not the largest, importers of U.S wheat. Historically, a
majority of U.S.-to-Mexico wheat export volumes have shipped by rail, and a significant portion have shipped
by ocean vessel. This article describes Mexico’s reliance on U.S. wheat imports and examines the shift of U.S.-
to-Mexico wheat export volumes from ocean to rail transportation.
Impact of Mexico’s Proximity and NAFTA on Trade
The North American Free Trade Agreement (NAFTA) and the natural border the two countries share have
helped U.S.-Mexico agricultural trade flourish for the past 20 years. As Mexico’s population has grown,
imported U.S. wheat has helped support the expanding demand. Since 2010, an average 71 percent of Mexico’s
annual wheat imports have come from the United States. Also, since 2010, annual U.S. wheat exports to Mexico
have remained in a range of 2.5-3.3 million metric tons (roughly 13 percent of total U.S. wheat exports). These
volumes have held, despite a strong U.S. dollar and increased competition from wheat-exporting countries like
Russia and Argentina. Since 2016, Mexico is consistently among the top five importers of U.S. wheat.
Since 2010, Mexico has increasingly relied on wheat imports to meet its growing domestic needs. The country
imported an average 46 percent of its annual wheat supplies in 2000-10, 54 percent in 2011-15, and 56 percent
in 2016-20. For marketing year (MY) 2021/22, USDA’s Foreign Agricultural Service (FAS) anticipates Mexico
will import 60 percent of its wheat needs. Over the last 5 marketing years, U.S. wheat exports to Mexico have
averaged the following shares by wheat class: hard red winter (HRW), 63 percent; soft red winter (SRW), 27
percent; hard red spring, 8 percent; and white winter, 1 percent.
Rail Versus Ocean Shipments
Rail is, by far, the favored mode
for shipping U.S. wheat to
Mexico. Since 2017, more than
60 percent of U.S. wheat
exported to Mexico has shipped
by rail, and in 2020, a record 73
percent of U.S.-to-Mexico wheat
exports shipped by rail (fig. 1).
After rail, ocean vessels are the
next preferred mode for wheat
exports, moving substantial
volumes of SRW wheat.
According to weekly export
inspections data from USDA’s
Federal Grain Inspection Service
(FGIS), trucks account for less
than 0.1 percent of U.S. wheat
shipped to Mexico. Modal
shares vary depending on the variety of wheat. For example, railroads dominate in the movement of HRW
exports to Mexico, and ocean vessels move much of the SRW. To understand the modal shares of U.S. wheat
exports to Mexico, it is useful to consider where the wheat is produced. Transportation logistics vary
substantially by production region, as explored below.
Figure 1. Annual U.S. wheat exports to Mexico
Source: USDA, Federal Grain Inspection Service
September 2, 2021 Grain Transportation Report 3
HRW and rail transport. According to FGIS data, over the last 5 marketing years, HRW wheat has comprised
63 percent of total U.S. wheat exports to Mexico. According to the USDA’s National Agricultural Statistical
Service, HRW is produced primarily in Kansas, Oklahoma, northern Texas, eastern Colorado, and Montana—
which all have easy access to strategic rail lines. Kansas and Oklahoma are the two largest producers of HRW,
accounting for 49 and 14 percent of the total production in MY 2021/22, respectively. Some of the largest
commercial elevator facilities in the United States are in these two States, which have access to key southern
and western rail lines.
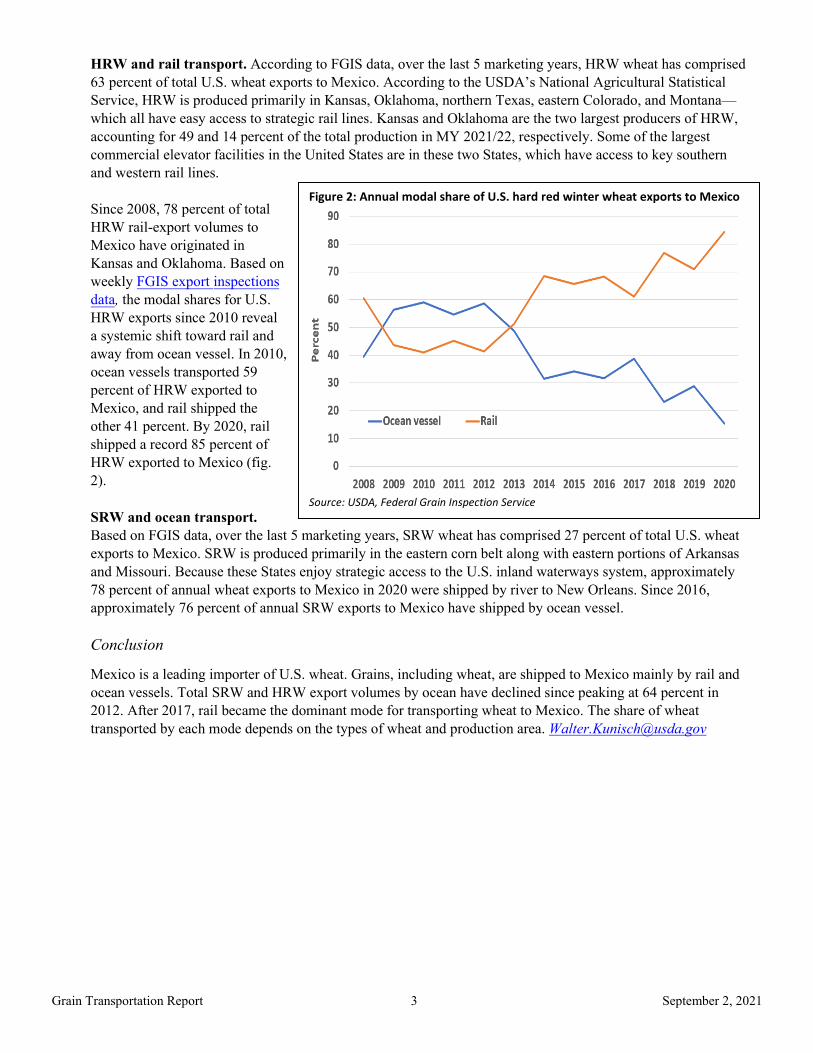
Since 2008, 78 percent of total
HRW rail-export volumes to
Mexico have originated in
Kansas and Oklahoma. Based on
weekly FGIS export inspections
data, the modal shares for U.S.
HRW exports since 2010 reveal
a systemic shift toward rail and
away from ocean vessel. In 2010,
ocean vessels transported 59
percent of HRW exported to
Mexico, and rail shipped the
other 41 percent. By 2020, rail
shipped a record 85 percent of
HRW exported to Mexico (fig.
2).
SRW and ocean transport.
Based on FGIS data, over the last 5 marketing years, SRW wheat has comprised 27 percent of total U.S. wheat
exports to Mexico. SRW is produced primarily in the eastern corn belt along with eastern portions of Arkansas
and Missouri. Because these States enjoy strategic access to the U.S. inland waterways system, approximately
78 percent of annual wheat exports to Mexico in 2020 were shipped by river to New Orleans. Since 2016,
approximately 76 percent of annual SRW exports to Mexico have shipped by ocean vessel.
Conclusion
Mexico is a leading importer of U.S. wheat. Grains, including wheat, are shipped to Mexico mainly by rail and
ocean vessels. Total SRW and HRW export volumes by ocean have declined since peaking at 64 percent in
2012. After 2017, rail became the dominant mode for transporting wheat to Mexico. The share of wheat
transported by each mode depends on the types of wheat and production area. [email protected]
Figure 2: Annual modal share of U.S. hard red winter wheat exports to Mexico
Source: USDA, Federal Grain Inspection Service
September 2, 2021
Grain Transportation Report 4
Grain Transportation Indicators
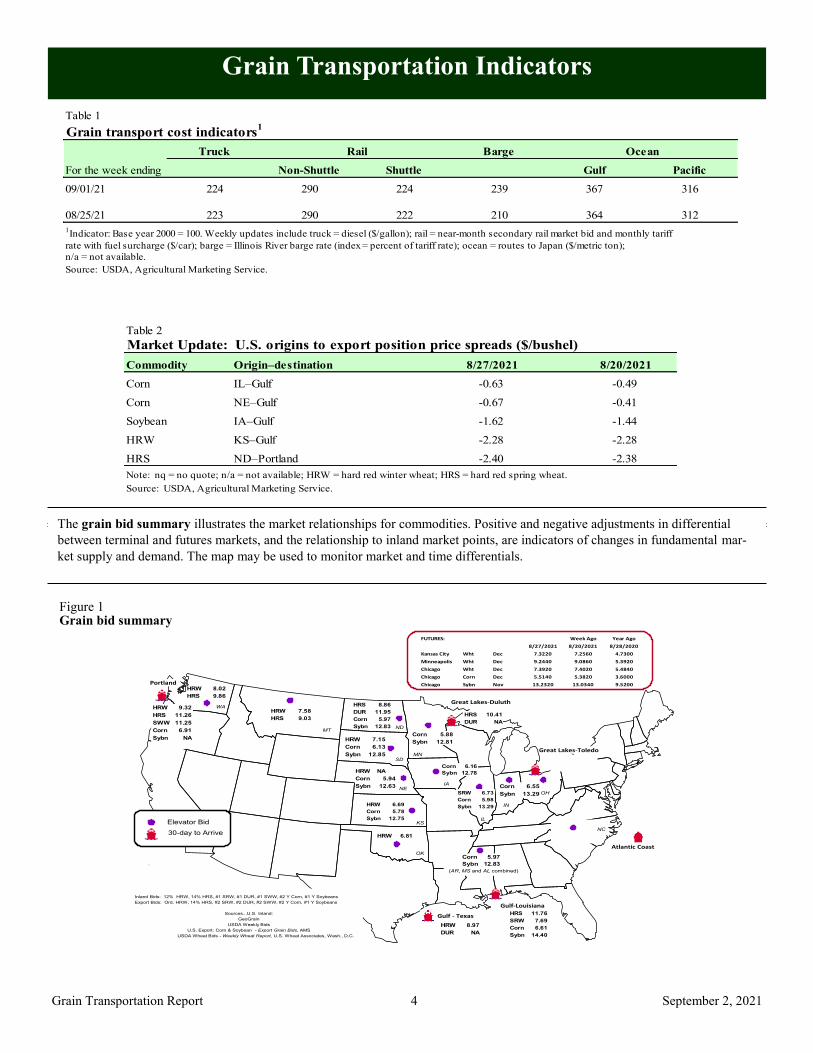
The grain bid summary illustrates the market relationships for commodities. Positive and negative adjustments in differential
between terminal and futures markets, and the relationship to inland market points, are indicators of changes in fundamental mar-
ket supply and demand. The map may be used to monitor market and time differentials.
Table 2
Market Update: U.S. origins to export position price spreads ($/bushel)
Commodity Origin–destination 8/27/2021 8/20/2021
Corn IL–Gulf -0.63 -0.49
Corn NE–Gulf -0.67 -0.41
Soybean IA–Gulf -1.62 -1.44
HRW KS–Gulf -2.28 -2.28
HRS ND–Portland -2.40 -2.38
Note: nq = no quote; n/a = not available; HRW = hard red winter wheat; HRS = hard red spring wheat.
Source: USDA, Agricultural Marketing Service.
Table 1
Grain transport cost indicators1
Truck Barge Ocean
For the week ending Non-Shuttle Shuttle Gulf Pacific
09/01/21 224 290 224 239 367 3160 % # DIV/0 ! 14 % 1% 1%
08/25/21 223 290 222 210 364 312
1Indicator: Base year 2000 = 100. Weekly updates include truck = diesel ($/gallon); rail = near-month secondary rail market bid and monthly tariff
rate with fuel surcharge ($/car); barge = Illinois River barge rate (index = percent of tariff rate); ocean = routes to Japan ($/metric ton);
n/a = not available.
Source: USDA, Agricultural Marketing Service.
Rail
Gulf-Louisiana
Gulf - Texas
Inland Bids: 12% HRW, 14% HRS, #1 SRW, #1 DUR, #1 SWW, #2 Y Corn, #1 Y Soybeans
Export Bids: Ord. HRW, 14% HRS, #2 SRW, #2 DUR, #2 SWW, #2 Y Corn, #1 Y Soybeans
Sources...U.S. Inland:
GeoGrain
USDA Weekly Bids
U.S. Export: Corn & Soybean - Export Grain Bids, AMS
USDA Wheat Bids - Weekly Wheat Report, U.S. Wheat Associates, Wash., D.C.
Great Lakes-Duluth
Portland
MTND
NE
MN
OK
ILKS
IA
SD
IN
30-day to Arrive
Elevator Bid
Corn 5.88
Sybn 12.81
Corn 6.16
Sybn 12.78
SRW 6.73
Corn 5.98
Sybn 13.29
HRW 9.32
HRS 11.26
SWW 11.25
Corn 6.91
Sybn NA
HRW 7.58
HRS 9.03
HRW 6.81
HRW 8.97
DUR NA
HRS 11.76
SRW 7.69
Corn 6.61
Sybn 14.40
HRW 7.15
Corn 6.13
Sybn 12.85
HRW NA
Corn 5.94
Sybn 12.63 Corn 6.55
Sybn 13.29
HRS 8.86
DUR 11.95
Corn 5.97
Sybn 12.83
HRW 6.69
Corn 5.78
Sybn 12.75
HRW 8.02
HRS 9.86
Great Lakes-Toledo
WA
Atlantic Coast
HRS 10.41
DUR NA
OH
NC
FUTURES: Week Ago Year Ago
8/27/2021 8/20/2021 8/28/2020
Kansas City Wht Dec 7.3220 7.2560 4.7300
Minneapolis Wht Dec 9.2440 9.0860 5.3920
Chicago Wht Dec 7.3920 7.4020 5.4840
Chicago Corn Dec 5.5140 5.3820 3.6000
Chicago Sybn Nov 13.2320 13.0340 9.5200
(AR, MS and AL combined)
Corn 5.97
Sybn 12.83
Figure 1 Grain bid summary
September 2, 2021
Grain Transportation Report 5
Rail Transportation
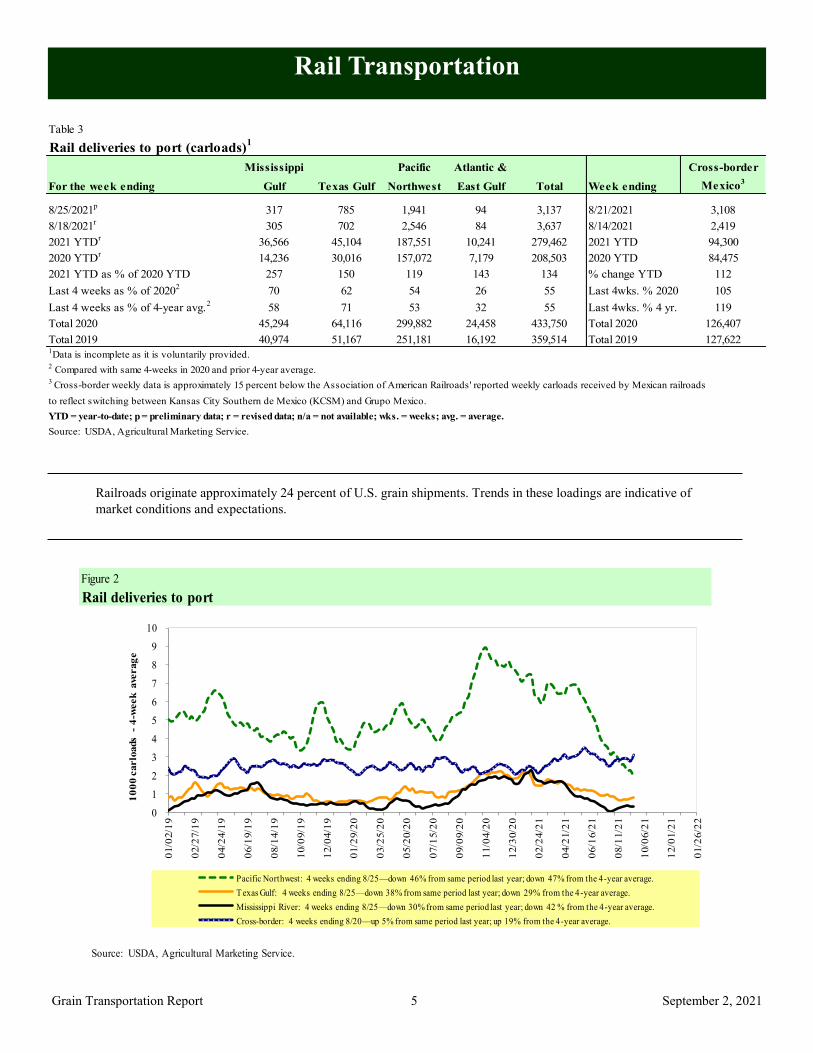
Railroads originate approximately 24 percent of U.S. grain shipments. Trends in these loadings are indicative of
market conditions and expectations.
Figure 2
Rail deliveries to port
0
1
2
3
4
5
6
7
8
9
10
01/0
2/1
9
02/2
7/1
9
04/2
4/1
9
06/1
9/1
9
08/1
4/1
9
10/0
9/1
9
12/0
4/1
9
01/2
9/2
0
03/2
5/2
0
05/2
0/2
0
07/1
5/2
0
09/0
9/2
0
11/0
4/2
0
12/3
0/2
0
02/2
4/2
1
04/2
1/2
1
06/1
6/2
1
08/1
1/2
1
10/0
6/2
1
12/0
1/2
1
01/2
6/2
2
10
00
carlo
ads -
4-w
eek
ave
rag
e
Pacific Northwest: 4 weeks ending 8/25—down 46% from same period last year; down 47% from the 4-year average.
Texas Gulf: 4 weeks ending 8/25—down 38% from same period last year; down 29% from the 4 -year average.
Mississippi River: 4 weeks ending 8/25—down 30% from same period last year; down 42 % from the 4-year average.
Cross-border: 4 weeks ending 8/20—up 5% from same period last year; up 19% from the 4-year average.
Source: USDA, Agricultural Marketing Service.
Table 3
Rail deliveries to port (carloads)1
Mississippi Pacific Atlantic & Cross-border
For the week ending Gulf Texas Gulf Northwest East Gulf Total Week ending Mexico3
8/25/2021p
317 785 1,941 94 3,137 8/21/2021 3,108
8/18/2021r
305 702 2,546 84 3,637 8/14/2021 2,419
2021 YTDr
36,566 45,104 187,551 10,241 279,462 2021 YTD 94,300
2020 YTDr
14,236 30,016 157,072 7,179 208,503 2020 YTD 84,475
2021 YTD as % of 2020 YTD 257 150 119 143 134 % change YTD 112
Last 4 weeks as % of 20202
70 62 54 26 55 Last 4wks. % 2020 105
Last 4 weeks as % of 4-year avg.2
58 71 53 32 55 Last 4wks. % 4 yr. 119
Total 2020 45,294 64,116 299,882 24,458 433,750 Total 2020 126,407
Total 2019 40,974 51,167 251,181 16,192 359,514 Total 2019 127,6221Data is incomplete as it is voluntarily provided.
2 Compared with same 4-weeks in 2020 and prior 4-year average.
3 Cross-border weekly data is approximately 15 percent below the Association of American Railroads' reported weekly carloads received by Mexican railroads
to reflect switching between Kansas City Southern de Mexico (KCSM) and Grupo Mexico.
YTD = year-to-date; p = preliminary data; r = revised data; n/a = not available; wks. = weeks; avg. = average.
Source: USDA, Agricultural Marketing Service.
September 2, 2021
Grain Transportation Report 6
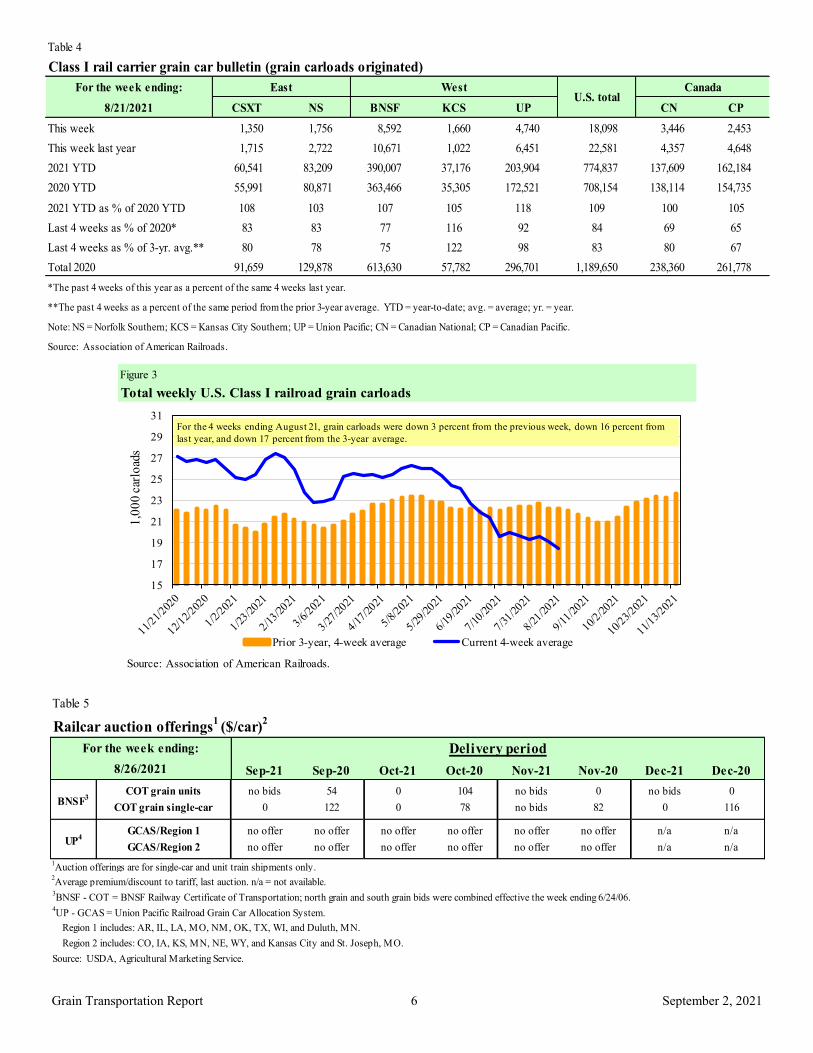
Figure 3
Total weekly U.S. Class I railroad grain carloads
15
17
19
21
23
25
27
29
31
1,0
00
car
load
s
Prior 3-year, 4-week average Current 4-week average
For the 4 weeks ending August 21, grain carloads were down 3 percent from the previous week, down 16 percent from
last year, and down 17 percent from the 3-year average.
Source: Association of American Railroads.
Table 4
Class I rail carrier grain car bulletin (grain carloads originated)
For the week ending:
8/21/2021 CSXT NS BNSF KCS UP CN CP
This week 1,350 1,756 8,592 1,660 4,740 18,098 3,446 2,453
This week last year 1,715 2,722 10,671 1,022 6,451 22,581 4,357 4,648
2021 YTD 60,541 83,209 390,007 37,176 203,904 774,837 137,609 162,184
2020 YTD 55,991 80,871 363,466 35,305 172,521 708,154 138,114 154,735
2021 YTD as % of 2020 YTD 108 103 107 105 118 109 100 105
Last 4 weeks as % of 2020* 83 83 77 116 92 84 69 65
Last 4 weeks as % of 3-yr. avg.** 80 78 75 122 98 83 80 67
Total 2020 91,659 129,878 613,630 57,782 296,701 1,189,650 238,360 261,778
*The past 4 weeks of this year as a percent of the same 4 weeks last year.
**The past 4 weeks as a percent of the same period from the prior 3-year average. YTD = year-to-date; avg. = average; yr. = year.
Note: NS = Norfolk Southern; KCS = Kansas City Southern; UP = Union Pacific; CN = Canadian National; CP = Canadian Pacific.
Source: Association of American Railroads.
East WestU.S. total
Canada
Table 5
Railcar auction offerings1
($/car)2
Sep-21 Sep-20 Oct-21 Oct-20 Nov-21 Nov-20 Dec-21 Dec-20
COT grain units no bids 54 0 104 no bids 0 no bids 0
COT grain single-car 0 122 0 78 no bids 82 0 116
GCAS/Region 1 no offer no offer no offer no offer no offer no offer n/a n/a
GCAS/Region 2 no offer no offer no offer no offer no offer no offer n/a n/a
1Auction offerings are for single-car and unit train shipments only.
2Average premium/discount to tariff, last auction. n/a = not available.
3BNSF - COT = BNSF Railway Certificate of Transportation; north grain and south grain bids were combined effective the week ending 6/24/06.
4UP - GCAS = Union Pacific Railroad Grain Car Allocation System.
Region 1 includes: AR, IL, LA, MO, NM, OK, TX, WI, and Duluth, MN.
Region 2 includes: CO, IA, KS, MN, NE, WY, and Kansas City and St. Joseph, MO.
Source: USDA, Agricultural Marketing Service.
UP4
Delivery period
BNSF3
For the week ending:
8/26/2021

September 2, 2021
Grain Transportation Report 7
The secondary rail market information reflects trade values for service that was originally purchased from the railroad carrier as some form of guaranteed freight. The auction and secondary rail values are indicators of rail service quality and demand/supply.
Figure 4
Bids/offers for railcars to be delivered in September 2021, secondary market
-300
-200
-100
0
100
200
300
400
500
1/2
8/2
021
2/1
1/2
021
2/2
5/2
021
3/1
1/2
021
3/2
5/2
021
4/8
/20
21
4/2
2/2
021
5/6
/20
21
5/2
0/2
021
6/3
/20
21
6/1
7/2
021
7/1
/20
21
7/1
5/2
021
7/2
9/2
021
8/1
2/2
021
8/2
6/2
021
9/9
/20
21
Avera
ge p
rem
ium
/dis
cou
nt
to t
ari
ff
($/c
ar)
Shuttle Non-shuttle
Shuttle prior 3-yr. avg. (same week) Non-shuttle prior 3-yr. avg. (same week)8/26/2021
Note: Non-shuttle bids include unit-train and single-car bids. n/a = not available; avg. = average; yr. = year; BNSF = BNSF Railway; UP = Union Pacific Railroad.Source: USDA, Agricultural Marketing Service.
n/a
UPBNSF
-$9
n/a
-$21Shuttle
Non-shuttle
There were no non-shuttle bids/offers this week.Average shuttle bids/offers rose $35 this week and are $106 below the peak.
Figure 5
Bids/offers for railcars to be delivered in October 2021, secondary market
-200
0
200
400
600
800
1,000
1,200
3/4
/20
21
3/1
8/2
021
4/1
/20
21
4/1
5/2
021
4/2
9/2
021
5/1
3/2
021
5/2
7/2
021
6/1
0/2
021
6/2
4/2
021
7/8
/20
21
7/2
2/2
021
8/5
/20
21
8/1
9/2
021
9/2
/20
21
9/1
6/2
021
9/3
0/2
021
10/1
4/2
02
1
Avera
ge p
rem
ium
/dis
cou
nt
to t
ari
ff
($/c
ar)
Shuttle Non-shuttle
Shuttle prior 3-yr. avg. (same week) Non-shuttle prior 3-yr. avg. (same week)8/26/2021
Note: Non-shuttle bids include unit-train and single-car bids. n/a = not available; avg. = average; yr. = year; BNSF = BNSF Railway; UP = Union Pacific Railroad.Source: USDA, Agricultural Marketing Service.
n/a
UPBNSF
$750
n/a
$819Shuttle
Non-shuttle
There were no non-shuttle bids/offers this week.Average shuttle bids/offers fell $4 this week and are $270 below the peak.
September 2, 2021
Grain Transportation Report 8
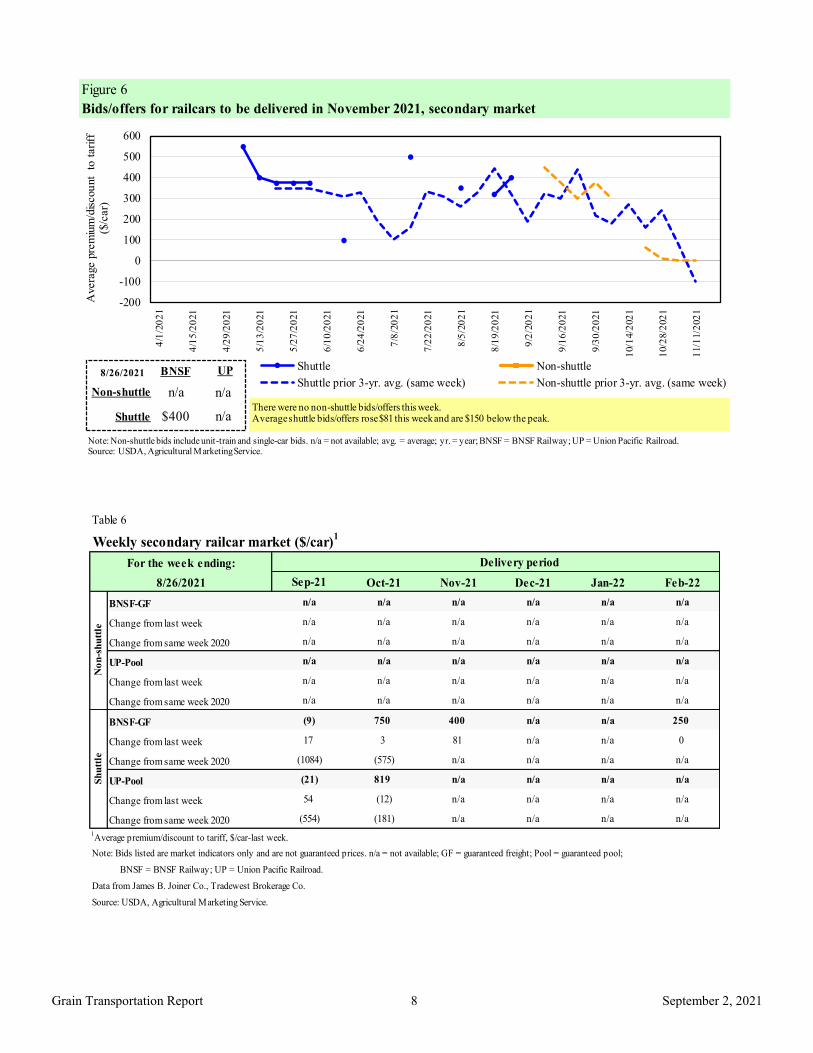
Figure 6
Bids/offers for railcars to be delivered in November 2021, secondary market
-200
-100
0
100
200
300
400
500
600
4/1
/20
21
4/1
5/2
021
4/2
9/2
021
5/1
3/2
021
5/2
7/2
021
6/1
0/2
021
6/2
4/2
021
7/8
/20
21
7/2
2/2
021
8/5
/20
21
8/1
9/2
021
9/2
/20
21
9/1
6/2
021
9/3
0/2
021
10/1
4/2
02
1
10/2
8/2
02
1
11/1
1/2
02
1
Avera
ge p
rem
ium
/dis
cou
nt
to t
ari
ff
($/c
ar)
Shuttle Non-shuttle
Shuttle prior 3-yr. avg. (same week) Non-shuttle prior 3-yr. avg. (same week)8/26/2021
Note: Non-shuttle bids include unit-train and single-car bids. n/a = not available; avg. = average; yr. = year; BNSF = BNSF Railway; UP = Union Pacific Railroad.Source: USDA, Agricultural Marketing Service.
n/a
UPBNSF
$400
n/a
n/aShuttle
Non-shuttle
There were no non-shuttle bids/offers this week.Average shuttle bids/offers rose $81 this week and are $150 below the peak.
Table 6
Weekly secondary railcar market ($/car)1
Sep-21 Oct-21 Nov-21 Dec-21 Jan-22 Feb-22
BNSF-GF n/a n/a n/a n/a n/a n/a
Change from last week n/a n/a n/a n/a n/a n/a
Change from same week 2020 n/a n/a n/a n/a n/a n/a
UP-Pool n/a n/a n/a n/a n/a n/a
Change from last week n/a n/a n/a n/a n/a n/a
Change from same week 2020 n/a n/a n/a n/a n/a n/a
BNSF-GF (9) 750 400 n/a n/a 250
Change from last week 17 3 81 n/a n/a 0
Change from same week 2020 (1084) (575) n/a n/a n/a n/a
UP-Pool (21) 819 n/a n/a n/a n/a
Change from last week 54 (12) n/a n/a n/a n/a
Change from same week 2020 (554) (181) n/a n/a n/a n/a
1Average premium/discount to tariff, $/car-last week.
Note: Bids listed are market indicators only and are not guaranteed prices. n/a = not available; GF = guaranteed freight; Pool = guaranteed pool;
BNSF = BNSF Railway; UP = Union Pacific Railroad.
Data from James B. Joiner Co., Tradewest Brokerage Co.
Source: USDA, Agricultural Marketing Service.
No
n-s
hu
ttle
For the week ending:
8/26/2021
Sh
utt
le
Delivery period

September 2, 2021
Grain Transportation Report 9
The tariff rail rate is the base price of freight rail service. Together with fuel surcharges and any auction and secondary rail values, the tariff rail rate constitutes the full cost of shipping by rail. Typically, auction and secondary rail values are a small fraction of the full cost of shipping by rail relative to the tariff rate. However, during times of high rail demand or short supply, high auction and secondary rail values can exceed the cost of the tariff rate plus fuel surcharge.
Table 7
Tariff rail rates for unit and shuttle train shipments1
Percent
Tariff change
September 2021 Origin region3
Destination region3
rate/car metric ton bushel2
Y/Y4
Unit train
Wheat Wichita, KS St. Louis, MO $3,695 $127 $37.95 $1.03 5
Grand Forks, ND Duluth-Superior, MN $3,658 $0 $36.33 $0.99 -13
Wichita, KS Los Angeles, CA $7,115 $0 $70.66 $1.92 0
Wichita, KS New Orleans, LA $4,525 $223 $47.14 $1.28 3
Sioux Falls, SD Galveston-Houston, TX $6,851 $0 $68.03 $1.85 0
Colby, KS Galveston-Houston, TX $4,801 $244 $50.10 $1.36 4
Amarillo, TX Los Angeles, CA $5,121 $339 $54.22 $1.48 5
Corn Champaign-Urbana, IL New Orleans, LA $3,900 $252 $41.23 $1.05 5
Toledo, OH Raleigh, NC $7,833 $0 $77.79 $1.98 15
Des Moines, IA Davenport, IA $2,455 $53 $24.91 $0.63 3
Indianapolis, IN Atlanta, GA $5,979 $0 $59.37 $1.51 3
Indianapolis, IN Knoxville, TN $5,040 $0 $50.05 $1.27 3
Des Moines, IA Little Rock, AR $3,900 $157 $40.28 $1.02 6
Des Moines, IA Los Angeles, CA $5,780 $456 $61.92 $1.57 7
Soybeans Minneapolis, MN New Orleans, LA $3,631 $272 $38.76 $1.05 6
Toledo, OH Huntsville, AL $6,595 $0 $65.49 $1.78 17
Indianapolis, IN Raleigh, NC $7,125 $0 $70.75 $1.93 3
Indianapolis, IN Huntsville, AL $5,247 $0 $52.11 $1.42 3
Champaign-Urbana, IL New Orleans, LA $4,645 $252 $48.62 $1.32 4
Shuttle train
Wheat Great Falls, MT Portland, OR $4,193 $0 $41.64 $1.13 4
Wichita, KS Galveston-Houston, TX $4,236 $0 $42.07 $1.14 0
Chicago, IL Albany, NY $6,376 $0 $63.32 $1.72 -10
Grand Forks, ND Portland, OR $5,851 $0 $58.10 $1.58 3
Grand Forks, ND Galveston-Houston, TX $5,721 $0 $56.81 $1.55 -5
Colby, KS Portland, OR $6,012 $400 $63.67 $1.73 5
Corn Minneapolis, MN Portland, OR $5,180 $0 $51.44 $1.31 0
Sioux Falls, SD Tacoma, WA $5,140 $0 $51.04 $1.30 0
Champaign-Urbana, IL New Orleans, LA $3,820 $252 $40.43 $1.03 5
Lincoln, NE Galveston-Houston, TX $3,880 $0 $38.53 $0.98 0
Des Moines, IA Amarillo, TX $4,320 $197 $44.85 $1.14 6
Minneapolis, MN Tacoma, WA $5,180 $0 $51.44 $1.31 0
Council Bluffs, IA Stockton, CA $5,100 $0 $50.65 $1.29 2
Soybeans Sioux Falls, SD Tacoma, WA $6,050 $0 $60.08 $1.64 3
Minneapolis, MN Portland, OR $6,100 $0 $60.58 $1.65 3
Fargo, ND Tacoma, WA $5,950 $0 $59.09 $1.61 3
Council Bluffs, IA New Orleans, LA $4,875 $290 $51.29 $1.40 4
Toledo, OH Huntsville, AL $4,945 $0 $49.11 $1.34 3
Grand Island, NE Portland, OR $5,260 $409 $56.30 $1.53 51A unit train refers to shipments of at least 25 cars. Shuttle train rates are generally available for qualified shipments of
75-120 cars that meet railroad efficiency requirements.
2Approximate load per car = 111 short tons (100.7 metric tons): corn 56 pounds per bushel (lbs/bu), wheat and soybeans 60 lbs/bu.
3Regional economic areas are defined by the Bureau of Economic Analysis (BEA).
4Percentage change year over year (Y/Y) calculated using tariff rate plus fuel surcharge.
Source: BNSF Railway, Canadian National Railway, CSX Transportation, and Union Pacific Railroad.
Tariff plus surcharge per:Fuel
surcharge
per car

September 2, 2021
Grain Transportation Report 10
Table 8
Tariff rail rates for U.S. bulk grain shipments to MexicoDate: Percent
change4
Commodity Destination region per car1
per car2
metric ton3
bushel3
Y/Y
Wheat MT Chihuahua, CI $7,699 $0 $78.67 $2.14 4
OK Cuautitlan, EM $6,813 $174 $71.39 $1.94 3
KS Guadalajara, JA $7,531 $684 $83.94 $2.28 3
TX Salinas Victoria, NL $4,347 $106 $45.50 $1.24 2
Corn IA Guadalajara, JA $8,902 $597 $97.06 $2.46 2
SD Celaya, GJ $8,140 $0 $83.17 $2.11 0
NE Queretaro, QA $8,300 $364 $88.52 $2.25 3
SD Salinas Victoria, NL $6,905 $0 $70.55 $1.79 0
MO Tlalnepantla, EM $7,665 $355 $81.94 $2.08 4
SD Torreon, CU $7,690 $0 $78.57 $1.99 0
Soybeans MO Bojay (Tula), HG $8,547 $560 $93.04 $2.53 3
NE Guadalajara, JA $9,157 $588 $99.56 $2.71 3
IA El Castillo, JA $9,410 $0 $96.15 $2.61 0
KS Torreon, CU $8,064 $412 $86.60 $2.35 3
Sorghum NE Celaya, GJ $7,772 $533 $84.85 $2.15 3
KS Queretaro, QA $8,108 $218 $85.06 $2.16 2
NE Salinas Victoria, NL $6,713 $175 $70.37 $1.79 2
NE Torreon, CU $7,092 $380 $76.34 $1.94 21Rates are based upon published tariff rates for high-capacity shuttle trains. Shuttle trains are available for qualified
shipments of 75-110 cars that meet railroad efficiency requirements.2Fuel surcharge adjusted to reflect the change in Ferrocarril Mexicano, S.A. de C.V railroad fuel surcharge policy as of 10/01/2009.
3Approximate load per car = 97.87 metric tons: Corn & Sorghum 56 lbs/bu, Wheat & Soybeans 60 lbs/bu.
4Percentage change calculated using tariff rate plus fuel surchage; Y/Y = year over year.
Sources: BNSF Railway, Union Pacific Railroad, Kansas City Southern.
Origin
state
September 2021 Tariff rate plus
fuel surcharge per:Tariff rate
Fuel
surcharge
Figure 7
Railroad fuel surcharges, North American weighted average1
$0.00
$0.05
$0.10
$0.15
$0.20
$0.25
$0.30
Dolla
rs p
er
railc
ar
mile
3-year monthly average
Fuel surcharge* ($/mile/railcar)
September 2021: $0.20/mile, up 1 cent from last month's surcharge of $0.19/mile; up 18 cents from the September 2020 surcharge of $0.02/mile; and up 9 cents from the September prior 3-year average of $0.11/mile.
1 Weighted by each Class I railroad's proportion of grain traffic for the prior year.
* Beginning January 2009, the Canadian Pacific fuel surcharge is computed by a monthly average of the bi-weekly fuel surcharge.
**CSX strike price changed from $2.00/gal. to $3.75/gal. starting January 1, 2015.
Sources: BNSF Railway, Canadian National Railway, CSX Transportation, Canadian Pacific Railway, Union Pacific Railroad, Kansas City
Southern Railway, Norfolk Southern Corporation.
September 2, 2021
Grain Transportation Report 11
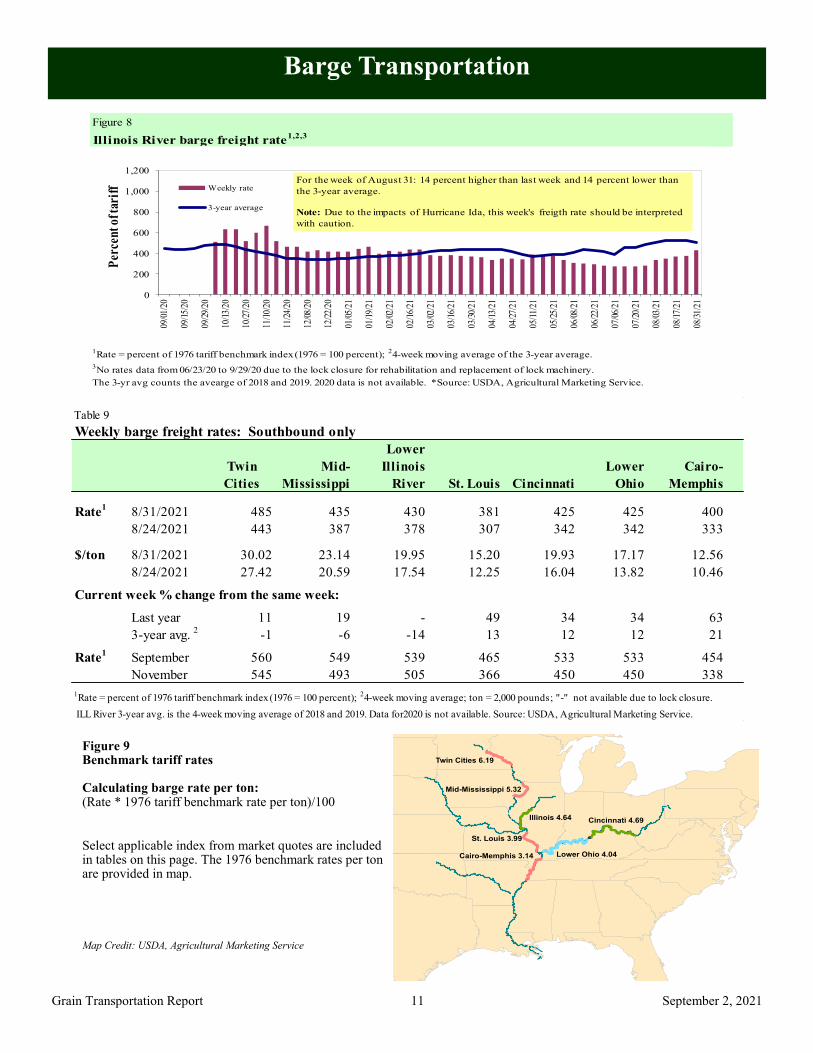
Barge Transportation
Figure 9 Benchmark tariff rates Calculating barge rate per ton: (Rate * 1976 tariff benchmark rate per ton)/100
Select applicable index from market quotes are included in tables on this page. The 1976 benchmark rates per ton are provided in map.
Map Credit: USDA, Agricultural Marketing Service
Twin Cities 6.19
Mid-Mississippi 5.32
St. Louis 3.99
Cairo-Memphis 3.14
Illinois 4.64 Cincinnati 4.69
Lower Ohio 4.04
Figure 8
Illinois River barge freight rate1,2,3
1Rate = percent of 1976 tariff benchmark index (1976 = 100 percent);
24-week moving average of the 3-year average.
3No rates data from 06/23/20 to 9/29/20 due to the lock closure for rehabilitation and replacement of lock machinery.
The 3-yr avg counts the avearge of 2018 and 2019. 2020 data is not available. *Source: USDA, Agricultural Marketing Service.
0
200
400
600
800
1,000
1,20009
/01/
20
09/1
5/20
09/2
9/20
10/1
3/20
10/2
7/20
11/1
0/20
11/2
4/20
12/0
8/20
12/2
2/20
01/0
5/21
01/1
9/21
02/0
2/21
02/1
6/21
03/0
2/21
03/1
6/21
03/3
0/21
04/1
3/21
04/2
7/21
05/1
1/21
05/2
5/21
06/0
8/21
06/2
2/21
07/0
6/21
07/2
0/21
08/0
3/21
08/1
7/21
08/3
1/21
Per
cen
t o
f tar
iff Weekly rate
3-year average
For the week of August 31: 14 percent higher than last week and 14 percent lower than
the 3-year average.
Note: Due to the impacts of Hurricane Ida, this week's freigth rate should be interpreted
with caution.
Table 9
Weekly barge freight rates: Southbound only
Twin
Cities
Mid-
Mississippi
Lower
Illinois
River St. Louis Cincinnati
Lower
Ohio
Cairo-
Memphis
Rate1
8/31/2021 485 435 430 381 425 425 400
8/24/2021 443 387 378 307 342 342 333
$/ton 8/31/2021 30.02 23.14 19.95 15.20 19.93 17.17 12.56
8/24/2021 27.42 20.59 17.54 12.25 16.04 13.82 10.46- -
Current week % change from the same week:- - -
Last year 11 19 - 49 34 34 63
3-year avg. 2
-1 -6 -14 13 12 12 21-2 6 6
Rate1
September 560 549 539 465 533 533 454
November 545 493 505 366 450 450 338
ILL River 3-year avg. is the 4-week moving average of 2018 and 2019. Data for2020 is not available. Source: USDA, Agricultural Marketing Service.
1Rate = percent of 1976 tariff benchmark index (1976 = 100 percent);
24-week moving average; ton = 2,000 pounds; "-" not available due to lock closure.
September 2, 2021
Grain Transportation Report 12
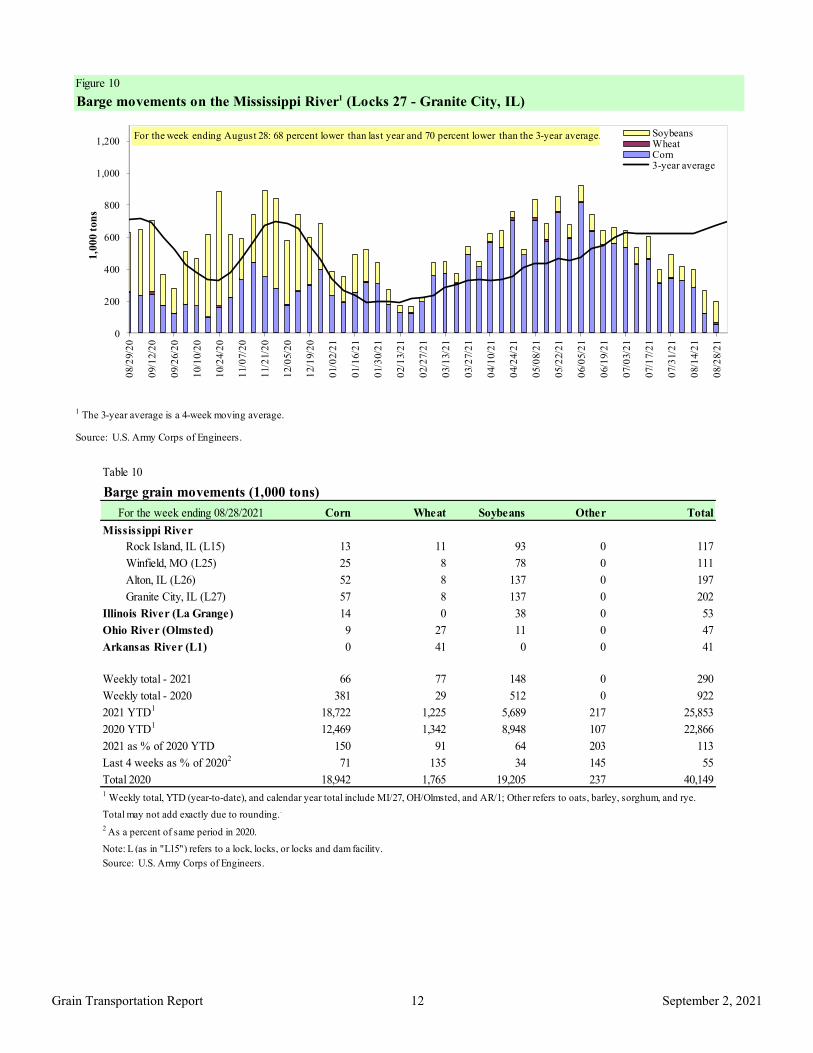
Table 10
Barge grain movements (1,000 tons)
For the week ending 08/28/2021 Corn Wheat Soybeans Other Total
Mississippi River
Rock Island, IL (L15) 13 11 93 0 117
Winfield, MO (L25) 25 8 78 0 111
Alton, IL (L26) 52 8 137 0 197
Granite City, IL (L27) 57 8 137 0 202
Illinois River (La Grange) 14 0 38 0 53
Ohio River (Olmsted) 9 27 11 0 47
Arkansas River (L1) 0 41 0 0 41
Weekly total - 2021 66 77 148 0 290
Weekly total - 2020 381 29 512 0 922
2021 YTD1
18,722 1,225 5,689 217 25,853
2020 YTD1
12,469 1,342 8,948 107 22,866
2021 as % of 2020 YTD 150 91 64 203 113
Last 4 weeks as % of 20202
71 135 34 145 55
Total 2020 18,942 1,765 19,205 237 40,149
2 As a percent of same period in 2020.
Note: L (as in "L15") refers to a lock, locks, or locks and dam facility.
1 Weekly total, YTD (year-to-date), and calendar year total include MI/27, OH/Olmsted, and AR/1; Other refers to oats, barley, sorghum, and rye.
Total may not add exactly due to rounding..
Source: U.S. Army Corps of Engineers.
Figure 10
Barge movements on the Mississippi River1 (Locks 27 - Granite City, IL)
1 The 3-year average is a 4-week moving average.
Source: U.S. Army Corps of Engineers.
0
200
400
600
800
1,000
1,200
08/2
9/2
0
09/1
2/2
0
09/2
6/2
0
10/1
0/2
0
10/2
4/2
0
11/0
7/2
0
11/2
1/2
0
12/0
5/2
0
12/1
9/2
0
01/0
2/2
1
01/1
6/2
1
01/3
0/2
1
02/1
3/2
1
02/2
7/2
1
03/1
3/2
1
03/2
7/2
1
04/1
0/2
1
04/2
4/2
1
05/0
8/2
1
05/2
2/2
1
06/0
5/2
1
06/1
9/2
1
07/0
3/2
1
07/1
7/2
1
07/3
1/2
1
08/1
4/2
1
08/2
8/2
1
1,0
00 t
on
s
SoybeansWheatCorn3-year average
For the week ending August 28: 68 percent lower than last year and 70 percent lower than the 3-year average.
September 2, 2021
Grain Transportation Report 13
Figure 11
Source: U.S. Army Corps of Engineers.
Upbound empty barges transiting Mississippi River Locks 27, Arkansas River Lock
and Dam 1, and Ohio River Olmsted Locks and Dam
0
100
200
300
400
500
600
700
8008
/29
/20
9/1
2/2
0
9/2
6/2
0
10/1
0/2
0
10
/24
/20
11
/7/2
0
11
/21
/20
12
/5/2
0
12
/19
/20
1/2
/21
1/1
6/2
1
1/3
0/2
1
2/1
3/2
1
2/2
7/2
1
3/1
3/2
1
3/2
7/2
1
4/1
0/2
1
4/2
4/2
1
5/8
/21
5/2
2/2
1
6/5
/21
6/1
9/2
1
7/3
/21
7/1
7/2
1
7/3
1/2
1
8/1
4/2
1
8/2
8/2
1
Nu
mber
of
barg
es
MS Locks 27 AR Lock and Dam 1 Ohio Olmsted Locks and Dam
For the week ending August 28: 369 barges transited the locks, 6 barges fewer
than the previous week and 29.2 percent lower than the 3-year average.
Figure 12
Grain barges for export in New Orleans region
Note: Olmsted = Olmsted Locks and Dam. Grain unload data is currently unavailable for the week ending August 28.
Source: U.S. Army Corps of Engineers and USDA, Agricultural Marketing Service.
0
200
400
600
800
1,000
1,200
1,400
5/9
/20
5/2
3/2
0
6/6
/20
6/2
0/2
0
7/4
/20
7/1
8/2
0
8/1
/20
8/1
5/2
0
8/2
9/2
0
9/1
2/2
0
9/2
6/2
0
10
/10/2
0
10
/24/2
0
11
/7/2
0
11
/21/2
0
12
/5/2
0
12
/19/2
0
1/2
/21
1/1
6/2
1
1/3
0/2
1
2/1
3/2
1
2/2
7/2
1
3/1
3/2
1
3/2
7/2
1
4/1
0/2
1
4/2
4/2
1
5/8
/21
5/2
2/2
1
6/5
/21
6/1
9/2
1
7/3
/21
7/1
7/2
1
7/3
1/2
1
8/1
4/2
1
8/2
8/2
1
Downbound grain barges Locks 27, 1, and Olmsted
Grain barges unloaded in New Orleans
Nu
mber
of
barg
es
For the week ending August 28: 185 barges moved down river, 69 barges fewer than last week.
September 2, 2021
Grain Transportation Report 14
The weekly diesel price provides a proxy for trends in U.S. truck rates as diesel fuel is a significant expense for truck grain move-
ments.
Truck Transportation
Table 11
Change from
Region Location Price Week ago Year ago
I East Coast 3.306 0.009 0.787
New England 3.271 0.011 0.649
Central Atlantic 3.474 0.001 0.780
Lower Atlantic 3.201 0.015 0.822
II Midwest 3.241 0.025 0.912
III Gulf Coast 3.060 0.022 0.872
IV Rocky Mountain 3.628 -0.011 1.243
V West Coast 3.997 0.005 1.025
West Coast less California 3.645 0.002 1.042
California 4.291 0.007 1.015
Total United States 3.339 0.015 0.8981Diesel fuel prices include all taxes. Prices represent an average of all types of diesel fuel.
Source: U.S. Department of Energy, Energy Information Administration.
Retail on-highway diesel prices, week ending 8/30/2021 (U.S. $/gallon)
Figure 13
Weekly diesel fuel prices, U.S. average
Source: U.S. Department of Energy, Energy Information Administration, Retail On-Highway Diesel Prices.
$3.339$2.441
$2.000
$2.100
$2.200
$2.300
$2.400
$2.500
$2.600
$2.700
$2.800
$2.900
$3.000
$3.100
$3.200
$3.300
$3.400
$3.500
3/1/
2021
3/8/
2021
3/15
/202
1
3/22
/202
1
3/29
/202
1
4/5/
2021
4/12
/202
1
4/19
/202
1
4/26
/202
1
5/3/
2021
5/10
/202
1
5/17
/202
1
5/24
/202
1
5/31
/202
1
6/7/
2021
6/14
/202
1
6/21
/202
1
6/28
/202
1
7/5/
2021
7/12
/202
1
7/19
/202
1
7/26
/202
1
8/2/
2021
8/9/
2021
8/16
/202
1
8/23
/202
1
8/30
/202
1
$ pe
r ga
llon
Last year Current yearFor the week ending August 30, the U.S. average diesel fuel price increased 1.5 cents from the previous week to $3.339 per gallon, 89.8 cents above the same week last year.

September 2, 2021
Grain Transportation Report 15
Grain Exports
Table 13
Top 5 importers1 of U.S. corn
For the week ending 08/19/2021 Total commitments2 % change
Exports3
2021/22 2020/21 2019/20 current MY 3-yr. avg.
next MY current MY last MY from last MY 2017-19 - 1,000 mt -
Mexico 3,316 15,752 14,496 9 14,869
Japan 1,331 10,999 10,072 9 11,221
Columbia 451 3,949 4,848 (19) 4,830
Korea 65 3,527 2,693 31 4,011
China 10,744 22,748 2,240 915 909
Top 5 importers 15,907 56,974 34,349 66 35,840
Total U.S. corn export sales 19,283 70,324 44,492 58 49,983
% of projected exports 32% 100% 98%
Change from prior week2
684 7 270
Top 5 importers' share of U.S. corn
export sales 82% 81% 77% 72%
USDA forecast August 2021 61,069 70,611 45,216 56
Corn use for ethanol USDA forecast,
August 2021 132,080 128,905 123,368 41Based on USDA, Foreign Agricultural Service (FAS) marketing year ranking reports for 2019/20; marketing year (MY) = Sep 1 - Aug 31.
3FAS marketing year ranking reports (carryover plus accumulated export); yr. = year; avg. = average.
2Cumulative exports (shipped) + outstanding sales (unshipped), FAS weekly export sales report, or export sales query. Total commitments change (net sales) from prior week could include
revisions from previous week's outstanding sales or accumulated sales.
Note: A red number in parentheses indicates a negative number; mt = metric ton.
Source: USDA, Foreign Agricultural Service.
Table 12
U.S. export balances and cumulative exports (1,000 metric tons)
Wheat Corn Soybeans Total
For the week ending HRW SRW HRS SWW DUR All wheat
Export balances1
8/19/2021 1,473 842 1,122 673 7 4,117 4,152 2,197 10,465
This week year ago 1,856 638 1,883 1,201 251 5,829 2,334 4,308 12,471
Cumulative exports-marketing year 2
2020/21 YTD 1,779 758 1,461 970 43 5,011 66,173 59,963 131,147
2019/20 YTD 2,637 446 1,573 1,029 213 5,898 42,158 42,976 91,032
YTD 2020/21 as % of 2019/20 67 170 93 94 20 85 157 140 144
Last 4 wks. as % of same period 2019/20* 87 148 70 73 3 82 223 57 99
Total 2019/20 9,526 2,318 6,960 4,751 922 24,477 42,622 43,994 111,094
Total 2018/19 8,591 3,204 6,776 5,164 479 24,214 48,924 46,189 119,3271 Current unshipped (outstanding) export sales to date.
2 Shipped export sales to date; 2021/22 marketing year now in effect for wheat while corn and soybeans remain in effect for the 2020/21 marketing year.
Note: marketing year: wheat = 6/01-5/31, corn and soybeans = 9/01-8/31. YTD = year-to-date; wks. = weeks; HRW= hard red winter; SRW = soft red winter;
HRS= hard red spring; SWW= soft white wheat; DUR= durum.
Source: USDA, Foreign Agricultural Service.
September 2, 2021
Grain Transportation Report 16
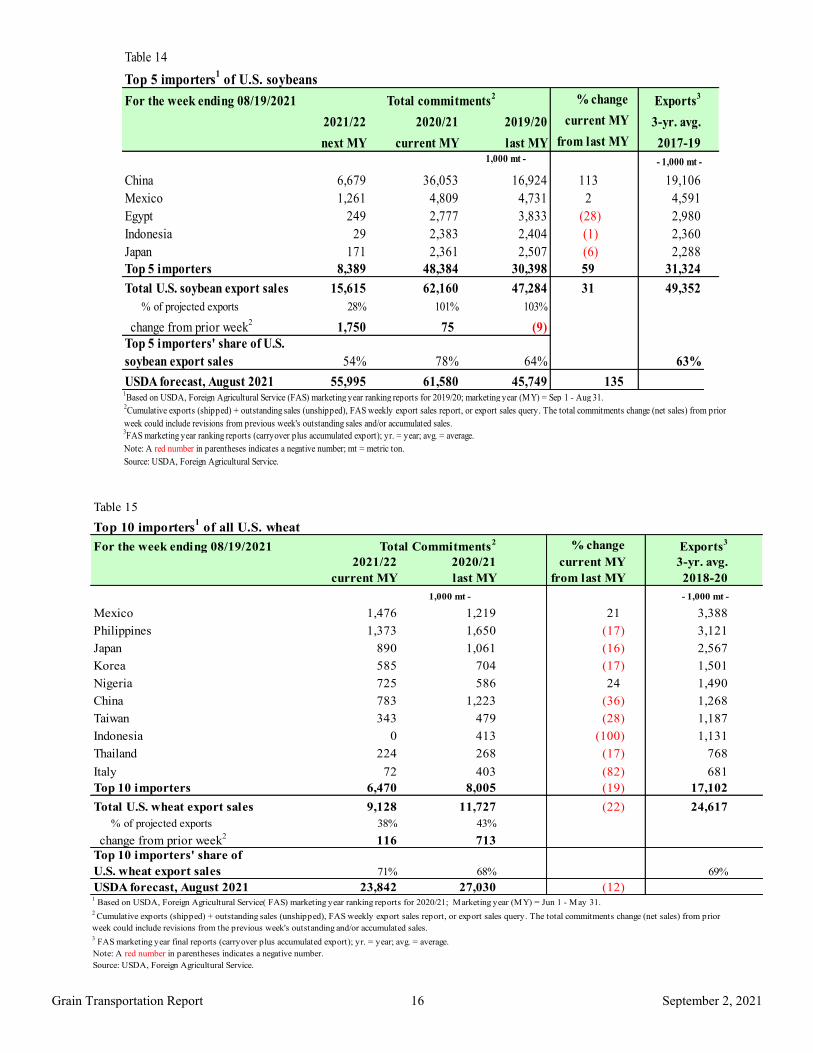
Table 14
Top 5 importers1 of U.S. soybeans
For the week ending 08/19/2021 Total commitments2 % change
Exports3
2021/22 2020/21 2019/20 current MY 3-yr. avg.
next MY current MY last MY from last MY 2017-191,000 mt - - 1,000 mt -
China 6,679 36,053 16,924 113 19,106
Mexico 1,261 4,809 4,731 2 4,591
Egypt 249 2,777 3,833 (28) 2,980
Indonesia 29 2,383 2,404 (1) 2,360
Japan 171 2,361 2,507 (6) 2,288
Top 5 importers 8,389 48,384 30,398 59 31,324
Total U.S. soybean export sales 15,615 62,160 47,284 31 49,352
% of projected exports 28% 101% 103%
change from prior week2
1,750 75 (9)
Top 5 importers' share of U.S.
soybean export sales 54% 78% 64% 63%
USDA forecast, August 2021 55,995 61,580 45,749 1351Based on USDA, Foreign Agricultural Service (FAS) marketing year ranking reports for 2019/20; marketing year (MY) = Sep 1 - Aug 31.
Source: USDA, Foreign Agricultural Service.
3FAS marketing year ranking reports (carryover plus accumulated export); yr. = year; avg. = average.
2Cumulative exports (shipped) + outstanding sales (unshipped), FAS weekly export sales report, or export sales query. The total commitments change (net sales) from prior
week could include revisions from previous week's outstanding sales and/or accumulated sales.
Note: A red number in parentheses indicates a negative number; mt = metric ton.
Table 15
Top 10 importers1 of all U.S. wheat
For the week ending 08/19/2021 Total Commitments2 % change
Exports3
2021/22 2020/21 current MY 3-yr. avg.
current MY last MY from last MY 2018-20
1,000 mt - - 1,000 mt -
Mexico 1,476 1,219 21 3,388
Philippines 1,373 1,650 (17) 3,121
Japan 890 1,061 (16) 2,567
Korea 585 704 (17) 1,501
Nigeria 725 586 24 1,490
China 783 1,223 (36) 1,268
Taiwan 343 479 (28) 1,187
Indonesia 0 413 (100) 1,131
Thailand 224 268 (17) 768
Italy 72 403 (82) 681
Top 10 importers 6,470 8,005 (19) 17,102
Total U.S. wheat export sales 9,128 11,727 (22) 24,617
% of projected exports 38% 43%
change from prior week2
116 713
Top 10 importers' share of
U.S. wheat export sales 71% 68% 69%
USDA forecast, August 2021 23,842 27,030 (12)1 Based on USDA, Foreign Agricultural Service( FAS) marketing year ranking reports for 2020/21; Marketing year (MY) = Jun 1 - May 31.
Source: USDA, Foreign Agricultural Service.
3 FAS marketing year final reports (carryover plus accumulated export); yr. = year; avg. = average.
2 Cumulative exports (shipped) + outstanding sales (unshipped), FAS weekly export sales report, or export sales query. The total commitments change (net sales) from prior
week could include revisions from the previous week's outstanding and/or accumulated sales.
Note: A red number in parentheses indicates a negative number.
September 2, 2021
Grain Transportation Report 17
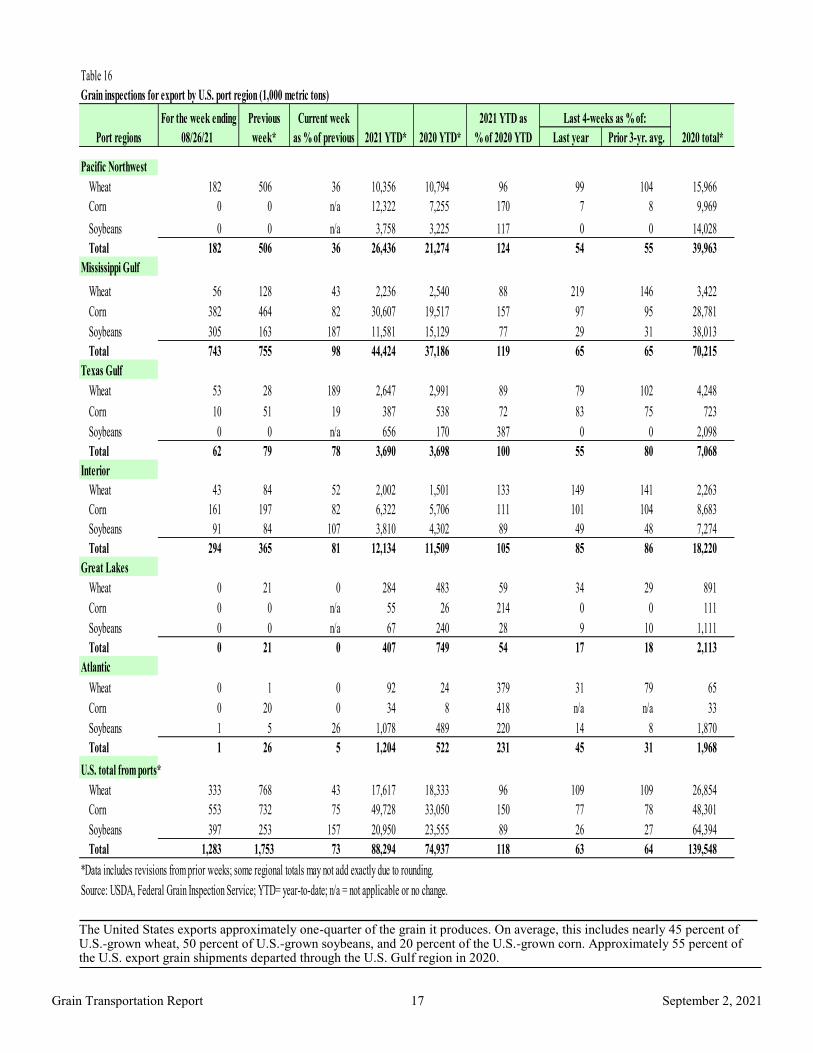
The United States exports approximately one-quarter of the grain it produces. On average, this includes nearly 45 percent of U.S.-grown wheat, 50 percent of U.S.-grown soybeans, and 20 percent of the U.S.-grown corn. Approximately 55 percent of the U.S. export grain shipments departed through the U.S. Gulf region in 2020.
Table 16
Grain inspections for export by U.S. port region (1,000 metric tons)
For the week ending Previous Current week 2021 YTD as
08/26/21 week* as % of previous 2020 YTD* % of 2020 YTD Last year Prior 3-yr. avg.
Pacific Northwest
Wheat 182 506 36 10,356 10,794 96 99 104 15,966
Corn 0 0 n/a 12,322 7,255 170 7 8 9,969
Soybeans 0 0 n/a 3,758 3,225 117 0 0 14,028
Total 182 506 36 26,436 21,274 124 54 55 39,963
Mississippi Gulf
Wheat 56 128 43 2,236 2,540 88 219 146 3,422
Corn 382 464 82 30,607 19,517 157 97 95 28,781
Soybeans 305 163 187 11,581 15,129 77 29 31 38,013
Total 743 755 98 44,424 37,186 119 65 65 70,215
Texas Gulf
Wheat 53 28 189 2,647 2,991 89 79 102 4,248
Corn 10 51 19 387 538 72 83 75 723
Soybeans 0 0 n/a 656 170 387 0 0 2,098
Total 62 79 78 3,690 3,698 100 55 80 7,068
Interior
Wheat 43 84 52 2,002 1,501 133 149 141 2,263
Corn 161 197 82 6,322 5,706 111 101 104 8,683
Soybeans 91 84 107 3,810 4,302 89 49 48 7,274
Total 294 365 81 12,134 11,509 105 85 86 18,220
Great Lakes
Wheat 0 21 0 284 483 59 34 29 891
Corn 0 0 n/a 55 26 214 0 0 111
Soybeans 0 0 n/a 67 240 28 9 10 1,111
Total 0 21 0 407 749 54 17 18 2,113
Atlantic
Wheat 0 1 0 92 24 379 31 79 65
Corn 0 20 0 34 8 418 n/a n/a 33
Soybeans 1 5 26 1,078 489 220 14 8 1,870
Total 1 26 5 1,204 522 231 45 31 1,968
U.S. total from ports*
Wheat 333 768 43 17,617 18,333 96 109 109 26,854
Corn 553 732 75 49,728 33,050 150 77 78 48,301
Soybeans 397 253 157 20,950 23,555 89 26 27 64,394
Total 1,283 1,753 73 88,294 74,937 118 63 64 139,548
*Data includes revisions from prior weeks; some regional totals may not add exactly due to rounding.
Source: USDA, Federal Grain Inspection Service; YTD= year-to-date; n/a = not applicable or no change.
Last 4-weeks as % of:
Port regions 2020 total*2021 YTD*

September 2, 2021
Grain Transportation Report 18
Figure 15
U.S. Grain inspections: U.S. Gulf and PNW1 (wheat, corn, and soybeans)
-
20
40
60
80
100
1/9
/20
2/9
/20
3/9
/20
4/9
/20
5/9
/20
6/9
/20
7/9
/20
8/9
/20
9/9
/20
10/
9/2
0
11/
9/2
0
12/
9/2
0
1/9
/21
2/9
/21
3/9
/21
4/9
/21
5/9
/21
6/9
/21
7/9
/21
8/9
/21
9/9
/21
10/
9/2
1
11/
9/2
1
12/
9/2
1
Mil
lion
bu
sh
els
(m
bu
)
Mississippi (Miss.) Gulf 3-Year avg. - Miss. Gulf
Pacific Northwest (PNW) 3-Year avg. - PNW
Texas (TX) Gulf 3-Year avg. - TX Gulf
Source: USDA, Federal Grain Inspection Service.
Last wk:
Last Year (same wk):
3-yr avg. (4-wk. mov. Avg):
MS Gulf TX Gulf U.S. Gulf PNW
down 2
up 44
down 39
down 24
down 63
down 31
down 4
up 18
down 38
down 64
down 76
down 73
Percent change from:Week ending 08/26/21 inspections (mbu):
MS Gulf:
PNW:
TX Gulf:
28.3
6.7
2.3
Figure 14
U.S. grain inspected for export (wheat, corn, and soybeans)
Note: 3-year average consists of 4-week running average.
Source: USDA, Federal Grain Inspection Service.
0
20
40
60
80
100
120
140
160
180
200
1/3
0/2
020
2/2
7/2
020
3/2
6/2
020
4/2
3/2
020
5/2
1/2
020
6/1
8/2
020
7/1
6/2
020
8/1
3/2
020
9/1
0/2
020
10/8
/20
20
11/5
/20
20
12/3
/20
20
12/3
1/2
02
0
1/2
8/2
021
2/2
5/2
021
3/2
5/2
021
4/2
2/2
021
5/2
0/2
021
6/1
7/2
021
7/1
5/2
021
8/1
2/2
021
9/9
/20
21
10/7
/20
21
11/4
/20
21
12/2
/20
21
12/3
0/2
02
1
Mil
lion
bu
sh
els
(m
bu
)
Current week 3-year average
For the week ending Aug. 26: 48.6 mbu of grain inspected, down 27 percent from the previous week, down 29 percent from
same week last year, and down 47 percent from the 3-year average.
September 2, 2021
Grain Transportation Report 19
Ocean Transportation
Figure 16
U.S. Gulf1 vessel loading activity
0
10
20
30
40
50
60
70
02/1
1/2
02
1
02/1
8/2
02
1
02/2
5/2
02
1
03/0
4/2
02
1
03/1
1/2
02
1
03/1
8/2
02
1
03/2
5/2
02
1
04/0
1/2
02
1
04/0
8/2
02
1
04/1
5/2
02
1
04/2
2/2
02
1
04/2
9/2
02
1
05/0
6/2
02
1
05/1
3/2
02
1
05/2
0/2
02
1
05/2
7/2
02
1
06/0
3/2
02
1
06/1
0/2
02
1
06/1
7/2
02
1
06/2
4/2
02
1
07/0
1/2
02
1
07/0
8/2
02
1
07/1
5/2
02
1
07/2
2/2
02
1
07/2
9/2
02
1
08/0
5/2
02
1
08/1
2/2
02
1
08/1
9/2
02
1
08/2
6/2
02
1
Nu
mb
er o
f ves
sels
Loaded last 7 days Due next 10 days Loaded 4-year average
1U.S. Gulf includes Mississippi, Texas, and East Gulf.Source:USDA, Agricultural Marketing Service.
For the week ending August 26 Loaded Due Change from last year -8.7% -34.6%
Change from 4-year average -33.9% -29.5%
Table 17
Weekly port region grain ocean vessel activity (number of vessels)
Pacific
Gulf Northwest
Loaded Due next
Date In port 7-days 10-days In port
8/26/2021 26 21 34 4
8/19/2021 22 24 31 5
2020 range (22…60) (23...46) (34...68) (7…24)
2020 average 37 33 49 15
Note: n/a = not available due to holiday.
Source: USDA, Agricultural Marketing Service.
September 2, 2021
Grain Transportation Report 20
Figure 17
Grain vessel rates, U.S. to Japan
Note: PNW = Pacific Northwest
Source: O'Neil Commodity Consulting
0
10
20
30
40
50
60
70
80
90A
ug '1
9
Oct
'19
Dec
'19
Feb
'20
Apr
'20
Jun
'20
Aug
'20
Oct
'20
Dec
'20
Feb
'21
Apr
'21
Jun
'21
Aug
'21
U.S
. $
/metr
ic t
on
Spread U.S. Gulf vs. PNW to Japan Rate U.S. Gulf to Japan Rate PNW to Japan
U.S. Gulf PNW Spread
Ocean rates August '21 $80..38 $43.63 $36.73
Change from August '20 82.1% 81.8% 82.6%
Change from 4-year average 81.0% 81.1% 80.7%
Table 18
Ocean freight rates for selected shipments, week ending 08/28/2021
Export Import Grain Loading Volume loads Freight rate
region region types date (metric tons) (US$/metric ton)
U.S. Gulf Japan Heavy grain Oct 1/10 48,000 70.10
U.S. Gulf Japan Heavy grain Aug 21/Sep 9 50,000 60.90
U.S. Gulf Japan Heavy grain Aug 1/10 50,000 69.75
U.S. Gulf Japan Heavy grain Jul 1/15 50,000 64.10
U.S. Gulf Japan Grain May 25/Jun 25 50,000 46.85 op 47.85
U.S. Gulf Japan Heavy grain Apr 15/May 15 50,000 47.00
U.S. Gulf Sudan Wheat Sep 1/10 49,000 79.12*
U.S. Gulf China Heavy grain Oct 1/10 55,000 81.50
U.S. Gulf Djibouti Wheat Jul 6/16 5,880 85.70*
PNW Japan Wheat Sep 1 52,170 56.55*
PNW Japan Wheat Jul 25/ Aug 5 32,590 64.00
PNW Japan Wheat Jul 16/31 30,250 64.35
PNW Japan Wheat Jun 5/15 50,600 49.30
PNW Yemen Wheat Jun 10/20 22,230 132.25*
PNW Taiwan Heavy grain Aug 20/30 35,000 64.20*
PNW Taiwan Wheat Aug 1/10 55,000 54.95
PNW Taiwan Wheat May 29/Jun 12 45,665 48.00 *50 percent of food aid from the United States is required to be shipped on U.S.-flag vessels.
op = option.
Source: Maritime Research, Inc.
Note: Rates shown are per metric ton (2,204.62 lbs. = 1 metric ton), free on board (F.O.B), except where otherwise indicated;
September 2, 2021
Grain Transportation Report 21
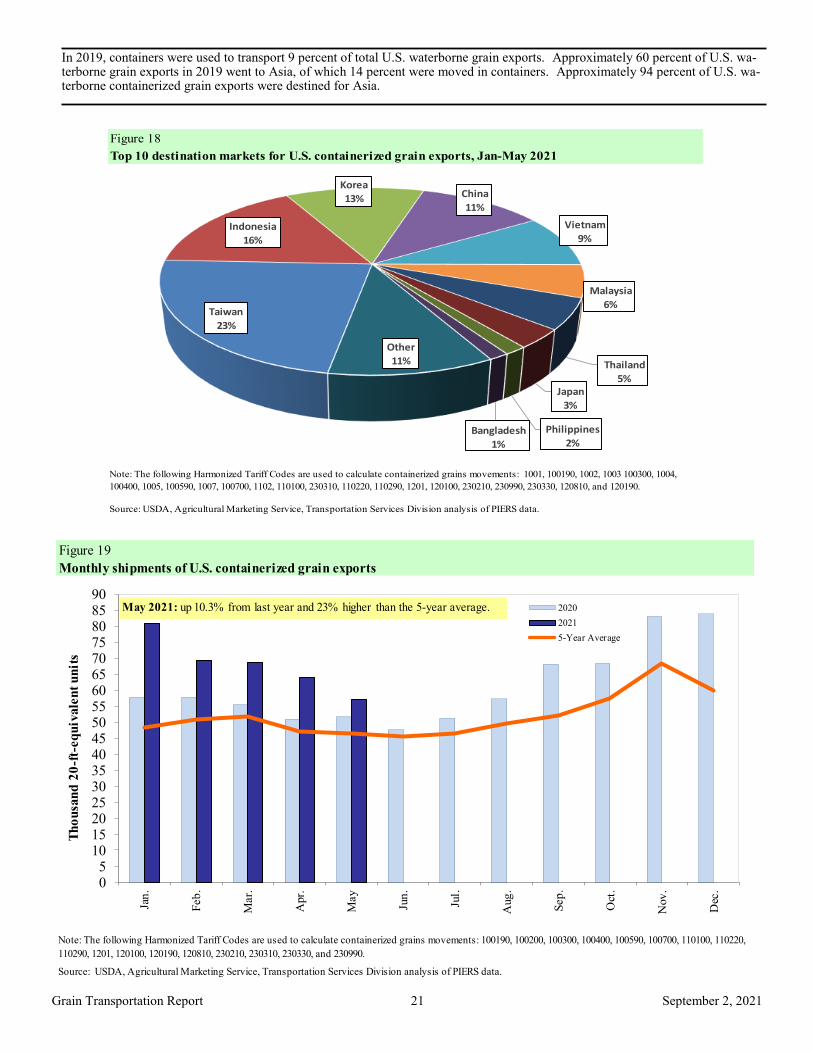
In 2019, containers were used to transport 9 percent of total U.S. waterborne grain exports. Approximately 60 percent of U.S. wa-terborne grain exports in 2019 went to Asia, of which 14 percent were moved in containers. Approximately 94 percent of U.S. wa-terborne containerized grain exports were destined for Asia.
Figure 18
Source: USDA, Agricultural Marketing Service, Transportation Services Division analysis of PIERS data.
Note: The following Harmonized Tariff Codes are used to calculate containerized grains movements: 1001, 100190, 1002, 1003 100300, 1004,
100400, 1005, 100590, 1007, 100700, 1102, 110100, 230310, 110220, 110290, 1201, 120100, 230210, 230990, 230330, 120810, and 120190.
Top 10 destination markets for U.S. containerized grain exports, Jan-May 2021
Taiwan
23%
Indonesia
16%
Korea
13% China
11%
Vietnam
9%
Malaysia
6%
Thailand
5%Japan
3%
Philippines
2%Bangladesh
1%
Other
11%
Figure 19
Monthly shipments of U.S. containerized grain exports
Source: USDA, Agricultural Marketing Service, Transportation Services Division analysis of PIERS data.
Note: The following Harmonized Tariff Codes are used to calculate containerized grains movements: 100190, 100200, 100300, 100400, 100590, 100700, 110100, 110220,
110290, 1201, 120100, 120190, 120810, 230210, 230310, 230330, and 230990.
05
1015202530354045505560657075808590
Jan
.
Feb
.
Mar.
Apr.
May
Jun
.
Jul.
Aug
.
Sep
.
Oct
.
Nov
.
Dec
.
Th
ou
san
d 2
0-f
t-eq
uiv
ale
nt
un
its
2020
2021
5-Year Average
May 2021: up 10.3% from last year and 23% higher than the 5-year average.

September 2, 2021
Grain Transportation Report 22
Coordinators Surajudeen (Deen) Olowolayemo [email protected] (202) 720 - 0119 Maria Williams [email protected] (202) 690 - 4430 Bernadette Winston [email protected] (202) 690 - 0487 Matt Chang [email protected] (202) 720 - 0299
Grain Transportation Indicators Surajudeen (Deen) Olowolayemo [email protected] (202) 720 - 0119
Rail Transportation Johnny Hill [email protected] (202) 690 - 3295 Jesse Gastelle [email protected] (202) 690 - 1144 Peter Caffarelli [email protected] (202) 690 - 3244
Barge Transportation April Taylor [email protected] (202) 720 - 7880 Bernadette Winston [email protected] (202) 690 - 0487 Matt Chang [email protected] (202) 720 - 0299 Truck Transportation April Taylor [email protected] (202) 720 - 7880 Kranti Mulik [email protected] (202) 756 - 2577 Matt Chang [email protected] (202) 720 - 0299
Grain Exports Johnny Hill [email protected] (202) 690 - 3295 Kranti Mulik [email protected] (202) 756 - 2577 Ocean Transportation Surajudeen (Deen) Olowolayemo [email protected] (202) 720 - 0119 (Freight rates and vessels) April Taylor [email protected] (202) 720 - 7880 (Container movements)
Editor Maria Williams [email protected] (202) 690-4430 Subscription Information: Please sign up to receive regular email announcements of the latest GTR issue by entering your email address here and selecting your preference to receive Transportation Research and Analysis. For any other infor-
mation, you may contact us at [email protected].
Preferred citation: U.S. Department of Agriculture, Agricultural Marketing Service. Grain Transportation Report. September 2, 2021. Web: http://dx.doi.org/10.9752/TS056.09-02-2021.
Contacts and Links
In accordance with Federal civil rights law and U.S. Department of Agriculture (USDA) civil rights regulations and policies, the USDA, its Agencies, offices, and employees, and institutions participating in or administering USDA programs are prohibited from discriminating based on race, color, national origin, religion, sex, gender identity (including gender expression), sexual orientation, disability, age, marital status, family/parental status, income derived from a public assistance program, political beliefs, or reprisal or retaliation for prior civil rights activity, in any program or activity conducted or funded by USDA (not all bases apply to all programs). Remedies and complaint filing deadlines vary by pro-gram or incident. Persons with disabilities who require alternative means of communication for program information (e.g., Braille, large print, audiotape, American Sign Language, etc.) should contact the responsible Agency or USDA's TARGET Center at (202) 720-2600 (voice and TTY) or contact USDA through the Federal Relay Service at (800) 877-8339. Additionally, program information may be made available in languages other than English. To file a program discrimination complaint, complete the USDA Program Discrimination Complaint Form, AD-3027, found online at How to File a Program Discrimination Complaint and at any USDA office or write a letter addressed to USDA and provide in the letter all of the infor-mation requested in the form. To request a copy of the complaint form, call (866) 632-9992. Submit your completed form or letter to USDA by: (1) mail: U.S. Department of Agriculture, Office of the Assistant Secretary for Civil Rights, 1400 Independence Avenue, SW, Washington, D.C.


