
WINNIPEG SEWAGE TREATMENT PROGRAM
SOUTH END PLANT
PAGE
1/189
PROCESS SELECTION REPORT
Final FINAL AFTER VALIDATION OF EXECUTIVE SUMMARY 12/07/11 ASI NWA
B7 ISSUANCE AFTER ADDITIONAL ANALYSIS 05/05/11 ASI NWA
B6 ISSUE FOR PRESENTATION - PROGRAM CONFIDENTIAL 17/01/11 ASI NWA
A1 EDITING OF REPORT 28/07/11
A ISSUE FOR REVIEW WORKSHOP 23/08/10 ASI
Rev NATURE OF REVISION DATE MADE APPROVED

WINNIPEG SEWAGE TREATMENT PROGRAM
SEWPCC PROCESS SELECTION REPORT – Table of contents Page 2 of 193
PSR_rev final – July 2011
TABLE OF CONTENTS
-ooOoo-
EXECUTIVE SUMMARY ....................................................................................................................... 13
INTRODUCTION .................................................................................................................................... 18
PART I - PROCESS SELECTION METHODOLOGY ............................................................................ 20
I. GENERAL ........................................................................................................................................................................................ 21
II. THE DIFFERENT STAGES OF THE “PROCESS SELECTION STEP” .......................................................................................................... 21
II.1 Existing information collection and basic assumptions definition ........................................................................................... 21 II.2 Development of the Program’s own solutions ........................................................................................................................ 22 II.3 Comparison tool definition ...................................................................................................................................................... 22 II.4 Process option selection ........................................................................................................................................................ 23
III. SIGNIFICANT PENDING ISSUES ......................................................................................................................................................... 23
III.1 The sludge issue ................................................................................................................................................................... 23 III.2 The septage and leachate issues ......................................................................................................................................... 24
PART II – PROJECT’S ASSUMPTIONS DEFINITION .......................................................................... 25
I. SEWAGE CHARACTERIZATION ...................................................................................................... 27
I.1 BACKGROUND ............................................................................................................................................................................... 28
I.2 BASE LINE CALCULATION ............................................................................................................................................................... 28
I.2.1 Existing wastewater flows and loads .................................................................................................................................... 28 I.2.2 Existing per capita flows and loads ...................................................................................................................................... 37
I.3 2031 FLOWS AND LOADS PROJECTIONS .......................................................................................................................................... 40
I.3.1 Population projection ............................................................................................................................................................ 40 I.3.2 Flows and loads projection ................................................................................................................................................... 40
I.4 CONCLUSION ................................................................................................................................................................................. 42
II. OUTLET REQUIREMENTS ............................................................................................................... 45
II.1 LICENSE REQUIREMENTS ............................................................................................................................................................... 46
II.2 EVALUATION OF LICENSE REQUIREMENTS ....................................................................................................................................... 47
PART III - PROCESS SOLUTIONS DESCRIPTION.............................................................................. 48

WINNIPEG SEWAGE TREATMENT PROGRAM
SEWPCC PROCESS SELECTION REPORT – Table of contents Page 3 of 193
PSR_rev final – July 2011
I. PRESELECTION OF THE PROCESS TECHNOLOGIES .................................................................. 49
II. REVIEW WORKSHOP RESULTS ..................................................................................................... 51
II.1 THE EAP SCOPE OF WORK AND ITS RESULTS ................................................................................................................................. 52
II.1.1 The review workshop .......................................................................................................................................................... 52 II.1.2 The EAP report ................................................................................................................................................................... 52 II.1.3 The EAP conclusion ............................................................................................................................................................ 53
II.2 FORMER OPTION 1 PRESENTATION ................................................................................................................................................. 53
II.2.1 Treatment line overview ...................................................................................................................................................... 53 II.2.2 Description of wastewater treatment ................................................................................................................................... 53 II.2.3 Description of sludge treatment .......................................................................................................................................... 53 II.2.4 Description of odour treatment ............................................................................................................................................ 53
III. DESIGN REPORT FOR OPTION 2 .................................................................................................. 55
III.1 DESIGN DATA .............................................................................................................................................................................. 56
III.1.1 Design influent flows .......................................................................................................................................................... 56 III.1.2 Design influent loads and temperature .............................................................................................................................. 56 III.1.3 Inlet water characterization hypothesis .............................................................................................................................. 58 III.1.4 Performance guarantees .................................................................................................................................................... 59 III.1.5 Simulations ......................................................................................................................................................................... 59 III.1.6 Sludge handling ................................................................................................................................................................. 59
III.2 TREATMENT LINE OVERVIEW ......................................................................................................................................................... 59
II.2.1 Description of wastewater treatment ................................................................................................................................... 60 III.2.2 Description of sludge treatment ......................................................................................................................................... 60 III.2.3 Description of odour treatment ........................................................................................................................................... 60
III.3 PROCESS CALCULATIONS - HEADWORKS ....................................................................................................................................... 62
III.4 PROCESS CALCULATIONS – BNR TREATMENT ............................................................................................................................... 62
III.4.1 Design Capacity ................................................................................................................................................................. 62 III.4.2 Primary settling .................................................................................................................................................................. 63 III.4.3 Biological Reactors ............................................................................................................................................................ 68 III.4.4 Clarification ........................................................................................................................................................................ 74 III.4.5 Sizing of the clarifiers ......................................................................................................................................................... 74 III.4.6 UV Disinfection for BNR line .............................................................................................................................................. 78 III.4.7 Daily ammonia limit ............................................................................................................................................................ 79
III.5 PROCESS CALCULATIONS – EXCESS FLOWS TREATMENT ................................................................................................................ 80
III.5.1 Design capacity .................................................................................................................................................................. 80 III.5.2 Ballasted primary clarification ............................................................................................................................................ 81 III.5.3 Cl2 Disinfection for wet weather ......................................................................................................................................... 84
III.6 PROCESS CALCULATIONS – SLUDGE HANDLING ............................................................................................................................. 85
III.7 PROCESS REDUNDANCY APPROACH ............................................................................................................................................. 86
IV. DESIGN REPORT FOR OPTION 3 .................................................................................................. 88
IV.1 DESIGN DATA .............................................................................................................................................................................. 89
IV.1.1 Design influent flows .......................................................................................................................................................... 89

WINNIPEG SEWAGE TREATMENT PROGRAM
SEWPCC PROCESS SELECTION REPORT – Table of contents Page 4 of 193
PSR_rev final – July 2011
IV.1.2 Design influent loads and temperature .............................................................................................................................. 89 IV.1.3 Inlet water characterization hypothesis .............................................................................................................................. 89 IV.1.4 Performance guarantees ................................................................................................................................................... 89 IV.1.5 Simulations ........................................................................................................................................................................ 89 IV.1.6 Sludge handling ................................................................................................................................................................. 89
IV.2 TREATMENT LINE OVERVIEW......................................................................................................................................................... 89
IV.2.1 Description of wastewater treatment ................................................................................................................................. 90 IV.2.2 Description of sludge treatment ......................................................................................................................................... 90 IV.2.3 Description of odour treatment .......................................................................................................................................... 90
IV.3 PROCESS CALCULATIONS - HEADWORKS ...................................................................................................................................... 92
IV.4 PROCESS CALCULATIONS – BNR TREATMENT .............................................................................................................................. 92
IV.4.1 Design Capacity ................................................................................................................................................................. 92 IV.4.2 Primary settling .................................................................................................................................................................. 92 IV.4.3 Biological reactors ............................................................................................................................................................. 92 IV.4.4 Clarification ........................................................................................................................................................................ 97 IV.4.5 Intermediate pumping ...................................................................................................................................................... 100 IV.4.6 Biofilters For Nitrification and Post Denitrification ............................................................................................................ 101 IV.4.7 UV Disinfection for BNR line ............................................................................................................................................ 108 IV.4.8 Daily ammonia limit .......................................................................................................................................................... 108
IV.5 PROCESS CALCULATIONS – EXCESS FLOWS TREATMENT ............................................................................................................. 109
IV.6 PROCESS CALCULATIONS – SLUDGE HANDLING ........................................................................................................................... 109
IV.7 PROCESS REDUNDANCY APPROACH ........................................................................................................................................... 110
V. DESIGN REPORT FOR OPTION 4 ................................................................................................. 111
V.1 DESIGN DATA ............................................................................................................................................................................. 112
V.1.1 Design influent flows ......................................................................................................................................................... 112 V.1.2 Design influent loads and temperature ............................................................................................................................. 112 V.1.3 Inlet water characterization hypothesis ............................................................................................................................. 112 V.1.4 Performance guarantees .................................................................................................................................................. 112 V.1.5 Simulations ....................................................................................................................................................................... 112 V.1.6 Sludge handling ................................................................................................................................................................ 112 V.1.7 Treatment line overview .................................................................................................................................................... 112 V.1.8 Description of wastewater treatment ................................................................................................................................ 113 V.1.9 Description of sludge treatment ........................................................................................................................................ 113 V.1.10 Description of odour treatment ....................................................................................................................................... 113
V.2 PROCESS CALCULATIONS - HEADWORKS ..................................................................................................................................... 115
V.3 PROCESS CALCULATIONS – BNR TREATMENT ............................................................................................................................. 115
V.3.1 Design Capacity ................................................................................................................................................................ 115 V.3.2 Primary settling ................................................................................................................................................................. 115 V.3.3 Intermediate pumping ....................................................................................................................................................... 119 V.3.4 Biofilters For Nitrification and Post Denitrification ............................................................................................................. 119 V.3.5 UV Disinfection for BNR line ............................................................................................................................................. 127 V.3.6 Daily ammonia limit ........................................................................................................................................................... 127
V.4 PROCESS CALCULATIONS – EXCESS FLOWS TREATMENT .............................................................................................................. 127
V.5 PROCESS CALCULATIONS – SLUDGE HANDLING ............................................................................................................................ 128
WINNIPEG SEWAGE TREATMENT PROGRAM
SEWPCC PROCESS SELECTION REPORT – Table of contents Page 5 of 193
PSR_rev final – July 2011
V.6 PROCESS REDUNDANCY APPROACH ............................................................................................................................................ 129
PART IV – COMPARISON PROCESS DEFINITION ........................................................................... 130
I. COMPARISON CRITERIA ................................................................................................................ 131
I.1 GENERAL .................................................................................................................................................................................... 132
I.2 CATEGORIES OF CRITERIA ............................................................................................................................................................ 132
I.3 LIST OF CRITERIA ......................................................................................................................................................................... 132
I.4 CRITERIA DEFINITION .................................................................................................................................................................... 134
II. WEIGHTING PROCEDURE ............................................................................................................. 139
II.1 WEIGHTING AND SCORING PRINCIPLES ......................................................................................................................................... 140
II.2 WEIGHTING TEAM COMPOSITION .................................................................................................................................................. 140
II.3 WEIGHTING METHODOLOGY ......................................................................................................................................................... 140
III. SCORING PROCEDURE ................................................................................................................ 141
III.1 SCORING TEAM COMPOSITION ..................................................................................................................................................... 142
III.2 SCORING METHODOLOGY ........................................................................................................................................................... 142
III.2.1 Pre scoring scan .............................................................................................................................................................. 142 III.2.2 Final scoring ..................................................................................................................................................................... 142
III.3 FINANCIAL SCORING ................................................................................................................................................................... 143
III.3.1 General ............................................................................................................................................................................ 143 III.3.2 CAPEX estimation ............................................................................................................................................................ 143 III.3.3 OPEX estimation .............................................................................................................................................................. 148 III.3.4 NPV and whole life cost ................................................................................................................................................... 150 III.3.5 Risk and opportunity analysis .......................................................................................................................................... 151
III.4 THE SPECIFIC CASE OF THE CARBON FOOTPRINT SCORING ........................................................................................................... 153
III.4.1 General ............................................................................................................................................................................ 153 III.4.2 Carbon footprint calculation methodology ........................................................................................................................ 153
PART V - PROCESS SELECTION RESULTS .................................................................................... 154
I. COMPARISON TABLE ..................................................................................................................... 155
I.1 WEIGHTING OF THE CRITERIA ........................................................................................................................................................ 156
I.2 TECHNICAL SCORING RESULTS ..................................................................................................................................................... 157
I.2.1 Global results ..................................................................................................................................................................... 157 I.2.2 The specific case of track records in similar climate .......................................................................................................... 159 I.2.3 The specific case of the construction durations ................................................................................................................. 159

WINNIPEG SEWAGE TREATMENT PROGRAM
SEWPCC PROCESS SELECTION REPORT – Table of contents Page 6 of 193
PSR_rev final – July 2011
II. CAPEX AND OPEX ESTIMATIONS ................................................................................................ 160
II.1 CAPEX ESTIMATIONS ................................................................................................................................................................. 161
II.2 OPEX ESTIMATIONS ................................................................................................................................................................... 162
II.3 R&O MATRIX .............................................................................................................................................................................. 162
II.4 FINAL RESULTS ........................................................................................................................................................................... 165
III. CARBON FOOTPRINT ESTIMATIONS ......................................................................................... 167
III.1 OPTIONS 2, 3 AND 4 RESULTS ..................................................................................................................................................... 168
III.2 INTERPRETATION ....................................................................................................................................................................... 169
IV. PROCESS OPTION SELECTION .................................................................................................. 170
IV.1 GLOBAL SCORING OF THE PRE-SELECTED OPTIONS ..................................................................................................................... 171
IV.2 AUDIT OF THE SLUDGE IMPACT ISSUE .......................................................................................................................................... 172
IV.3 CONCLUSION AND RECOMMENDATION......................................................................................................................................... 175
APPENDICES ...................................................................................................................................... 176

WINNIPEG SEWAGE TREATMENT PROGRAM
SEWPCC PROCESS SELECTION REPORT – List of tables Page 7 of 193
PSR_rev final – July 2011
LIST OF TABLES
-ooOoo-
Table 1: SEWPCC Influent Wastewater Characteristics Summary (2005 January through 2010 April) .......................................... 29 Table 2: SEWPCC Influent Waste Loads Summary (2005 January through 2010 April) ................................................................. 30 Table 3: Comparison of Period Average (2005 January to 2010 April) Before and After Elimination of Data Outside of Three Standard Deviations ......................................................................................................................................................................... 31 Table 4: SEWPCC Seasonal Influent Wastewater characteristics Summary (2005 January through 2010 April) ........................... 32 Table 5: SEWPCC Seasonal Influent Waste Loads Summary (2005 January through 2010 April) ................................................. 33 Table 6: Monthly Averages for 2005 January through 2010 April Period ......................................................................................... 34 Table 7: Parameter Peaking Factors ................................................................................................................................................ 35 Table 8: Mass Load Peaking Factors ............................................................................................................................................... 36 Table 9: Seasonal Flow and Mass Load Peaking Factors ............................................................................................................... 37 Table 10: Per Capita Flows and Loads ............................................................................................................................................ 38 Table 11: Comparison of SEWPCC Per Capita Flows and Loads to recommended and literature values ...................................... 39 Table 12: Projected 2031 Flows and Loads ..................................................................................................................................... 41 Table 13: Difference between Program’s recommendation and PDR for projected flows and loads ............................................... 44 Table 14: new license requirements ................................................................................................................................................. 46 Table 15: Program’s assumptions of license requirements .............................................................................................................. 47 Table 16: workshop attendees ......................................................................................................................................................... 52 Table 17: Main design flows – all options ......................................................................................................................................... 56 Table 18: Seasonal flows – all options ............................................................................................................................................. 57 Table 19: Influent characterization – all options ............................................................................................................................... 58 Table 20: Effluent guarantees – all options ...................................................................................................................................... 59 Table 21: Existing pumping station characteristics – all options ...................................................................................................... 62 Table 22: BNR treatment line design capacity – options 2 & 3 ........................................................................................................ 62 Table 23: Inlet water quality – primary settling – options 2 & 3 ........................................................................................................ 63 Table 24: Design of primary clarifiers – options 2 & 3 ...................................................................................................................... 63 Table 25: Arrangements for primary settling – options 2 & 3 ........................................................................................................... 64 Table 26: Expected performances for primary settling – options 2 & 3 ............................................................................................ 65 Table 27: Primary sludge production – options 2 & 3 ....................................................................................................................... 67 Table 28: Required set of pumps for primary sludge extraction – options 2 & 3 .............................................................................. 67 Table 29: Sizing of the biological reactors – option 2 ....................................................................................................................... 69 Table 30: Chemical requirement in biological reactor – option 2 ..................................................................................................... 70 Table 31: Arrangements for biological reactors – option 2 ............................................................................................................... 70 Table 32: Oxidation ditches characteristics – option 2 ..................................................................................................................... 71 Table 33: Media characteristics – option 2 ....................................................................................................................................... 71 Table 34: Oxygen requirement – option 2 ........................................................................................................................................ 72 Table 35: Oxygen production – option 2 .......................................................................................................................................... 73 Table 36: Mixed liquor circulation design – option 2 ........................................................................................................................ 73 Table 37: Clarification characteristics – option 2 .............................................................................................................................. 74 Table 38: Clarification arrangements – option 2 ............................................................................................................................... 75 Table 39: RAS pumps characteristics – option 2 ............................................................................................................................. 76 Table 40: Excess biological sludge production – option 2 ................................................................................................................ 76 Table 41: Excess activated sludge pumping system – option 2 ....................................................................................................... 77 Table 42: Clarified effluent characteristics – option 2 ....................................................................................................................... 78 Table 43: UV disinfection system and BNR Ballasted Primary Settler mixing example – all options ............................................... 79 Table 44: Design assumptions for UV disinfection – all options ....................................................................................................... 79 Table 45: Design flows for wet weather stream – all options ........................................................................................................... 80 Table 46: Inlet water quality in wet weather stream – all options ..................................................................................................... 81 Table 47: Sizing of ballasted clarifiers – all options .......................................................................................................................... 82 Table 48: Expected performances of ballasted settling – all options ............................................................................................... 83 Table 49: Ballasted Primary Settler sludge production from settling tanks – all options .................................................................. 83

WINNIPEG SEWAGE TREATMENT PROGRAM
SEWPCC PROCESS SELECTION REPORT – List of tables Page 8 of 193
PSR_rev final – July 2011
Table 50: Chemical consumption on wet weather stream – all options ........................................................................................... 84 Table 51: Treated wastewater characteristics – all options .............................................................................................................. 84 Table 52: Cl2 disinfection system design – all options...................................................................................................................... 85 Table 53: Sludge production for design conditions – option 2 .......................................................................................................... 85 Table 54: Yearly average sludge production– option 2 .................................................................................................................... 86 Table 55: Flows and loads of recirculated nitrifying Biofilter effluent – option 3 ............................................................................... 93 Table 56: Sizing of the biological reactors – option 3 ....................................................................................................................... 94 Table 57: Chemical requirement in biological reactor – option 3 ..................................................................................................... 94 Table 58: Arrangements for biological reactors – option 3 ............................................................................................................... 95 Table 59: Aerated bioreactor characteristics – option 3 ................................................................................................................... 95 Table 60: Oxygen requirement – option 3 ........................................................................................................................................ 96 Table 61: Oxygen production – option 3 .......................................................................................................................................... 96 Table 62: Design of clarifiers – option 3 ........................................................................................................................................... 97 Table 63: Clarification arrangements – option 3 ............................................................................................................................... 97 Table 64: RAS pumps characteristics – option 3 ............................................................................................................................. 98 Table 65: Excess biological sludge production – option 3 ................................................................................................................ 99 Table 66: Excess activated sludge pumping system – option 3 ....................................................................................................... 99 Table 67: Clarified effluent characteristics – option 3 ..................................................................................................................... 100 Table 68: Intermediate pumping system – option 3 ....................................................................................................................... 100 Table 69: Biofilters-N characteristics – option 3 ............................................................................................................................. 102 Table 70: Expected biofilters-N outlet water quality 1/2 – option 3 ................................................................................................ 103 Table 71: Expected biofilters-N outlet water quality 2/2 – option 3 ................................................................................................ 103 Table 72: Biofilters-N process air requirement – option 3 .............................................................................................................. 104 Table 73: Biofilters-N&PDN wash air requirement – option 3 ........................................................................................................ 105 Table 74: Biofilters-PDN sizing – option 3 ...................................................................................................................................... 106 Table 75: Expected biofilters-PDN outlet water quality – option 3 ................................................................................................. 107 Table 76: Biofilters-PDN chemical requirement – option 3 ............................................................................................................. 108 Table 77: Sludge production summary for design conditions – option 3 ........................................................................................ 109 Table 78: Yearly average sludge production – option 3 ................................................................................................................. 109 Table 79: BNR treatment line design capacity – option 4 .............................................................................................................. 115 Table 80: Design of the primary clarifiers – option 4 ...................................................................................................................... 115 Table 81: Arrangements for primary settling – option 4 ................................................................................................................. 116 Table 82: Expected performances for primary settling – option 4 .................................................................................................. 117 Table 83: Primary sludge production – option 4 ............................................................................................................................. 118 Table 84: Required set of pumps for primary sludge extraction – option 4 .................................................................................... 118 Table 85: Intermediate pumping system – option 4 ....................................................................................................................... 119 Table 86: Design of biofilters-NDN– option 4 ................................................................................................................................. 121 Table 87: Biofilters-NDN expected outlet water quality– option 4 .................................................................................................. 122 Table 88: Biofilters-NDN process air requirement– option 4 .......................................................................................................... 123 Table 89: Biofilters-NDN wash air requirement– option 4 .............................................................................................................. 124 Table 90: Design of biofilters-PDN– option 4 ................................................................................................................................. 125 Table 91: Expected outlet water quality of biofilters-PDN– option 4 .............................................................................................. 126 Table 92: Biofilters-PDN chemical requirement– option 4 .............................................................................................................. 126 Table 93: Existing clarifiers’ characteristics– option 4 .................................................................................................................... 127 Table 94: Washwater treatment characteristics– option 4 ............................................................................................................. 127 Table 95: Washwater Ballasted Primary Settler sludge production– option 4 ................................................................................ 127 Table 96: Sludge production summary for design conditions– option 4 ......................................................................................... 128 Table 97: Yearly average sludge production – option 4 ................................................................................................................. 128 Table 98: List of comparison criteria .............................................................................................................................................. 133 Table 99: CAPEX pricing table ....................................................................................................................................................... 144 Table 100: Available benchmarks for SEWPCC ............................................................................................................................ 145 Table 101: Breakdown for M&E equipments pricing and calculation methodology ........................................................................ 145 Table 102: Civil works unit rates .................................................................................................................................................... 146 Table 103: Breakdown for civil works pricing and calculation methodology ................................................................................... 146 Table 104: Breakdown for provisional sums and calculation methodology .................................................................................... 147 Table 105: OPEX unit rates ............................................................................................................................................................ 148 Table 106: OPEX breakdown ......................................................................................................................................................... 149
WINNIPEG SEWAGE TREATMENT PROGRAM
SEWPCC PROCESS SELECTION REPORT – List of tables Page 9 of 193
PSR_rev final – July 2011
Table 107: NPV calculation assumptions ....................................................................................................................................... 150 Table 108: Risk assessment matrix ............................................................................................................................................... 152 Table 109: Weighting results .......................................................................................................................................................... 156 Table 110: Technical scoring results .............................................................................................................................................. 158 Table 111: CAPEX of the 3 pre-selected options estimation w/o R&O .......................................................................................... 161 Table 112: OPEX evolution from 2010 to 2045 for option 2 ........................................................................................................... 162 Table 113: OPEX evolution from 2010 to 2045 for option 3 ........................................................................................................... 162 Table 114: OPEX evolution from 2010 to 2045 for option 4 ........................................................................................................... 162 Table 115: Risks form .................................................................................................................................................................... 163 Table 116: Opportunity form ........................................................................................................................................................... 164 Table 117: CAPEX and OPEX estimations for the 3 pre-selected options .................................................................................... 165 Table 118: Carbon footprint results ................................................................................................................................................ 168 Table 119: Global scoring of the 3 pre-selected options ................................................................................................................ 171 Table 120: Sensitivity analysis to assess the impact of carbon footprint ....................................................................................... 172 Table 121: Unit rates assumption for sludge hauling ..................................................................................................................... 173 Table 122: Unit rates assumption for sludge hauling ..................................................................................................................... 173 Table 123: CAPEX and OPEX for sludge treatment alternatives from Stantec’s PDR (2006) ....................................................... 174 Table 124: NPV results including the sludge treatment ................................................................................................................. 174 Table 125: Global scoring with the sludge treatment alternatives .................................................................................................. 174

WINNIPEG SEWAGE TREATMENT PROGRAM
SEWPCC PROCESS SELECTION REPORT – List of figures Page 10 of 193
PSR_rev final – July 2011
LIST OF FIGURES
-ooOoo-
Figure 1: Historical per capita dry weather flows .............................................................................................................................. 42 Figure 2: Option 1 PFD .................................................................................................................................................................... 54 Figure 3: Option 2 PFD .................................................................................................................................................................... 61 Figure 4: Option 3 PFD .................................................................................................................................................................... 91 Figure 5: Option 4 PFD .................................................................................................................................................................. 114

WINNIPEG SEWAGE TREATMENT PROGRAM
SEWPCC PROCESS SELECTION REPORT – List of charts Page 11 of 193
PSR_rev final – July 2011
LIST OF CHARTS
-ooOoo-
Chart 1: Annual flows assumptions .................................................................................................................................................. 80 Chart 2: CO2 emissions on lifetime ................................................................................................................................................ 168 Chart 3: CO2 emissions in representative percentage ................................................................................................................... 169

WINNIPEG SEWAGE TREATMENT PROGRAM
SEWPCC PROCESS SELECTION REPORT – List of appendix Page 12 of 193
PSR_rev final – July 2011
LIST OF APPENDIX
-ooOoo-
Appendix 1: Review workshop guideline ........................................................................................................................................ 177 Appendix 2: Stantec’s option G estimate ....................................................................................................................................... 178 Appendix 3: EAP report .................................................................................................................................................................. 179 Appendix 4: Pre-scoring scan results ............................................................................................................................................. 180 Appendix 5: Benchmark analysis details ........................................................................................................................................ 181 Appendix 6: Civil works bill of quantities methodology ................................................................................................................... 182 Appendix 7: CO2 emission factors database ................................................................................................................................. 183 Appendix 8: Scoring table sensitivity analysis ................................................................................................................................ 184 Appendix 9: Biofilter list of references ............................................................................................................................................ 185 Appendix 10: Commissioning plans ............................................................................................................................................... 186 Appendix 11: Construction schedules ............................................................................................................................................ 187 Appendix 12: Assessment of options 2 and 4 possible delivery options ........................................................................................ 188 Appendix 13: Details of calculation of the sludge issue impact ...................................................................................................... 189 Appendix 14: Issues to be addressed in the next steps ................................................................................................................. 190 Appendix 15: Presentation of January 24, 2011 ............................................................................................................................ 191 Appendix 16: Presentation of January 27, 2011 ............................................................................................................................ 192 Appendix 17: Presentation of April 29, 2011 .................................................................................................................................. 193

EXECUTIVE SUMMARY

WINNIPEG SEWAGE TREATMENT PROGRAM
SEWPCC PROCESS SELECTION REPORT – EXECUTIVE SUMMARY Page 14 of 193
PSR_rev final – July 2011
The Winnipeg Sewage Treatment Program (WSTP, the “Program”) is a non-traditional infrastructure delivery model that focuses on extensive collaboration and shared risks and responsibilities for the improvement and operation of the three wastewater treatment plants owned and operated by the City of Winnipeg (CoW). Among which is the South End Water Pollution Control Centre (SEWPCC) which treats wastewater from the City’s south side. In March 2006, the Manitoba Conservation Centre (the Regulator), issued a new licence with respect to operation of SEWPCC which imposes new effluent limits on both nitrogen and phosphorus and should become effective on Dec. 31
st 2012. Consequently the City has to face the need for expansion and
upgrade of the plant. For that purpose, it implemented the SEWPCC expansion and upgrade project (the “Project”). Initiated with the involvement of a local consultancy consortium led by Stantec, the Project has come under the scope of the Program. Objective The objective of this report is to conclude the Process Selection stage of the SEWPCC expansion and upgrade project selecting, on the basis of best whole life cost (NPV of Capex and Opex over 30 years) and technical evaluation, a preferred process technology from a review of the possible technologies that would meet the project’s objectives. The selected treatment process will be the basis for subsequent design, construction and commissioning activities to achieve the Regulatory requirements. Key Assumptions The basic assumptions for the Project have been reviewed and updated by the Program, the two main areas for review were: 1) Influent Characterization,
Influent quality data for SEWPCC was reviewed and updated to take account of all data available to date. Defining accurately the current quality of influent and providing a projection for a twenty year design life of the treatment process taking the operation to year 2031. The two critical design assumptions with respect to influent are:
2031 SEWPCC catchment area population: 250,000 inhabitants and
No change in per capita flows and loads at 2031 compared to current conditions
2) Effluent Requirements. Designing the Project to achieve a strict compliance with the proposed license conditions (specifically never to exceed) would result in over sizing the plant for normal operating conditions. This over sizing would incur a significantly higher capital and operating cost for little additional benefit to the environment and create challenging design and operating conditions under normal operation as the plant has to be designed to operate under this wide range of flow conditions. The Regulator is well aware of the City’s concerns on the issue and is considering the arguments. Meanwhile, Process Selection is progressing under the compliance assumptions adopted by the city Council on February 14, 2011 which were used to generate the project budget, specifically the never to exceed constraint for BOD and TSS is replaced by a 30day rolling average. It is however anticipated that the cost premium for never to exceed would be similar for each option and is therefore not a factor in selection of the preferred process option. The city council agreed at the same Council meeting that chemical reduction of phosphorus can be considered an allowable process.
TSS on effluent 30-day rolling average <25 * mg/l 24 h effluent composite sample
CBOD5
on effluent 30-day rolling average <25 mg/l 24 h effluent composite sample
TN on effluent 30-day rolling average <15 mg/l 24 h effluent composite sample
TP on effluent 30-day rolling average <1 mg/l 24 h effluent composite sample
DESIGN ASSUMPTIONS

WINNIPEG SEWAGE TREATMENT PROGRAM
SEWPCC PROCESS SELECTION REPORT – EXECUTIVE SUMMARY Page 15 of 193
PSR_rev final – July 2011
Options Selection Process selection was completed through a combination of new expertise brought to the Program by Veolia Co and building on the results of engineering studies commissioned by the City prior to the involvement of the Program in the Project. Four process options were shortlisted for further study, two of which are based on previous work done by Stantec and two on expertise and experience brought to the Program by Veolia Co. An Expert Advisory Panel (EAP) engaged independently by the City and composed of recognized world class wastewater treatment specialists subsequently validated these options and narrowed the shortlist to the following three options:
1. Option 2, based on IFAS technology and bioP removal, 2. Option 3, based on a combined Activated Sludge / Biological Aerated Filters technology with bioP
removal and 3. Option 4, based on Biological Aerated Filters technology with partially bioP removal.
A preliminary construction and operation risk and opportunity matrix was prepared for each option based on the experience of the team as captured during the process selection workshop and evaluation of the options. Option Evaluation The three options were subjected to an evaluation process based on the following principles:
Definition of 21 comparison criteria in three technical categories (process, constructability and operation) and one financial category;
Weighting of the criteria by the Program’s Management Team;
Scoring of the three options by technical teams from the Program with respect to process, constructability and operation categories;
Validation of the financial assessment of the three options by an external cost estimator (Hanscomb);
Conversion of the financial assessment of each option to a financial score;
A summary of the technical and financial scoring is shown below together with the forecast whole life cost of each option.
Global scores %
Option 2 849 94% Option 3 812 89% Option 4 907 100%
OPTION 2 OPTION 3 OPTION 4
TOTAL CAPEX PROJECT VALUE uc 223,757,425.00 235,202,916.00 176,563,276.00
TOTAL OPEX PROJECT VALUE (average 2010 - 2031) uc 2,082,340.00 2,046,468.00 3,057,737.00
WHOLE LIFE COST
(Construction + 30 year operation NPV w ith 6% discount rate)uc 234,311,677.00 243,435,624.00 215,322,052.00
(CAPEX values include contingencies for construction change orders and OPEX includes the sludge hauling to NEWPCC)

WINNIPEG SEWAGE TREATMENT PROGRAM
SEWPCC PROCESS SELECTION REPORT – EXECUTIVE SUMMARY Page 16 of 193
PSR_rev final – July 2011
The following table highlights the main differences between the Option 2 and 4 which received the two best global scoring.
Category Description Comments Ranking Option 2
Ranking Option 4
Construction Construction duration The interference with the existing plant and the quantity of concrete makes the option 2 significantly more complex to build.
- +
Environmental Impact of Construction and Commissioning on wastewater treatment.
Reuse of existing plant facilities in option 2 would generate important disruption for the operation of the plant during construction and commissioning phase.
- +
Phosphorus recovery Only 60% of the phosphorus will be recoverable in option 4 as the chemically bounded phosphorus will not be recoverable. Option 4 allows for later implementation of process recovery system if required.
+ -
Process Hydraulic Profile and flood impact mitigation
The hydraulic profile can be adapted to flood level requirements as the solution includes an intermediate pumping station;
- +
Opportunity to build and operate with only Nitrification and a provision for de-nitrification later
Option 4 can allow for a future expansion with de-nitrification or the operational flexibility to run the plant without the de-nitrification. The Option 2 does not have that flexibility
- +
Sludge Production Sludge production is much higher for the Option 4 as a consequence of the use of chemicals
+ -
Sludge treatment costs are excluded from the project scope as this will be part of a separate citywide study to produce a bio-solids strategy. All options produce a treatable sludge as evaluated in the selection criteria. Nonetheless, sludge treatment costs are considered relevant costs in process selection for SEWPCC because the three options generate significantly different amounts of sludge. Practical options for sludge treatment with respect to SEWPCC were analysed, with the assumption that the unit cost of sludge treatment is similar for each option. The inclusion of sludge treatment costs into the scope of the option selection for SEWPCC will have the effect of reducing the gap between the whole life NPV calculations for the options but will not change the ranking as presented below. A1 - Pelletization GLOBAL SCORING A2 - Thermal oxidation GLOBAL SCORING
Option 2 859.31 Option 2 857.08
Option 4 913.05 Option 4 918.81
A3 - Composting GLOBAL SCORING A4 - Landfilling GLOBAL SCORING
Option 2 855.63 Option 2 857.21
Option 4 920.27 Option 4 910.81
A5 - Land application GLOBAL SCORING
Option 2 855.90
Option 4 909.13

WINNIPEG SEWAGE TREATMENT PROGRAM
SEWPCC PROCESS SELECTION REPORT – EXECUTIVE SUMMARY Page 17 of 193
PSR_rev final – July 2011
Of the three options, option 4 was first assessed as having the largest carbon footprint due to chemical requirements of the treatment process and sludge transport. It was subsequently acknowledged that the carbon footprint calculation had to take into account the emissions from secondary treatment. The process in option 2 mainly oxidises carbon in the secondaries with consequential CO2 release whilst option 4 mostly captures it in the primary sludge. Once combined with sludge treatment options involving cogeneration, option 4 results in a lower overall carbon footprint due to potential displacement of fossil fuel carbon sources. The real cost impact of the carbon footprint has been taken in to account in the financial evaluation, whereas the non-financial element of the environmental impact of emissions is not taken into account due to the zero weighting of the criteria. A sensitivity analysis on the evaluation criteria indicates that if it were included in the weighting it would not change the order of technical preference. In addition, some leads of improvement in respect to option 4’s carbon footprint have been identified. Among them the most important are i) the recourse to “green” coagulant in primary treatment, ii) the recourse to reused exogenous source of carbon for post denitrification and the potential for technical innovations which is expected to be more important for a recent technology like BAF than for activated sludges. Recommendations This report considers that process Option 4 (Biological Aeration Filter) represents the best technical and economic solution to meet the project objectives and recommends that Option 4 is approved to be taken forward for design and implementation.

INTRODUCTION

WINNIPEG SEWAGE TREATMENT PROGRAM
SEWPCC PROCESS SELECTION REPORT – INTRODUCTION Page 19 of 193
PSR_rev final – July 2011
The City of Winnipeg (COW) owns and operates the South End Water Pollution Control Centre (SEWPCC) which treats wastewater from the City’s south side. In March 2006, the Manitoba Conservation Centre (the Regulator), issued a new licence with respect to operation of SEWPCC. The requirements of the license impose new effluent limits on both nitrogen and phosphorus and should become effective on Dec. 31
st 2012.
To address the new license, the City hired a project team to conduct a study and prepare a Preliminary Design Report (PDR) and a Conceptual Design Report (CDR) with respect to Upgrade/Expansion of SEWPCC. This study was conducted by a consultancy consortium leaded by Stantec and took place between 2005 and 2009. In 2010, the City began implementing The Winnipeg Sewage Treatment Program (WSTP, the “Program”) The Program is a non-traditional infrastructure delivery model that focuses on extensive collaboration and shared risks and responsibilities for the improvement and operation of the City’s three wastewater treatment plants. The SEWPCC upgrade became part of the Program scope at this point, with the Program now comprising CoW and VW North America (Veolia Co). In order to take advantage of the significant amount of work completed over the last 5 years on the SEWPCC upgrading/expansion project, a specific methodology has been implemented by the Program. In addition to capitalizing on the existing work, this methodology is aligned to the development of the Program and will be further developed for the delivery of other capital projects the in the Program, (SEWPCC, NEWPCC, bio solids, etc …). The project methodology follows the following three main steps:
STEP 1: Process selection
STEP 2: Target cost estimation for the selected process option
STEP 3: Project delivery
This report concerns STEP 1 as applied to SEWPCC upgrade / expansion project.

PART I - PROCESS SELECTION METHODOLOGY

WINNIPEG SEWAGE TREATMENT PROGRAM
SEWPCC PROCESS SELECTION REPORT – PART I Page 21 of 193
PSR_rev final – July 2011
I. GENERAL At the start of any construction project, the first step is usually a brainstorm session to identify all technical options available to reach the project’s final goal. Following this, a comparison process is done to select the solution which fits the best to the project and the engineering process can then move forward with design and delivery of this preferred option. The Program has based its project methodology on this concept and named this step the “process selection step”.
II. THE DIFFERENT STAGES OF THE “PROCESS SELECTION STEP” Prior to involvement of the Program, a consultancy was engaged to identify, evaluate and recommend the possible process options available for the SEWPCC upgrading/expansion project, leading to the selection of two preferred solutions. The Program has built on this work by:
i) Reviewing the previous reports to update or upgrade the results to fit the new 2010 constraints; ii) Developing other solutions to insure a comprehensive process of selection from current
wastewater treatment technology and iii) Applying a project specific comparison procedure on the options in order to identify the best
solution In summary the different steps of the process selection are as follows:
STEP 1: Existing information collection and basic assumptions definition
STEP 2: Development of the Program’s own solutions
STEP 3: Comparison tool definition
STEP 4: Process option selection
II.1 EXISTING INFORMATION COLLECTION AND BASIC ASSUMPTIONS DEFINITION The first action by the Program was a detailed inventory of all the existing information about the SEWPCC project. The goal of which was not to create a data base of the existing information but to identify the information which can i) contribute to the basic assumptions which will define the basis of design (for example inlet characterization and outlet requirements) and/or ii) be directly applicable for the further development of the Project. The Projects’ inventory methodology has been adapted accordingly and focuses on the following sources of information:
� Stantec’s PDR and CDR,
� CoW operating records (raw data database, performance records, …),
� SEWPCC tours,
� CoW’s Water and Waste Department interviews,
� Regulator’s license and correspondence.
The basic assumptions definition is detailed in the Part II hereof and the process options retained from Stantec’s previous work are described in Part III. Best efforts have been made to ensure that the inventory of asset information has been as comprehensive as possible however process selection is constrained by the accuracy and completeness of this information.

WINNIPEG SEWAGE TREATMENT PROGRAM
SEWPCC PROCESS SELECTION REPORT – PART I Page 22 of 193
PSR_rev final – July 2011
Note: Information regarding the existing SEWPCC facility (mainly drawings) has been collected for the purpose of the asset conditions assessment which will take place later during the target cost estimation step.
II.2 DEVELOPMENT OF THE PROGRAM’S OWN SOLUTIONS Based on the inventory of available information for SEWPCC collated by the Program, the Program developed its own process options with the aim of identifying further solutions which could be of interest to the Project beyond those evaluated by the previous consultant. This step brings added value from the Program by integrating technology and worldwide expertise from the in house parties to the Program. The development of new process solutions is based on the following:
� Analysis of the project’s input and output constraints (sewage characteristics and treatment performance requirements).
� Upgrade / update / improvement of the existing process solutions
� In-house feed back / benchmark from similar projects in similar conditions
� Integration of in-house technologies
� Integration of new reliable technologies (technological follow-up)
The Program first identified four (4) solutions (stage 1 as described below), developing an additional more extensive pre-selection process (stage 2) to narrow the number of pre-selected options to three (3). This process improved efficiency and economy by reducing the number of options subject to a detailed process evaluation.
Stage 1: the process selection work done previously by Stantec, and validated by the CoW, has been an important part of the process selection step. Consequently two of the four pre-selected solutions are largely inspired by Stantec’s work (as documented in the CDR), with the remaining two options being new solutions developed by the Program.
Stage 2: the 4 pre-selected options were then reviewed by an Expert Advisory Panel (EAP) hired by the Program which took place during a review workshop, the aims to of which were to:
o Check and validate the design assumptions
o Pre-select the three (3) final best options from the four (4) previously selected and
o Propose final adjustments, if any, to these 3 finally pre-selected options
The guidelines for the review workshop are attached to the present report Appendix 1: Review workshop guideline, for information.
II.3 COMPARISON TOOL DEFINITION After the review workshop, the surviving three pre-selected process options were subjected to a technical and financial evaluation process. In order to complete an objective evaluation of the options the Program defined what “best for project” meant by defining evaluation criteria and scored each option regarding this definition. Prior to completing the scoring exercise, the criteria were weighted by the Program Management Team. The comparison process can be summarized as follows:
Step 1: identification of the comparison criteria
Step 2: weighting of the criteria
Step 3: scoring of the pre-selected options

WINNIPEG SEWAGE TREATMENT PROGRAM
SEWPCC PROCESS SELECTION REPORT – PART I Page 23 of 193
PSR_rev final – July 2011
Details of the comparison steps are described in Part IV of this report.
II.4 PROCESS OPTION SELECTION By completing the robust process selection and evaluation processes described, the Program was able to select a single preferred option on a “best for project basis”. Note: for the purpose of this report, and waiting for the Program to be formally implemented, the “best for project” term has been defined as implying the lowest Whole Life Cost and best technical evaluation. This option will be recommended to be taken forward for further development and implementation to allow the city to meet the new license requirements. The selection process has provided a robust audit trail for the selection and recommendation of the preferred process option for SEWPCC. Final decision on the preferred option shall be subject to the governance requirements of the Program which require submission of the preferred option by the Program Management Team to the Leadership Team for recommendation to the Director. It is noted that the Management Team are not bound to make the selection of the preferred option on the result of the scoring and weighting matrix alone and may take other business criteria into account.
III. SIGNIFICANT PENDING ISSUES The SEWPCC upgrade / expansion project is one component of the Winnipeg Sewage Treatment Program. Some of the issues which impact the Project are of a City wide nature that requires an integrated approach with other activities of the Program and the City. Such issues must be assessed to identify the extent to which they can impact the Project and assess if they could block progress of process selection for the Project. The Project has looked at the City wide issues and identified Sludge Management, Septage Management, and Leachate Management as being significant. These are discussed below.
III.1 THE SLUDGE ISSUE Currently, all the sludge produced in SEWPCC, WEWPCC and NEWPCC is treated at a centralised sludge centre at NEWPCC. The centralised sludge treatment process is shown below.
Anaerobic
dig ester 1
Sludge Hauling Tanks
Gaz collection system
Anaerobic
dig ester 2
Anaerobic
dig ester 3
Anaerobic
dig ester 5
Anaerobic
dig ester 4Anaerobic
dig ester 6

WINNIPEG SEWAGE TREATMENT PROGRAM
SEWPCC PROCESS SELECTION REPORT – PART I Page 24 of 193
PSR_rev final – July 2011
Note: Due to maintenance issues, sludge is currently being treated through five out the six existing digesters. The sludge treatment system at NEWPCC is the subject of a separate City wide project which will be developed as part of a review of sludge strategy for the City, the Biosolids Management Plan. The link between process selection for the Project and this plan is theoretically reciprocal; process selection for SEWPCC may impact the Biosolids Management Plan which may in turn impact process selection for SEWPCC. In practice, the reality of this reciprocity link resides in the significance of difference in sludge production between the pre-selected process options. The closer the quantity and quality of sludge production are between the options, the less significant the link will be. Consequently the issue of how sludge will be treated beyond SEWPCC will have to be assessed in the process selection in order to ascertain: i) if options for sludge treatment might change the results of the process selection process for SEWPCC and ii) if the process selection for SEWPCC might compromise any Biosolids Management options. These issues are addressed in this report under Part V, chapter IV. PROCESS OPTION SELECTION.
III.2 THE SEPTAGE AND LEACHATE ISSUES Change in the raw water characterization as a result of the receipt of Septage or Leachate at SEWPCC will impact on the design of treatment processes downstream their discharge point into the system. All options considered will be subject to the same enhanced design consequence due to septage and leachate with a similar relative increase in CAPEX and OPEX whatever the process technology implemented. The decision on whether to accept septage and / or leachate at SEWPCC will need to be considered before starting the detailed design but will not impact the selection of a preferred option.

PART II – PROJECT’S ASSUMPTIONS DEFINITION
WINNIPEG SEWAGE TREATMENT PROGRAM
SEWPCC PROCESS SELECTION REPORT – PART II Page 26 of 193
PSR_rev final – July 2011
The starting point of the process selection is definition of the basic assumptions. They are crucial to correctly developing the Program’s own process solutions and to analysing the validity of Stantec’s former options in regard to the new project’s context. As in any sewage treatment project, these assumptions deal with the quantity and quality of flows entering and leaving the plant:
Inlet assumption: sewage characterization
Outlet assumption: license requirements
WINNIPEG SEWAGE TREATMENT PROGRAM
SEWPCC PROCESS SELECTION REPORT – PART II Page 27 of 193
PSR_rev final – July 2011
I. SEWAGE CHARACTERIZATION -ooOoo-

WINNIPEG SEWAGE TREATMENT PROGRAM
SEWPCC PROCESS SELECTION REPORT – PART II Page 28 of 193
PSR_rev final – July 2011
On the basis of the data collected from Stantec’s work, the Program analyzed Stantec’s methodology and results in order to determine what needed to be updated or improved with regard to the inlet assumptions. The methodology used by the Program was as follows:
Step 1: gain an understanding of the previous characterization
Step 2: leads of improvement of the methodology (if any)
Step 3: take account and integrate new data available following the publishing of the Stantec report
The results of this procedure as applied to the inlet characterization of SEWPCC are presented here below.
I.1 BACKGROUND In preparing the PDR, Stantec evaluated historical flows and loads (1993 through 2005) to define baseline conditions prior to establishing future flows and loads. In 2009 Stantec followed up the PDR with the CDR. Flows and loads used in preparing mass balances in the CDR (Section 6.7) are noted as established in the PDR. Veolia’s first review of influent flows and loads in the CDR mass balance noted some discrepancies when compared to the projected design values in PDR, particularly with respect to suspended solids. In addition, historical data used to project future flows in the PDR dates back to 1993 when water demand as well as SEWPCC base flows were higher than those in later years of the data range (2002-2005) considered in the PDR (Figures 4.18 through 4.21). Further more, from discussions with the City, it is noted that influent sampling modifications at SEWPCC were fully implemented in July 2005. Historical data (1990’s through early 2000’s) used in the PDR and CDR were from influent samples collected from the grit basin influent channel following screening. The sampling location was then changed to a pump discharge header. Therefore for some years influent samples were only collected from one of the four influent pump discharge headers. When one of the other three pumps was operating, the influent was not sampled. By July 2005 installation of individual samplers on all four influent pump discharge headers was completed. Therefore, from discussion with the City it is confirmed that data collected before July 2005 and used by Stantec can not be considered as fully reliable. Thus, to confirm and project future flows and loads, the Program analyzed the most recent historical data (January 2005 through April 2010). Note: an initial analysis for Year 2005, with the first six months included, did not reveal a significant difference in the annual averages when compared to the averages without the first six months. Therefore, all 12 months in 2005 were included in this analysis.
I.2 BASE LINE CALCULATION I.2.1 EXISTING WASTEWATER FLOWS AND LOADS The analysis of the existing data from January 2005 through April 2010 conducted by the Program resulted in the annual SEWPCC influent characteristics summarized in Table 1below.
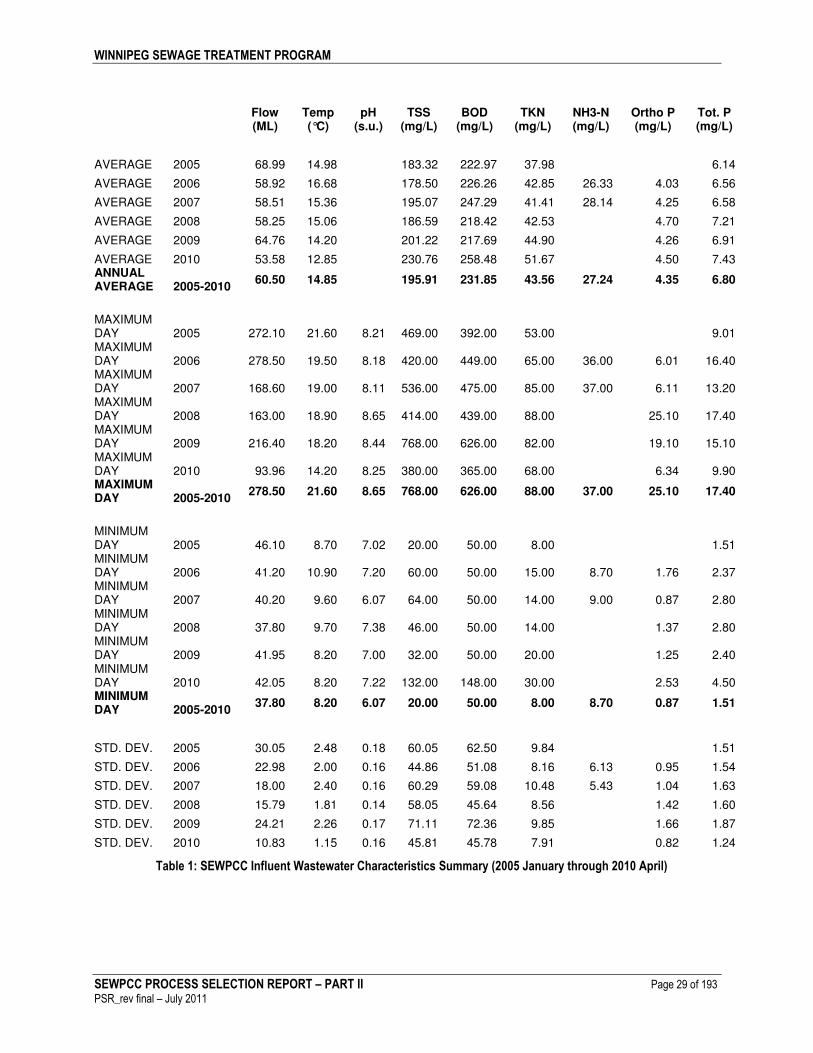
WINNIPEG SEWAGE TREATMENT PROGRAM
SEWPCC PROCESS SELECTION REPORT – PART II Page 29 of 193
PSR_rev final – July 2011
Flow (ML)
Temp (°C)
pH (s.u.)
TSS (mg/L)
BOD (mg/L)
TKN (mg/L)
NH3-N (mg/L)
Ortho P (mg/L)
Tot. P (mg/L)
AVERAGE 2005 68.99 14.98 183.32 222.97 37.98 6.14
AVERAGE 2006 58.92 16.68 178.50 226.26 42.85 26.33 4.03 6.56
AVERAGE 2007 58.51 15.36 195.07 247.29 41.41 28.14 4.25 6.58
AVERAGE 2008 58.25 15.06 186.59 218.42 42.53 4.70 7.21
AVERAGE 2009 64.76 14.20 201.22 217.69 44.90 4.26 6.91
AVERAGE 2010 53.58 12.85 230.76 258.48 51.67 4.50 7.43 ANNUAL AVERAGE 2005-2010
60.50 14.85 195.91 231.85 43.56 27.24 4.35 6.80
MAXIMUM DAY 2005 272.10 21.60 8.21 469.00 392.00 53.00 9.01 MAXIMUM DAY 2006 278.50 19.50 8.18 420.00 449.00 65.00 36.00 6.01 16.40 MAXIMUM DAY 2007 168.60 19.00 8.11 536.00 475.00 85.00 37.00 6.11 13.20 MAXIMUM DAY 2008 163.00 18.90 8.65 414.00 439.00 88.00 25.10 17.40 MAXIMUM DAY 2009 216.40 18.20 8.44 768.00 626.00 82.00 19.10 15.10 MAXIMUM DAY 2010 93.96 14.20 8.25 380.00 365.00 68.00 6.34 9.90 MAXIMUM DAY 2005-2010
278.50 21.60 8.65 768.00 626.00 88.00 37.00 25.10 17.40
MINIMUM DAY 2005 46.10 8.70 7.02 20.00 50.00 8.00 1.51 MINIMUM DAY 2006 41.20 10.90 7.20 60.00 50.00 15.00 8.70 1.76 2.37 MINIMUM DAY 2007 40.20 9.60 6.07 64.00 50.00 14.00 9.00 0.87 2.80 MINIMUM DAY 2008 37.80 9.70 7.38 46.00 50.00 14.00 1.37 2.80 MINIMUM DAY 2009 41.95 8.20 7.00 32.00 50.00 20.00 1.25 2.40 MINIMUM DAY 2010 42.05 8.20 7.22 132.00 148.00 30.00 2.53 4.50 MINIMUM DAY 2005-2010
37.80 8.20 6.07 20.00 50.00 8.00 8.70 0.87 1.51
STD. DEV. 2005 30.05 2.48 0.18 60.05 62.50 9.84 1.51
STD. DEV. 2006 22.98 2.00 0.16 44.86 51.08 8.16 6.13 0.95 1.54
STD. DEV. 2007 18.00 2.40 0.16 60.29 59.08 10.48 5.43 1.04 1.63
STD. DEV. 2008 15.79 1.81 0.14 58.05 45.64 8.56 1.42 1.60
STD. DEV. 2009 24.21 2.26 0.17 71.11 72.36 9.85 1.66 1.87
STD. DEV. 2010 10.83 1.15 0.16 45.81 45.78 7.91 0.82 1.24
Table 1: SEWPCC Influent Wastewater Characteristics Summary (2005 January through 2010 April)

WINNIPEG SEWAGE TREATMENT PROGRAM
SEWPCC PROCESS SELECTION REPORT – PART II Page 30 of 193
PSR_rev final – July 2011
Table 2 summarizes the mass loads during the same period. For each year, the annual average along with the maximum day value and the minimum day value are shown. Standard deviations for each parameter during the respective years are shown at the bottom of the tables. The overall average is the average of the annual averages while the overall maximum day and minimum day values noted are the maximum or minimum values during the period, i.e., they are not an average of the yearly maximum or minimum values.
TSS (Kgs/day)
BOD (Kgs/day)
TKN (Kgs/day)
NH3-N (Kgs/day)
Ortho P (Kgs/day)
Tot. P (Kgs/day)
AVERAGE 2005 11,209.28 13,103.06 2,228.93 361.23
AVERAGE 2006 10,303.12 12,556.21 2,410.32 1,494.51 231.14 367.08
AVERAGE 2007 11,092.91 13,736.66 2,294.89 1,551.86 236.53 366.33
AVERAGE 2008 10,704.88 12,251.94 2,379.29 265.11 405.54
AVERAGE 2009 12,717.07 12,933.90 2,730.48 252.15 415.43
AVERAGE 2010 12,274.13 13,572.21 2,720.78 236.15 390.74
ANNUAL AVERAGE 2005-2010 11,383.57 13,025.67 2,460.78 1,523.19 244.22 384.39
MAXIMUM DAY 2005 27,785.80 32,826.20 3,108.90 502.37
MAXIMUM DAY 2006 50,130.00 23,617.40 4,647.50 1,778.40 294.49 995.48
MAXIMUM DAY 2007 29,185.60 27,634.10 4,576.00 1,802.93 358.07 755.04
MAXIMUM DAY 2008 44,940.00 29,357.40 4,444.00 1,465.84 878.70
MAXIMUM DAY 2009 86,688.00 33,196.00 4,725.00 2,070.09 808.40
MAXIMUM DAY 2010 23,963.35 21,144.14 3,637.98 331.33 607.89
MAXIMUM DAY 2005-2010 86,688.00 33,196.00 4,725.00 1,802.93 2,070.09 995.48
MINIMUM DAY 2005 5,050.00 5,265.00 904.00 248.71
MINIMUM DAY 2006 3,686.40 3,085.00 859.20 1,185.60 166.50 177.75
MINIMUM DAY 2007 3,545.60 7,430.00 1,212.50 986.00 83.43 184.30
MINIMUM DAY 2008 2,779.20 4,470.00 1,486.80 77.95 223.02
MINIMUM DAY 2009 1,812.48 3,603.50 1,806.26 126.32 270.86
MINIMUM DAY 2010 7,393.94 8,080.20 2,136.16 195.21 306.89
MINIMUM DAY 2005-2010 1,812.48 3,085.00 859.20 986.00 77.95 177.75
STD. DEV. 2005 3,843.86 3,156.70 314.60 44.70
STD. DEV. 2006 4,257.19 2,124.99 402.15 135.09 26.00 71.39
STD. DEV. 2007 3,717.21 2,469.85 390.87 161.51 36.98 66.34
STD. DEV. 2008 4,248.88 2,301.34 325.30 89.28 77.79
STD. DEV. 2009 6,350.51 3,435.26 443.16 104.64 71.09
STD. DEV. 2010 2,913.21 1,767.59 240.69 26.53 43.73
Table 2: SEWPCC Influent Waste Loads Summary (2005 January through 2010 April)
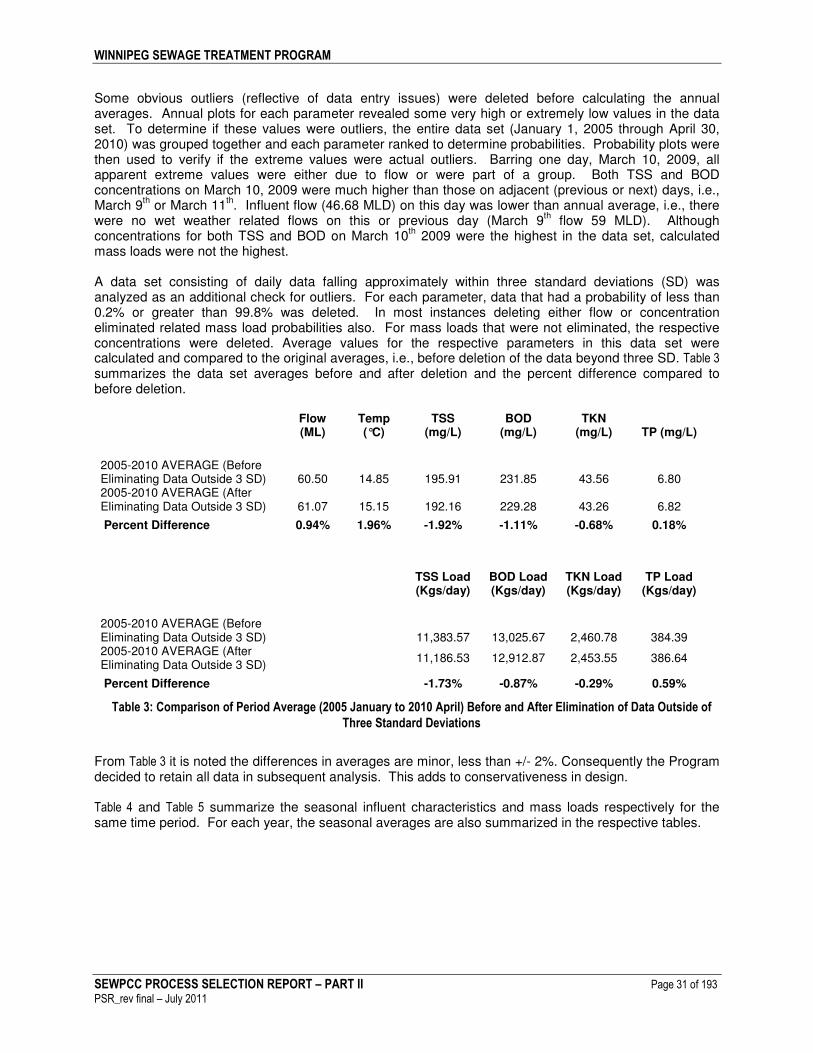
WINNIPEG SEWAGE TREATMENT PROGRAM
SEWPCC PROCESS SELECTION REPORT – PART II Page 31 of 193
PSR_rev final – July 2011
Some obvious outliers (reflective of data entry issues) were deleted before calculating the annual averages. Annual plots for each parameter revealed some very high or extremely low values in the data set. To determine if these values were outliers, the entire data set (January 1, 2005 through April 30, 2010) was grouped together and each parameter ranked to determine probabilities. Probability plots were then used to verify if the extreme values were actual outliers. Barring one day, March 10, 2009, all apparent extreme values were either due to flow or were part of a group. Both TSS and BOD concentrations on March 10, 2009 were much higher than those on adjacent (previous or next) days, i.e., March 9
th or March 11
th. Influent flow (46.68 MLD) on this day was lower than annual average, i.e., there
were no wet weather related flows on this or previous day (March 9th flow 59 MLD). Although
concentrations for both TSS and BOD on March 10th 2009 were the highest in the data set, calculated
mass loads were not the highest. A data set consisting of daily data falling approximately within three standard deviations (SD) was analyzed as an additional check for outliers. For each parameter, data that had a probability of less than 0.2% or greater than 99.8% was deleted. In most instances deleting either flow or concentration eliminated related mass load probabilities also. For mass loads that were not eliminated, the respective concentrations were deleted. Average values for the respective parameters in this data set were calculated and compared to the original averages, i.e., before deletion of the data beyond three SD. Table 3 summarizes the data set averages before and after deletion and the percent difference compared to before deletion.
Flow (ML)
Temp (°C)
TSS (mg/L)
BOD (mg/L)
TKN (mg/L) TP (mg/L)
2005-2010 AVERAGE (Before Eliminating Data Outside 3 SD) 60.50 14.85 195.91 231.85 43.56 6.80 2005-2010 AVERAGE (After Eliminating Data Outside 3 SD) 61.07 15.15 192.16 229.28 43.26 6.82
Percent Difference 0.94% 1.96% -1.92% -1.11% -0.68% 0.18%
TSS Load (Kgs/day)
BOD Load (Kgs/day)
TKN Load (Kgs/day)
TP Load (Kgs/day)
2005-2010 AVERAGE (Before Eliminating Data Outside 3 SD) 11,383.57 13,025.67 2,460.78 384.39 2005-2010 AVERAGE (After Eliminating Data Outside 3 SD)
11,186.53 12,912.87 2,453.55 386.64
Percent Difference -1.73% -0.87% -0.29% 0.59%
Table 3: Comparison of Period Average (2005 January to 2010 April) Before and After Elimination of Data Outside of
Three Standard Deviations
From Table 3 it is noted the differences in averages are minor, less than +/- 2%. Consequently the Program decided to retain all data in subsequent analysis. This adds to conservativeness in design. Table 4 and Table 5 summarize the seasonal influent characteristics and mass loads respectively for the same time period. For each year, the seasonal averages are also summarized in the respective tables.

WINNIPEG SEWAGE TREATMENT PROGRAM
SEWPCC PROCESS SELECTION REPORT – PART II Page 32 of 193
PSR_rev final – July 2011
Flow
(ML) Temp (°C)
TSS (mg/L)
BOD (mg/L)
TKN (mg/L)
NH3-N (mg/L)
Ortho P (mg/L)
Tot. P (mg/L)
AVERAGE 2005 FALL 56.15 16.44 204.52 241.00 40.51 6.72
AVERAGE 2006 FALL 52.62 17.63 177.04 244.92 45.19 29.00 4.33 7.03
AVERAGE 2007 FALL 52.94 17.62 196.54 256.11 40.59 4.73 6.35
AVERAGE 2008 FALL 62.28 16.83 167.10 204.80 38.64 4.67 6.71
AVERAGE 2009 FALL 55.32 16.93 201.32 238.04 49.20 4.56 7.36
AVERAGE 2010 FALL FALL AVERAGE
55.86 17.09 189.30 236.97 42.83 29.00 4.57 6.83
AVERAGE 2005 SPRING 77.36 13.27 214.18 207.67 35.00 5.43
AVERAGE 2006 SPRING 80.28 14.41 170.95 171.11 35.78 21.95 3.59 5.05
AVERAGE 2007 SPRING 68.06 12.73 188.04 225.71 38.64 26.31 3.84 6.13
AVERAGE 2008 SPRING 55.73 13.00 190.52 219.33 46.25 4.78 7.92
AVERAGE 2009 SPRING 81.25 11.41 213.88 187.21 42.05 3.60 6.27
AVERAGE 2010 SPRING 61.58 12.13 217.80 232.03 46.42 4.08 6.73 SPRING AVERAGE
70.71 12.83 199.23 207.18 40.69 24.13 3.98 6.26
AVERAGE 2005 SUMMER 91.65 16.98 145.81 171.29 28.42 4.66
AVERAGE 2006 SUMMER 55.02 17.77 176.18 217.80 41.60 25.77 3.96 6.65
AVERAGE 2007 SUMMER 65.88 16.97 172.14 214.73 36.13 3.60 5.83
AVERAGE 2008 SUMMER 66.95 16.19 188.60 202.63 38.21 4.16 6.44
AVERAGE 2009 SUMMER 74.10 15.32 180.76 187.80 37.49 3.65 5.69
AVERAGE 2010 SUMMER SUMMER AVERAGE
70.72 16.64 172.70 198.85 36.37 25.77 3.84 5.85
AVERAGE 2005 WINTER 50.45 13.18 183.37 254.82 44.87 6.99
AVERAGE 2006 WINTER 48.85 14.12 191.46 271.94 49.75 31.85 4.62 7.50
AVERAGE 2007 WINTER 46.72 13.83 223.89 293.07 50.36 31.39 5.00 8.02
AVERAGE 2008 WINTER 47.96 14.29 200.12 246.62 47.01 5.20 7.77
AVERAGE 2009 WINTER 47.72 13.95 208.21 258.99 51.18 5.25 8.34
AVERAGE 2010 WINTER 45.44 13.74 244.93 286.89 57.41 4.96 8.19 WINTER AVERAGE
47.86 13.85 208.66 268.72 50.09 31.62 5.00 7.80
Table 4: SEWPCC Seasonal Influent Wastewater characteristics Summary (2005 January through 2010 April)

WINNIPEG SEWAGE TREATMENT PROGRAM
SEWPCC PROCESS SELECTION REPORT – PART II Page 33 of 193
PSR_rev final – July 2011
TSS
(Kgs/day) BOD
(Kgs/day) TKN
(Kgs/day) NH3-N
(Kgs/day) Ortho P
(Kgs/day) Tot. P
(Kgs/day)
AVERAGE 2005 FALL 11,479.10 13,383.05 2,247.81 372.58
AVERAGE 2006 FALL 9,314.65 12,864.73 2,372.11 1,566.38 233.48 368.72
AVERAGE 2007 FALL 10,390.67 13,407.28 2,133.34 248.58 334.14
AVERAGE 2008 FALL 10,302.39 12,487.37 2,362.74 283.51 411.67
AVERAGE 2009 FALL 11,072.65 13,023.20 2,681.72 248.05 401.69
AVERAGE 2010 FALL FALL AVERAGE
10,511.89 13,033.12 2,359.54 1,566.38 253.40 377.76
AVERAGE 2005 SPRING 14,895.89 14,110.45 2,347.43 364.40
AVERAGE 2006 SPRING 12,804.21 12,393.93 2,643.73 1,495.64 244.85 370.67
AVERAGE 2007 SPRING 12,331.89 14,300.38 2,439.12 1,595.10 242.74 391.03
AVERAGE 2008 SPRING 10,550.97 12,089.02 2,539.52 263.21 436.33
AVERAGE 2009 SPRING 16,263.26 13,156.45 3,108.41 257.38 452.56
AVERAGE 2010 SPRING 13,318.67 14,062.64 2,823.19 245.92 407.63 SPRING AVERAGE
13,360.81 13,352.15 2,650.23 1,545.37 250.82 403.77
AVERAGE 2005 SUMMER 11,561.74 12,575.23 2,121.79 349.63
AVERAGE 2006 SUMMER 9,873.77 11,916.93 2,269.81 1,361.81 209.71 363.87
AVERAGE 2007 SUMMER 11,150.42 13,536.29 2,257.43 221.28 366.15
AVERAGE 2008 SUMMER 12,374.64 12,606.19 2,362.36 264.77 402.20
AVERAGE 2009 SUMMER 13,275.23 13,275.98 2,680.61 252.99 406.54
AVERAGE 2010 SUMMER SUMMER AVERAGE
11,647.16 12,782.12 2,338.40 1,361.81 237.19 377.68
AVERAGE 2005 WINTER 9,317.25 12,958.71 2,281.10 355.24
AVERAGE 2006 WINTER 9,377.81 13,275.51 2,423.57 1,558.96 226.90 365.33
AVERAGE 2007 WINTER 10,477.43 13,700.89 2,349.10 1,475.01 235.61 373.44
AVERAGE 2008 WINTER 9,591.54 11,830.48 2,252.55 248.96 372.62
AVERAGE 2009 WINTER 9,965.73 12,303.69 2,429.07 249.54 397.23
AVERAGE 2010 WINTER 11,152.22 13,054.53 2,610.78 225.46 372.60 WINTER AVERAGE
9,980.33 12,853.97 2,391.03 1,516.98 237.30 372.74
Table 5: SEWPCC Seasonal Influent Waste Loads Summary (2005 January through 2010 April)
Table 6 summarizes the respective month averages during the 2005 January through 2010 April Period. From the month averages it is noted that April is the wettest month of the year while February is the driest.

WINNIPEG SEWAGE TREATMENT PROGRAM
SEWPCC PROCESS SELECTION REPORT – PART II Page 34 of 193
PSR_rev final – July 2011
Flow
(ML) Temp (°C)
TSS (mg/L)
BOD (mg/L)
TKN (mg/L)
NH3-N (mg/L)
Ortho P (mg/L)
Tot. P (mg/L)
January 47.84 13.77 209.36 274.11 49.90 32.20 5.10 7.93
February 47.67 12.81 202.21 262.64 49.70 30.38 5.20 7.81
March 61.58 12.24 223.67 235.60 44.82 26.41 4.47 7.12
April 82.84 12.33 178.49 179.67 37.55 20.55 3.61 5.77
May 70.77 13.73 175.27 196.56 39.75 22.95 3.63 5.95
June 78.92 15.12 180.09 200.33 35.39 26.00 3.52 5.85
July 72.19 16.81 161.34 191.05 34.76 26.00 3.86 5.56
August 61.33 17.94 182.03 211.15 40.21 25.25 4.14 6.37
September 57.60 18.01 189.57 230.86 41.09 26.50 4.41 6.66
October 57.00 17.20 182.01 234.57 42.83 30.60 4.50 6.71
November 52.98 16.06 196.90 245.54 44.61 29.67 4.81 7.15
December 48.56 14.77 198.73 269.09 49.84 31.85 4.95 7.68
Table 6: Monthly Averages for 2005 January through 2010 April Period
Peaking factors based on overall averages with respect to each parameter are summarized in Table 7 while that with respect to mass loads are summarized in Table 8. Note: annual peaking factors are calculated with respect to the overall period average while the maximum day and minimum day peaking factors are calculated with respect to each year.

WINNIPEG SEWAGE TREATMENT PROGRAM
SEWPCC PROCESS SELECTION REPORT – PART II Page 35 of 193
PSR_rev final – July 2011
Flow (ML)
PF Flow
TSS (mg/L)
PF TSS
BOD (mg/L)
PF BOD
TKN (mg/L)
PF TKN
Tot. P (mg/L)
PF TP
AVERAGE 2005 68.99 1.14 183.32 0.94 222.97 0.96 37.98 0.87 6.14 0.90
AVERAGE 2006 58.92 0.97 178.50 0.91 226.26 0.98 42.85 0.98 6.56 0.96
AVERAGE 2007 58.51 0.97 195.07 1.00 247.29 1.07 41.41 0.95 6.58 0.97
AVERAGE 2008 58.25 0.96 186.59 0.95 218.42 0.94 42.53 0.98 7.21 1.06
AVERAGE 2009 64.76 1.07 201.22 1.03 217.69 0.94 44.90 1.03 6.91 1.02
AVERAGE 2010 53.58 0.89 230.76 1.18 258.48 1.11 51.67 1.19 7.43 1.09 ANNUAL AVERAGE
60.50 1.00 195.91 1.00 231.85 1.00 43.56 1.00 6.80 1.00
MAXIMUM DAY 2005 272.10 3.94 469.00 2.56 392.00 1.76 53.00 1.40 9.01 1.47 MAXIMUM DAY 2006 278.50 4.73 420.00 2.35 449.00 1.98 65.00 1.52 16.40 2.50 MAXIMUM DAY 2007 168.60 2.88 536.00 2.75 475.00 1.92 85.00 2.05 13.20 2.01 MAXIMUM DAY 2008 163.00 2.80 414.00 2.22 439.00 2.01 88.00 2.07 17.40 2.41 MAXIMUM DAY 2009 216.40 3.34 768.00 3.82 626.00 2.88 82.00 1.83 15.10 2.19 MAXIMUM DAY 2010 93.96 1.75 380.00 1.65 365.00 1.41 68.00 1.32 9.90 1.33 MAXIMUM DAY
278.50 4.73 768.00 3.82 626.00 2.88 88.00 2.07 17.40 2.50
MINIMUM DAY 2005 46.10 0.67 20.00 0.11 50.00 0.22 8.00 0.21 1.51 0.25 MINIMUM DAY 2006 41.20 0.70 60.00 0.34 50.00 0.22 15.00 0.35 2.37 0.36 MINIMUM DAY 2007 40.20 0.69 64.00 0.33 50.00 0.20 14.00 0.34 2.80 0.43 MINIMUM DAY 2008 37.80 0.65 46.00 0.25 50.00 0.23 14.00 0.33 2.80 0.39 MINIMUM DAY 2009 41.95 0.65 32.00 0.16 50.00 0.23 20.00 0.45 2.40 0.35 MINIMUM DAY 2010 42.05 0.78 132.00 0.57 148.00 0.57 30.00 0.58 4.50 0.61 MINIMUM DAY
37.80 0.65 20.00 0.11 50.00 0.20 8.00 0.21 1.51 0.25
Table 7: Parameter Peaking Factors

WINNIPEG SEWAGE TREATMENT PROGRAM
SEWPCC PROCESS SELECTION REPORT – PART II Page 36 of 193
PSR_rev final – July 2011
ANNUAL SUMMARY Flow (ML)
PF Flow
TSS (Kgs/day)
PF TSS
BOD (Kgs/day)
PF BOD
TKN (Kgs/day)
PF TKN
Tot. P (Kgs/day)
PF TP
AVERAGE 2005 68.99 1.14 11,209.28 0.98 13,103.06 1.01 2,228.93 0.91 361.23 0.94
AVERAGE 2006 58.92 0.97 10,303.12 0.91 12,556.21 0.96 2,410.32 0.98 367.08 0.95
AVERAGE 2007 58.51 0.97 11,092.91 0.97 13,736.66 1.05 2,294.89 0.93 366.33 0.95
AVERAGE 2008 58.25 0.96 10,704.88 0.94 12,251.94 0.94 2,379.29 0.97 405.54 1.06
AVERAGE 2009 64.76 1.07 12,717.07 1.12 12,933.90 0.99 2,730.48 1.11 415.43 1.08
AVERAGE 2010 53.58 0.89 12,274.13 1.08 13,572.21 1.04 2,720.78 1.11 390.74 1.02
ANNUAL AVERAGE 60.50 1.00 11,383.57 1.00 13,025.67 1.00 2,460.78 1.00 384.39 1.00
MAXIMUM DAY 2005 272.10 3.94 27,785.80 2.48 32,826.20 2.51 3,108.90 1.39 502.37 1.39 MAXIMUM DAY 2006 278.50 4.73 50,130.00 4.87 23,617.40 1.88 4,647.50 1.93 995.48 2.71 MAXIMUM DAY 2007 168.60 2.88 29,185.60 2.63 27,634.10 2.01 4,576.00 1.99 755.04 2.06 MAXIMUM DAY 2008 163.00 2.80 44,940.00 4.20 29,357.40 2.40 4,444.00 1.87 878.70 2.17 MAXIMUM DAY 2009 216.40 3.34 86,688.00 6.82 33,196.00 2.57 4,725.00 1.73 808.40 1.95 MAXIMUM DAY 2010 93.96 1.75 23,963.35 1.95 21,144.14 1.56 3,637.98 1.34 607.89 1.56
MAXIMUM DAY 278.50 4.73 86,688.00 6.82 33,196.00 2.57 4,725.00 1.99 995.48 2.71
MINIMUM DAY 2005 46.10 0.67 5,050.00 0.45 5,265.00 0.40 904.00 0.41 248.71 0.69 MINIMUM DAY 2006 41.20 0.70 3,686.40 0.36 3,085.00 0.25 859.20 0.36 177.75 0.48 MINIMUM DAY 2007 40.20 0.69 3,545.60 0.32 7,430.00 0.54 1,212.50 0.53 184.30 0.50 MINIMUM DAY 2008 37.80 0.65 2,779.20 0.26 4,470.00 0.36 1,486.80 0.62 223.02 0.55 MINIMUM DAY 2009 41.95 0.65 1,812.48 0.14 3,603.50 0.28 1,806.26 0.66 270.86 0.65 MINIMUM DAY 2010 42.05 0.78 7,393.94 0.60 8,080.20 0.60 2,136.16 0.79 306.89 0.79
MINIMUM DAY 37.80 0.65 1,812.48 0.14 3,085.00 0.25 859.20 0.36 177.75 0.48
Table 8: Mass Load Peaking Factors
Seasonal flow and mass load peaking factors were computed for the various parameters based on the overall average. These are shown in Table 9.

WINNIPEG SEWAGE TREATMENT PROGRAM
SEWPCC PROCESS SELECTION REPORT – PART II Page 37 of 193
PSR_rev final – July 2011
FLOW LOAD
MAX MIN TSS BOD TKN TP
MLD MLD Kg/d Kg/d Kg/d Kg/d
WINTER
Average 0.79 0.79 0.88 0.99 0.97 0.97
Max month 0.80 0.79 0.88 1.00 0.98 0.98
Max week 0.92 0.72 1.85 1.58 1.19 1.28
Max day 1.30 0.66 2.34 1.75 1.64 2.04
SPRING
Average 1.17 1.17 1.17 1.03 1.08 1.05
Max month 1.37 1.02 1.19 1.04 1.12 1.08
Max week 2.80 0.76 2.26 1.67 1.54 1.77
Max day 4.60 0.75 7.61 2.55 1.92 2.29
SUMMER
Average 1.17 1.17 1.02 0.98 0.95 0.98
Max month 1.30 1.01 1.41 1.06 0.99 1.05
Max week 2.78 0.72 2.44 1.52 1.24 1.28
Max day 4.50 0.62 3.95 2.52 1.86 2.59
FALL
Average 0.92 0.92 0.92 1.00 0.96 0.98
Max month 0.95 0.88 0.96 1.01 0.97 0.99
Max week 1.28 0.77 1.28 1.19 1.36 1.34
Max day 1.80 0.72 2.41 1.68 1.68 1.93
ANNUAL
Average 1.00 1.00 1.00 1.00 1.00 1.00
Table 9: Seasonal Flow and Mass Load Peaking Factors
I.2.2 EXISTING PER CAPITA FLOWS AND LOADS It is normal practice to use per capita flows and loads for projecting contributions from population growth. For an existing community historic per capita flows and loads serve as a base line and are useful in projecting future flows and loads. It is useful to compare historic values to bench marks which can identify the need for adjustments. These adjustments may be positive due to extraneous flows / loads (groundwater infiltration, rainfall-derived inflow/infiltration, etc.), commercial and / or industrial contributions or negative due to positive steps taken by the City or Community to reduce flows and loads. Table 10 hereafter summarizes the annual and seasonal per capita flows and loads for the SEWPCC service area.
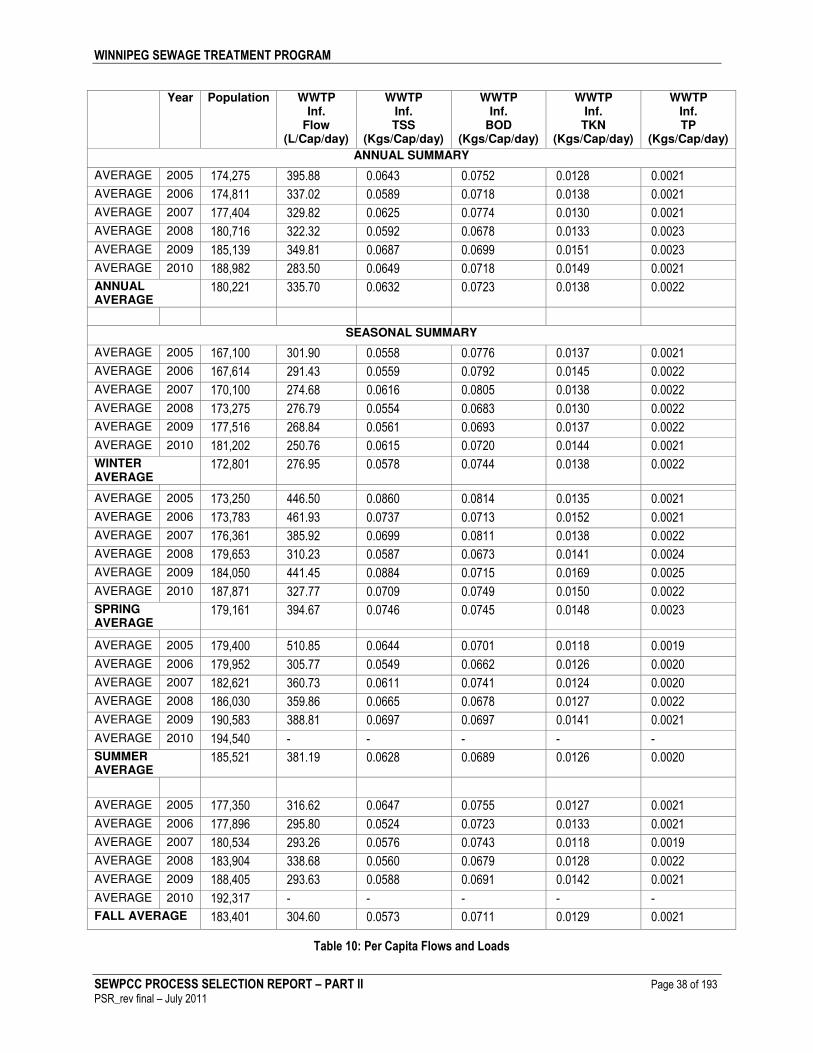
WINNIPEG SEWAGE TREATMENT PROGRAM
SEWPCC PROCESS SELECTION REPORT – PART II Page 38 of 193
PSR_rev final – July 2011
Year Population WWTP
Inf. Flow
(L/Cap/day)
WWTP Inf. TSS
(Kgs/Cap/day)
WWTP Inf.
BOD (Kgs/Cap/day)
WWTP Inf.
TKN (Kgs/Cap/day)
WWTP Inf. TP
(Kgs/Cap/day)
ANNUAL SUMMARY
AVERAGE 2005 174,275 395.88 0.0643 0.0752 0.0128 0.0021
AVERAGE 2006 174,811 337.02 0.0589 0.0718 0.0138 0.0021
AVERAGE 2007 177,404 329.82 0.0625 0.0774 0.0130 0.0021
AVERAGE 2008 180,716 322.32 0.0592 0.0678 0.0133 0.0023
AVERAGE 2009 185,139 349.81 0.0687 0.0699 0.0151 0.0023
AVERAGE 2010 188,982 283.50 0.0649 0.0718 0.0149 0.0021
ANNUAL AVERAGE
180,221 335.70 0.0632 0.0723 0.0138 0.0022
SEASONAL SUMMARY
AVERAGE 2005 167,100 301.90 0.0558 0.0776 0.0137 0.0021
AVERAGE 2006 167,614 291.43 0.0559 0.0792 0.0145 0.0022
AVERAGE 2007 170,100 274.68 0.0616 0.0805 0.0138 0.0022
AVERAGE 2008 173,275 276.79 0.0554 0.0683 0.0130 0.0022
AVERAGE 2009 177,516 268.84 0.0561 0.0693 0.0137 0.0022
AVERAGE 2010 181,202 250.76 0.0615 0.0720 0.0144 0.0021
WINTER AVERAGE
172,801 276.95 0.0578 0.0744 0.0138 0.0022
AVERAGE 2005 173,250 446.50 0.0860 0.0814 0.0135 0.0021
AVERAGE 2006 173,783 461.93 0.0737 0.0713 0.0152 0.0021
AVERAGE 2007 176,361 385.92 0.0699 0.0811 0.0138 0.0022
AVERAGE 2008 179,653 310.23 0.0587 0.0673 0.0141 0.0024
AVERAGE 2009 184,050 441.45 0.0884 0.0715 0.0169 0.0025
AVERAGE 2010 187,871 327.77 0.0709 0.0749 0.0150 0.0022
SPRING AVERAGE
179,161 394.67 0.0746 0.0745 0.0148 0.0023
AVERAGE 2005 179,400 510.85 0.0644 0.0701 0.0118 0.0019
AVERAGE 2006 179,952 305.77 0.0549 0.0662 0.0126 0.0020
AVERAGE 2007 182,621 360.73 0.0611 0.0741 0.0124 0.0020
AVERAGE 2008 186,030 359.86 0.0665 0.0678 0.0127 0.0022
AVERAGE 2009 190,583 388.81 0.0697 0.0697 0.0141 0.0021
AVERAGE 2010 194,540 - - - - -
SUMMER AVERAGE
185,521 381.19 0.0628 0.0689 0.0126 0.0020
AVERAGE 2005 177,350 316.62 0.0647 0.0755 0.0127 0.0021
AVERAGE 2006 177,896 295.80 0.0524 0.0723 0.0133 0.0021
AVERAGE 2007 180,534 293.26 0.0576 0.0743 0.0118 0.0019
AVERAGE 2008 183,904 338.68 0.0560 0.0679 0.0128 0.0022
AVERAGE 2009 188,405 293.63 0.0588 0.0691 0.0142 0.0021
AVERAGE 2010 192,317 - - - - -
FALL AVERAGE 183,401 304.60 0.0573 0.0711 0.0129 0.0021
Table 10: Per Capita Flows and Loads
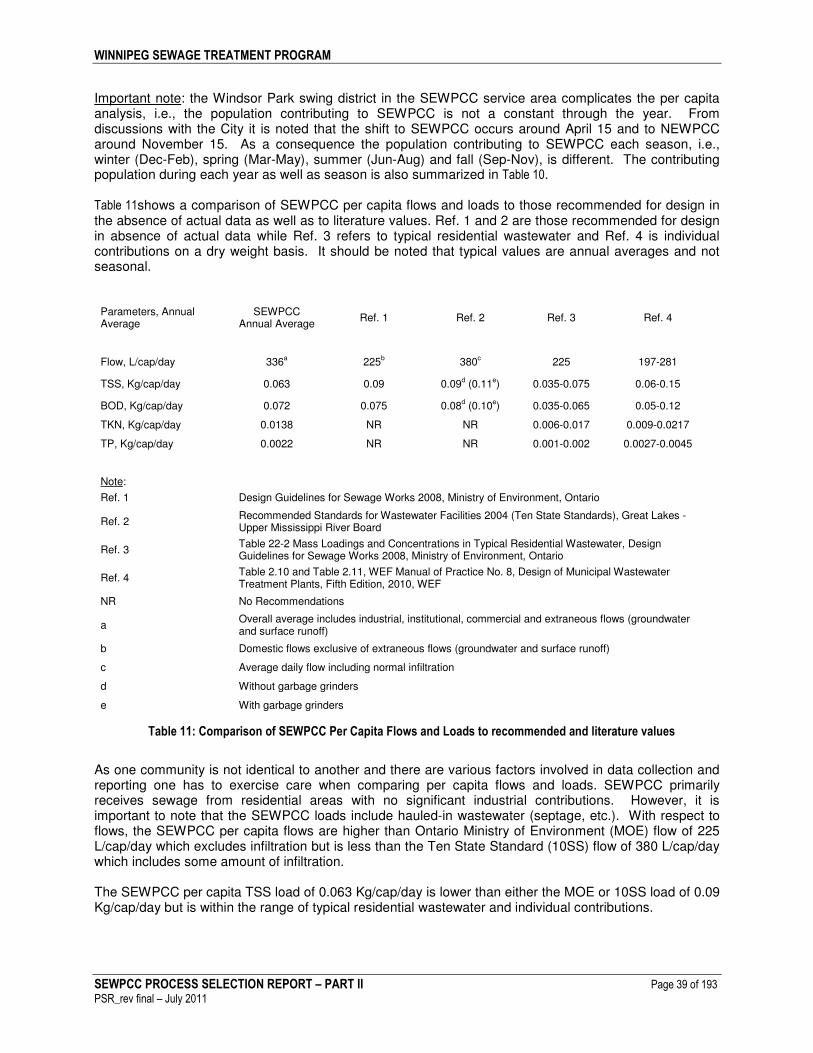
WINNIPEG SEWAGE TREATMENT PROGRAM
SEWPCC PROCESS SELECTION REPORT – PART II Page 39 of 193
PSR_rev final – July 2011
Important note: the Windsor Park swing district in the SEWPCC service area complicates the per capita analysis, i.e., the population contributing to SEWPCC is not a constant through the year. From discussions with the City it is noted that the shift to SEWPCC occurs around April 15 and to NEWPCC around November 15. As a consequence the population contributing to SEWPCC each season, i.e., winter (Dec-Feb), spring (Mar-May), summer (Jun-Aug) and fall (Sep-Nov), is different. The contributing population during each year as well as season is also summarized in Table 10. Table 11shows a comparison of SEWPCC per capita flows and loads to those recommended for design in the absence of actual data as well as to literature values. Ref. 1 and 2 are those recommended for design in absence of actual data while Ref. 3 refers to typical residential wastewater and Ref. 4 is individual contributions on a dry weight basis. It should be noted that typical values are annual averages and not seasonal.
Parameters, Annual Average
SEWPCC Annual Average
Ref. 1 Ref. 2 Ref. 3 Ref. 4
Flow, L/cap/day 336a 225b 380c 225 197-281
TSS, Kg/cap/day 0.063 0.09 0.09d (0.11e) 0.035-0.075 0.06-0.15
BOD, Kg/cap/day 0.072 0.075 0.08d (0.10e) 0.035-0.065 0.05-0.12
TKN, Kg/cap/day 0.0138 NR NR 0.006-0.017 0.009-0.0217
TP, Kg/cap/day 0.0022 NR NR 0.001-0.002 0.0027-0.0045
Note:
Ref. 1 Design Guidelines for Sewage Works 2008, Ministry of Environment, Ontario
Ref. 2 Recommended Standards for Wastewater Facilities 2004 (Ten State Standards), Great Lakes - Upper Mississippi River Board
Ref. 3 Table 22-2 Mass Loadings and Concentrations in Typical Residential Wastewater, Design Guidelines for Sewage Works 2008, Ministry of Environment, Ontario
Ref. 4 Table 2.10 and Table 2.11, WEF Manual of Practice No. 8, Design of Municipal Wastewater Treatment Plants, Fifth Edition, 2010, WEF
NR No Recommendations
a Overall average includes industrial, institutional, commercial and extraneous flows (groundwater and surface runoff)
b Domestic flows exclusive of extraneous flows (groundwater and surface runoff)
c Average daily flow including normal infiltration
d Without garbage grinders
e With garbage grinders
Table 11: Comparison of SEWPCC Per Capita Flows and Loads to recommended and literature values
As one community is not identical to another and there are various factors involved in data collection and reporting one has to exercise care when comparing per capita flows and loads. SEWPCC primarily receives sewage from residential areas with no significant industrial contributions. However, it is important to note that the SEWPCC loads include hauled-in wastewater (septage, etc.). With respect to flows, the SEWPCC per capita flows are higher than Ontario Ministry of Environment (MOE) flow of 225 L/cap/day which excludes infiltration but is less than the Ten State Standard (10SS) flow of 380 L/cap/day which includes some amount of infiltration. The SEWPCC per capita TSS load of 0.063 Kg/cap/day is lower than either the MOE or 10SS load of 0.09 Kg/cap/day but is within the range of typical residential wastewater and individual contributions.
WINNIPEG SEWAGE TREATMENT PROGRAM
SEWPCC PROCESS SELECTION REPORT – PART II Page 40 of 193
PSR_rev final – July 2011
The SEWPCC per capita BOD load of 0.072 Kg/cap/day is close to the MOE load of 0.075 Kg/cap/day as well as the 10SS load of 0.077 Kg/cap/day. It is higher than the residential wastewater range but is within the range of individual contributions. With respect to TKN or TP, there are no design guidelines for comparison. The SEWPCC TKN per capita load of 0.0138 Kg/cap/day and the TP per capita load of 0.0022 Kg/cap/day are within the range of typical residential wastewater and individual contributions.
I.3 2031 FLOWS AND LOADS PROJECTIONS
I.3.1 POPULATION PROJECTION Projecting future flows and loads requires knowledge of the contributing population. In preparation of the PDR, one of the first steps by Stantec was to arrive at the 2031 population for the SEWPCC service area. The base line 2005 population for the SEWPCC service area was 179,400. Following historic population growth analysis and other assumptions with respect to migration rate and population distribution between service areas, Stantec arrived at a 2031 population of 229,800 for the SEWPCC service area. This represents an increase of 50’400 persons. A census survey is conducted in Canada once every 5 years, the latest of which was in 2006. With new survey data available, it was prudent to compare population forecasts in the PDR to actual. From the 2006 Census Survey it is noted that the CoW population was 633,451. Comparing this to the CoW Population Forecast in Table C2 (Appendix C of PDR), one of the references used by Stantec in population projection, it is noted that the CoW 2006 forecast population of 656,187 is high compared to actual census numbers. From discussions with City personnel it is noted that the census undercounts population. Comparing the 2006 forecast population in the PDR to the April 6, 2010 estimated population by CoW - Office of the CFO, (see attachment) which includes about 20,000 persons to account for the census undercount, it is noted that the 2006 forecast of 656,187 in the PDR is slightly higher than the estimated population of 653,500. But the CoW – Office of the CFO population projections for future years increases at a faster rate than that in the PDR. Following discussions with the City, the 2031 SEWPCC population is assumed to be 250,000.
I.3.2 FLOWS AND LOADS PROJECTION Projected 2031 flows and loads are summarized in Table 12. In projecting future flows and loads, per capita flows and loads from existing SEWPCC population were assumed to remain consistent through the design period, i.e., the current population would not significantly change their habits over the years. This is different from the assumptions in the PDR. In the PDR flows were assumed to decrease by about 2% due to water conservation efforts such as renovation to low flow toilets, low water use washers, etc. by the community. Even with this decrease due to the 2% Renovation Factor, the projected 2031 per capita flow of 298 L/cap/day assumed in the PDR was almost the same as the average per capita flow of 297 L/cap/day over the last four years (2002-2005) of the time period in the PDR.
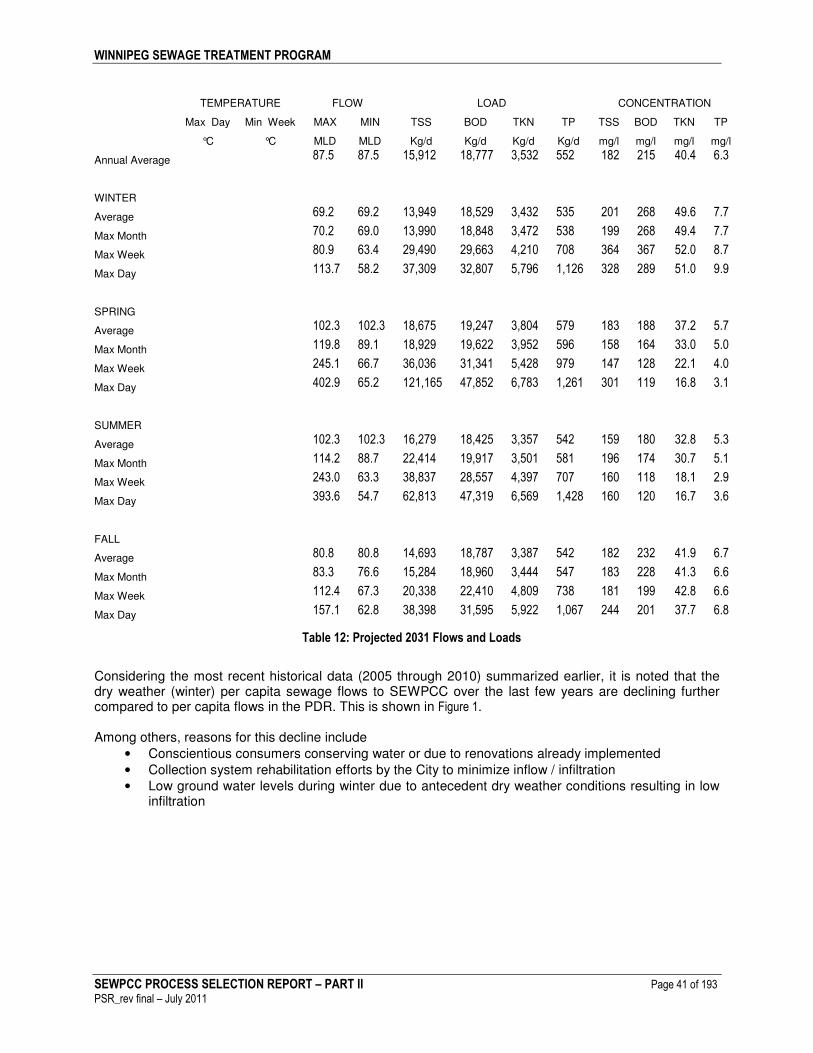
WINNIPEG SEWAGE TREATMENT PROGRAM
SEWPCC PROCESS SELECTION REPORT – PART II Page 41 of 193
PSR_rev final – July 2011
TEMPERATURE FLOW LOAD CONCENTRATION
Max Day Min Week MAX MIN TSS BOD TKN TP TSS BOD TKN TP
°C °C MLD MLD Kg/d Kg/d Kg/d Kg/d mg/l mg/l mg/l mg/l
Annual Average 87.5 87.5 15,912 18,777 3,532 552 182 215 40.4 6.3
WINTER
Average 69.2 69.2 13,949 18,529 3,432 535 201 268 49.6 7.7
Max Month 70.2 69.0 13,990 18,848 3,472 538 199 268 49.4 7.7
Max Week 80.9 63.4 29,490 29,663 4,210 708 364 367 52.0 8.7
Max Day 113.7 58.2 37,309 32,807 5,796 1,126 328 289 51.0 9.9
SPRING
Average 102.3 102.3 18,675 19,247 3,804 579 183 188 37.2 5.7
Max Month 119.8 89.1 18,929 19,622 3,952 596 158 164 33.0 5.0
Max Week 245.1 66.7 36,036 31,341 5,428 979 147 128 22.1 4.0
Max Day 402.9 65.2 121,165 47,852 6,783 1,261 301 119 16.8 3.1
SUMMER
Average 102.3 102.3 16,279 18,425 3,357 542 159 180 32.8 5.3
Max Month 114.2 88.7 22,414 19,917 3,501 581 196 174 30.7 5.1
Max Week 243.0 63.3 38,837 28,557 4,397 707 160 118 18.1 2.9
Max Day 393.6 54.7 62,813 47,319 6,569 1,428 160 120 16.7 3.6
FALL
Average 80.8 80.8 14,693 18,787 3,387 542 182 232 41.9 6.7
Max Month 83.3 76.6 15,284 18,960 3,444 547 183 228 41.3 6.6
Max Week 112.4 67.3 20,338 22,410 4,809 738 181 199 42.8 6.6
Max Day 157.1 62.8 38,398 31,595 5,922 1,067 244 201 37.7 6.8
Table 12: Projected 2031 Flows and Loads
Considering the most recent historical data (2005 through 2010) summarized earlier, it is noted that the dry weather (winter) per capita sewage flows to SEWPCC over the last few years are declining further compared to per capita flows in the PDR. This is shown in Figure 1. Among others, reasons for this decline include
• Conscientious consumers conserving water or due to renovations already implemented • Collection system rehabilitation efforts by the City to minimize inflow / infiltration • Low ground water levels during winter due to antecedent dry weather conditions resulting in low
infiltration

WINNIPEG SEWAGE TREATMENT PROGRAM
SEWPCC PROCESS SELECTION REPORT – PART II Page 42 of 193
PSR_rev final – July 2011
Figure 1 - Historical Per Capita Dry Weather Flows
-
50
100
150
200
250
300
350
1998 1999 2000 2001 2002 2003 2004 2005 2006 2007 2008 2009 2010
Year
SE
WP
CC
WW
In
flu
en
t (L
/ca
p/d
ay)
PDR Per Capita Flow Per Capita Flow - Current Analysis
Figure 1: Historical per capita dry weather flows
Since the per capita flows were already in a declining trend over the last decade, the Program decided to use the average per capita flows from the current analysis to project future flows from the existing population without any adjustment for renovation etc. The per capita loads assumed by Stantec in load projections were based on the Ontario MOE values as there were questions regarding the accuracy of the historical data (as discussed earlier). Additional data analysis completed as part of the Project indicates that the per capita loads computed for latter years in the PDR analysis were reflective of Winnipeg. Therefore in current projections, it is assumed that there will be no change in per capita loads from existing population. In projecting flows and loads from new population it is customary to use existing per capita flows and loads when available in projections. In fact this is the recommendation in the Ontario MOE Guidelines as well as the Ten State Standards when actual data are available. When actual data are not available, the recommendation is to use data from similar communities or typical values in projections. As SEWPCC per capita flows and loads were available, the Program decided to use the historical per capita flows and loads for the new population.
I.4 CONCLUSION Significant differences were noticed when the projected 2031 flows and loads from this analysis were compared to those proposed by Stantec. Percent differences compared to the PDR recommended loads are summarized in Table 13. The current comparison is with respect to the PDR as its recommendations had supporting documentation while the CDR recommendations did not. During clarification meetings in July 2010, Stantec reiterated that there were no changes in assumptions between PDR and CDR and

WINNIPEG SEWAGE TREATMENT PROGRAM
SEWPCC PROCESS SELECTION REPORT – PART II Page 43 of 193
PSR_rev final – July 2011
therefore there should be no differences in the PDR and CDR recommended flows and loads. However, a summary table provided by Stantec with respect to CDR flows and loads did show some differences compared to PDR recommendations. Therefore, a comparison to CDR flows and loads was not done. It is important that the Max Day flow in the PDR was restricted to 300 MLD, the firm capacity of the existing influent pumps. Therefore the comparison in Table 13 is with respect to this restricted flow for Max Day Spring and Max Day summer conditions. Negative numbers in the table indicate that the current projections are lower that in the PDR while positive numbers indicate that the current projections are higher. Most of these differences can be explained by the difference in methodology used by Stantec and the Program:
• As the data set used by Stantec was unreliable, Stantec use the MOE Guidelines in arriving at projected flows and loads. The guideline per capita loads were applied over the entire 2031 population. On the other hand, the Program had the benefit of the most recent data set which the City believes to be more meaningful. A simple solids mass balance by the Program across the primary clarifiers using sludge hauled out to NEWPCC confirmed that the influent TSS concentrations were close to analytical results rather than to those calculated using MOE values. The Program utilized the actual per capita loads to project future flows and loads from existing population and for the new population.
• Stantec utilized 92 percentile and 98 percentile values to arrive at Max Month and Max Day loads for determining the peaking factors. The Program utilized actual values, not available to Stantec, over the 5 year period to arrive at the Max Day and Max Month values to compute actual peaking factors.

WINNIPEG SEWAGE TREATMENT PROGRAM
SEWPCC PROCESS SELECTION REPORT – PART II Page 44 of 193
PSR_rev final – July 2011
FLOW LOAD
MAX MIN TSS BOD TKN TP
% Difference % Difference % Difference % Difference % Difference % Difference
Annual Average -3.2% -3.2% -27.1% 8.9% 13.9% 0.1%
WINTER
Average 1.2% 1.2% -22.1% 19.5% 8.5% -4.2%
Max Month 0.6% 10.9% -50.7% -10.0% -6.7% -20.0%
Max Week 9.5% 5.4% -15.6% 12.8% -2.4% -9.0%
Max Day 43.4% 5.0% -18.6% -6.7% 26.2% 27.5%
SPRING
Average 15.1% 15.1% -28.7% -1.2% 16.8% -2.8%
Max Month 8.0% 28.9% -57.3% -35.3% -3.5% -26.5%
Max Week 71.4% 10.8% -35.8% -17.0% 15.1% -1.0%
Max Day 33.9% 30.7% 39.3% -16.1% 20.3% -14.0%
SUMMER
Average 15.1% 15.1% -32.8% 5.8% 15.1% 10.4%
Max Month -13.5% 29.7% -40.3% -18.0% 0.8% -7.0%
Max Week 36.5% -0.5% -31.8% -30.1% 9.0% -5.9%
Max Day 0.0% -1.3% -42.9% -25.4% 9.9% 27.8%
FALL
Average 18.1% 18.1% -22.6% 13.5% 10.3% -2.9%
Max Month 19.4% 23.2% -50.0% -15.4% -5.1% -22.7%
Max Week 52.1% 11.9% -43.5% -10.9% 27.1% -14.9%
Max Day 98.1% 13.3% -1.7% 22.2% 55.2% 15.1%
Table 13: Difference between Program’s recommendation and PDR for projected flows and loads
Inlet characterization based on the following: � Actual population in SEWPCC area: 194,152 inhabitants � 2031 population in SEWPCC area: 250,000 inhabitants � F2031 (Flows 2031) = Pop2010 x PcF2005-2010 + (Pop2031-Pop2010) x PcF2005-2010 � L2031 (Loads 2031) = Pop2010 x PcL2005-2010 + (Pop2031-Pop2010) x PcL2005-2010 , where PcL2005-2010 and PcF2005-2010 are the values calculated from the existing record data base at the entrance of SEWPCC from 2005 to 2010. This inlet characterization includes the current septage and excludes the leachate.

WINNIPEG SEWAGE TREATMENT PROGRAM
SEWPCC PROCESS SELECTION REPORT – PART II Page 45 of 193
PSR_rev final – July 2011
II. OUTLET REQUIREMENTS -ooOoo-

WINNIPEG SEWAGE TREATMENT PROGRAM
SEWPCC PROCESS SELECTION REPORT – PART II Page 46 of 193
PSR_rev final – July 2011
After defining the inlet conditions, the next step is to define the outlet requirements of the plant. Effluent requirements are set by the Manitoba Conservation, also called the Regulator, in the license it issues for every treatment plant. A new license for SEWPCC was issued in March 2006 which requires more stringent treatment on both nitrogen and phosphorus. The license is deemed to come into force in December 31
st 2012.
II.1 LICENSE REQUIREMENTS The new license requirements are as shown in the table below.
TSS on effluent never to exceed 30 mg/l 24 h effluent composite sample
CBOD5 on effluent never to exceed 25 mg/l 24 h effluent composite sample
TN on effluent 30-day rolling average <15 mg/l 24 h effluent composite sampleTP on effluent 30-day rolling average <1 mg/l 24 h effluent composite sample
E-coli on effluent 30-day geometric mean <200 MPN/100 mL
Grab sample collected at equal
time intervalle on each of a
minimum of 3 consecutive days
per week
Fecal coliform on effluent 30-day geometric mean <200 MPN/100 mL
Grab sample collected at equal
time intervalle on each of a
minimum of 3 consecutive days
per week
Ammonia Nitrogen on effluent never to exceed 1975 (january) kg N/day 24 h effluent composite sample
on effluent never to exceed 2403 (February) kg N/day 24 h effluent composite sample
on effluent never to exceed 4196 (March) kg N/day 24 h effluent composite sample
on effluent never to exceed 12926 (April) kg N/day 24 h effluent composite sample
on effluent never to exceed 5311 (May) kg N/day 24 h effluent composite sample
on effluent never to exceed 3103 (June) kg N/day 24 h effluent composite sample
on effluent never to exceed 1517 (July) kg N/day 24 h effluent composite sample
on effluent never to exceed 607 (August) kg N/day 24 h effluent composite sample
on effluent never to exceed 703 (September) kg N/day 24 h effluent composite sample
on effluent never to exceed 811 (October) kg N/day 24 h effluent composite sample
on effluent never to exceed 1152 (November) kg N/day 24 h effluent composite sample
on effluent never to exceed 1550 (December) kg N/day 24 h effluent composite sampleLethal to fish on mixing zone never to exceed 50 % mortality fish 96- h static acute lethality test
LICENSE
Table 14: new license requirements
Designing the Project to achieve a strict compliance with the proposed license conditions (specifically never to exceed for CBOD5 and TSS) would result in over sizing the plant for normal operating conditions. This over sizing would incur a significantly capital and operating cost penalty for limited environmental benefit and create difficult operating conditions under normal operation. The City has initiated a discussion on this issue (Aug 17
th 2010) with the Regulator who has indicated that
monthly averages on the CBOD5 and TSS would be accepted. Meanwhile, with the support of the City Council (Minute No. 198 – Report – Standing Policy Committee on Infrastructure Renewal and Public Works – February 14, 2011), the process selection has been made on the Program’s best assessment of how to meet the license, specifically the never to exceed constraints is replaced by a 30 day rolling average for CBOD5 and TSS:

WINNIPEG SEWAGE TREATMENT PROGRAM
SEWPCC PROCESS SELECTION REPORT – PART II Page 47 of 193
PSR_rev final – July 2011
II.2 EVALUATION OF LICENSE REQUIREMENTS The Program designs SEWPCC for the following requirements:
TSS on effluent 30-day rolling average <25 * mg/l 24 h effluent composite sample
CBOD5 on effluent 30-day rolling average <25 mg/l 24 h effluent composite sample
TN on effluent 30-day rolling average <15 mg/l 24 h effluent composite sampleTP on effluent 30-day rolling average <1 mg/l 24 h effluent composite sample
E-coli on effluent 30-day geometric mean <200 MPN/100 mL
Grab sample collected at equal time intervalle on each of a
minimum of 3 consecutive days per week
Fecal
coliform on effluent 30-day geometric mean <200 MPN/100 mL
Grab sample collected at equal
time intervalle on each of a minimum of 3 consecutive days
per week
Ammonia Nitrogen on effluent never to exceed 1975 (january) kg N/day 24 h effluent composite sample
on effluent never to exceed 2403 (February) kg N/day 24 h effluent composite sampleon effluent never to exceed 4196 (March) kg N/day 24 h effluent composite sample
on effluent never to exceed 12926 (April) kg N/day 24 h effluent composite sampleon effluent never to exceed 5311 (May) kg N/day 24 h effluent composite sample
on effluent never to exceed 3103 (June) kg N/day 24 h effluent composite sample
on effluent never to exceed 1517 (July) kg N/day 24 h effluent composite sampleon effluent never to exceed 607 (August) kg N/day 24 h effluent composite sample
on effluent never to exceed 703 (September) kg N/day 24 h effluent composite sample
on effluent never to exceed 811 (October) kg N/day 24 h effluent composite sampleon effluent never to exceed 1152 (November) kg N/day 24 h effluent composite sample
on effluent never to exceed 1550 (December) kg N/day 24 h effluent composite samplelethal to fish on mixing zone never to exceed 50 % mortality fish 96- h static acute lethality test
DESIGN ASSUMPTIONS
Table 15: Program’s assumptions of license requirements
(*) Important note: the max value for TSS and CBOD5 considered is as per the Federal Effluent Guidelines (to which Manitoba is on board with). However the “never to exceed” condition is replaced by 30 day rolling average.
The design of the options and the comparison process are based on the license interpretation presented above. For the avoidance of doubt, the “never to exceed” requirements for CBOD5 and TSS are replaced by “30 day rolling average” and that the TSS concentration is decreased to 25 mg/L.

PART III - PROCESS SOLUTIONS DESCRIPTION

WINNIPEG SEWAGE TREATMENT PROGRAM
SEWPCC PROCESS SELECTION REPORT – PART III Page 49 of 193
PSR_rev final – July 2011
I. PRESELECTION OF THE PROCESS TECHNOLOGIES
-ooOoo-

WINNIPEG SEWAGE TREATMENT PROGRAM
SEWPCC PROCESS SELECTION REPORT – PART III Page 50 of 193
PSR_rev final – July 2011
The SEWPCC extension / upgrade project has been previously studied by a local consultancy consortium led by Stantec before the Program was implemented. The pre-selection of treatment technologies to be used for SEWPCC started at that time. During its studies, Stantec evaluated some 22 treatment alternatives, covering a wide range of technologies. Among which, Stantec studied but finally didn’t retain membrane and BAF (Biological Aerated Filter) technologies. Membrane based technologies were withdrawn by Stantec because of their high cost and BAF technologies because of the recourse to chemical Phosphorus removal. Therefore, at the end of the selection process, the preferred treatment alternatives put forward by Stantec were:
Option C: AS/BNR/MJ high rate with CEP side stream Option G: AS/BNR/MJ/IFAS with CEP side stream
The Program analysed work done previously and assessed modifications and improvements that could be brought to the project from the expertise and experience of the Program. The conclusions were:
Membrane based technologies were still expensive compare to the other technologies and their treatment capabilities were not required by the license and
BAF technology could be of interest for the SEWPCC project for following reasons: o Significant capital investment savings expected o Significant reduction of the construction duration (in relation with the license deadline) o Significant land advantages due to the small footprint and o Potential commonality to future solutions for the NEWPCC which is subject to severe
restrictions on available space. Consequently, the Program decided to retain the two preferred alternatives from Stantec’s work (Option C and Option G) and add two new options based on i) BAF technology and ii) BAF technology with bioP removal. Note: Stantec’s two preferred options were updated and upgraded using experience and expertise available within the Program. As these are now modified options from Stantec’s work these options have been renamed “option 1” and “option 2”. Although minor modifications have been made, the process principles remain the same as in the original Stantec options C & G. The Appendix 2 presents for information the update of Stantec’s option G pricing realized in December 2010.
The pre-selection of the process technologies has been based on the work done previously by Stantec. Its two preferred options are retained and updated/upgraded. In addition, the Program re-introduced the BAF technology into the process selection because of its significant advantages with respect to project constraints not known to Stantec.

WINNIPEG SEWAGE TREATMENT PROGRAM
SEWPCC PROCESS SELECTION REPORT – PART III Page 51 of 193
PSR_rev final – July 2011
II. REVIEW WORKSHOP RESULTS -ooOoo-

WINNIPEG SEWAGE TREATMENT PROGRAM
SEWPCC PROCESS SELECTION REPORT – PART III Page 52 of 193
PSR_rev final – July 2011
II.1 THE EAP SCOPE OF WORK AND ITS RESULTS II.1.1 THE REVIEW WORKSHOP The review workshop which was the frame of the EAP intervention took place in Winnipeg from Aug 31
st
to Sept 3rd
2010. The following people have attended the workshop, those shaded grey attended the full workshop:
EAP Prof. J. Ol es zkiewi cz Univers i ty of Manitoba
Dr. Jong Hyuk Hwang Univers i ty of Manitoba
Qiuyan Yuan (Ph.D candidate) Univers i ty of Manitoba
F. Roga l la Aqualia - Madrid, Spain
JB. Neethl ing HDR - Sacramento CA
J. Husband Malcolm & Pirnie - New York, USA
City of Winnipeg N. Szoke D. Gibs on
A. Permut M. Shkolny
A. Za l es ki T. Pears on
K. Smyrs ki B. Borlas e
R. Hahlweg
Veol ia A. Simon K. Sorrens en
A. Fioravanti B. Val la
D. Lamarre
K. Upendrakumar
J. Hestad
Permanent attendees
Table 16: workshop attendees
The purposes of the workshop and more generally the scopes of the EAP were to:
1. Validate the assumptions of the project 2. Validate or optimize the pre-selected process options 3. Review the design of the pre-selected options 4. Pre-score the options
The scope of the EAP was completed by a report presenting its opinion about the work done by the Program.
II.1.2 THE EAP REPORT Following the workshop, the Expert Advisory Panel (EAP) produced a report to summarise what had been discussed and the results of the technical discussions during the workshop. This report is presented in Appendix 3: EAP report, together with the Program’s responses to EAP questions following the workshop.
WINNIPEG SEWAGE TREATMENT PROGRAM
SEWPCC PROCESS SELECTION REPORT – PART III Page 53 of 193
PSR_rev final – July 2011
II.1.3 THE EAP CONCLUSION During the workshop the EAP validated the abandonment of option 1. In addition and as presented in the EAP report, the EAP validated the work done so far on the three remaining options and acknowledged that more process and design discussions at this stage would not bring significant benefits to the Program.
II.2 FORMER OPTION 1 PRESENTATION
II.2.1 TREATMENT LINE OVERVIEW The design consisted of a BNR treatment line with disinfection using UV. Flows in excess of 125 MLD, to a maximum of 300 MLD, were to be treated on a separate ballasted primary settler downstream of the headworks and were also to be disinfected using UV. Flows beyond 300MLD are discharged to river without further treatment to a maximum flow of 415 MLD. Figure next page illustrates the treatment lines.
II.2.2 DESCRIPTION OF WASTEWATER TREATMENT The main steps of SEWPCC are listed here below:
Headworks
- Raw water pumps - Bar screens (12 mm) - Grit removal
BNR line (125 MLD)
- 4 Primary clarifiers (3 existing + 1 new) - 4 Low Load Activated Sludge (A.S.) tanks including refurbishment of existing one - 6 Secondary clarifiers (3 existing + 3 new) - UV treatment
Excess Flows line
- 1 Ballasted Primary settler - UV treatment
II.2.3 DESCRIPTION OF SLUDGE TREATMENT
- Thickening for secondary sludge - Storage tanks - Truck loading facilities
II.2.4 DESCRIPTION OF ODOUR TREATMENT New works were deemed to be connected to the existing odour control system, which consists of a dispersion stack without treatment.

WINNIPEG SEWAGE TREATMENT PROGRAM
SEWPCC PROCESS SELECTION REPORT – PART III Page 54 of 193
PSR_rev final – July 2011
Figure 2: Option 1 PFD
This option has been abandoned after the review workshop as it was considered by the all workshop attendees as providing no significant advantage over the other three options.
Option 1 is not preselected for the further work as all the attendees of the workshop acknowledged that it provided no significant advantage over the other three options.
From 125 MLD Up to 300 MLD
Up to 125 MLD
UV
BALLASTED PRIMARY
SETTLER
1 unit
RAW WATER PUMPS
SCREENING
GRIT REMOVAL
SECONDARY
CLARIFIERS
6 units
River
BIOREATORS 4 lines – Low Load
PRIMARY
CLARIFIERS
4 units
FeCL3 if required
From 300 MLD up to 415 MLD

WINNIPEG SEWAGE TREATMENT PROGRAM
SEWPCC PROCESS SELECTION REPORT – PART III Page 55 of 193
PSR_rev final – July 2011
III. DESIGN REPORT FOR OPTION 2 -ooOoo-

WINNIPEG SEWAGE TREATMENT PROGRAM
SEWPCC PROCESS SELECTION REPORT – PART III Page 56 of 193
PSR_rev final – July 2011
III.1 DESIGN DATA The plant is design for the year 2031 for a population of 250,000 inhabitants.
III.1.1 DESIGN INFLUENT FLOWS The seasonal flows are detailed in Table 2. Main design flows are summarized in table below. This data is used for the design of all options.
Units Flowmeters
Annual average flow MLD 88
Average dry weather flow (ADWF) MLD 70
Spring max month MLD 120
Peak wet weather flow (PWWF) MLD 403
Peak hourly flow MLD 415
Table 17: Main design flows – all options
Note: flow higher than 300 MLD will be bypassed after pre-treatment (before the primary clarifiers). No guarantee will be given on this part of the flow.
III.1.2 DESIGN INFLUENT LOADS AND TEMPERATURE Refer to Table 18: Seasonal flows – all options

WINNIPEG SEWAGE TREATMENT PROGRAM
SEWPCC PROCESS SELECTION REPORT – PART III Page 57 of 193
PSR_rev final – July 2011
Max day Min week MAX MIN TSS BOD TKN TP TSS BOD TKN TP°C °C MLD MLD Kg/d Kg/d Kg/d Kg/d mg/l mg/l mg/l mg/l
19 12 Average 69,2 69,2 13 949 18 529 3 432 535 201 268 49,6 7,7 Max month 70,2 69,0 13 990 18 848 3 472 538 199 268 49,4 7,7
Max week 80,9 63,4 29 490 29 663 4 210 708 364 367 52,0 8,7 Max day 113,7 58,2 37 309 32 807 5 796 1 126 328 289 51,0 9,9 Hourly
Max day Min week MAX MIN TSS BOD TKN TP TSS BOD TKN TP°C °C MLD MLD Kg/d Kg/d Kg/d Kg/d mg/l mg/l mg/l mg/l
17 10 Average 102,3 102,3 18 675 19 247 3 804 579 183 188 37,2 5,7 Max month 119,8 89,1 18 929 19 622 3 952 596 158 164 33,0 5,0
Max week 245,1 66,7 36 036 31 341 5 428 979 147 128 22,1 4,0 Max day 402,9 65,2 121 165 47 852 6 783 1 261 301 119 16,8 3,1 Hourly
Max day Min week MAX MIN TSS BOD TKN TP TSS BOD TKN TP°C °C MLD MLD Kg/d Kg/d Kg/d Kg/d mg/l mg/l mg/l mg/l
19 13 Average 102,3 102,3 16 279 18 425 3 357 542 159 180 32,8 5,3 Max month 114,2 88,7 22 414 19 917 3 501 581 196 174 30,7 5,1
Max week 243,0 63,3 38 837 28 557 4 397 707 160 118 18,1 2,9 Max day 393,6 54,7 62 813 47 319 6 569 1 428 160 120 16,7 3,6 Hourly
Max day Min week MAX MIN TSS BOD TKN TP TSS BOD TKN TP°C °C MLD MLD Kg/d Kg/d Kg/d Kg/d mg/l mg/l mg/l mg/l
17 15 Average 80,8 80,8 14 693 18 787 3 387 542 182 232 41,9 6,7
Max month 83,3 76,6 15 284 18 960 3 444 547 183 228 41,3 6,6 Max week 112,4 67,3 20 338 22 410 4 809 738 181 199 42,8 6,6 Max day 157,1 62,8 38 398 31 595 5 922 1 067 244 201 37,7 6,8 Hourly
MAX MIN TSS BOD TKN TP TSS BOD TKN TPAvg °C MLD MLD Kg/d Kg/d Kg/d Kg/d mg/l mg/l mg/l mg/l
15 Average 87,5 87,5 15 912 18 777 3 532 552 182 215 40,4 6,3
FALL
ANNUAL AVERAGE
WINTER
SPRING
SUMMER
TEMPERATURE FLOW LOAD CONCENTRATION
TEMPERATURE FLOW LOAD CONCENTRATION
TEMPERATURE FLOW LOAD CONCENTRATION
TEMPERATURE FLOW LOAD CONCENTRATION
TEMPERATURE FLOW LOAD CONCENTRATION
Table 18: Seasonal flows – all options

WINNIPEG SEWAGE TREATMENT PROGRAM
SEWPCC PROCESS SELECTION REPORT – PART III Page 58 of 193
PSR_rev final – July 2011
III.1.3 INLET WATER CHARACTERIZATION HYPOTHESIS The design is based on the following influent characterization. This data is used for the design of all options.
Parameters Units Spring
Summer Winter
N-NO3- mg/l 0
COD/BOD % 2.2
VSS/SS % 80
Settleable TSS / TSS % 60
NH4-N/ TKN % 67
Psol/Pt % 80
Sol COD/Tot COD % 38
Sol non deg COD/ Tot COD % 8
Alkalinity mg/l CaCO3
250
Table 19: Influent characterization – all options

WINNIPEG SEWAGE TREATMENT PROGRAM
SEWPCC PROCESS SELECTION REPORT – PART III Page 59 of 193
PSR_rev final – July 2011
III.1.4 PERFORMANCE GUARANTEES Effluent guarantees as per SEWPCC license are as follows. This data is used for the design of all options.
Parameters Units Value
BOD5 mg/l 25 30 day rolling average
SS mg/l 25 30 day rolling average
TN mg/l 15 30 day rolling average
TP mg/l 1 30 day rolling average
E Coli and F.Coli MPN/100 ml 200 30 days geometric
average
Daily ammonia limit (*) Kg N/day
Monthly values.
Refer to the
license
Never to Exceed
Table 20: Effluent guarantees – all options
(*) based on the rain event assumptions available and presented in Chart 1: Annual flows assumptions
III.1.5 SIMULATIONS The design case is based on the max month load (spring max month), with a minimum temperature of 9°C (minimum daily temperature). The most stringent case for air blower sizing is the spring max month loads but at a water temperature of 17 °C, rather than the summer max month at 19°C. The average annual flow, loads and temperature (15°C) are used for operation estimations. III.1.6 SLUDGE HANDLING Primary sludge is thickened in the primary clarifiers and stored in tanks before being sent to NEWPCC. Secondary sludge is thickened prior to be stored and sent to the NEWPCC. The design is based on the liquid stream return from sludge processing at NEWPCC being totally handled at NEWPCC.
III.2 TREATMENT LINE OVERVIEW The design includes a BNR treatment line with a design capacity of 120 MLD. Effluent from the bioreactors is UV disinfected before final discharge. Flows in excess of 120 MLD and lower than 300 MLD are treated on a separate ballasted primary clarification system downstream of the headworks. This overflow is chemically disinfected using chlorine. Flows larger than 300 MLD are bypassed downstream of headworks and no guarantees are provided on this flow. Figure 3: Option 2 PFD illustrates the proposed treatment train.

WINNIPEG SEWAGE TREATMENT PROGRAM
SEWPCC PROCESS SELECTION REPORT – PART III Page 60 of 193
PSR_rev final – July 2011
II.2.1 DESCRIPTION OF WASTEWATER TREATMENT The main steps of SEWPCC are listed here below:
Headworks
- Raw water pumps - Fine screens (6 mm punched-holes) - Grit removal
BNR line (125 MLD)
- 4 Primary clarifiers (3 existing + 1 new) - 4 IFAS lines with bioP including refurbishment of existing reused systems; - 5 Secondary clarifiers (3 existing + 2 new) - UV treatment
Excess Flows line
- Ballasted Primary clarification (2 units) - Chemical disinfection
III.2.2 DESCRIPTION OF SLUDGE TREATMENT - Thickening for biological and Ballasted Primary Settler sludge - Storage tanks - Truck loading facilities
III.2.3 DESCRIPTION OF ODOUR TREATMENT New works will be connected to the odour control system, which consists of a dispersion stack without treatment.

WINNIPEG SEWAGE TREATMENT PROGRAM
SEWPCC PROCESS SELECTION REPORT – PART III Page 61 of 193
PSR_rev final – July 2011
Figure 3: Option 2 PFD
From 120 MLD to 300 MLD
Up to 120 MLD
UV
BALLASTED PRIMARY SETTLER (2 units)
RAW WATER PUMPS
SCREENING
GRIT REMOVAL
SECONDARY CLARIFIERS
5 units
River
BIO REACTORS 4 trains – IFAS
PRIMARY
CLARIFIERS
4 units
From 300 MLD up to 415 MLD
Screenings to skips
Grits
Sludge to storage Sludge to
thickening
Sludge to thickening
FeCl3 +
polymer
FeCl3 if required
Chlorination Cl2
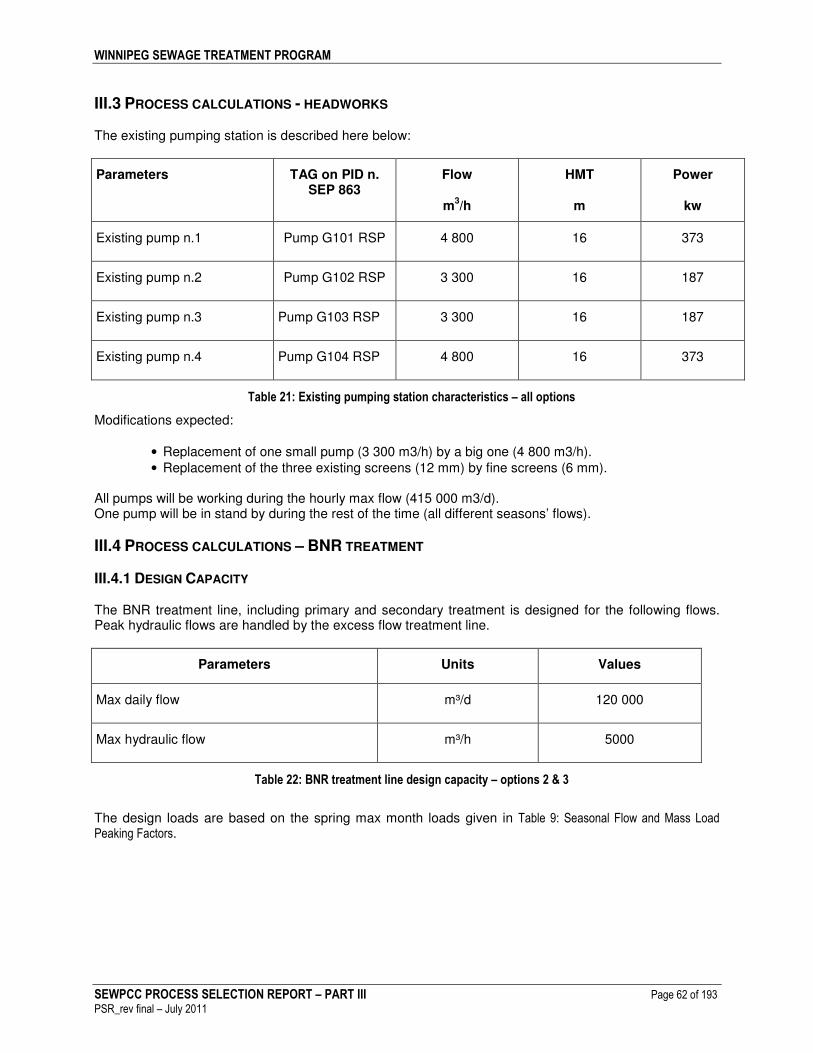
WINNIPEG SEWAGE TREATMENT PROGRAM
SEWPCC PROCESS SELECTION REPORT – PART III Page 62 of 193
PSR_rev final – July 2011
III.3 PROCESS CALCULATIONS - HEADWORKS The existing pumping station is described here below:
Parameters TAG on PID n. SEP 863
Flow
m3/h
HMT
m
Power
kw
Existing pump n.1 Pump G101 RSP 4 800 16 373
Existing pump n.2 Pump G102 RSP 3 300 16 187
Existing pump n.3 Pump G103 RSP 3 300 16 187
Existing pump n.4 Pump G104 RSP 4 800 16 373
Table 21: Existing pumping station characteristics – all options
Modifications expected:
• Replacement of one small pump (3 300 m3/h) by a big one (4 800 m3/h). • Replacement of the three existing screens (12 mm) by fine screens (6 mm).
All pumps will be working during the hourly max flow (415 000 m3/d). One pump will be in stand by during the rest of the time (all different seasons’ flows).
III.4 PROCESS CALCULATIONS – BNR TREATMENT
III.4.1 DESIGN CAPACITY The BNR treatment line, including primary and secondary treatment is designed for the following flows. Peak hydraulic flows are handled by the excess flow treatment line.
Parameters Units Values
Max daily flow m³/d 120 000
Max hydraulic flow m³/h 5000
Table 22: BNR treatment line design capacity – options 2 & 3
The design loads are based on the spring max month loads given in Table 9: Seasonal Flow and Mass Load Peaking Factors.

WINNIPEG SEWAGE TREATMENT PROGRAM
SEWPCC PROCESS SELECTION REPORT – PART III Page 63 of 193
PSR_rev final – July 2011
III.4.2 PRIMARY SETTLING a. INLET WATER QUALITY
Parameters Units Units
Inlet Water Quality
COD mg/l 360 kg/d 43 200
BOD5 mg/l 164 kg/d 19 680
SS mg/l 158 kg/d 18 960
TKN mg/l 33 kg/d 3 960
Total P mg/l 5.0 kg/d 600
Table 23: Inlet water quality – primary settling – options 2 & 3
b. SIZING OF THE PRIMARY CLARIFIERS
Parameters Units
Type - Gravity, rectangular, non lamellar
Chemical injection - No
Total area of the settling zone m² 2410
Average flow velocity m/h 1.5
Peak velocity m/h 2.07
Table 24: Design of primary clarifiers – options 2 & 3

WINNIPEG SEWAGE TREATMENT PROGRAM
SEWPCC PROCESS SELECTION REPORT – PART III Page 64 of 193
PSR_rev final – July 2011
c. EXISTING AND NEW WORKS The design allows the reuse of the existing primary clarifiers plus construction of a new unit.
Parameters Units Existing 1 &2 Existing 3 New 4
Number 2 1 1
Settling tank width m 9.1 19.2 9.1
Settling tank length m 51.8 51.8 51.8
Area of the settling zone /unit m² 472 995 472
Total area of the settling zone m² 1940 472
Total area of the settling zone m² 2410
Total water depth m 4.3* 4.3* 4.3*
Table 25: Arrangements for primary settling – options 2 & 3
* From drawings

WINNIPEG SEWAGE TREATMENT PROGRAM
SEWPCC PROCESS SELECTION REPORT – PART III Page 65 of 193
PSR_rev final – July 2011
d. EXPECTED EFFICIENCY OF THE PRIMARY SETTLING
Parameters Units DESIGN
Spring max month
AVERAGE
Yearly avg
Expected Removal Efficiency
COD % 18 23
BOD5 % 16 22
SS % 34 44
TKN % 6.0 8.0
Total P % 3.8 6.0
Expected Settled Water Quality FOR DESIGN SITUATION
COD mg/l 295 kg/d 35 400
BOD5 mg/l 138 kg/d 16 560
SS mg/l 104 kg/d 12 480
TKN mg/l 31 kg/d 3 720
Total P mg/l 4.8 kg/d 576
Table 26: Expected performances for primary settling – options 2 & 3
The efficiencies on the primary clarifiers have been estimated from actual results on existing primary clarifiers with consideration that there will be a small increase in velocities. The quality of the water (very diluted water) is also considered in the efficiencies calculations. The results on TSS efficiencies from existing primary clarifiers during last five years and the percentile curve are provided below.

WINNIPEG SEWAGE TREATMENT PROGRAM
SEWPCC PROCESS SELECTION REPORT – PART III Page 66 of 193
PSR_rev final – July 2011
TSS primary settler efficiency
0,0%
10,0%
20,0%
30,0%
40,0%
50,0%
60,0%
70,0%
80,0%
90,0%
100,0%
110,0%
14/janv/2004 28/mai/2005 10/oct/2006 22/févr/2008 6/juil/2009 18/nov/2010
date
TS
S p
rim
ary
se
ttle
r eff
icie
ncie
s
Graph 1: TSS primary settler efficiency 1/2
TSS primary settler efficiency
0,0%
10,0%
20,0%
30,0%
40,0%
50,0%
60,0%
70,0%
80,0%
90,0%
100,0%
20,0% 30,0% 40,0% 50,0% 60,0% 70,0% 80,0% 90,0% 100,0% 110,0%
percent du temps
TS
S p
rim
ary
se
ttle
r eff
icie
ncy
Graph 2: TSS primary settler efficiency 2/2

WINNIPEG SEWAGE TREATMENT PROGRAM
SEWPCC PROCESS SELECTION REPORT – PART III Page 67 of 193
PSR_rev final – July 2011
e. PRIMARY SLUDGE PRODUCTION AND EXTRACTION FROM SETTLING TANKS
Parameters Units Design Average
Total primary sludge production kg SS/d 14 550 (max week in
winter)
7 000
Primary sludge concentration g SS/L 40 40
Volatile Suspended Solids (VSS) % of SS 78 73
Total primary sludge flow m³/d 365 175
Table 27: Primary sludge production – options 2 & 3
Note: primary sludge is currently extracted at 3 to 4 %. Extraction of primary sludge is designed on a 12 hr/d basis. A complete new set of sludge pumps is planned for the primary clarification step.
Units Existing Existing New
Servicing For Existing
clarifiers 1 &2
For Existing
settler 3
For New
settler 4
Duty Pumps u 1 1 1
Stand-by Pumps u 1 1 1
Design Flowrate m3/h 10 10 10
Head bar 2 2 2
Table 28: Required set of pumps for primary sludge extraction – options 2 & 3

WINNIPEG SEWAGE TREATMENT PROGRAM
SEWPCC PROCESS SELECTION REPORT – PART III Page 68 of 193
PSR_rev final – July 2011
III.4.3 BIOLOGICAL REACTORS The design of the biological treatment has been carried out using the software SIMULO® Design is based on an IFAS (Integrated Fixed Activated Sludge), for biological carbon, nitrogen and phosphorus removal. Media is added only in part of the aerobic zones. In addition FeCl3 is added to the biological reactors for further chemical phosphorus removal ensuring constant effluent quality to achieve the license requirement of 1 mg/L TP.
QRAS=100 % Qinlet
Qinlet
Aerobic Anoxic Pre Anoxic
Anaerobic
QML=150 % Qinlet

WINNIPEG SEWAGE TREATMENT PROGRAM
SEWPCC PROCESS SELECTION REPORT – PART III Page 69 of 193
PSR_rev final – July 2011
a. SIZING OF THE REACTORS
Parameters Units Design
Sludge age at 9°C days 8.5
Total volume m³ 42 000
Total pre anoxic m³ 4 000
Total anaerobic zone m³ 8 000
Total anoxic zone m³ 11 500
Total Aerobic zone
C stage
IFAS reactor
DeOx zone
m³
m³
m³
m³
18 500
4 000
10 500
4 000
MLSS concentration g SS/l 4
Volatile Suspended Solids (VSS) % of SS 80
F/M ratio (applied) kg BOD5/ kg
SS/d 0.1
Volume loading rate (applied) kg BOD5/m³/d 0.4
Sludge Recirculation rate from clarifiers to AS
tanks (RAS) % 100
Mixed liquor recirculation rate (MLR) % 150
Table 29: Sizing of the biological reactors – option 2

WINNIPEG SEWAGE TREATMENT PROGRAM
SEWPCC PROCESS SELECTION REPORT – PART III Page 70 of 193
PSR_rev final – July 2011
b. CHEMICAL REQUIREMENT FeCl3 is added for chemical phosphorus removal, to assist the biological P removal.
Parameters Units Design Max Annual average
Chemical injection mg/l 7 7
Table 30: Chemical requirement in biological reactor – option 2
c. EXISTING AND NEW WORKS The existing HPO reactors will be retrofitted into pre anoxic and anaerobic zones. Two additional tanks must be constructed to complete the required volume of 12 000 m
3.
Parameters Units Existing 1 &2 Existing 3 & 4 New 5&6
Number 2 2 2
Width m 9.1 10.6 16
Length m 37.5 37.5 37.5
Liquid depth m 4.5 4.5 4.5
Total available surface m² 1480 1 200
Total available volume m3
6600 5 400
Total available volume m3
12 000
Table 31: Arrangements for biological reactors – option 2

WINNIPEG SEWAGE TREATMENT PROGRAM
SEWPCC PROCESS SELECTION REPORT – PART III Page 71 of 193
PSR_rev final – July 2011
Four bio reactors will be constructed to ensure carbon and nitrogen removal.
Parameters Units New
Number 4
Width m 16
Length m 72
Liquid depth m 6.5
Total available surface m² 4 615
Total available volume m3
30 000
Table 32: Oxidation ditches characteristics – option 2
Each bio reactor is divided into 5 zones: anoxic zone, aerobic zone for C removal, Aerobic zone with media for Nitrification divided into two zones and De-oxygenation zone. d. IFAS MEDIA
Parameters Units
Media type K3
Media effective area m2/m
3 500
NNH4 to be nitrified on
the media Kg/d 1 500
NNH4 load on the media g/m2/d 0.6
Media filling in Aerobic
zone 1 %
48 (expandable up
to 67%)
Media filling in aerobic
zone 2 %
48 (expandable up
to 67%)
Total media volume m3
5 000
Table 33: Media characteristics – option 2

WINNIPEG SEWAGE TREATMENT PROGRAM
SEWPCC PROCESS SELECTION REPORT – PART III Page 72 of 193
PSR_rev final – July 2011
e. OXYGEN REQUIREMENT & PRODUCTION The selected aeration system in both the C stage and in the IFAS stages is coarse bubble diffusers with turbo air blower system.
Parameters Units Design case
Spring maxi T
(Air blower design)
Annual Average (OPEX
estimation)
Temperature °C 9 17 15
Total Actual Oxygen requirement (AOR) kg O2/d 13 900 20 000 16 550
Peak hourly AOR kg O2/h 683 967 905
AOR in C tank kg O2/d 3 000 5 300 4 600
AOR in Nitrification tanks kg O2/d 8 900 12 200 10 150
AOR in De Ox tank kg O2/d 2 000 2 500 1 800
Diffusers type Coarse bubbles
Diffusers submerged depth m 6.2 6.2 6.2
Transfer rate in clean water in nit tanks % 21.7
Factor K 0.6 0.58 0.58
Daily air requirement Nm3/d 355 860 530 000 438 317
Peak hourly air requirement Nm3/h 17 500 25 600 24 000
Required air blower total capacity (@ 750
mbar discharge pressure) Nm
3/h 26 000
Table 34: Oxygen requirement – option 2

WINNIPEG SEWAGE TREATMENT PROGRAM
SEWPCC PROCESS SELECTION REPORT – PART III Page 73 of 193
PSR_rev final – July 2011
Turbo type air blowers will be installed to ensure air production
Units
Duty blowers u 2
Stand-by blowers u 1
Design Flowrate Nm3/h 13 000
Head mbar 850
Table 35: Oxygen production – option 2
f. MIXED LIQUOR CIRCULATION The mixed liquor recirculation rate is around 150% of the inlet flow. One duty and one stand-by submersible pump will be installed in each bioreactor to ensure mixed liquor circulation from the aerobic zone outlet to the anoxic zone inlet.
Units News
Duty pumps u 4
Stand-by pumps m 4
Design Flowrate per pump m3/h 1875
Head bar 0.2
Table 36: Mixed liquor circulation design – option 2

WINNIPEG SEWAGE TREATMENT PROGRAM
SEWPCC PROCESS SELECTION REPORT – PART III Page 74 of 193
PSR_rev final – July 2011
III.4.4 CLARIFICATION a. SIZING OF THE CLARIFIERS
III.4.5 SIZING OF THE CLARIFIERS The design is based on classical gravity clarifiers with double scraper and suction:
Parameters Units Values
Total surface of clarification m² 6 680
Sludge recirculation RAS m³/h 5 000
SVI ml/g 140
Surface overflow rate at average flow m/h 0.55
Surface overflow rate at max flow m/h 0.75
Useful water depth in the clarifiers m 4.0
Excess Sludge concentration g SS/l 8
Surface solids loading rate at max flow
(recirculation ratio = 100%)
Kg
SS/(m².h)
6.0
Table 37: Clarification characteristics – option 2

WINNIPEG SEWAGE TREATMENT PROGRAM
SEWPCC PROCESS SELECTION REPORT – PART III Page 75 of 193
PSR_rev final – July 2011
b. EXISTING AND NEW WORKS The design allows the reuse of the existing secondary clarifiers plus construction of additional units.
Parameters Units Existing 1&2 Existing 3 New 4&5
Number of clarifiers 2 1 2
Diameter m 33.5 45.7 45.7
Area of the settling zone/unit m2 880 1640 1640
Total area of the settling zone m² 3400 3280
Total area of the settling zone m² 6680
Table 38: Clarification arrangements – option 2
c. RAS The recirculation design flow is 100% of the inlet flow. Additional RAS pumps will be installed to service the new clarifiers.
New pumps
Existing pumps
EXISTING CLARIFIERS NEW CLARIFIERS
SAS to Sludge treatment
RAS
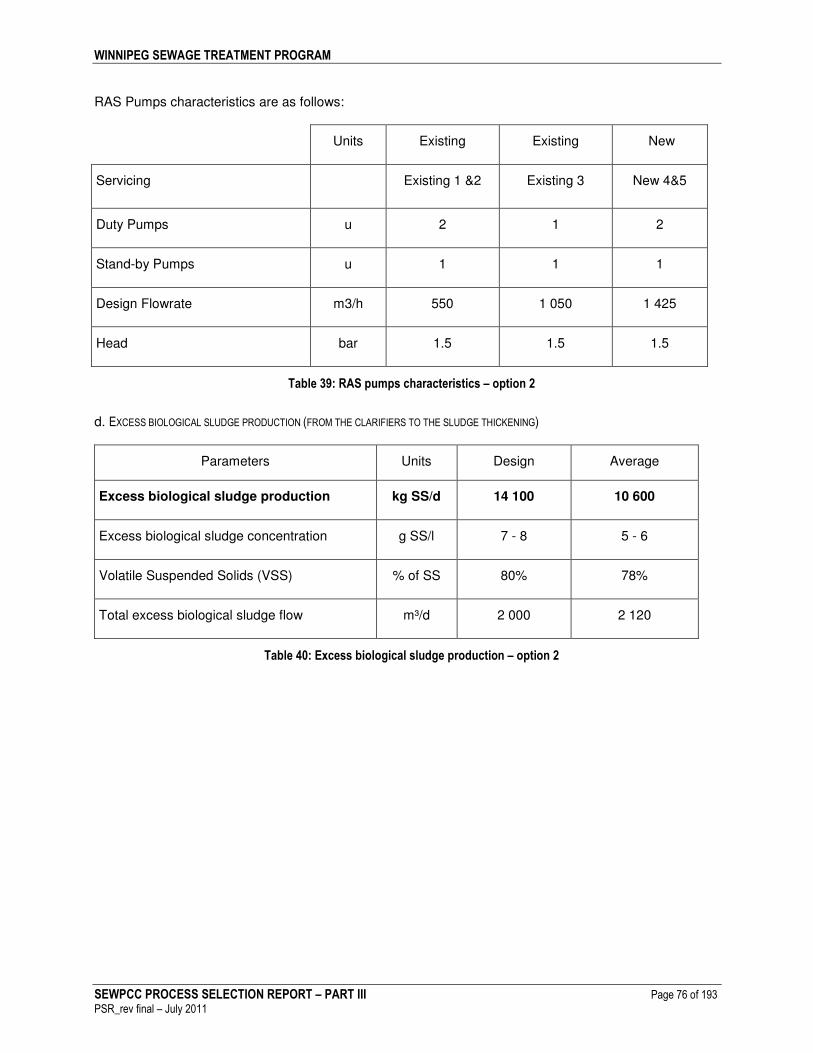
WINNIPEG SEWAGE TREATMENT PROGRAM
SEWPCC PROCESS SELECTION REPORT – PART III Page 76 of 193
PSR_rev final – July 2011
RAS Pumps characteristics are as follows:
Units Existing Existing New
Servicing Existing 1 &2 Existing 3 New 4&5
Duty Pumps u 2 1 2
Stand-by Pumps u 1 1 1
Design Flowrate m3/h 550 1 050 1 425
Head bar 1.5 1.5 1.5
Table 39: RAS pumps characteristics – option 2
d. EXCESS BIOLOGICAL SLUDGE PRODUCTION (FROM THE CLARIFIERS TO THE SLUDGE THICKENING)
Parameters Units Design Average
Excess biological sludge production kg SS/d 14 100 10 600
Excess biological sludge concentration g SS/l 7 - 8 5 - 6
Volatile Suspended Solids (VSS) % of SS 80% 78%
Total excess biological sludge flow m³/d 2 000 2 120
Table 40: Excess biological sludge production – option 2

WINNIPEG SEWAGE TREATMENT PROGRAM
SEWPCC PROCESS SELECTION REPORT – PART III Page 77 of 193
PSR_rev final – July 2011
Extraction of waste activated sludge is based on 18hr of operation per day. A complete new set of WAS pumps is installed.
Units Values
Total Required capacity m3/h 120
Duty Pumps u 2
Stand-by Pumps u 1
Design Flowrate m3/h 60
Head bar 2
Table 41: Excess activated sludge pumping system – option 2

WINNIPEG SEWAGE TREATMENT PROGRAM
SEWPCC PROCESS SELECTION REPORT – PART III Page 78 of 193
PSR_rev final – July 2011
e. CLARIFIED EFFLUENT CHARACTERISTICS
Parameters Units Design Units Design
Expected Removal Efficiency on biological step
COD % 76
BOD5 % 86
TSS % 76
Total N % 61
Total P % 80
Expected Settled Water Quality
COD mg/l 70 kg/d 8 400
BOD5 mg/l 20 kg/d
2 400
SS mg/l 25 kg/d 3 000
Total N mg/l 12 kg/d 1 440
Total P mg/l 1.0 kg/d 120
Table 42: Clarified effluent characteristics – option 2
III.4.6 UV DISINFECTION FOR BNR LINE Effluent from the biological treatment stage (up to 120 MLD) will be UV disinfected. Wet weather stream coming from ballasted flocculation clarifiers will be chemically disinfected. The two effluents will be mixed after disinfection to meet the required standards on fecal coliforms and Escherichia Coli and rejected to the river. UV disinfection is designed on the spring maxi week for flows and loads (see Table 1). To design the UV treatment, following hypothesis have been taken: E.coli concentration in the raw water: 10^7 MPN/100 ml E.coli concentration decrease on the biological treatment: 2 log Required standards: E.coli reject limit on 30 day rolling average after UV disinfection: 200 MPN/100 ml

WINNIPEG SEWAGE TREATMENT PROGRAM
SEWPCC PROCESS SELECTION REPORT – PART III Page 79 of 193
PSR_rev final – July 2011
The table below gives an example of the UV disinfection system and the BNR-Ballasted Primary Settler mixing during a max month:
BNR OUTLET BALLASTED PRIMARY
SETTLER OUTLET
MIXING OF THE BNR AND
BALLASTED PRIMARY SETTLER
Composition of the flow during the month
BNR outlet Flow (m3/d)
Reject limit on the E.Coli after
UV (MPN/100 ml)
Ballasted Primary Settler
outlet Flow (m3/d)
Reject limit on the E.Coli after
Cl2 (MPN/100 ml)
Reject limit on the E.Coli in the river (MPN/100 ml) as
geometric average
3 days of max summer day flow
120000 1.10^+2
180000 5,00.10^+3
2*10^+2
4 days of max summer week flow
120000 1.10^+2
125000 2,50.10^+3
Flow on 23 days to get monthly average around 120 000 m3/d all over the month
97000 1.10^+2
0
Table 43: UV disinfection system and BNR Ballasted Primary Settler mixing example – all options
Some lamps exist on site (Trojan UV4000 system) and the necessary lamps to complete the disinfection for all the flow will be added. Here below, some parameters considered in the calculations:
Parameters Units Design Average
Transmittivity % 40 45
Dose of necessary energy to disinfect J/m2 478 378
Table 44: Design assumptions for UV disinfection – all options
III.4.7 DAILY AMMONIA LIMIT As indicated previously, the license requires a daily never to exceed ammonia limit at the outlet of the plant. The limit varies each month of the year in order to consider the seasonality of the environmental conditions of the watershed. Ammonia is only treated in the BNR line. There is no removal expected in the CSO line. Therefore, the most critical conditions to meet the license will be during the months when the combination of rain events and low ammonia limits occur. The rain data available at the present time come from Stantec’s CDR and are presented in table below.

WINNIPEG SEWAGE TREATMENT PROGRAM
SEWPCC PROCESS SELECTION REPORT – PART III Page 80 of 193
PSR_rev final – July 2011
0.00
50.00
100.00
150.00
200.00
250.00
300.00
350.00
Flows (MLD)
Flows (MLD)
JulyApril
October
Chart 1: Annual flows assumptions
Looking at this chart and at the license table (Table 15: Program’s assumptions of license requirements), the most stringent month is July, with 1,517 kg N/d. During this month, assuming an inlet temperature of 19ºC, the BNR line will accept up to 182.25 MLD and will still meet all the requirements at the outlet.
III.5 PROCESS CALCULATIONS – EXCESS FLOWS TREATMENT III.5.1 DESIGN CAPACITY Flows in excess of 120 MLD and up to 300 MLD are treated on a separate ballasted primary settler downstream of headworks. The excess flow treatment line is designed for the following flows. Note that when the excess flow line is in service the hourly peak flow is taken by this line
Parameters Units Values Comments
Max daily flow (spring max week) MLD 125 (=245-120)
Max daily flow (spring max day) MLD 180 (=300-120)
Max daily flow (summer max week) MLD 123 (=243-120)
Max daily flow (summer max day) MLD 180 (=300-120)
Peak flow m³/h 7 500 (=180/24)
Table 45: Design flows for wet weather stream – all options
The design is based on the spring max week loads given in Table 9: Seasonal Flow and Mass Load Peaking Factors.

WINNIPEG SEWAGE TREATMENT PROGRAM
SEWPCC PROCESS SELECTION REPORT – PART III Page 81 of 193
PSR_rev final – July 2011
It has been assumed that this line will be put in service 30 days per year including 15 days of spring max week and 15 days in summer max week (including 6 maxi days: 3 of spring and 3 of summer).
III.5.2 BALLASTED PRIMARY CLARIFICATION a. INLET WATER QUALITY: SPRING MAX WEEK
Parameters Units Units
Inlet Water Quality
COD mg/l 282 kg/d 35 250
BOD5 mg/l 128 kg/d 16 000
SS mg/l 147 kg/d 18 375
TKN mg/l 22 kg/d 2 750
Total P mg/l 4 kg/d 500
Table 46: Inlet water quality in wet weather stream – all options

WINNIPEG SEWAGE TREATMENT PROGRAM
SEWPCC PROCESS SELECTION REPORT – PART III Page 82 of 193
PSR_rev final – July 2011
b. SIZING OF THE BALLASTED CLARIFIERS
Parameters Units
Type - BALLASTED PRIMARY
SETTLER
Chemical injection (FeCl3) mg/l 75-100
Number of clarifiers u 2
Unit area of the settling zones m² 45
Total area of the settling zones m² 90
Spring Max week velocity m/h 58
Spring max day velocity m/h 83
Peak hourly velocity m/h 83
Settling tank diameter m 6.9
Table 47: Sizing of ballasted clarifiers – all options
For this application, two smaller Ballasted Primary Settler units are used. The design has been based on a two unit configuration, each rated for 50% of the flow (90 MLD) at the nominal clarifier capacity, but each being able to handle up to 100% of the flow (i.e. 180 MLD) if one unit is off-line. This twin unit configuration can thus better handle the small rain events while offering full redundancy.

WINNIPEG SEWAGE TREATMENT PROGRAM
SEWPCC PROCESS SELECTION REPORT – PART III Page 83 of 193
PSR_rev final – July 2011
c. EXPECTED EFFICIENCY OF THE BALLASTED PRIMARY SETTLER BALLASTED CLARIFICATION Spring max week:
Parameters Units
Expected Removal Efficiency
COD % 63
BOD5 % 60
SS % 85
TKN % 21
Total P % 76
Expected Settled Water Quality
COD mg/l 105 kg/d 13 125
BOD5 mg/l
51 kg/d
6 375
SS mg/l 22 kg/d 2 750
TKN mg/l 17 kg/d 2 125
Total P mg/l 1 kg/d 125
Table 48: Expected performances of ballasted settling – all options
d. BALLASTED PRIMARY SETTLER SLUDGE PRODUCTION AND EXTRACTION FROM SETTLING TANKS
Parameters Load Concentration Occurrences
Kg/day g/l Days/year
CSO Sludge production- spring max week 23 150 10 12
CSO Sludge production- spring max day 62 500 10 3
Table 49: Ballasted Primary Settler sludge production from settling tanks – all options

WINNIPEG SEWAGE TREATMENT PROGRAM
SEWPCC PROCESS SELECTION REPORT – PART III Page 84 of 193
PSR_rev final – July 2011
e. CHEMICAL CONSUMPTION FeCl3 and polymer are injected in the ballasted clarification process.
Parameters Dosing
FeCl3
Dosing Polymer Occurrences
mg/l mg/l Days/year
Chemical injection- spring max week 75 1 12
Chemical injection- summer max week 75 1 12
Chemical injection- spring and summer max
days
100 1 6
Table 50: Chemical consumption on wet weather stream – all options
III.5.3 CL2 DISINFECTION FOR WET WEATHER The wet weather flow after the Ballasted Primary Settler treatment will be disinfected using chemical addition (as a first approach). This will only be during a maximum of one month per year when the flow is higher than 120 000 m3/d. E.coli concentration in the raw water: 10
7
E.coli removal over Ballasted Primary Settler treatment: 1.5 log E. coli concentration at chemical disinfection inlet 5*10
5
The disinfection unit was designed for the following treated wastewater characteristics:
Parameters Units Values
Max daily Flow m³/d 180 000
Max week flow m³/d 125 000
TSS mg/l 25
E.Coli inlet disinfection MPN/100ml ≤ 5*105
E. Coli treated water MPN/100ml ≤103
Table 51: Treated wastewater characteristics – all options
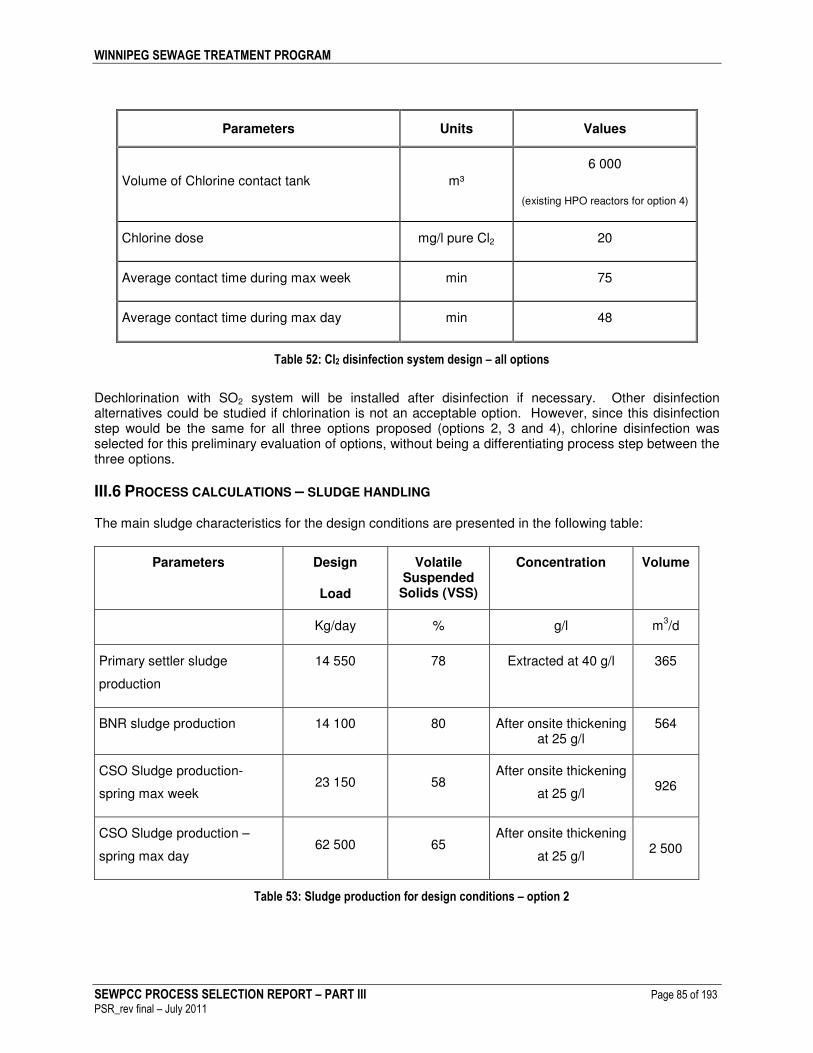
WINNIPEG SEWAGE TREATMENT PROGRAM
SEWPCC PROCESS SELECTION REPORT – PART III Page 85 of 193
PSR_rev final – July 2011
Parameters Units Values
Volume of Chlorine contact tank m³
6 000
(existing HPO reactors for option 4)
Chlorine dose mg/l pure Cl2 20
Average contact time during max week min 75
Average contact time during max day min 48
Table 52: Cl2 disinfection system design – all options
Dechlorination with SO2 system will be installed after disinfection if necessary. Other disinfection alternatives could be studied if chlorination is not an acceptable option. However, since this disinfection step would be the same for all three options proposed (options 2, 3 and 4), chlorine disinfection was selected for this preliminary evaluation of options, without being a differentiating process step between the three options.
III.6 PROCESS CALCULATIONS – SLUDGE HANDLING The main sludge characteristics for the design conditions are presented in the following table:
Parameters Design
Load
Volatile Suspended
Solids (VSS)
Concentration Volume
Kg/day % g/l m3/d
Primary settler sludge
production
14 550 78 Extracted at 40 g/l 365
BNR sludge production 14 100 80 After onsite thickening at 25 g/l
564
CSO Sludge production-
spring max week 23 150 58
After onsite thickening
at 25 g/l 926
CSO Sludge production –
spring max day 62 500 65
After onsite thickening
at 25 g/l 2 500
Table 53: Sludge production for design conditions – option 2

WINNIPEG SEWAGE TREATMENT PROGRAM
SEWPCC PROCESS SELECTION REPORT – PART III Page 86 of 193
PSR_rev final – July 2011
The yearly average sludge production is presented in the table below:
Parameters Design
Load
Volatile Suspended
Solids (VSS)
Concentration Volume
Kg/day % g/l m3/d
Primary settler sludge
production 7 000 73 Extracted at 40 g/l 175
BNR sludge production 10 600 78
After onsite thickening at 25 g/l
424
Wet weather Ballasted
Primary Settler sludge 2 500 63 After onsite thickening
at 25 g/l 100
Total, yearly average 20 100 74 30 g/l 700
Table 54: Yearly average sludge production– option 2
III.7 PROCESS REDUNDANCY APPROACH The maintenance philosophy for the option is explained below. A more detailed assessment of maintenance requirements will be completed during the detailed engineering phase. Process design for option selection allows for removal of process units for maintenance without affecting processes unstream or downstream of that process unit. The design allows for one process unit in each stage to be removed from service at any time without compromising effluent compliance. Primary clarifiers If one primary settler is out of service, the velocity will increase on the remaining three clarifiers. To achieve the same results on the settled water and not to have any influence on the following IFAS biological reactor, chemical can be added in the remaining primary units (on line) during the period of maintenance. Alternatively, one of the Ballasted Primary Clarifiers can be used for part of the flow. There are two Ballasted Primary Clarifiers available that will only be required during one month of the year and, as a consequence of their quick start up, they are available for different applications. IFAS biological reactors If one line of biological reactors is out of service during winter, the concentration will increase in the other biological reactors, in this situation the concentration will remain below 4 g/l which is within their design envelope. In this configuration the design allows aeration capacity for full treated flow to be installed in three tanks (more coarse bubble diffusers will be installed in each tank than is required when all tanks are in service). In addition, if one process stream is off-line for an extended period of time all the media from that stream has to be transferred to the streams that remain in operation. The amount of media loaded into each IFAS tank will be designed to be below 50% of the available volume for normal conditions allowing space for the transfer of media from other tanks. With one unit out of service the other units will still be less than 67% of full.

WINNIPEG SEWAGE TREATMENT PROGRAM
SEWPCC PROCESS SELECTION REPORT – PART III Page 87 of 193
PSR_rev final – July 2011
If one line of biological reactors is out of service during spring (design conditions), chemicals can be dosed on line in the primary clarifiers to reduce the TSS load in the biological reactors maintaining an acceptable concentration on the clarifiers. Clarifiers Design is such that if one clarifier is out of service, the velocity is still acceptable on the remaining 5 clarifiers (0.9 m/h instead of 0.75 m/h). Polymer can be added to increase the settling-ability of the sludge and to obtain good results on TSS outlet (without decreasing UV effectiveness). Ballasted Primary Settler The design will allow for one wet weather Ballasted Primary Settler to out of service, with the other one dealing with the full flow at the higher velocity. In this configuration there will be a slight increase in chemical dosage and a slight deterioration of the effluent quality.
WINNIPEG SEWAGE TREATMENT PROGRAM
SEWPCC PROCESS SELECTION REPORT – PART III Page 88 of 193
PSR_rev final – July 2011
IV. DESIGN REPORT FOR OPTION 3 -ooOoo-
WINNIPEG SEWAGE TREATMENT PROGRAM
SEWPCC PROCESS SELECTION REPORT – PART III Page 89 of 193
PSR_rev final – July 2011
IV.1 DESIGN DATA The plant is design horizon is to the year 2031 and a population of 250,000 inhabitants.
IV.1.1 DESIGN INFLUENT FLOWS Please refer to paragraph III.1.1 - PartIII.
IV.1.2 DESIGN INFLUENT LOADS AND TEMPERATURE Please refer to Table 18: Seasonal flows – all options.
IV.1.3 INLET WATER CHARACTERIZATION HYPOTHESIS Please refer to Table 19: Influent characterization – all options.
IV.1.4 PERFORMANCE GUARANTEES Please refer to Table 20: Effluent guarantees – all options.
IV.1.5 SIMULATIONS The design case is based on the max month load (spring max month), with a minimum temperature of 9°C (minimum daily temperature). The most stringent case for air blower sizing is the spring max month loads with a water temperature of 17 °C, rather than the summer max month at 19°C. The average annual flow, loads and temperature (15°C) are used for operation estimates.
IV.1.6 SLUDGE HANDLING Primary sludge is thickened in the primary clarifiers and stored in tanks before being sent to the NEWPCC. Secondary sludge is thickened prior to be stored and sent to the NEWPCC. The design is based on the liquid stream return from sludge process at NEWPCC being totally handled at NEWPCC.
IV.2 TREATMENT LINE OVERVIEW The design includes a BNR treatment line with a design capacity of 120 MLD. Effluent from the bioreactors is UV disinfected before final discharge. Flows between excess 120 MLD and 300 MLD are treated on a separate ballasted primary clarification system downstream of the headworks. This overflow is chemically disinfected using chlorine. Flows larger than 300 MLD are bypassed downstream of headworks and no guarantees is provided on this flow.

WINNIPEG SEWAGE TREATMENT PROGRAM
SEWPCC PROCESS SELECTION REPORT – PART III Page 90 of 193
PSR_rev final – July 2011
IV.2.1 DESCRIPTION OF WASTEWATER TREATMENT The main steps for treatment at SEWPCC are listed here below:
Headworks
- Raw water pumps - Fine screens (6 mm punched-holes) - Grit removal
BNR line (120 MLD)
- 4 Primary clarifiers (3 existing + 1 new) - 4 Intermediate load Activated Sludge (AS) with anaerobic and anoxic tanks including
refurbishment of existing HPO reactors - 5 Secondary clarifiers (3 existing + 2 new) - 6 Biofilters N - 2 Biofilter Post DN - UV treatment
Excess Flows line
- Ballasted Primary clarification (2 units) - Chemical disinfection
IV.2.2 DESCRIPTION OF SLUDGE TREATMENT - Thickening for secondary sludge - Storage tanks - Truck loading facilities
IV.2.3 DESCRIPTION OF ODOUR TREATMENT The new works will be connected to the existing odour control system, which consists of a dispersion stack without treatment.
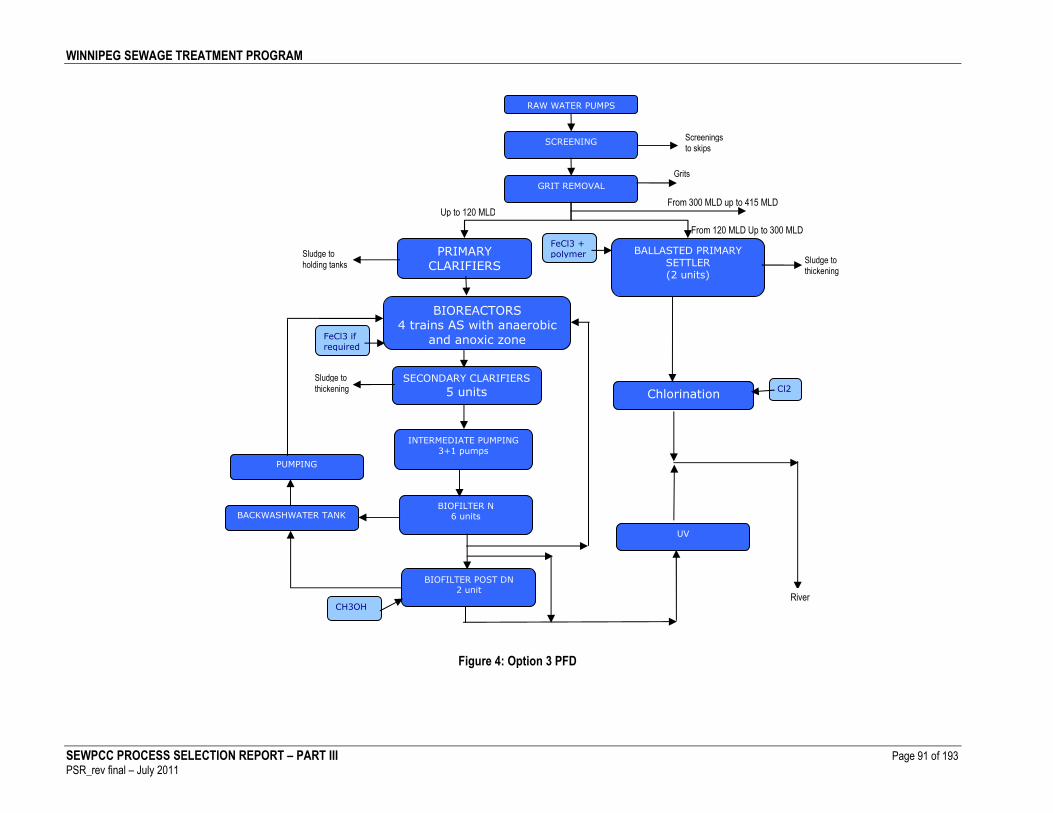
WINNIPEG SEWAGE TREATMENT PROGRAM
SEWPCC PROCESS SELECTION REPORT – PART III Page 91 of 193
PSR_rev final – July 2011
Figure 4: Option 3 PFD
From 120 MLD Up to 300 MLD
Up to 120 MLD
UV
BALLASTED PRIMARY SETTLER (2 units)
RAW WATER PUMPS
SCREENING
GRIT REMOVAL
PRIMARY
CLARIFIERS
4 units
BIOREACTORS
4 trains AS with anaerobic
and anoxic zone
SECONDARY CLARIFIERS
5 units
INTERMEDIATE PUMPING
3+1 pumps
BIOFILTER N 6 units
BIOFILTER POST DN 2 unit
CH3OH River
From 300 MLD up to 415 MLD
Screenings to skips
Grits
Sludge to thickening
Sludge to
holding tanks
FeCl3 +
polymer
Sludge to
thickening
BACKWASHWATER TANK
PUMPING
Chlorination
FeCl3 if
required
Cl2

WINNIPEG SEWAGE TREATMENT PROGRAM
SEWPCC PROCESS SELECTION REPORT – PART III Page 92 of 193
PSR_rev final – July 2011
IV.3 PROCESS CALCULATIONS - HEADWORKS Headworks upgrade / expansion will be the same for all options.
IV.4 PROCESS CALCULATIONS – BNR TREATMENT
IV.4.1 DESIGN CAPACITY Please refer to Table 22: BNR treatment line design capacity – options 2 & 3.
IV.4.2 PRIMARY SETTLING a. INLET WATER QUALITY Please refer to Table 23: Inlet water quality – primary settling – options 2 & 3. b. SIZING OF THE PRIMARY CLARIFIERS Please refer to Table 24: Design of primary clarifiers – options 2 & 3. c. EXISTING AND NEW WORKS Please refer to Table 25: Arrangements for primary settling – options 2 & 3. d. EXPECTED EFFICIENCY OF THE PRIMARY SETTLING Please refer to Table 26: Expected performances for primary settling – options 2 & 3. e. PRIMARY SLUDGE PRODUCTION AND EXTRACTION FROM SETTLING TANKS Please refer to Table 27: Primary sludge production – options 2 & 3 and Table 28: Required set of pumps for primary sludge extraction – options 2 & 3.
IV.4.3 BIOLOGICAL REACTORS The design of the biological treatment has been carried out using the software SIMULO®. Design is based on an intermediate load biological reactor for bioP removal. This system includes an anaerobic zone for biological phosphorus release, followed by an anoxic zone where nitrates are consumed along with phosphorus uptake, and is completed by a final aerated zone where phosphorus uptake is completed before secondary clarification. This activated sludge process is followed by a nitrifying BAF system, and part of the effluent is then denitrified through dosage of an external carbon source.
QRAS=100 % Qinlet
ANAEROBIC ZONE
Qinlet
AEROBIC ZONE ANOXIC ZONE
NNO3 recirculation from Biofilter Nit = 60%-100% of inlet
Backwash water recycle for combined clarification

WINNIPEG SEWAGE TREATMENT PROGRAM
SEWPCC PROCESS SELECTION REPORT – PART III Page 93 of 193
PSR_rev final – July 2011
a. SIZING OF THE REACTORS Flows and loads of recirculated nitrifying Biofilter effluent (nitrate recycle) as well as Biofilter N and PDN backwash water:
Parameters Units Design
Nitrifying Biofilter Effluent m3/d 60,000
Sludge from Nitrifying Biofilter m3/d 7,700
Sludge from Post denitrification Biofilter m3/d 1,100
Total flow m3/d 69,000
COD mg/l 134
BOD5 mg/l
60
TSS mg/l
70
TKN mg/l
8
N-NH4 mg/l
1
N-NO3 mg/l
11
TP mg/l
3
Table 55: Flows and loads of recirculated nitrifying Biofilter effluent – option 3
Parameters Units
AS Sludge age at 9°C days 4
Total volume m³ 28 000
Pre anoxic zone (as first section of the
anaerobic zone)
m³ 1 000
Total anaerobic zone (excluding pre-anoxic
zone volume)
m³ 8 000
Anoxic zone m³ 11 000

WINNIPEG SEWAGE TREATMENT PROGRAM
SEWPCC PROCESS SELECTION REPORT – PART III Page 94 of 193
PSR_rev final – July 2011
Parameters Units
Total Aerobic zone m³ 8 000
Liquid depth m 4.5
Total surface m2
6 230
MLSS concentration g SS/l 3.2
Volatile Suspended Solids (VSS) % of SS 85
F/M ratio (applied) kg BOD5/ kg
SS/d
0,23
Volume loading rate (applied) kg BOD5/m³/d 0,73
Sludge Recirculation from clarifiers to AS
tanks (RAS)
m3/h 5 000 (100% recycle
rate)
SVI ml/g 150
Table 56: Sizing of the biological reactors – option 3
b. CHEMICAL REQUIREMENT FeCl3 is added for chemical phosphorus removal, to assist the biological P removal.
Parameters Units Design Max Annual average
Chemical injection mg/l 3 0 5
Table 57: Chemical requirement in biological reactor – option 3
Simulations indicate that FeCl3 is not required for this option, but in order to deal with the daily variations in COD/P ratio, a small coagulant dosage is planned.

WINNIPEG SEWAGE TREATMENT PROGRAM
SEWPCC PROCESS SELECTION REPORT – PART III Page 95 of 193
PSR_rev final – July 2011
c. EXISTING AND NEW WORKS The existing HPO reactors will be retrofitted into part of the pre anoxic / anaerobic zones, while some additional tanks must be provide to complete to total required volume of 9000 m3. Additional tanks must also be constructed for the anoxic and aerobic tanks. These tanks will be completely mixed with mixers.
Parameters Units Existing 1 &2 Existing 3 & 4 New 5&6
Number u 2 2 2
Tank width m 9.1 10.6 7
Tank length m 37.5 37.5 37.5
Liquid depth m 4.5 4.5 4.5
Total available surface m2
1 480 522
Total available volume m3
6 650 2 360
Total available volume m3
9 000
Table 58: Arrangements for biological reactors – option 3
Four anoxic-aerobic bioreactors will be constructed to ensure carbon removal and denitrification of the recirculated NNO3 from the nitrifying Biofilter.
Parameters Units New
Number u 4
Width m 16.3
Length m 45
Liquid depth m 6.5
Total available surface m² 2 923
Total available volume m3
19 000
Table 59: Aerated bioreactor characteristics – option 3
Each bio reactor is divided in 2 zones: anoxic and aerobic.
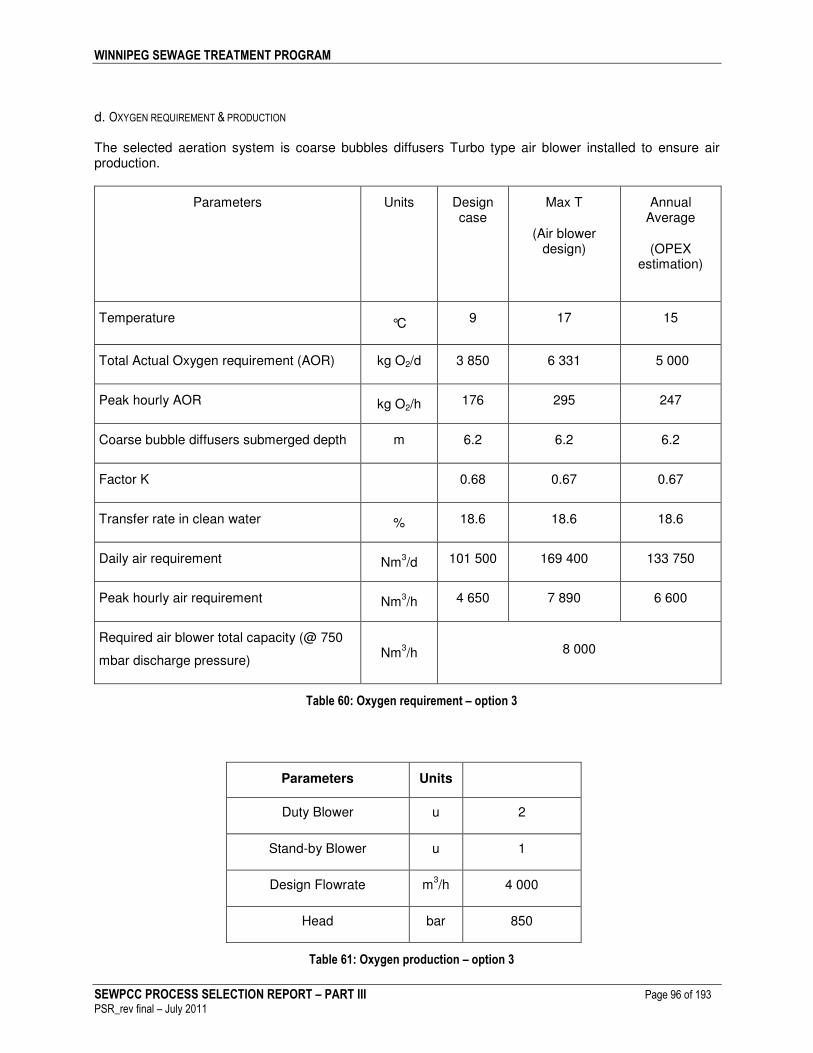
WINNIPEG SEWAGE TREATMENT PROGRAM
SEWPCC PROCESS SELECTION REPORT – PART III Page 96 of 193
PSR_rev final – July 2011
d. OXYGEN REQUIREMENT & PRODUCTION The selected aeration system is coarse bubbles diffusers Turbo type air blower installed to ensure air production.
Parameters Units Design case
Max T
(Air blower design)
Annual Average
(OPEX estimation)
Temperature °C 9 17 15
Total Actual Oxygen requirement (AOR) kg O2/d 3 850 6 331 5 000
Peak hourly AOR kg O2/h 176 295 247
Coarse bubble diffusers submerged depth m 6.2 6.2 6.2
Factor K 0.68 0.67 0.67
Transfer rate in clean water % 18.6 18.6 18.6
Daily air requirement Nm3/d 101 500 169 400 133 750
Peak hourly air requirement Nm3/h 4 650 7 890 6 600
Required air blower total capacity (@ 750
mbar discharge pressure) Nm
3/h 8 000
Table 60: Oxygen requirement – option 3
Parameters Units
Duty Blower u 2
Stand-by Blower u 1
Design Flowrate m3/h 4 000
Head bar 850
Table 61: Oxygen production – option 3

WINNIPEG SEWAGE TREATMENT PROGRAM
SEWPCC PROCESS SELECTION REPORT – PART III Page 97 of 193
PSR_rev final – July 2011
IV.4.4 CLARIFICATION a. SIZING OF THE CLARIFIERS Design is based on a classical clarifier with double scraper and suction:
Parameters Units
Total surface of clarification 8 320
m² 6 680
Sludge recirculation RAS m³/h 5 000
SVI ml/g 150
Surface overflow rate at max flow m/h 1.18
Useful water depth in the clarifiers m 4.0
Excess Sludge concentration g SS/l 6 - 7
Surface solids loading rate at max flow
(recirculation ratio = 100%) Kg SS/(m².h) 7.5
Table 62: Design of clarifiers – option 3
b. EXISTING AND NEW WORKS The design allows the reuse of the existing secondary clarifiers plus construction of two additional ones.
Parameters Units Existing 1&2 Existing 3 New 4&5
Number of clarifiers 2 1 2
Diameter m 33.5 45.7 45.7
Area of the settling zone/unit m2 880 1 640 1 640
Total area of the settling zone m² 3 400 3 280
Total area of the settling zone m² 6 680
Table 63: Clarification arrangements – option 3

WINNIPEG SEWAGE TREATMENT PROGRAM
SEWPCC PROCESS SELECTION REPORT – PART III Page 98 of 193
PSR_rev final – July 2011
c. RAS Additional RAS pumps will be installed to service the new clarifiers.
The RAS Pump characteristics are as follows:
Units Existing Existing New
Servicing Existing 1 & 2 Existing 3 New 4 & 5
Duty Pumps u 2 1 2
Stand-by Pumps m 1 1 1
Design Flowrate per pump m3/h 550 1 050 1 425
Head bar 1,50 1,50 1,50
Table 64: RAS pumps characteristics – option 3
New pumps
Existing pumps
EXISTING CLARIFIERS NEW CLARIFIERS
SAS to Sludge treatment
RAS

WINNIPEG SEWAGE TREATMENT PROGRAM
SEWPCC PROCESS SELECTION REPORT – PART III Page 99 of 193
PSR_rev final – July 2011
d. EXCESS BIOLOGICAL SLUDGE PRODUCTION (FROM THE CLARIFIERS TO THE SLUDGE THICKENING)
Parameters Units Design Average
Excess biological sludge production kg SS/d 16 000 12 000
Excess biological sludge concentration g SS/l 6 - 7 4.5
Volatile Suspended Solids (VSS) % of SS 85 84
Total excess biological sludge flow m³/d 2 700 2 700
Table 65: Excess biological sludge production – option 3
Extraction of waste activated sludge is based on 18 hrs of operation per day. A complete new set of WAS pumps will be installed.
Units Values
Total Required capacity m3/h 150
Duty Pumps u 2
Stand-by Pumps u 1
Design Flowrate m3/h 75
Head bar 2.0
Table 66: Excess activated sludge pumping system – option 3

WINNIPEG SEWAGE TREATMENT PROGRAM
SEWPCC PROCESS SELECTION REPORT – PART III Page 100 of 193
PSR_rev final – July 2011
e. CLARIFIED EFFLUENT CHARACTERISTICS
Expected Clarified Water Quality
COD mg/l 86 kg/d 16 254
BOD5 mg/l 30 kg/d 5 670
TSS mg/l 30 kg/d 5 670
Total N mg/l 16.5 kg/d 3 118
Total P mg/l 2.0 kg/d 378
Table 67: Clarified effluent characteristics – option 3
IV.4.5 INTERMEDIATE PUMPING New pumps are required to lift the secondary effluent to the Nitrification/Denitrification Biofiltration process stage.
Units
Flow to be lifted (including Biofilter
N effluent recycle and Backwash
water recycle)
m3/d 194 000
Duty pumps u 3
Stand-by pumps m 1
Design Flowrate per pump m3/h 2 694
Head bar 0.5 (TBD)
Table 68: Intermediate pumping system – option 3
WINNIPEG SEWAGE TREATMENT PROGRAM
SEWPCC PROCESS SELECTION REPORT – PART III Page 101 of 193
PSR_rev final – July 2011
IV.4.6 BIOFILTERS FOR NITRIFICATION AND POST DENITRIFICATION The Nitrification stage is carried out by Nitrifyng Biofilters. The denitrification stage is accomplished by Post denitrification Biofilters. The influent first flows through Biofilter-N which ensures the biological removal of NNH4 and then through a Biofilter- PDN which ensures the removal of N-NO3. Only part of the flow is sent to the Biofilter- PDN to optimise (minimize) CH3OH consumption and to minimize NNO2 emission, as illustrated on the figure below. In the Biofilter process, the water passes through a low density media from the bottom to the top of the filter. Biomass develops on the media and allows for carbon and ammonia oxidation as well as nitrate reduction to gaseous nitrogen. Process air is distributed though coarse bubble aeration by perforated pipes located at the bottom of the filter. The air goes through the media and allows oxidation of the pollution (for the N filters). Nozzles are located on top of the filter and used to maintain the filtration media inside the filtration cell. Treated water is stored on top of the filter nozzle deck and is used for gravity backwash of the filters (no pumps needed for backwashing). Washing phases include alternating air scouring and water backwashes, and are typically performed at a maximum frequency of 24 hours, and up to 72 hours. For the PDN Biofilter, backwash frequency is allowed to be higher (up to 12 hours). Backwash water from the BAF are stored into backwash tanks, before being pumped and thickened in two existing secondary clarifiers and then pumped back to the BAF inlet.

WINNIPEG SEWAGE TREATMENT PROGRAM
SEWPCC PROCESS SELECTION REPORT – PART III Page 102 of 193
PSR_rev final – July 2011
a. BIOFILTER-N
� SIZING OF THE BIOFILTER-N The velocity is calculated on N-1 filters in operation (one cell in backwash).
Parameters Units Values
Number u 6
Filter Area m2
147
Filter Length m 14
Filter width m 10.5
Media characteristics (Ø) mm 4
Media depth m 3.5
Media volume per filter m3
515
Media Total volume m3 3 087
Applied loads: - N to nitrify kg/m3.j 0,71
Average filtration velocity on N cells m/h 9.3
Peak velocity on N-1 filters during operation m/h 11.2
Wash water for one filter m3
1 286
Daily dirty wash waters m3/d 7 717
Table 69: Biofilters-N characteristics – option 3
� EXPECTED OUTLET WATER QUALITY Outlet water characteristics from Biofilter-NIT to Biofilter-PDN are
DESIGN YEARLY AVG
COD mg/l 60 66
BOD5 mg/l 16 16
TSS mg/l 16 16

WINNIPEG SEWAGE TREATMENT PROGRAM
SEWPCC PROCESS SELECTION REPORT – PART III Page 103 of 193
PSR_rev final – July 2011
NH4 mg/l 1.1 1.3
N-NO3 mg/l 11.4 10
TN mg/l 15 14
PT mg/l 1.6 1.3
Table 70: Expected biofilters-N outlet water quality 1/2 – option 3
Recirculation of AS will be a maximum of 60 000 m3/d during spring (50% of spring max month inlet flow) and 88 000 m3/d during yearly average (100% of yearly average inlet flow).
Parameter Units Design
conditions
Yearly
average
Tot N-NO3 to denitrify recirculated to AS* Kg/d 772 961
Tot N-NO3 inlet in AS mg/l 4.0 5.2
Tot N-NO3 outlet from AS mg/l 1.5 2.0
TN outlet from AS mg/l 16.5 14.6
Denitrification efficiency in AS % 62.5 61.5
Table 71: Expected biofilters-N outlet water quality 2/2 – option 3
* includes the Nitrifying Biofilter recirculation and the Biofilter N and PDN backwash water recycle.

WINNIPEG SEWAGE TREATMENT PROGRAM
SEWPCC PROCESS SELECTION REPORT – PART III Page 104 of 193
PSR_rev final – July 2011
� PROCESS AIR REQUIREMENT The air production is centralized using HV turbo. Flow distribution is controlled for each filter with a regulating valve.
Parameters Units Design case Max T (spring) Annual Average
OPEX estimation
Temperature °C 9 17 15
Target oxygen concentration (DO
level measured above nozzle
deck)
mg/l 6 6 6
Total Actual Oxygen requirement
(AOR) kg O2/d 11 200 10 000 9 000
Peak hourly AOR kg O2/h 650 600 540
Blower discharge pressure
requirement bars 1.0 1.0 1.0
Oxygen transfer rate in clean
water % 29.5 29.5 29.5
Average daily air flow rate Nm3/d 127 300 113 000 103 000
Peak hourly air flow rate Nm
3/d 7 350 6 800 6 100
Required air blower total capacity
(@ 1000 mbar discharge
pressure)
Nm3/d 7 500
Table 72: Biofilters-N process air requirement – option 3

WINNIPEG SEWAGE TREATMENT PROGRAM
SEWPCC PROCESS SELECTION REPORT – PART III Page 105 of 193
PSR_rev final – July 2011
� BACKWASH AIR SCOUR REQUIREMENT Backwash air scour is provided by the same centralized air blower system as used for process air, for both NDN & PDN filters, and is distributed within the filters using the same aeration grid located at the bottom of each filter (an air grid is installed into the PDN filters for this purpose).
Parameters Units Value
Air velocity Nm/h 12
Surface m2 147
Air flowrate Nm3/h 1 800
Table 73: Biofilters-N&PDN wash air requirement – option 3
� WASH WATER REQUIREMENT Filters are washed at a maximum of once per day, triggered by a timer or on headloss (clogging of the filter). The volume on top of the nozzle deck is the treated water reservoir, used for washing of both Biofilter-N & Biofilter-PDN. The dirty backwash water from the washing phase is stored in a dedicated backwash storage tank, located at the end of the filter gallery. The backwash storage tank capacity allows for full redundancy, meaning enabling operation of the plant with one backwash tank out of service. As a result, two backwash tanks are included, each allowing storage of one complete backwash cell (plus some safety), meaning 1,20 x volume of a backwash per tank. Treated water reservoir = 1540 m
3 X 2 tanks = 3080 m
3 total.
Two new tanks will be provided, each have full flexibility to operate as separate tanks, or as combined tanks (then acting as one large tank). Mechanical mixers are provided into each tank to prevent settling of the solids. This tank will be located in the BAF building.

WINNIPEG SEWAGE TREATMENT PROGRAM
SEWPCC PROCESS SELECTION REPORT – PART III Page 106 of 193
PSR_rev final – July 2011
b. BIOFILTER PDN
� SIZING OF THE BIOFILTER-PDN
Parameters Units Value
Number u 2
Filter Area m2
84
Filter Length m 14
Filter width m 6.1
Media characteristics (Ø) mm 4.5
Media depth m 2.5
Media volume per filter m3
210
Media Total volume m3 420
Applied loads: N-N03 kg/m3.d 0.81
Average filtration velocity m/h 7.5
Peak velocity on N-1 filters m/h 15
Wash water for one filter m3
525
Daily dirty wash waters m3/d 1 050
Table 74: Biofilters-PDN sizing – option 3

WINNIPEG SEWAGE TREATMENT PROGRAM
SEWPCC PROCESS SELECTION REPORT – PART III Page 107 of 193
PSR_rev final – July 2011
� EXPECTED OUTLET WATER QUALITY The combined outlet water characteristics from the Biofilter-PDN plus the PDN bypass (Biofilter N effluent) are:
Parameters Units Design conditions Yearly average
COD mg/l
55 60
BOD5 mg/l
15 15
TSS mg/l
15 15
NH4 mg/l 1 1
N-NO3 mg/l 9 9
TN mg/l 12 13
PT mg/l 1 1
Table 75: Expected biofilters-PDN outlet water quality – option 3
� AIR REQUIREMENT Air is required only for washing. The blower will be in common with nitrification.
� WASH WATER REQUIREMENT The back wash tank will be in common with the backwash tank for biofilter N.

WINNIPEG SEWAGE TREATMENT PROGRAM
SEWPCC PROCESS SELECTION REPORT – PART III Page 108 of 193
PSR_rev final – July 2011
� CHEMICAL REQUIREMENT
Methanol is injected in Post Denitrification Biofilter to complete the denitrification that takes place in the AS stage
Parameters Units Design case Annual Average
OPEX estimation
Effluent treated on PDN % 25 8
Pure CH3OH dosing mg/l 38 45
Pure CH3OH dosing Kg/d 1 150 300
Table 76: Biofilters-PDN chemical requirement – option 3
c. WASH WATER TREATMENT Backwash waters are collected in the backwash storage tank and sent back to the Activated sludge reactors along with the nitrate recycle stream.
IV.4.7 UV DISINFECTION FOR BNR LINE The design is the same for all options. Please refer to paragraph III.4.6 – Part III.
IV.4.8 DAILY AMMONIA LIMIT In the case of option 3, the daily ammonia limit requirement is met by treating 180 MLD in the BAF cells. Among these 180 MLD, 120 MLD are coming from the primary clarifiers and 60 MLD are diverted from the ballasted primary clarifiers from the CSO stream. This partial diversion allows a sufficiently low TSS concentration to be achieved at the entrance the BAF units in order not to accelerate the clogging of the filters that would lead to a decrease in the treatment performances.

WINNIPEG SEWAGE TREATMENT PROGRAM
SEWPCC PROCESS SELECTION REPORT – PART III Page 109 of 193
PSR_rev final – July 2011
IV.5 PROCESS CALCULATIONS – EXCESS FLOWS TREATMENT The CSO stream is the same for all options. Please refer to paragraph III.5 – Part III.
IV.6 PROCESS CALCULATIONS – SLUDGE HANDLING The main sludge characteristics for the design conditions are presented in the following table:
Parameters Design Load
Volatile Suspended
Solids (VSS)
Concentration Volume
Kg/day % g/l m3/d
Primary settler sludge
production 14 550 78 Extracted at 40 g/l 365
BNR sludge production 16 000 85
After onsite thickening at 25 g/l
640
CSO Sludge production-
spring max week 23 150 58
After onsite
thickening at 25 g/l 926
CSO Sludge production –
spring max day 62 500 65
After onsite
thickening at 25 g/l 2 500
Table 77: Sludge production summary for design conditions – option 3
The yearly average sludge production is presented in the table below:
Parameters Design Load
Volatile Suspended Solids (VSS)
Concentration Volume
Kg/day % g/l m3/d
Primary settler sludge
production 7 000 73 Extracted at 40 g/l 175
Secondary sludge production
(WAS) 12 000 84 After onsite thickening
at 25 g/l 480
Wet weather Ballasted
Primary Settler sludge 2 500 63 After onsite thickening
at 25 g/l 100
Total, yearly average 21 500 78 30 g/l 755
Table 78: Yearly average sludge production – option 3

WINNIPEG SEWAGE TREATMENT PROGRAM
SEWPCC PROCESS SELECTION REPORT – PART III Page 110 of 193
PSR_rev final – July 2011
IV.7 PROCESS REDUNDANCY APPROACH The maintenance philosophy for the option is explained below. A more detailed assessment of maintenance requirements will be completed during the detailed engineering phase. Process design for option selection allows for removal of process units for maintenance without affecting processes unstream or downstream of that process unit. The design allows for one process unit in each stage to be removed from service at any time without compromising effluent compliance. Primary clarifiers If one primary settler is out of service, the velocity will increase on the remaining three clarifiers. Chemical can be added in the remaining primary during this period. Activated Sludge If one biological reactor is out of service during winter, the activated sludge concentration can be increased. The aeration capacity in each tank will be sized to handle this situation. If one biological reactor is out of service during spring (design conditions), chemicals can be dosed on line in the primary clarifiers to reduce the TSS load in the biological reactors keeping to an acceptable concentration in the clarifiers. Aeration capacity for full flow will be installed in three reactors (more coarse bubble diffusers). Ballasted Primary Settler The design will allow for one wet weather Ballasted Primary Settler to out of service, with the other one dealing with the full flow at the higher velocity. Both Ballasted Primary Clarifiers are required for only one week per year. BIOFILTERS If one N cell is out of service, the Biofilters can still accept the higher velocities and loads. Washing will be more frequent and one mini washing can be done every day in addition to the usual situation. For the PDN Biofilter, two cells are provided to allow some redundancy. If one cell is off line, the remaining cell can be operated to its maximum hydraulic capacity and methanol dosage adjusted to allow sufficient DN to reach the effluent TN requirement. Backwash frequency can increase under such condition.

WINNIPEG SEWAGE TREATMENT PROGRAM
SEWPCC PROCESS SELECTION REPORT – PART III Page 111 of 193
PSR_rev final – July 2011
V. DESIGN REPORT FOR OPTION 4 -ooOoo-

WINNIPEG SEWAGE TREATMENT PROGRAM
SEWPCC PROCESS SELECTION REPORT – PART III Page 112 of 193
PSR_rev final – July 2011
V.1 DESIGN DATA The plant is design horizon is to the year 2031 for a population of 250,000 inhabitants.
V.1.1 DESIGN INFLUENT FLOWS Please refer to paragraph III.1.1 - PartIII.
V.1.2 DESIGN INFLUENT LOADS AND TEMPERATURE Please refer to Table 18: Seasonal flows – all options.
V.1.3 INLET WATER CHARACTERIZATION HYPOTHESIS Please refer to Table 19: Influent characterization – all options.
V.1.4 PERFORMANCE GUARANTEES Please refer to Table 20: Effluent guarantees – all options. V.1.5 SIMULATIONS The design case is based on the max month load (spring max month), with a minimum temperature of 9°C (minimum daily temperature). The most stringent case for air blower sizing is the spring max month loads but at a water temperature of 17 °C, rather than the summer max month at 19°C. The average annual flow, loads and temperature (15°C) are used for operation estimations.
V.1.6 SLUDGE HANDLING Primary sludge is thickened in the primary clarifiers and stored in tanks before being sent to the NEWPCC. Secondary sludge is thickened prior to be stored and sent to the NEWPCC. The design is based on liquid stream return from sludge processes at NEWPCC being totally handled at NEWPCC. V.1.7 TREATMENT LINE OVERVIEW The design includes a Chemically Enhanced Primary clarification (CEPT) step followed by a Biological Aerated Filter (BAF) allowing for a nutrient removal treatment train with a design capacity of 120 MLD. Effluent from the bioreactor is UV disinfected before final discharge. Flows between 120 MLD and 300 MLD are treated in a separate ballasted primary clarification system downstream of the headworks. This overflow is chemically disinfected using chlorine. Flows larger than 300 MLD are bypassed downstream of headworks and no guarantees is provided on this flow.

WINNIPEG SEWAGE TREATMENT PROGRAM
SEWPCC PROCESS SELECTION REPORT – PART III Page 113 of 193
PSR_rev final – July 2011
The figure on the next page illustrates the treatment lines. V.1.8 DESCRIPTION OF WASTEWATER TREATMENT The main steps of for the SEWPCC treatment process are listed here below:
Headworks
- Raw water pumps - Fine screens (6 mm punched-holes) - Grit removal
Biofiltration line (120 MLD)
- 3 existing Primary clarifiers + 1 new (coagulant will be added to all four clarifiers) - 1 new set of eight cells, NDN biofilter - 1 new set of two cells, post-DN biofilter - 1 new backwash storage tank - 3 existing secondary clarifiers for clarification of the backwash water; - UV treatment
Excess Flows line
- Ballasted Primary clarification (2 units) - Chemical disinfection
V.1.9 DESCRIPTION OF SLUDGE TREATMENT
- Thickening of Ballasted Primary Settler sludge - Storage tanks - Truck loading facilities
V.1.10 DESCRIPTION OF ODOUR TREATMENT The new works will be connected to the odour control system, which consists of a dispersion stack without treatment.
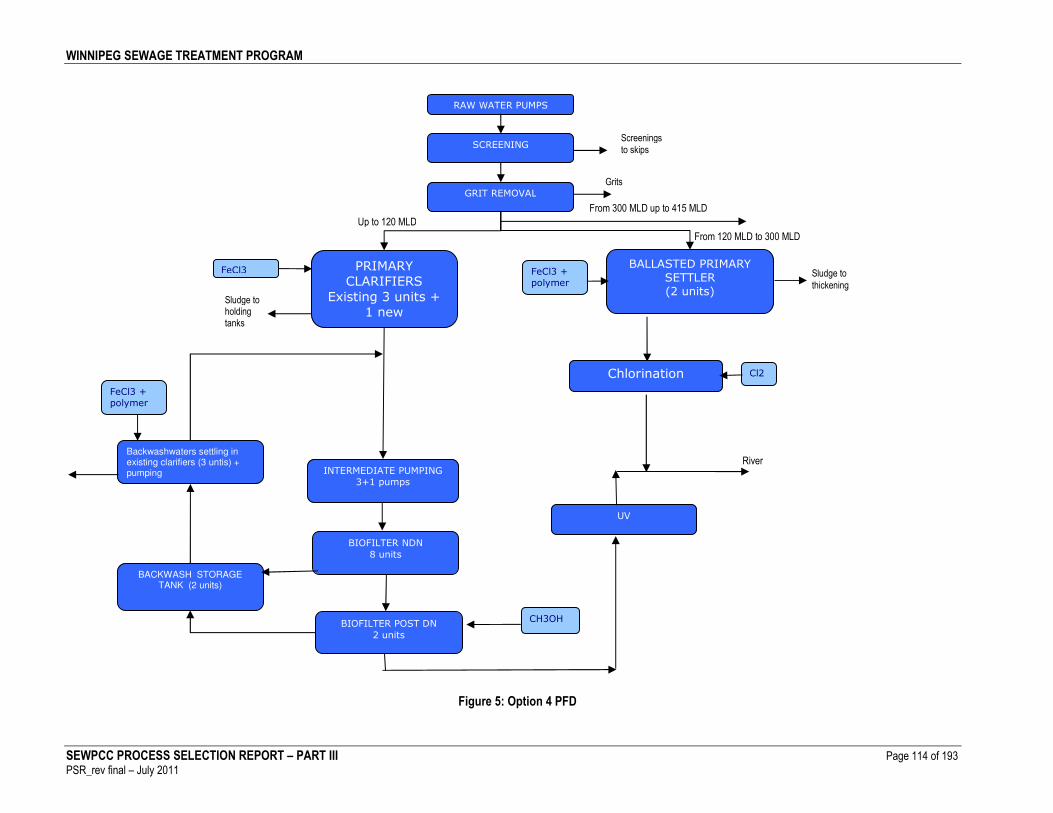
WINNIPEG SEWAGE TREATMENT PROGRAM
SEWPCC PROCESS SELECTION REPORT – PART III Page 114 of 193
PSR_rev final – July 2011
Figure 5: Option 4 PFD
From 120 MLD to 300 MLD
Up to 120 MLD
UV
BALLASTED PRIMARY SETTLER (2 units)
RAW WATER PUMPS
SCREENING
GRIT REMOVAL
PRIMARY
CLARIFIERS
Existing 3 units +
1 new
INTERMEDIATE PUMPING
3+1 pumps
BIOFILTER NDN
8 units
BIOFILTER POST DN
2 units
CH3OH
Backwashwaters settling in existing clarifiers (3 untis) + pumping
BACKWASH STORAGE TANK (2 units)
FeCl3
River
From 300 MLD up to 415 MLD
FeCl3 +
polymer
Screenings
to skips
Grits
Sludge to holding tanks
Sludge to
thickening
FeCl3 +
polymer
Chlorination Cl2

WINNIPEG SEWAGE TREATMENT PROGRAM
SEWPCC PROCESS SELECTION REPORT – PART III Page 115 of 193
PSR_rev final – July 2011
V.2 PROCESS CALCULATIONS - HEADWORKS Headworks upgrade / expansion will be the same for all options.
V.3 PROCESS CALCULATIONS – BNR TREATMENT
V.3.1 DESIGN CAPACITY The CEPT + BAF treatment line, including primary and secondary treatment is designed for the following flows. Peak hydraulic flows are handled by the excess flow treatment line
Parameters Units
Max daily flow m³/d 120 000
Max hydraulic flow m³/h 5 000
Table 79: BNR treatment line design capacity – option 4
The design loads are based on the spring max month loads given in Table 18: Seasonal flows – all options.
V.3.2 PRIMARY SETTLING a. INLET WATER QUALITY Please refer to Table 19: Influent characterization – all options. b. SIZING OF THE PRIMARY CLARIFIERS The existing primary clarifiers are reused to act mainly as FOG / scum removal as well as removal of settleable solids and TP removal (through coagulation). One new clarifier is added. Coagulant (ferric chloride) will be added to the primaries to enhance P precipitation. The primary treated effluent will then go to BAF.
Parameters Units
Type of clarifiers - Gravity, rectangular, non
lamellar
Chemical injection - YES
Total area of the settling zone m² 2 410
Peak velocity m/h 2.07
Table 80: Design of the primary clarifiers – option 4

WINNIPEG SEWAGE TREATMENT PROGRAM
SEWPCC PROCESS SELECTION REPORT – PART III Page 116 of 193
PSR_rev final – July 2011
c. EXISTING AND NEW WORKS The design allows the reuse of the existing primary clarifiers plus construction of a new unit.
Parameters Units Existing 1 &2 Existing 3 New 4
Number 2 1 1
Settling tank width m 9.1 19.2 9.1
Settling tank length m 51.8 51.8 51.8
Area of the settling zone /unit m² 472 995 472
Total area of the settling zone m² 1 940 472
Total area of the settling zone m² 2 410
Total water depth m 4.3* 4.3* 4.3*
Table 81: Arrangements for primary settling – option 4
* From drawings Chemical will be added to the 4 primary clarifiers (upstream primary clarification, in the pre-treatment zone).

WINNIPEG SEWAGE TREATMENT PROGRAM
SEWPCC PROCESS SELECTION REPORT – PART III Page 117 of 193
PSR_rev final – July 2011
d. EXPECTED EFFICIENCY OF THE PRIMARY SETTLING
Parameters Units DESIGN YEARLY AVG
Expected Removal Efficiency
COD % 36.5 44
BOD5 % 35 42
SS % 53.5 66
TKN % 12.1 14.5
Total P % 48.2 53.2
Ferric chloride dosage mg/L 40
Expected Settled Water Quality
COD mg/l 228.5 265
BOD5 mg/l 107 125
SS mg/l 73.5 62
TKN mg/l 29 34.5
Total P mg/l 2.6 3.0
COD kg/d 27 420 23 320
BOD5 kg/d 12 840 11 000
SS kg/d 8 820 5 456
TKN kg/d 3 480 3 036
Total P kg/d 312 264
Table 82: Expected performances for primary settling – option 4
The efficiencies on the primary clarifiers have been estimated from actual results on existing primary clarifiers, the quality of water (very diluted) with chemical addition.
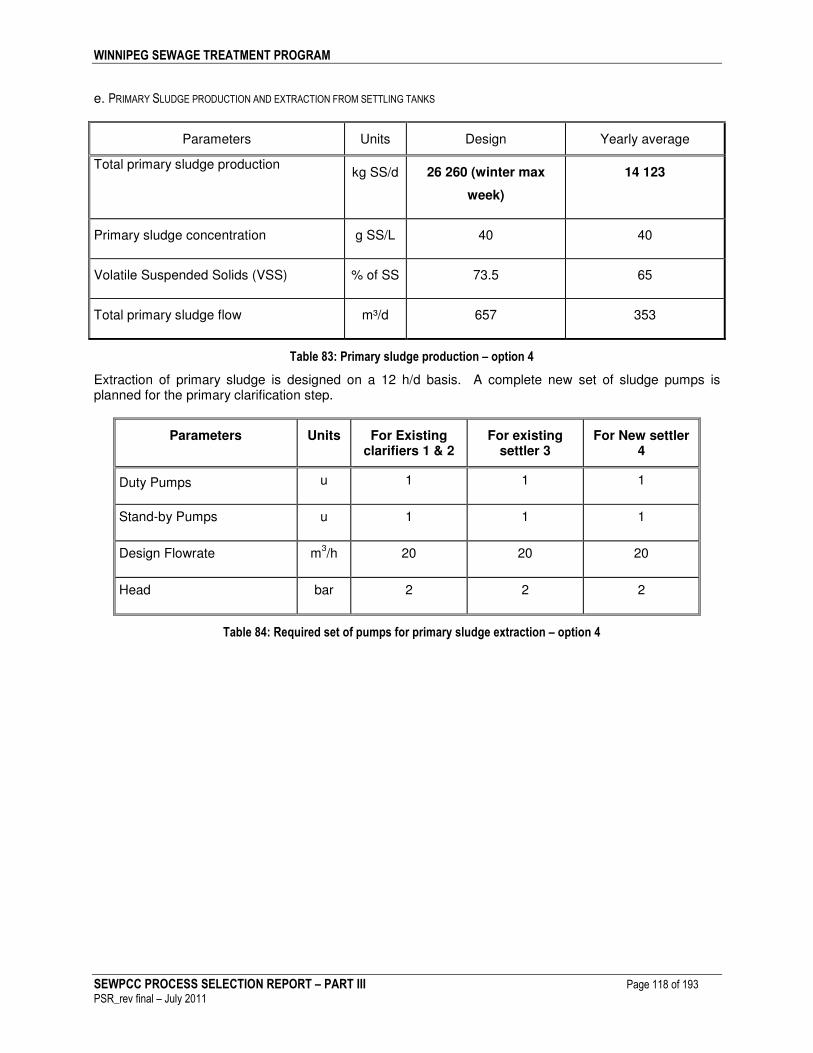
WINNIPEG SEWAGE TREATMENT PROGRAM
SEWPCC PROCESS SELECTION REPORT – PART III Page 118 of 193
PSR_rev final – July 2011
e. PRIMARY SLUDGE PRODUCTION AND EXTRACTION FROM SETTLING TANKS
Parameters Units Design Yearly average
Total primary sludge production
kg SS/d 26 260 (winter max
week)
14 123
Primary sludge concentration g SS/L 40 40
Volatile Suspended Solids (VSS) % of SS 73.5 65
Total primary sludge flow m³/d 657 353
Table 83: Primary sludge production – option 4
Extraction of primary sludge is designed on a 12 h/d basis. A complete new set of sludge pumps is planned for the primary clarification step.
Parameters Units For Existing clarifiers 1 & 2
For existing settler 3
For New settler 4
Duty Pumps u 1 1 1
Stand-by Pumps u 1 1 1
Design Flowrate m3/h 20 20 20
Head bar 2 2 2
Table 84: Required set of pumps for primary sludge extraction – option 4

WINNIPEG SEWAGE TREATMENT PROGRAM
SEWPCC PROCESS SELECTION REPORT – PART III Page 119 of 193
PSR_rev final – July 2011
V.3.3 INTERMEDIATE PUMPING New pumps are required to lift the primary clarification effluent to the Nitrification/Denitrification Biofiltration process stage.
Units
Duty pumps u 3
Stand-by pumps m 1
Design Flowrate m3/h 1 670
Head bar 0.5 (TBD)
Table 85: Intermediate pumping system – option 4
V.3.4 BIOFILTERS FOR NITRIFICATION AND POST DENITRIFICATION A first stage of biofilters is used to achieve nitrification + primary denitrification. This biofilter is based on a simultaneous nitrification / denitrification (NDN) operation, allowing nitrification of the incoming ammonia while providing denitrification using the incoming primary effluent carbon source. Remaining carbon is also removed within that biological treatment stage, so that treated effluent, low in BOD (COD), is nitrified and is partly denitrified. A final post-denitrification step is provided through another Biofilter, based on dosage of an external carbon source. Only part of the flow is sent on the Biofilter- PDN to optimise (minimize) CH3OH consumption and to minimize N-NOx emission, as illustrated on the figure below.
In the Biofilter process, the water passes through a low density media from the bottom to the top of the filter. Biomass develops on the media and allows for carbon and ammonia oxidation as well as nitrate reduction to gaseous nitrogen. Process air is distributed though coarse bubble aeration by perforated pipes located at the bottom of the filter. The air goes through the media and allows oxidation of the
BioFilter-NDN BioFilter-PDN
Q=100 %
Q=50 % design
Q=50% design
CH3OH
Effluent (nitrate)
recycle
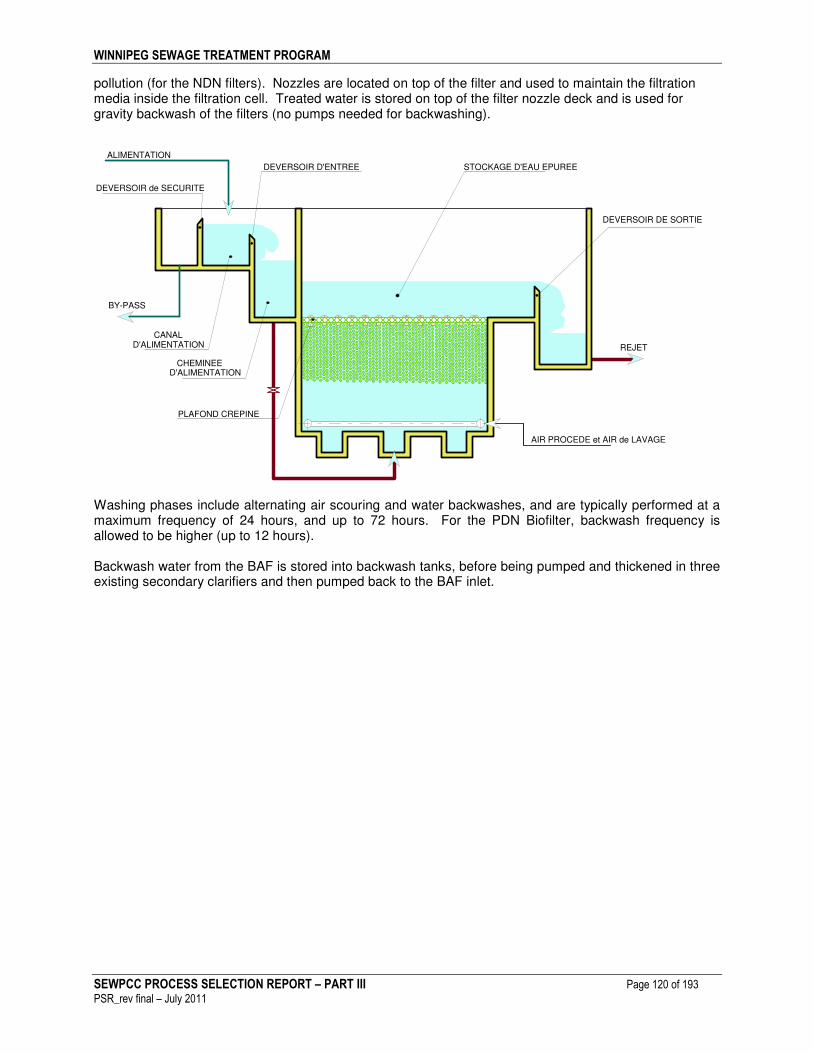
WINNIPEG SEWAGE TREATMENT PROGRAM
SEWPCC PROCESS SELECTION REPORT – PART III Page 120 of 193
PSR_rev final – July 2011
pollution (for the NDN filters). Nozzles are located on top of the filter and used to maintain the filtration media inside the filtration cell. Treated water is stored on top of the filter nozzle deck and is used for gravity backwash of the filters (no pumps needed for backwashing).
BY-PASS
ALIMENTATION
DEVERSOIR D'ENTREE
CHEMINEED'ALIMENTATION
REJET
DEVERSOIR DE SORTIE
AIR PROCEDE et AIR de LAVAGE
CANALD'ALIMENTATION
DEVERSOIR de SECURITE
PLAFOND CREPINE
STOCKAGE D'EAU EPUREE
Washing phases include alternating air scouring and water backwashes, and are typically performed at a maximum frequency of 24 hours, and up to 72 hours. For the PDN Biofilter, backwash frequency is allowed to be higher (up to 12 hours). Backwash water from the BAF is stored into backwash tanks, before being pumped and thickened in three existing secondary clarifiers and then pumped back to the BAF inlet.
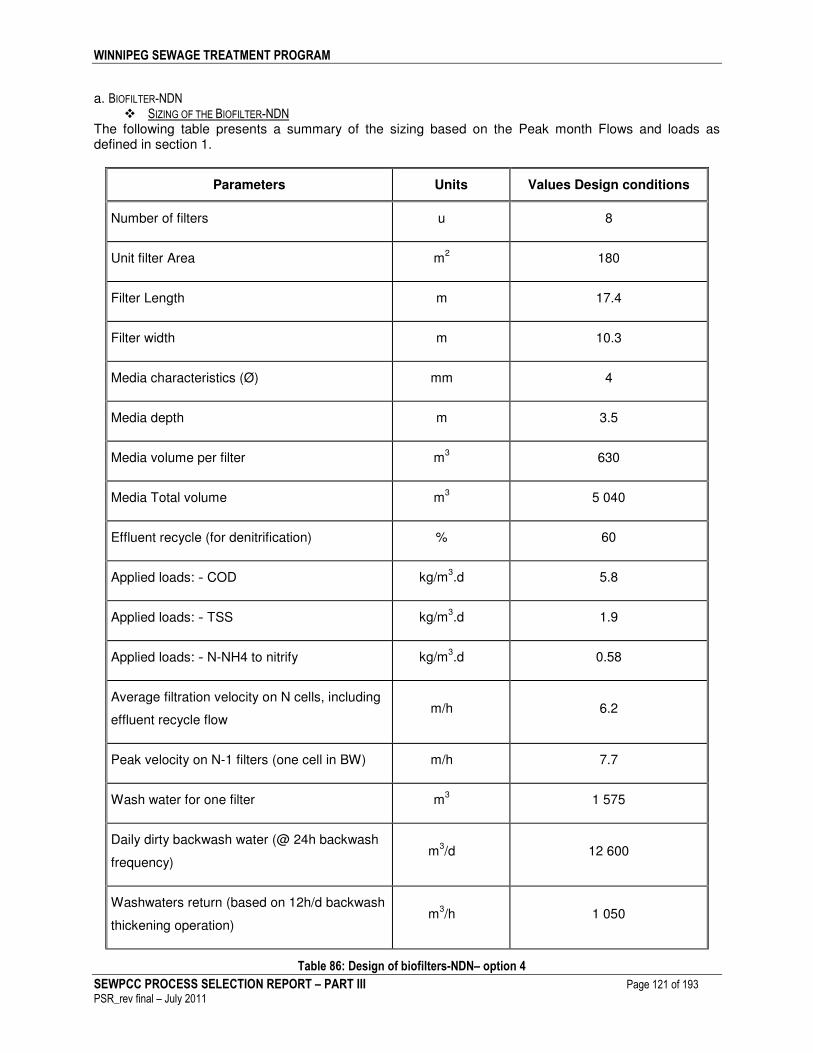
WINNIPEG SEWAGE TREATMENT PROGRAM
SEWPCC PROCESS SELECTION REPORT – PART III Page 121 of 193
PSR_rev final – July 2011
a. BIOFILTER-NDN
� SIZING OF THE BIOFILTER-NDN The following table presents a summary of the sizing based on the Peak month Flows and loads as defined in section 1.
Parameters Units Values Design conditions
Number of filters u 8
Unit filter Area m2 180
Filter Length m 17.4
Filter width m 10.3
Media characteristics (Ø) mm 4
Media depth m 3.5
Media volume per filter m3 630
Media Total volume m3 5 040
Effluent recycle (for denitrification) % 60
Applied loads: - COD kg/m3.d 5.8
Applied loads: - TSS kg/m3.d 1.9
Applied loads: - N-NH4 to nitrify kg/m3.d 0.58
Average filtration velocity on N cells, including
effluent recycle flow m/h 6.2
Peak velocity on N-1 filters (one cell in BW) m/h 7.7
Wash water for one filter m3 1 575
Daily dirty backwash water (@ 24h backwash
frequency) m
3/d 12 600
Washwaters return (based on 12h/d backwash
thickening operation) m
3/h 1 050
Table 86: Design of biofilters-NDN– option 4

WINNIPEG SEWAGE TREATMENT PROGRAM
SEWPCC PROCESS SELECTION REPORT – PART III Page 122 of 193
PSR_rev final – July 2011
� EXPECTED OUTLET WATER QUALITY
Effluent water characteristics from Biofilter-NDN are:
Parameters Units Design
conditions
COD mg/l 65
BOD mg/l 20
TSS mg/l 20
NH4 mg/l 4.0
N-NO3 mg/l 8.0
TN mg/l 15
PT mg/l 1.1
Table 87: Biofilters-NDN expected outlet water quality– option 4

WINNIPEG SEWAGE TREATMENT PROGRAM
SEWPCC PROCESS SELECTION REPORT – PART III Page 123 of 193
PSR_rev final – July 2011
� PROCESS AIR REQUIREMENT The air production is a centralized-type system and is based on turbo-type high efficiency blowers. Air flow distribution is controlled for each filter using a flowmeter + regulating valve system.
Parameters Units Design case Max T (spring) Annual Average
OPEX estimation
Temperature °C 9 17 15
Target oxygen concentration (DO
level measured above nozzle
deck)
m/l 4 4 4
Total Actual Oxygen requirement
(AOR) kg O2/d 13 800 15 800 13 750
Peak hourly AOR kg O2/h 896 1 027 1 060
Blower discharge pressure
requirement bar 1.0 1.0 1.0
Oxygen transfer rate in clean
water % 26 -29 26-29 24 - 28
Average daily air flow rate Nm3/d 160 600 184 270 168 160
Peak hourly air flow rate Nm
3/h 11 640 13 350 14 700
Required air blower total capacity
(@ 1000 mbar discharge
pressure)
Nm3/h 15 000
Table 88: Biofilters-NDN process air requirement– option 4
� BACKWASH AIR SCOURING REQUIREMENT Backwash air scour is provided by the same centralized air blowers system as for process air, for both NDN & PDN filters, and is distributed within the filters using the same aeration grid located at the bottom of each filter (an air grid is installed into the PDN filters for this purpose).

WINNIPEG SEWAGE TREATMENT PROGRAM
SEWPCC PROCESS SELECTION REPORT – PART III Page 124 of 193
PSR_rev final – July 2011
Parameters Units Value
Air scour velocity Nm/h 12
Surface m2 180
Air scour flowrate Nm3/h 2 160
Table 89: Biofilters-NDN wash air requirement– option 4
� WASH WATER REQUIREMENT Filters are washed at a maximum once a day, triggered by a timer or on headloss (clogging of the filter). The volume on top of the nozzle deck is the treated water reservoir, used for washing of both Biofilter-NDN & Biofilter-PDN. The dirty backwash water from the washing phase is stored in a dedicated backwash storage tank, located at the end of the filter gallery. The backwash storage tank capacity allows for full redundancy, enabling operation of the plant with one backwash tank out of service. As a result, two backwash tanks are included, each allowing storage of one complete cell backwash (plus some safety), meaning 1,20 x volume of a backwash per tank. =>Treated water reservoir = 1 890 m
3 X 2 tanks = 3 780 m
3 total.
Two new tanks will be provided, each with full flexibility to operate as separate tanks, or as combined tanks (which then act as one large tank). Mechanical mixers are provided into each tank to prevent settling of the solids. This tank will be located in the BAF building.
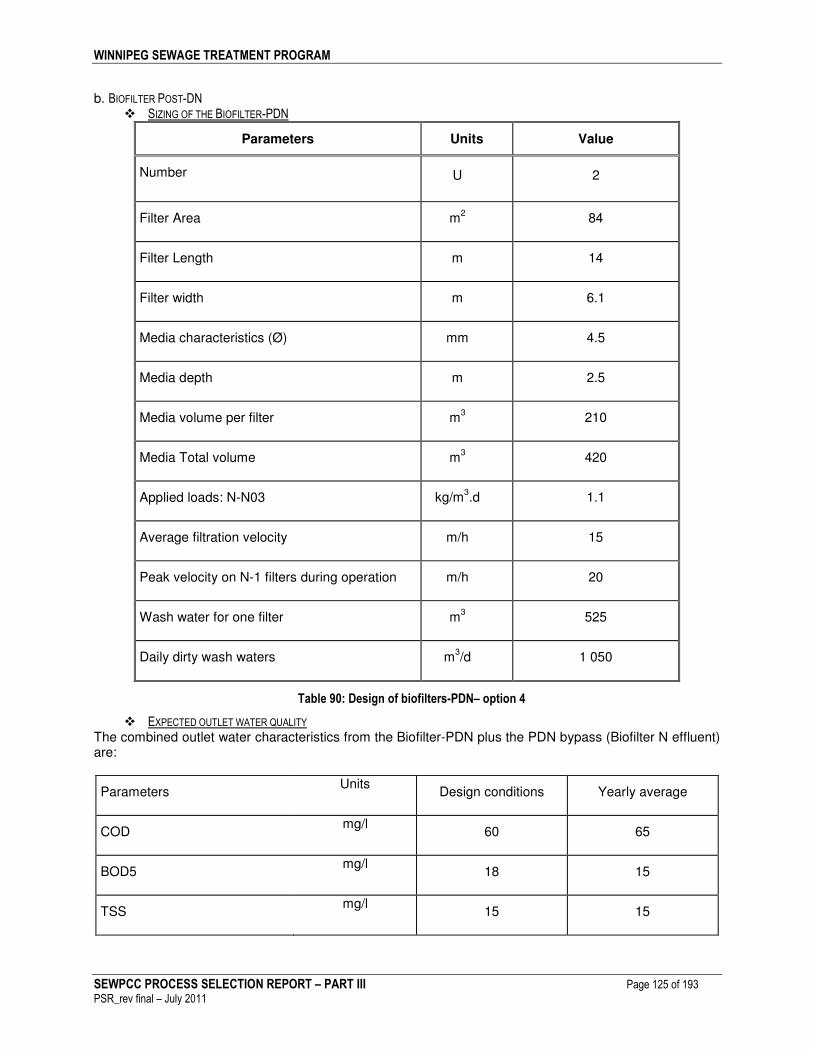
WINNIPEG SEWAGE TREATMENT PROGRAM
SEWPCC PROCESS SELECTION REPORT – PART III Page 125 of 193
PSR_rev final – July 2011
b. BIOFILTER POST-DN
� SIZING OF THE BIOFILTER-PDN
Parameters Units Value
Number U 2
Filter Area m2 84
Filter Length m 14
Filter width m 6.1
Media characteristics (Ø) mm 4.5
Media depth m 2.5
Media volume per filter m3 210
Media Total volume m3 420
Applied loads: N-N03 kg/m3.d 1.1
Average filtration velocity m/h 15
Peak velocity on N-1 filters during operation m/h 20
Wash water for one filter m3 525
Daily dirty wash waters m3/d 1 050
Table 90: Design of biofilters-PDN– option 4
� EXPECTED OUTLET WATER QUALITY The combined outlet water characteristics from the Biofilter-PDN plus the PDN bypass (Biofilter N effluent) are:
Parameters Units
Design conditions Yearly average
COD mg/l
60 65
BOD5 mg/l
18 15
TSS mg/l
15 15

WINNIPEG SEWAGE TREATMENT PROGRAM
SEWPCC PROCESS SELECTION REPORT – PART III Page 126 of 193
PSR_rev final – July 2011
NH4 mg/l 4 4
N-NO3 mg/l 7 8
TN mg/l 12 12
PT mg/l 1 1
Table 91: Expected outlet water quality of biofilters-PDN– option 4
� AIR REQUIREMENT Air is required only for washing as scouring air. The blower will be in common with the NDN Biofilter.
� WASH WATER REQUIREMENT The backwash tank will be shared with the Biofilter NDN backwash tank.
� CHEMICAL REQUIREMENT Methanol is dosed to sustain Post –Denitrification.
Parameters Units Design case Annual Average
OPEX estimation
Effluent treated on PDN % 50 15
Pure CH3OH dosing mg/l 2.45 21
Pure CH3OH dosing Kg/d 150 275
Table 92: Biofilters-PDN chemical requirement– option 4
c. WASH WATER TREATMENT Backwash water is treated separately on the three existing secondary clarifiers and the overflow is returned to the NDN BAF inlet. Existing clarifier characteristics:
Parameters Units Existing 1&2 Existing 3
Number of clarifiers 2 1
Diameter m 33.5 45.7
Area of the settling zone/unit m2 880 1 640

WINNIPEG SEWAGE TREATMENT PROGRAM
SEWPCC PROCESS SELECTION REPORT – PART III Page 127 of 193
PSR_rev final – July 2011
Total area of the settling zone m² 3 400
Table 93: Existing clarifiers’ characteristics– option 4
Parameters Units Design
Chemical injection (ferric chloride) mg/l 25
Max inlet flow m3/h 1 575
Daily average inlet flow m3/d 13 650
Peak hourly velocity m/h 0.5
Average hourly velocity m/h 0.2
Table 94: Washwater treatment characteristics– option 4
Sludge production from wash water treatment:
Parameters Load Concentration Occurrence
Kg/day g/l Days/year
Sludge production for washwater settling
design condition 10 900 25
Sludge production for washwater settling
yearly average 7 730 25 365
Table 95: Washwater Ballasted Primary Settler sludge production– option 4
V.3.5 UV DISINFECTION FOR BNR LINE The design is the same for all options. Please refer to paragraph III.4.6 – Part III.
V.3.6 DAILY AMMONIA LIMIT In the case of option 4, the daily ammonia limit requirement is met by treating 200 MLD in the BAF cells. Among these 200 MLD, 120 MLD are coming from the primary clarifiers and 80 MLD are diverted from the ballasted primary clarifiers from the CSO stream. This partial diversion allows a sufficiently low TSS concentration to be achieved at the entrance the BAF units in order not to accelerate the clogging of the filters that would lead to a decrease in the treatment performances.
V.4 PROCESS CALCULATIONS – EXCESS FLOWS TREATMENT The CSO stream is the same for all options. Please refer to paragraph III.5 – Part III.

WINNIPEG SEWAGE TREATMENT PROGRAM
SEWPCC PROCESS SELECTION REPORT – PART III Page 128 of 193
PSR_rev final – July 2011
V.5 PROCESS CALCULATIONS – SLUDGE HANDLING The main sludge characteristics for the design conditions are presented in the following table:
Parameters Design Load
Volatile Suspended
Solids (VSS)
Concentration Volume
Kg/day % g/l m3/d
Primary settler sludge
production
26 260 73.5 Extracted at 40 g/l 657
Backwash water clarifier
sludge production
10 900 88 Extracted at 25 g/l 436
CSO Sludge production-
spring max week
23 120 58 After onsite
thickening at 25 g/l 926
CSO Sludge production-
spring max day
62 500 65 After onsite
thickening at 25 g/l 2 500
Table 96: Sludge production summary for design conditions– option 4
The yearly average sludge production is presented in the table below:
Parameters Design
Load
Volatile Suspended
Solids (VSS)
Concentration Volume
Kg/day % g/l m3/d
Primary settler sludge
production
14 123 65 Extracted at 40 g/l 352
Backwash water clarifier
sludge production
7 730 90 Extracted at 25 g/l 309
Wet weather Ballasted
Primary Settler sludge
2 500 63 After onsite thickening
at 25 g/l 100
Total, yearly average 24 353 73 34 g/l 761
Table 97: Yearly average sludge production – option 4
WINNIPEG SEWAGE TREATMENT PROGRAM
SEWPCC PROCESS SELECTION REPORT – PART III Page 129 of 193
PSR_rev final – July 2011
V.6 PROCESS REDUNDANCY APPROACH The maintenance philosophy for the option is explained below. A more detailed assessment of maintenance requirements will be completed during the detailed engineering phase. Process design for option selection allows for removal of process units for maintenance without affecting processes unstream or downstream of that process unit. The design allows for one process unit in each stage to be removed from service at any time without compromising effluent compliance. Primary clarifiers If one primary settler is out of service, the velocity will increase on the remaining three clarifiers. In order to maintain the same cycle duration operation of the BAFs, more chemicals can be added to the remaining primaries during this period, or one of the Ballasted Primary Clarifiers can be used for part of the flow. Two Ballasted Primary Clarifiers will provided that will work only during one month of the year so thank to their quick start up they are available for different applications. BIOFILTERS For the NDN Biofilter, if one cell is out of service, the Biofilters can still accept the higher velocities and loads. The washing will be more frequent and it may be necessary that one additional mini-backwashing will be performed from time to time, in conditions close to the maximum month load. For the PDN Biofilter, two cells are provided to allow some redundancy. If one cell is off line, the remaining cell can be operated to its maximum hydraulic capacity and methanol dosage adjusted to allow sufficient DN to reach the effluent TN requirement. Backwash frequency can increase under such condition. Washwater clarifiers If one clarifier is out of service, the velocities on the remaining two clarifiers will increase; there will be no impact under this condition because of the very low velocity on these existing clarifiers. The washwater can also be pumped at a lower rate out of the backwash storage tanks, allowing the reduction of the clarification velocity over the remaining clarifiers in operation. Ballasted Primary Settler If one wet weather Ballasted Primary Settler is out of service, the other one will manage the full flow at higher velocities with a slight increase in chemical dosage, as well as a slight deterioration of the effluent quality.
PART IV – COMPARISON PROCESS DEFINITION
WINNIPEG SEWAGE TREATMENT PROGRAM
SEWPCC PROCESS SELECTION REPORT – PART IV Page 131 of 193
PSR_rev final – July 2011
I. COMPARISON CRITERIA -ooOoo-

WINNIPEG SEWAGE TREATMENT PROGRAM
SEWPCC PROCESS SELECTION REPORT – PART IV Page 132 of 193
PSR_rev final – July 2011
I.1 GENERAL It is clearly acknowledged by the Program that estimates of capital and operations costs can not be the only criteria for comparison of the pre-selected options. Consequently, a project specific list of comparison criteria was set up for meeting the two following goals:
To ensure a comprehensive coverage of themes which have to be considered for an effective comparison of the options and
To ensure that all the criteria can be scored effectively with the information available at this stage of the study
I.2 CATEGORIES OF CRITERIA The Program has considered the following four categories of criteria:
Process category includes criteria related to the ability of each option to meet the treatment objectives
Constructability category includes criteria related to the ease of construction of each option
Operation category includes criteria related to the ease of operation and maintenance of each option and
Monetary category includes criteria related to the CAPEX, OPEX and Whole Life Cost of each option (financial)
I.3 LIST OF CRITERIA Twenty one criteria were identified and associated to the four categories.

WINNIPEG SEWAGE TREATMENT PROGRAM
SEWPCC PROCESS SELECTION REPORT – PART IV Page 133 of 193
PSR_rev final – July 2011
CriteriaSubcriteria
(indicative)Category
1 Ability to meet all the license requirements Process
2 Reliability and risk of failure Process
3 Redundancy / Availability of the plant Process
4
Sensitivity of operation and cost to the sew age
quality (short term variability) Process
5 Ability to operate at low DWF (diurnal) Process
6 Ability to accomodate WWF Process
7
Track records in similar climate / confidence in the
technology Process
8 Flexibility regarding denitrif ication Process
9
Flexibility to upgrade to more stringent requirements
(TN&TP, WWF, disinfection) Process
10 Expandability / modularity Constructability
11 Ease of construction Constructability
11 1 Land constrainst Constructability
11 2 Construction phasing Constructability
11 3 Constructability Constructability
11 4 Ease of start-up / commissioning Constructability
12 Environmental impact / sustainability Constructability / operation
12 1 Fugitive emission Constructability / operation
12 2 Odour at plant boundary Constructability / operation
12 3 Noise at plant boundary Constructability / operation
12 4 Truck traf ic Constructability / operation
13 Construction duration Constructability
14 Ease of operation Operation
14 1 Process standardization Operation
14 2
Number of protocols (process units,
equipments) Operation
14 3 Automation Operation
15 Ability to recover Phosphorus Operation / Process
16 Ease of maintenance Operation
17 Operator safety Operation
17 1 Confined space Operation
17 2 Odour inside the plant Operation
17 3 Noise inside the plant Operation
17 4 Explosion risk Operation
17 5 Chemical release Operation
18 Carbon foot print Monetary
18 1 Construction Monetary
18 2 Operation Monetary
19 Capital cost Monetary
20 Operating cost Monetary
21 Whole life cost Monetary
N°
Table 98: List of comparison criteria
The Program has assessed that 21 criteria, in 4 categories will provide a comprehensive comparison of the process options.

WINNIPEG SEWAGE TREATMENT PROGRAM
SEWPCC PROCESS SELECTION REPORT – PART IV Page 134 of 193
PSR_rev final – July 2011
I.4 CRITERIA DEFINITION
1. Ability to meet all the license requirements Options capable of producing an effluent quality and operation conditions (odour, noise, etc...) that consistently meet the license requirements receive the most points. The license requirements considered are those presented in Table 15.
2. Reliability and risk of failure Consistent production of high quality effluent is a major requirement for wastewater treatment plants.. This criterion aims to characterize the global robustness of the process options through:
The internal robustness of the process (common malfunctions known on similar processes, …)
The ability to accommodate normal fluctuations in sewage quality (ability and ease of making changes to operational process parameters, etc.. )
The sensitivity of the treatment process to exceptional pollution and the remanence of any resulting dysfunctions and
The dependency of the plant to external factors such as dependence to any specific supplier for consumables, equipment or chemicals
The solution with the highest reliability and lowest risk of failure receives the higher mark.
3. Redundancy / availability of the plant In addition to the requirement for internal robustness of the process described above, this criterion promotes the option that provides the best redundancy in the process or equipment installed. The solution with the highest redundancy receives the higher mark.
4. Sensitivity of operation and cost to the sewage quality (short term variability) This criterion scores the ability of the process to accommodate change in sewage characterization through operational adaptability without major cost implications. Solutions which most easily lend themselves to operational adaptability with the lowest cost impact receive the highest mark.
5. Ability to operate at low DWF (diurnal) The SEWPCC license requires the plant to be designed for a wide range of flows and loads. The requirement to treat high wet weather flows and yet operate well during extended periods of dry weather flow (including low peaks at night) creates challenges for some options. The options that can accommodate extended low flow and loading events while minimizing operational challenges receive higher points.
6. Ability to accommodate WWF Extreme high wet weather peaks occur suddenly in Winnipeg, particularly during spring snowmelt and summer storm events. Spring snowmelt flows are also accompanied by sudden temperature decreases. These events require the treatment process to adjust quickly to increased flows and loads, especially in spring when flows traditionally jump from dry weather flow rates to high, coldwater snowmelt flows within one or two days. The processes that can accommodate these sudden flow increases and temperature decreases while minimizing operational challenges receive higher points.

WINNIPEG SEWAGE TREATMENT PROGRAM
SEWPCC PROCESS SELECTION REPORT – PART IV Page 135 of 193
PSR_rev final – July 2011
7. Track records in similar climate / confidence in the technology Most of the processes considered have a track record in Canada, the USA or Europe which definitely strengthen the reliability of the proposed processes. Instead of counting the similar references for each technology, it is acknowledged that this criterion should reflect confidence in the technologies and the process unit’s configuration. The higher score are assigned to options attracting the best degree of confidence in the experience of the scorer..
8. Flexibility regarding denitrification The Program is concerned by the possibility that the Regulator withdraws or reduces his requirement on total nitrogen. In that context any option which would present a flexibility to downgrade to less stringent requirements on TN presents a noticeable advantage. The highest score is given to the most flexible option in this regard.
9. Flexibility to upgrade to more stringent requirements (TN&TP, WWF, disinfection) The Program is concerned by the risk that the license becomes more and more stringent on TN, TP, WWF and disinfection before 2031. Thus the processes that can be easily modified to meet more stringent effluent criteria receive the highest points.
10. Expandability / modularity A significant amount of growth is predicted in the SEWPCC service area with potential for higher growth rates during the design period as well as future growth beyond the design period. Options that most readily lend themselves to expansion by adding process trains in the future to accommodate higher growth rates or populations beyond 2031 receive the most points.
11. Ease of construction This criterion contains four subcriteria which relate to the ease of construction, subcriteria are:
a. Land constraint: some options may require the acquisition of a new land. In addition to the direct cost of land acquisition (included in CAPEX) this can imply constraints (such as legal expropriation procedures) which can delay the construction works. This acquisition risk will be assessed via the analysis of the urban plan of the area (type of land and number of different current owners)
b. Construction phasing: the license will require the existing facility to remain in operation during construction. This complexity and risk in the required construction plan will depend on the specifics of each option
c. Constructability: the constructability of each option will be assessed through the possibility and extent of prefabrication of components of the works
d. Ease of start-up / commissioning: this project phase is difficult and presents more challenges for some options compared to others.
The option which presents the best ease of construction in terms of these subcriteria receives the higher mark.
12. Environmental impact / sustainability The purpose of a sewage treatment plant is to provide protection for the environment. Nevertheless some process options are more environmental friendly during construction as well as during operation.
a. Fugitive emission: this subcriteria aims to quantify the risk of pollution generated by a dysfunction of the plant in relation with the probability it occurs. For example the risk of chemical leakage, sludge emission, etc.outside the boundaries of the plant.
b. Odour at the plant boundaries c. Noise at the plant boundaries

WINNIPEG SEWAGE TREATMENT PROGRAM
SEWPCC PROCESS SELECTION REPORT – PART IV Page 136 of 193
PSR_rev final – July 2011
d. Traffic frequency: This subcriterion will sort the options regarding the road traffic they will create for sludge disposal, chemical consumption, etc…
Note: this criterion is not dealing with the footprint of the plants as it is assumed by the Program that most of them are the same. Indeed, all the solutions require construction of new process buildings which will take place behind the existing buildings. Thus they won’t be visible from the nearest houses to the North nor from the perimeter highway. Consequently, it is assumed that the footprint of the additional buildings will all be the same.
13. Construction duration The new license requirements will come into force on Dec 31
st, 2012 which gives less than two years for
the Program to deliver the works. This period is challenging and the construction duration is an important criterion. In that context, the option with the shortest construction duration presents an advantage and shall receive a score of 10.
14. Ease of operation Operational complexities can result from operational procedures to handle fluctuation in flows and loads, multiple numbers of unit processes, etc... Options with the more complex processes, either from a process, hydraulic, mechanical or instrumentation and control point of view, will receive a lower score. The option with the easiest expected operation will receive the highest score. For indication, this criterion has been broken down as follows:
a. Process standardization b. Number of existing protocols (process units, equipments) c. Automation
15. Ability to recover Phosphorus
The Program is concerned by the ability of recovering Phosphorus from the wastewater, thus the options are scored regarding this criterion. The options with the best phosphorus recovery rate will receive the highest score.
16. Ease of maintenance The extent of the requirement for maintenance is related to the amount of mechanical equipment. The more pieces and extent of different types of equipment (for common unit processes) increase maintenance requirements (i.e. routine maintenance, stocking spare part, etc.). The least mechanical complex processes receive the highest score in this category and those requiring multiple mechanical pieces of equipment with significant routine adjustment and preventive maintenance receive the lowest score. The scorers also pay attention to the type of material used and the corrosion sensitivity.
17. Operator safety Some treatment processes, although designed with operator safety as a priority, contain inherent risks to the operating staff. Unit processes that minimize any potential operational safety risks receive higher points. For indication, this criterion is broken down as follows:
a. Confined space b. Odour inside the plant c. Noise inside the plant d. Explosion risk e. Chemical release
WINNIPEG SEWAGE TREATMENT PROGRAM
SEWPCC PROCESS SELECTION REPORT – PART IV Page 137 of 193
PSR_rev final – July 2011
18. Carbon footprint Sustainability is an important concern to the Program; all the options are assessed regarding their carbon footprint both during construction and for operation. The calculated carbon emissions are expressed in tonnes of CO2. The highest score is given to the option with the lowest carbon footprint, scores for the other options are calculated on a prorated basis.
19. Capital cost (CAPEX)
The capital cost or CAPEX is the cost of developing and providing non-consumable parts for each option. The financial evaluation of CAPEX is detailed in section 0 of this report. The option with the lowest CAPEX cost receives a score of 10 with the other options scoring as follows:
SCn=10 x (1-(Cn-Cb)/(Cb))
With:
SCn the score for option n
Cb the lowest CAPEX value
Cn the CAPEX value of the option n
20. Operation cost (OPEX)
The operation cost or OPEX is the ongoing cost for running each option. The financial evaluation of OPEX is detailed in section in 0 of this report. The option with the lowest OPEX receives a score of 10 with the other options scoring as follows:
SOn=10 x (1-(On-Ob)/(Ob))
With:
SOn the score for option n
Ob the lowest OPEX value
On the OPEX value of the option n

WINNIPEG SEWAGE TREATMENT PROGRAM
SEWPCC PROCESS SELECTION REPORT – PART IV Page 138 of 193
PSR_rev final – July 2011
21. Whole life cost The financial evaluation of the options is done through three sub-criteria:
i) capital cost, ii) operation cost and iii) whole of life cost.
The most important of these is the whole life cost of the option which represents the total cost of the asset across the asset life and is the sum of construction costs plus 30 years operating costs. However, it is important to see how costs are distributed between CAPEX and OPEX, for that reason criteria #19 (CAPEX) and #20 (OPEX) are maintained. The whole life cost is assessed through the Net Present Value of the options. The details of the calculation are given further in section 0of this report.
The option with the lowest whole life cost receives a score of 10 and with the other options scoring as follows:
Wn=10 x (1-(Wn-Wb)/(Wb))
With:
Wn the score for option n
Wb the lowest whole life cost value
Wn the whole life cost value of the option n
WINNIPEG SEWAGE TREATMENT PROGRAM
SEWPCC PROCESS SELECTION REPORT – PART IV Page 139 of 193
PSR_rev final – July 2011
II. WEIGHTING PROCEDURE -ooOoo-

WINNIPEG SEWAGE TREATMENT PROGRAM
SEWPCC PROCESS SELECTION REPORT – PART IV Page 140 of 193
PSR_rev final – July 2011
The procedure for weighting the comparison criteria is an important step in process option selection as it allows the asset owner to apply business priorities to the option selection. For example, if the priority of the owner is to have a safety, reliable and 100% available plant, those three criteria would be weighted highly in order to enhance the corresponding options. As it is clearly a strategic step, the weighting procedure has been set up in such a way as to prevent the scorers from being influenced by those weighting the criteria or visa versa. The procedure is described below.
II.1 WEIGHTING AND SCORING PRINCIPLES As discussed, the weighting of the comparison criteria will influence the final result of the selection step. Consequently and to insure the impartiality of the process, the Program establishes the two following principles:
1. the weighting team and the scoring team shall be different and 2. they shall work in parallel, without receiving information from each other
II.2 WEIGHTING TEAM COMPOSITION The weighting methodology was set and carried out by the Program Management Team (MT).
II.3 WEIGHTING METHODOLOGY The following methodology was used for option weighting:
Individual weighting: each MT member independently weighted each category of criteria (Process, constructability, Operation and Monetary) and then weighted each individual sub-criterion.
Common discussion: the weightings proposed by each MT member were compared and discussed until a consensus view on the appropriate weightings was reached. In most cases an arithmetic average of each MT member’s weightings provided a general consensus prior to a sense check on the overall picture of weighting.
The weighting of the criteria was determined by the Management Team.

WINNIPEG SEWAGE TREATMENT PROGRAM
SEWPCC PROCESS SELECTION REPORT – PART IV Page 141 of 193
PSR_rev final – July 2011
III. SCORING PROCEDURE -ooOoo-

WINNIPEG SEWAGE TREATMENT PROGRAM
SEWPCC PROCESS SELECTION REPORT – PART IV Page 142 of 193
PSR_rev final – July 2011
III.1 SCORING TEAM COMPOSITION As the comparison criteria deal with several areas of expertise, the technical scoring team was divided into three groups as follows:
Group 1: process & constructability group: Nick Szoke (CoW), Dominika Celmer (CoW), Al Zaleski (CoW), Arnold Permut (CoW), Dwight Gibson (CoW), Antonella Fioravanti (VWS process expert), Kumar Upendrakumar (VWNA process expert), Daniel Lamarre (JMI process expert), Jean-Yves Bontonou and (VWS senior waste water manager) and Virginie Landragin (VWS commissioning manager)
Group 2: operation group: Ken Smyrski (CoW), Ron Hahlweg (CoW), James Hestad (VWNA O&M manager) and Jean D’Aries (VWS O&M expert).
Group 3: financial group: Management Team + Nick Szoke (CoW), Aymeric Simon (VWS)
The financial group’s action was limited to a risk & opportunity analysis as the scores for the financial criteria are calculated directly from the CAPEX, OPEX and whole life costs.
III.2 SCORING METHODOLOGY The scoring process followed the two following steps:
• Pre-scoring review of the options and • The real scoring step.
III.2.1 PRE SCORING SCAN The idea of going through a pre-scoring review comes initially from the opportunity of capitalizing on the EAP involvement on the project. Having some of the world best process specialists involved on the project during a one week workshop was an opportunity to capture their opinion on the pre-selected options with respect to the comparison table. However, as not all representatives of the scoring groups were in attendance at the workshop and it was required that all persons involved in the scoring groups scored objectively and with their own opinion, the EAP were only asked for unfigured scoring indications. This pre-scoring, the results of which are included in Appendix 4: Pre-scoring scan results, also gave some leads to the scoring teams members with respect to the scoring of process technologies they were not familiar with. III.2.2 FINAL SCORING The scoring was completed after the workshop, and separately by each group as follows:
o Action 1: appointment of a group leader responsible for the scoring process of his group: i) Group 1: Nick Szoke, ii) Group 2: Ken Smyrski and iii) Group 3: Aymeric Simon
Action 2: individual scoring
Action 3: presentation and discussion meeting for the individual scores to give the opportunity for discussion on the individual scoring
Action 4: update of the individual scoring and gathering of the results
The financial scoring follows a slightly different process, as detailed below.
The scoring is made by three independent thematic groups. The technical scoring groups were able to use information from the EAP workshop and the workshop pre-scoring when setting their scores.

WINNIPEG SEWAGE TREATMENT PROGRAM
SEWPCC PROCESS SELECTION REPORT – PART IV Page 143 of 193
PSR_rev final – July 2011
III.3 FINANCIAL SCORING
III.3.1 GENERAL Financial scoring is a critical aspect in evaluation of the process options. The financial scoring of the options involved an assessment of the CAPEX, OPEX and whole life costs of the options excluding risks and opportunities, followed by a separate risk and opportunity analysis.
As financial estimation of the project options is completed at an early stage of design, CAPEX and OPEX values are only given for purposes of comparing options and are expressed in “unit of cost”. As such, these option comparison costs can not be considered as a comprehensive assessment of the final project cost, target costs or budget prices.
III.3.2 CAPEX ESTIMATION a. BUILDUP OF CAPEX CAPEX estimates for the options were based on a pricing methodology used by Veolia Co. and available pricing of some of the works from Stantec’s previous studies, the Program has built up the CAPEX estimate in three main categories:
1. The M&E and civil work costs relating to the main process units and which are not common to all options, which include:
o Headworks
o Primary clarifiers
o Bioreactors
o Biofilters
o Secondary clarifiers
o CSO ballasted primary clarifiers
o Disinfection by chlorination
o Other mechanicals (intermediate pumping plants, …)
2. Common costs areas for which have been assessed with provisional sums, mainly based on Stantec’s previous pricing. These costs can either be common to all options or specific to one of them. Areas of common cost include:
o Site works
o UV disinfection
o Upgrade costs for reused works
o By-pass and outlet pipes
o Sludge storage
o Odour treatment
o Standy emergency power upgrade
o DAF sludge thickener
3. The ancillary costs assessed by the Program. They are:
o Site costs
o Contingencies for construction change orders

WINNIPEG SEWAGE TREATMENT PROGRAM
SEWPCC PROCESS SELECTION REPORT – PART IV Page 144 of 193
PSR_rev final – July 2011
o CAPEX risks and opportunities Consequently, the CAPEX pricing table is as follows:
OPTION 2 OPTION 3 OPTION 4
MECHANICAL EQUIPMENTS
HEADWORKS uc
PRIMARY CLARIFIERS uc
BIOREACTORS (IFAS prop. Tech. not included) uc
BIOREACTORS (IFAS prop. Tech.) uc
BIOFILTERS uc
SECONDARY CLARIFIERS uc
CSO BALLASTED PRIMARY CLARIFIERS uc
DISINFECTION - CHLORINATION uc
OTHER MECHANICALS uc
TOTAL M&E uc
CIVIL WORKS COSTS uc
GENERAL CONTRACTING uc
SITE WORKS uc
UV DISINFECTION uc
UPGRADE COSTS uc
BY-PASS AND OUTLET PIPES uc
SLUDGE STORAGE uc
ODOUR TREATMENT uc
STANDBY EMERGENCY POWER UPGRADE uc
AD
DIT
ION
AL
WO
RK
S -
PR
OV
ISIO
NN
AL
SU
MS
DAF SLUDGE THICKENER uc
SITE COSTS uc
CONTINGENCIES FOR CONSTRUCTION CHANGE ORDERS uc
CAPEX RISKS & OPPORTUNITIES
Risks uc
Opportunities uc
TOTAL CAPEX RISKS & OPPORTUNITIES uc
TOTAL CAPEX PROJECT VALUE uc
PR
ICIN
G I
TE
MS
AS
SE
SS
ED
SP
EC
IFIC
AL
LY
BY
TH
E P
RO
GR
AM
AD
DIT
ION
AL
WO
RK
S
CO
MM
ON
TO
AL
L
OP
TIO
NS
-
PR
OV
ISIO
NA
L S
UM
S
AN
CIL
LA
RIE
S C
OS
TS
AS
SE
SS
ED
BY
TH
E
PR
OG
RA
M
Table 99: CAPEX pricing table
b. PRICING PROCEDURE FOR M&E Project pricing can be completed in many ways and there are as many pricing tables as there are projects. However in general, estimates for option costs can be produced by benchmarking with similar projects and building up estimates into process units based on pricing of equipment lists. Benchmark pricing presents multiple advantages amongst which the most important are: accuracy, transparency and rapidity. However, these advantages depend on the quality of the benchmark used. Indeed to be effective a benchmark has to be done with similar and recent projects. Thus it is not always possible to use benchmark pricing, for example when reference projects are not easily comparable to the current project, in such cases it can be preferable to assess option costs through a second methodology. For SEWPCC, the Program was successful in finding appropriate benchmarks for the project items presented in Table 99. The reference projects used are indicated in the table.

WINNIPEG SEWAGE TREATMENT PROGRAM
SEWPCC PROCESS SELECTION REPORT – PART IV Page 145 of 193
PSR_rev final – July 2011
Items Reference projects
BIOREACTORS (IFAS prop. Tech.) RFP provided by JMI to Stantec on 08/29/2008 for SEWPCC
RFPs for the WWTP of Cornw all - Ontario, 2010. RFP from JMI and Degremont
RFP provided by JMI to Earthtech for NEWPCC on feb 2007
RFP provided by JMI to Stantec on 11/07/2006 for SEWPCC
Drinking w ater Actif lo executed in Portage la Prairie by JMI in 2001
BIOFILTERS
CSO BALLASTED PRIMARY CLARIFIERS
Table 100: Available benchmarks for SEWPCC
Details of the benchmark analysis are presented Appendix 5: Benchmark analysis details. Where benchmarking was not possible, the Program built up an estimatation of the price of the major items on the basis of a main equipment list, the price build up calculation is shown in the following table.
Option 2 Option 3 Option 4
Total equipment cost uc A Equi pment sel l i ng price
% 15.00% 15.00% 15.00% Appl ied on A
uc B
Electricity, Automation and Instrumentation uc variable variable variable
C
Based on the quotati on made by
VWS for each option and the rate
(pri ce of the concerned equipement
/ tota l M&E cost)
% 2.00% 2.00% 2.00% Appl ied on A + B + C
uc D
% 8.00% 8.00% 8.00% Appl ied on A + B + C + D
uc E
% 27.50% 27.50% 27.50% Appl ied on A + B + C
uc F
% variable variable variable Appl ied on A + B + C + D + E + F
uc G
% 15.00% 15.00% 15.00% Appl ied on A + B + C + D + E + F + G
uc H
TOTAL M&E DIRECT COSTS uc I A + B + C + D + E + F + G + H
% 15% 15% 15% Appl ied on I
uc J
% 5.00% 5.00% 5.00% Appl ied on J
uc K
% 10.00% 10.00% 10.00% Appl ied on I + J + K
uc L
TOTAL M&E INDIRECT COSTS uc M J + K + L
TOTAL M&E PROCESS UNIT #1 uc N M + I
Professional costs M&E
Contingencies on prof costs
General requirements (bonds, insurance, f inancial
and miscellaneous costs)
M&E PROCESS UNIT #1
M&E DIRECT COSTS
M&E INDIRECT COSTS
Interconnection piping and valves above ground
Spare parts
Transport
Mechanical installation
Mechanical Price inf lation (proc duration @ 2%/y)
Contingencies on direct costs
Table 101: Breakdown for M&E equipments pricing and calculation methodology
The calculation methodology is detailed on the right side of the table. Except for the EIC cost (Electrical, Instrumentation & Control) which is assessed by a project’s specific quotation, all the items are costed by application of a rate on the equipment costs. These applied rates originate either from data tested through other projects, or assessed by benchmarking of similar projects previously completed all around the world. For some specific process units, the rates were modified to better fit the specific situation of that process. This adjustment was made for instance for the “Mechanical installation” rate and for the item “Bioreactor IFAS proprietary technology”. Installing the IFAS media is less complex than installing pumps, blowers, etc, therefore the rate is reduced from 27.5% to 15%. The rate for installation of the Bioreactors (IFAS proprietary technology excluded) has been increased to 45% to reflect the complexity and the number of erection procedures for pumps, mixers, blowers, etc.

WINNIPEG SEWAGE TREATMENT PROGRAM
SEWPCC PROCESS SELECTION REPORT – PART IV Page 146 of 193
PSR_rev final – July 2011
c. PRICING PROCEDURE FOR CIVIL WORKS The civil works pricing is based on the application of standard unit rates to a simplified civil works bill of quantities (BOQ). The BOQ for each option is an account of the volume of concrete and the surface of building needed to erect the works. The unit rates assumed by the Program are as follows:
CAPEX unit rates
Civil w orks Source of information
Tank roofing cost */** 1280 $/m2 Ratio from concrete cost for AS
Building cost */** 1920 $/m2 Ratio from concrete cost for AS
Concrete cost for activated sludge ** 1500 $/m3 CoW (last day of process selection w orkshop)
Concrete cost for clarif iers or settling ** 1600 $/m3 Ratio from concrete cost for AS
Concrete cost for biof ilters and actif lo ** 1700 $/m3 Ratio from concrete cost for AS
Piling density 9 m2/pile Veolia
Piling unit cost 1250 $/pile Veolia
(*) : earthw orks, HVAC, electricity and f inition included
(**) : earthw orks included / deep foundation excluded
Table 102: Civil works unit rates
Note: without any information about the ground conditions on site, the Program has taken the reasonable assumption that the same type of foundations used in the existing plant shall be adapted for the extension works. The calculation methodology used for populating the BOQ is detailed in Appendix 6: Civil works bill of quantities methodology. The main assumptions for the calculations are:
o Wall thickeness: 0.4 to 0.5 m depending on the height of the wall
o Slab thickeness: 0.6 m
o Slab dimension: 1 m increase in length and width to ensure stability when the basin is empty and the groundwater level is high
CIVIL WORKS COSTS Option 2 Option 3 Option 4
Concrete uc Variable Variable Variable O
Building uc Variable Variable Variable P
% 15.00% 15.00% 15.00% Appl ied on O + P
uc Q
% 15.00% 15.00% 15.00% Appl ied on Q
uc R
% Variable Variable Variable Appl ied on O + P
uc S
% 15.00% 15.00% 15.00% Appl ied on O + P + S
uc T
% 8.00% 8.00% 8.00% Appl ied on O + P + Q + R + S + T
uc U
CIVIL WORKS COSTS V O+P+Q+R+S+T+U
General requirements
(bonds, insurance, f inancial
and miscellaneous costs)
Contingencies on quantities
Civil w ork Price inf lation
(constr duration @ 3%/y)
Contingencies on
Professional costs
Professional costs CW
Table 103: Breakdown for civil works pricing and calculation methodology

WINNIPEG SEWAGE TREATMENT PROGRAM
SEWPCC PROCESS SELECTION REPORT – PART IV Page 147 of 193
PSR_rev final – July 2011
d. PRICING PROCEDURE FOR PROVISIONAL SUMS The provisional sums are assessed by either an application of rates tested from other projects or by using existing cost estimates which were updated and adjusted for the Project. The existing cost estimates used originated from the Stantec CDR. The calculation methodology is presented in the following table.
Option 2 Option 3 Option 4
% 10% 10% 10%
uc W Appl ied on O + P + S + T + I
SITE WORKS uc X Stantec pri ce + 2% CPI + 15% engineering + 10% contingencies
UV DISINFECTION uc Y Stantec pri ce + 2% CPI + 15% engineering + 10% contingencies
UPGRADE COSTS
Headw orks upgrade (provisional sum) uc Z
Primary upgrade (provisional sum) uc AA
Secundary upgrade (provisional sum) uc AB
UPGRADE COSTS uc AC
BY-PASS AND OUTLET PIPES uc AD Stantec pri ce + 2% CPI + 15% engineering + 10% contingencies
SLUDGE STORAGE uc AE Stantec pri ce + 2% CPI + 15% engineering + 10% contingencies
ODOUR TREATMENT uc AF Stantec pri ce + 2% CPI + 15% engineering + 10% contingencies
STANDBY EMERGENCY POWER UPGRADE uc AG Stantec pri ce + 2% CPI + 15% engineering + 10% contingencies
DAF SLUDGE THICKENER uc AH Stantec pri ce + 2% CPI + 15% engineering + 10% contingencies
% Prorata constr
duration
Prorata constr
duration
8.00%
uc AI Appl ied on N + V + W + X + Y + AC + AD + AE + AF + AG + AH
% 10% 10% 10%
uc AJ Appl ied on N + V + W + X + Y + AC + AD + AE + AF + AG + AH + AI
CAPEX RISKS & OPPORTUNITIES
Risks uc AK
Opportunities uc AL
TOTAL CAPEX RISKS & OPPORTUNITIES uc AM
TOTAL CAPEX PROJECT VALUE uc AN N + V + W + X + Y + AC + AD + AE + AF + AG + AH + AI + AJ + AM
Refer to R&O Matrix
Stantec pri ce + 2% CPI + 15% engineering + 10% contingencies
Stantec
Stantec
Stantec
Stantec
SITE COSTS
GENERAL CONTRACTING
CONTINGENCIES FOR CONSTRUCTION CHANGE ORDERS
Stantec
Stantec
Stantec
Stantec
Stantec
Stantec
Table 104: Breakdown for provisional sums and calculation methodology
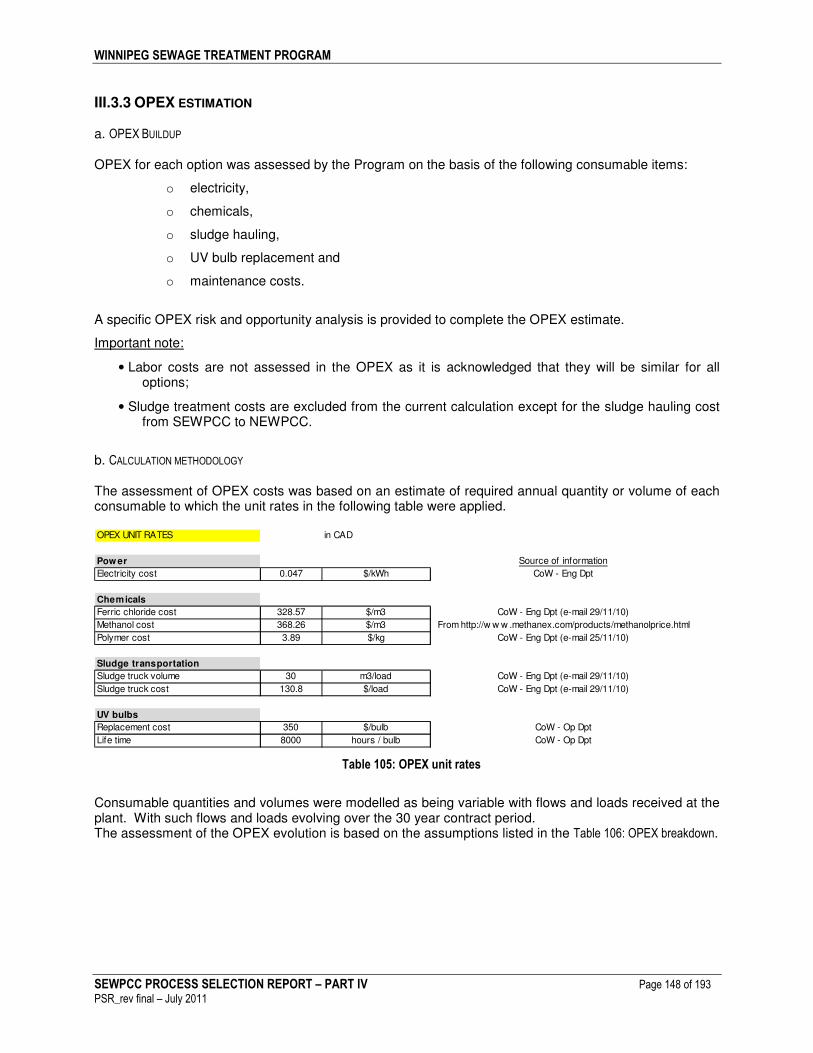
WINNIPEG SEWAGE TREATMENT PROGRAM
SEWPCC PROCESS SELECTION REPORT – PART IV Page 148 of 193
PSR_rev final – July 2011
III.3.3 OPEX ESTIMATION a. OPEX BUILDUP OPEX for each option was assessed by the Program on the basis of the following consumable items:
o electricity,
o chemicals,
o sludge hauling,
o UV bulb replacement and
o maintenance costs.
A specific OPEX risk and opportunity analysis is provided to complete the OPEX estimate.
Important note:
• Labor costs are not assessed in the OPEX as it is acknowledged that they will be similar for all options;
• Sludge treatment costs are excluded from the current calculation except for the sludge hauling cost from SEWPCC to NEWPCC.
b. CALCULATION METHODOLOGY The assessment of OPEX costs was based on an estimate of required annual quantity or volume of each consumable to which the unit rates in the following table were applied. OPEX UNIT RATES in CAD
Pow er Source of information
Electricity cost 0.047 $/kWh CoW - Eng Dpt
Chemicals
Ferric chloride cost 328.57 $/m3 CoW - Eng Dpt (e-mail 29/11/10)
Methanol cost 368.26 $/m3 From http://w w w .methanex.com/products/methanolprice.html
Polymer cost 3.89 $/kg CoW - Eng Dpt (e-mail 25/11/10)
Sludge transportation
Sludge truck volume 30 m3/load CoW - Eng Dpt (e-mail 29/11/10)
Sludge truck cost 130.8 $/load CoW - Eng Dpt (e-mail 29/11/10)
UV bulbs
Replacement cost 350 $/bulb CoW - Op Dpt
Life time 8000 hours / bulb CoW - Op Dpt
Table 105: OPEX unit rates
Consumable quantities and volumes were modelled as being variable with flows and loads received at the plant. With such flows and loads evolving over the 30 year contract period. The assessment of the OPEX evolution is based on the assumptions listed in the Table 106: OPEX breakdown.

WINNIPEG SEWAGE TREATMENT PROGRAM
SEWPCC PROCESS SELECTION REPORT – PART IV Page 149 of 193
PSR_rev final – July 2011
Evolution Proportiona l to
Raw water Linear Flow
Pretreatment Linear Flow
Primary treatment Linear Flow
Activated Sludge Linear DBO5
Biofi l tra tion Linear Flow
Tertia ry treatment Linear Flow
CSO ACTIFLO Linear Flow
Sludge Linear DBO5
Chemica ls Linear Flow
Uti l i ties Linear Constant pri ce
FeCl3- CSO -35 % , d=1,37 Linear Flow
Polymer - CSO -100 %, d=1,1 Linear Flow
FeCl3- P precipi tation -35 % , d=1,37 Linear Flow
Polymer - Sludge treatment -100 %, d=1,1 Linear Flow
Primary s ludge Linear Sludge
Secondary s ludge Linear Sludge
Acti flo wet weather s ludge Linear Sludge
Maintenance for equipment Linear Constant pri ce
UV bulbs Linear Flow
POWER
CHEMICAL
SLUDGE HAULING
OTHER OPEX COST
Table 106: OPEX breakdown

WINNIPEG SEWAGE TREATMENT PROGRAM
SEWPCC PROCESS SELECTION REPORT – PART IV Page 150 of 193
PSR_rev final – July 2011
III.3.4 NPV AND WHOLE LIFE COST NPV (Net Present Value) is a standard financial methodology which is used in the appraisal of long term projects to account for the time value of money. In an NPV analysis relevant project cash flows are identified and discounted back to its present value (PV) by application of an appropriate discount rate. The individual presesent value cash flows are then summed to obtain the NPV. Therefore the NPV is the sum of all terms,
Rt / (1+i)t , where:
t - the time of the cash flow (year) i - the discount rate (the rate of return that could be earned on an investment in the financial markets with similar risk) Rt - the net cash flow (the amount of cash, inflow minus outflow) at time t
For the SEWPCC project, the NPV of the three options was calculated based on the following assumptions, the discount rate and CPI rate were provided by the City finance team:
CPI
Discount rate
Duration Start End
Option 2
2% 6%
45 months construction + 30 years of operation
May 2015 May 2045
Option 3 46 months construction + 30 years of operation
June 2015 June 2045
Option 4 34 months construction + 30 years of operation
June 2014 June 2044
Table 107: NPV calculation assumptions
Note: Table 107: NPV calculation assumptions assumes no construction phasing is done. Some phasing scenarios have been set up and their impact on each option’s whole life cost is assessed and presented in Appendix 12: Assessment of options 2 and 4 possible delivery options.

WINNIPEG SEWAGE TREATMENT PROGRAM
SEWPCC PROCESS SELECTION REPORT – PART IV Page 151 of 193
PSR_rev final – July 2011
III.3.5 RISK AND OPPORTUNITY ANALYSIS a. RISK AND OPPORTUNITY IDENTIFICATION All risks and opportunities identified which are specific to a particular options were gathered by the Program and presented in a risk table. Risks that were common to all three options were not considered as they would not be relevant to selection between options. However risks which were applicable to two out of three options were considered as relevant to the option selection. In some cases although risks and opportunities may be common to all options they could affect one option more or less than another, in this case these risks were considered as specific to that particular option. b. RISK ASSESSMENT MATRIX A risk matrix was used to assess the identified risks and opportunities which analysed both the severity and likelihood of each risk or opportunityTable 108: Risk assessment matrix. An example of the risk assessment matrix is presented in Table 108: Risk assessment matrix. c. R&O COST ESTIMATION The most likely cost impact of the risks and opportunities were evaluated and integrated in the whole of life cost. The cost evaluation of the risks and opportunities was made by:
� Evaluating the likelihood of the risk occurring on a % basis. � Evaluating the severity of the impact of the risk on the basis of total financial / delay (i.e. how
much would it cost in total if the identified risk was to occur) � Multiplication of the likelihood and severity to produce a score for each risk, (cost weighted by
probablility of the risk occurrence before any mitigation measure) � For the most important risks, a mitigation plan was proposed with an assessment of the expected
result of this plan Separate R&O matrices were made for CAPEX and OPEX issues, although both follow the same methodology.
The preliminary R&O matrix identifies the specific risks and opportunities of the three preselected options, for the purpose of comparing options.
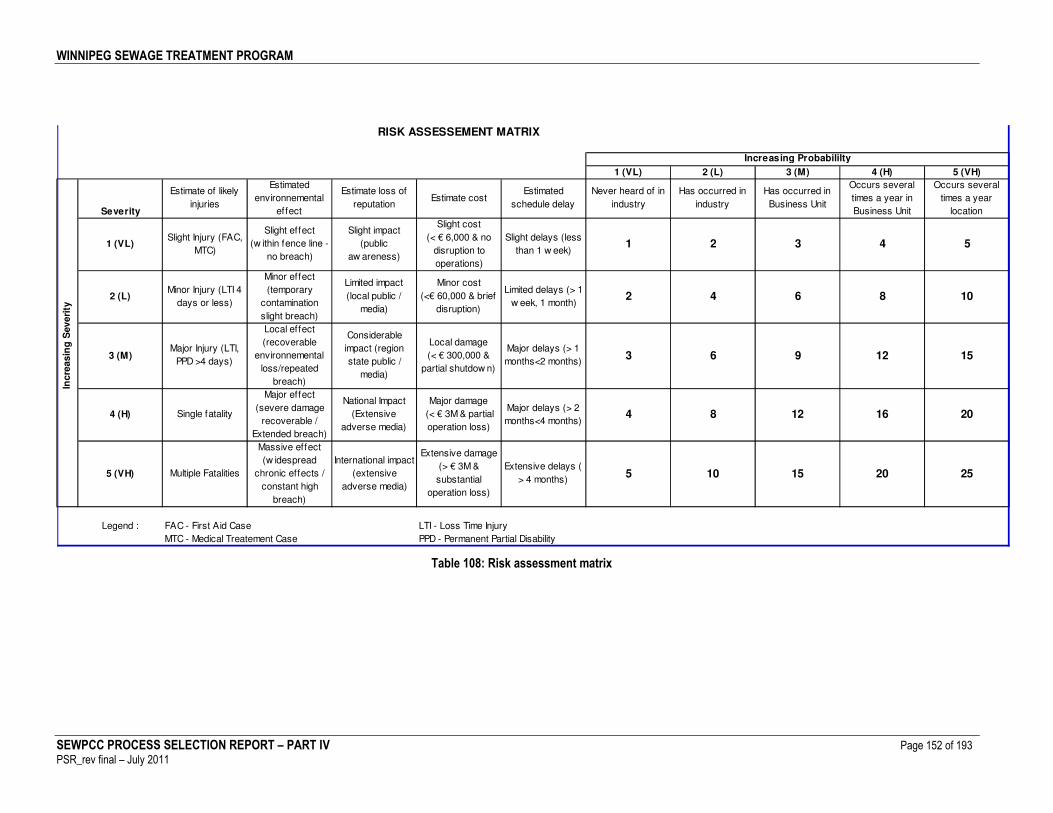
WINNIPEG SEWAGE TREATMENT PROGRAM
SEWPCC PROCESS SELECTION REPORT – PART IV Page 152 of 193
PSR_rev final – July 2011
RISK ASSESSEMENT MATRIX
1 (VL) 2 (L) 3 (M) 4 (H) 5 (VH)
Severity
Estimate of likely
injuries
Estimated
environnemental
effect
Estimate loss of
reputationEstimate cost
Estimated
schedule delay
Never heard of in
industry
Has occurred in
industry
Has occurred in
Business Unit
Occurs several
times a year in
Business Unit
Occurs several
times a year
location
1 (VL)Slight Injury (FAC,
MTC)
Slight effect
(w ithin fence line -
no breach)
Slight impact
(public
aw areness)
Slight cost
(< € 6,000 & no
disruption to
operations)
Slight delays (less
than 1 w eek)1 2 3 4 5
2 (L)Minor Injury (LTI 4
days or less)
Minor effect
(temporary
contamination
slight breach)
Limited impact
(local public /
media)
Minor cost
(<€ 60,000 & brief
disruption)
Limited delays (> 1
w eek, 1 month)2 4 6 8 10
3 (M)Major Injury (LTI,
PPD >4 days)
Local effect
(recoverable
environnemental
loss/repeated
breach)
Considerable
impact (region
state public /
media)
Local damage
(< € 300,000 &
partial shutdow n)
Major delays (> 1
months<2 months)3 6 9 12 15
4 (H) Single fatality
Major effect
(severe damage
recoverable /
Extended breach)
National Impact
(Extensive
adverse media)
Major damage
(< € 3M & partial
operation loss)
Major delays (> 2
months<4 months)4 8 12 16 20
5 (VH) Multiple Fatalities
Massive effect
(w idespread
chronic effects /
constant high
breach)
International impact
(extensive
adverse media)
Extensive damage
(> € 3M &
substantial
operation loss)
Extensive delays (
> 4 months)5 10 15 20 25
Legend : FAC - First Aid Case LTI - Loss Time Injury
MTC - Medical Treatement Case PPD - Permanent Partial Disability
Increasing Probabililty
Incre
asin
g S
everi
ty
Table 108: Risk assessment matrix

WINNIPEG SEWAGE TREATMENT PROGRAM
SEWPCC PROCESS SELECTION REPORT – PART IV Page 153 of 193
PSR_rev final – July 2011
III.4 THE SPECIFIC CASE OF THE CARBON FOOTPRINT SCORING
III.4.1 GENERAL In a context of climate change and decreasing resources, the reduction of global greenhouse gas emissions (GHG) is at the core of debates among international institutions, countries and companies. In order to address this issue in the most efficient way, Veolia Environment has committed to a Carbon Footprint approach, which aims to analyse and optimize the Greenhouse Gas emissions linked to solutions that are offered. It is important to consider the carbon footprint of a wastewater treatment process when assessing the sustainability of process alternatives. Veolia strives to provide solutions and technologies designed to improve the energy efficiency and to reduce the carbon emissions. A “carbon footprint” consists of the total amount of all GHG emissions caused directly or indirectly by an individual, an organisation, a product, an event, etc. The term of GHG encompasses several gases (carbon dioxide, methane, etc.) but always refers to a single unit, i.e. one metric ton of CO2 equivalent.
III.4.2 CARBON FOOTPRINT CALCULATION METHODOLOGY The carbon footprint of a project is made up of the sum of the primary footprint and the secondary footprint, also known as direct and indirect emissions. 1. The primary footprint is a measure of the direct emissions of CO2 from i) the burning of fossil fuels
(e.g. heating, transportation) during construction and operation, and ii) the process biological activity. 2. The secondary footprint is a measure of the indirect CO2 emissions from the whole lifecycle of
products the project is composed of, as well during construction and operation (emissions associated with their manufacture and eventual breakdown).
Thus the first step of a carbon footprint calculation is to realize the breakdown of a project into a list of tasks and elements for which an “emission factor” (EF) expressed in kg CO2 / unit is given in a specific database. The EF database used in SEWPCC is given in Appendix 7: CO2 emission factors database.

PART V - PROCESS SELECTION RESULTS

WINNIPEG SEWAGE TREATMENT PROGRAM
SEWPCC PROCESS SELECTION REPORT – PART V Page 155 of 193
PSR_rev final – July 2011
I. COMPARISON TABLE -ooOoo-

WINNIPEG SEWAGE TREATMENT PROGRAM
SEWPCC PROCESS SELECTION REPORT – PART V Page 156 of 193
PSR_rev final – July 2011
I.1 WEIGHTING OF THE CRITERIA The weighting of the comparison criteria decided by the Program’s Management Team is as follows:
CriteriaSubcriteria
(indicative)Category
Category Weight
Criteria
Weight
Overall
Weight
1 Ability to meet all the license requirements Process 0% 0%
2 Reliability and risk of failure Process 22% 7%
3 Redundancy / Availability of the plant Process 23% 8%
4
Sensitivity of operation and cost to the sew age
quality (short term variability) Process 0% 0%
5 Ability to operate at low DWF (diurnal) Process 12% 4%
6 Ability to accomodate WWF Process 12% 4%
7
Track records in similar climate / confidence in the
technology Process 17% 6%
8 Flexibility regarding denitrif ication Process 7% 2%
9
Flexibility to upgrade to more stringent requirements
(TN&TP, WWF, disinfection) Process 7% 2%
10 Expandability / modularity Constructability 30% 5%
11 Ease of construction Constructability 55% 9%
11 1 Land constrainst Constructability 0%
11 2 Construction phasing Constructability 20%
11 3 Constructability Constructability 10%
11 4 Ease of start-up / commissioning Constructability 25%
12 Environmental impact / sustainability Constructability / operation 5% 1%
12 1 Fugitive emission Constructability / operation
12 2 Odour at plant boundary Constructability / operation
12 3 Noise at plant boundary Constructability / operation 3%
12 4 Truck traf ic Constructability / operation 3%
13 Construction duration Constructability 10% 2%
14 Ease of operation Operation 34% 10%
14 1 Process standardization Operation
14 2
Number of protocols (process units,
equipments) Operation
14 3 Automation Operation
15 Ability to recover Phosphorus Operation / Process 13% 4%
16 Ease of maintenance Operation 34% 10%
17 Operator safety Operation 19% 5%
17 1 Confined space Operation
17 2 Odour inside the plant Operation
17 3 Noise inside the plant Operation
17 4 Explosion risk Operation
17 5 Chemical release Operation
18 Carbon foot print Monetary
18 1 Construction Monetary
18 2 Operation Monetary
19 Capital cost Monetary 20% 4%
20 Operating cost Monetary 30% 6%
21 Whole life cost Monetary 50% 11%
21%
N°
34%
17%
28%
Table 109: Weighting results

WINNIPEG SEWAGE TREATMENT PROGRAM
SEWPCC PROCESS SELECTION REPORT – PART V Page 157 of 193
PSR_rev final – July 2011
I.2 TECHNICAL SCORING RESULTS
I.2.1 GLOBAL RESULTS Based on the weighting presented above, the results of the technical scoring are as follows:
I. Option 4 with 728.6 points II. Option 2 with 660.28 points and III. Option 3 with 629.6 points
The details are given in Table 110: Technical scoring results hereinafter.

WINNIPEG SEWAGE TREATMENT PROGRAM
SEWPCC PROCESS SELECTION REPORT – PART V Page 158 of 193
PSR_rev final – July 2011
Criteria N. Szoke D. Celmer A. Permut A. Zaleski A. Fioravanti D. Lamarre K. Upendrakumar D. Gibson JY Bontonou V. Landragin K. Smyrski R. Hahlw eg J. Hestad J. D'Ariès Average scores Weight Weighted scores
Option 2 10 10 10 10 10 10 10 10 10 10.00 0.00
Option 3 10 10 10 10 10 10 10 10 10 10.00 0.00
Option 4 10 10 10 10 10 10 10 10 10 10.00 0.00
Option 2 10 10 10 10 8 7 8 9 8 8.89 66.49
Option 3 8 8 9 7.5 8 6 9 10 7 8.06 60.26
Option 4 9 7 7 5 9 8 10 9 9 8.11 60.67
Option 2 10 10 10 10 7 8 8 10 8 9.00 70.38
Option 3 9 10 10 10 8 9 8 10 9 9.22 72.12
Option 4 9 9 8 10 10 10 10 10 10 9.56 74.72
Option 2 10 10 10 10 7 9 10 9 7 9.11 0.00
Option 3 10 10 10 10 8 9 9 10 7 9.22 0.00
Option 4 10 10 10 10 9 9 8 10 10 9.56 0.00
Option 2 10 10 10 7.5 7 8 8 9 9 8.72 35.59
Option 3 9 10 10 7.5 8 9 9 10 6 8.72 35.59
Option 4 9 10 10 10 10 10 10 10 8 9.67 39.44
Option 2 10 10 10 10 10 10 10 9 10 9.89 40.35
Option 3 10 9 10 7.5 10 10 10 10 10 9.61 39.21
Option 4 10 8 10 7.5 10 10 10 10 10 9.50 38.76
Option 2 10 10 10 7 10 10 10 10 10 9.67 55.87
Option 3 8 9 8 10 8 8 10 8 7 8.44 48.81
Option 4 9 10 10 10 10 10 10 10 10 9.89 57.16
Option 2 8 8 8 8 7 8 10 8 7 8.00 19.04
Option 3 10 10 10 10 9 9 8 10 9 9.44 22.48
Option 4 9 10 10 8 10 10 8 10 10 9.44 22.48
Option 2 10 10 10 7 8 10 8 8 7 8.67 20.63
Option 3 10 9 10 7 9 8 10 9 8 8.89 21.16
Option 4 9 8 8 10 10 10 10 10 9 9.33 22.21
Option 2 8 8 8 6 7 7 8 8 8 7 7.50 38.25
Option 3 9 9 9 6 8 7 9 9 9 8 8.30 42.33
Option 4 10 10 10 10 10 10 10 10 10 10 10.00 51.00
Option 2 8 8 8 7 7 9 9 8 8.33 8.04 75.15
Option 3 6 6 6 8 7 10 8 7 6.67 7.19 67.18
Option 4 10 10 10 10 10 10 10 9.5 10 9.94 92.98
Option 2 10 9 10 10 9 10 10 9 8.75 9.5 8 8.50 8 8.50 9.16 7.79
Option 3 8 8 8 8 9 9 9 8 8.75 8.5 7 7.50 7 8 8.13 6.91
Option 4 9 7 7 5 8 8 8 7 9 8 7 7.50 8 8.75 7.66 6.51
Option 2 6.76 6.76 6.76 6.76 6.76 6.76 6.76 6.76 6.76 6.76 6.76 11.50
Option 3 6.47 6.47 6.47 6.47 6.47 6.47 6.47 6.47 6.47 6.47 6.47 11.00
Option 4 10 10 10 10 10 10 10 10 10 10 10.00 17.00
Option 2 8 7 8 7.67 7.67 72.99
Option 3 7 7.33 7 6 6.83 65.05
Option 4 10 9.67 10 8 9.42 89.65
Option 2 10 10 10 10 9 10 10 10 7 7 7 9.09 33.09
Option 3 9 9 9 10 9 9 10 8 9 9 9 9.09 33.09
Option 4 6 6 6 6 5 6.7 5 6 5 4 5 5.52 20.09
Option 2 8 5 7 9 7.25 69.02
Option 3 8 5 7 7 6.75 64.26
Option 4 9 10 10 9 9.50 90.44
Option 2 9 7.60 8 8.60 8.30 44.16
Option 3 8 7.20 7 8 7.55 40.17
Option 4 9 8 9 8.20 8.55 45.49
4
5
6
N°
1
2
3
14 Ease of operation
11
12
13
7
8
9
10
Ability to meet all the license requirements
Track records in similar climate / confidence in the
technology
Ability to accomodate WWF
Ability to operate at low DWF (diurnal)
Sensitivity of operation and cost to the sew age
quality (short term variability)
Ease of construction
Expandability / modularity
Flexibility to upgrade to more stringent requirements
(TN&TP, WWF, disinfection)
Flexibility regarding denitrif ication
16 Ease of maintenance
17 Operator safety
Redundancy / Availability of the plant
Reliability and risk of failure
15 Ability to recover Phosphorus
Construction duration
Environmental impact / sustainability
4.08%
4.08%
5.78%
2.38%
0.00%
7.48%
7.82%
0.00%
5.32%
1.70%
9.52%
3.64%
9.52%
2.38%
5.10%
9.35%
0.85%
Table 110: Technical scoring results

WINNIPEG SEWAGE TREATMENT PROGRAM
SEWPCC PROCESS SELECTION REPORT – PART V Page 159 of 193
PSR_rev final – July 2011
Note: Not all scorers scored all criteria. The impact of this inconsistency in scoring is assessed in a sensitivity analysis of the scoring table provided in Appendix 8: Scoring table sensitivity analysis.
I.2.2 THE SPECIFIC CASE OF TRACK RECORDS IN SIMILAR CLIMATE Biofilter technology is less well known to the CoW members of the scoring team than the standard activated sludge processes. A list of relevant references for biofilters is given in the Appendix 9: Biofilter list of references. These were made available to all scorers and discussed during the option review workshop. The EAP acknowledged during the review workshop that the process technologies of the three pre-selected options were all reliable with respect to the existence of a sufficient number of successful references around the world.
I.2.3 THE SPECIFIC CASE OF THE CONSTRUCTION DURATIONS The construction durations of each option are assessed as follows:
� Option 2: 45 months � Option 3: 46 months � Option 4: 34 months
These values are indicative and comparative durations. The differences between the construction duration of the options come arise from:
1. Lead time for equipment 2. Extent of civil works 3. Extent and methods of erection 4. and complexity of commissionin
In particular, differences in the commissioning requirements of each option have a significant impact on the construction durations. A first draft commissioning plan for each option is presented in Appendix 10: Commissioning plans which illustrates this point. The global construction schedules are given in the Appendix 11: Construction schedules. Note: the schedules presented in Appendix 11 are based on the business as usual procurement strategy which is a Design - Bid - Build process.

WINNIPEG SEWAGE TREATMENT PROGRAM
SEWPCC PROCESS SELECTION REPORT – PART V Page 160 of 193
PSR_rev final – July 2011
II. CAPEX AND OPEX ESTIMATIONS -ooOoo-

WINNIPEG SEWAGE TREATMENT PROGRAM
SEWPCC PROCESS SELECTION REPORT – PART V Page 161 of 193
PSR_rev final – July 2011
II.1 CAPEX ESTIMATIONS
OPTION 2 OPTION 3 OPTION 4
MECHANICAL EQUIPMENTS
HEADWORKS uc 3,862,587.51 3,862,587.51 3,862,587.51
PRIMARY CLARIFIERS uc 842,169.07 842,169.07 905,885.81
BIOREACTORS (IFAS prop. Tech. not included) uc 21,452,124.42 6,186,726.30
BIOREACTORS (IFAS prop. Tech.) uc 10,413,735.30
Among w hich the following propriatary technology package 6,900,000.00
BIOFILTERS uc 25,911,911.71 36,634,859.92
Among w hich the following propriatary technology package 9,400,000.00 14,000,000.00
SECONDARY CLARIFIERS uc 4,710,427.48 4,898,844.58 695,977.04
CSO BALLASTED PRIMARY CLARIFIERS uc 9,308,613.61 9,308,613.61 9,308,613.61
Among w hich the following propriatary technology package 3,340,076.38 3,340,076.38 3,340,076.38
DISINFECTION - CHLORINATION uc 87,076.56 87,076.56 87,076.56
OTHER MECHANICALS uc 697,087.00 2,554,210.14 3,420,865.03
TOTAL M&E uc 51,373,820.96 53,652,139.49 54,915,865.48
CIVIL WORKS COSTS 59,203,071.63 66,386,686.25 35,544,794.17
GENERAL CONTRACTING 9,065,202.32 9,795,683.69 7,419,386.73
SITE WORKS uc 11,511,088.88 11,511,088.88 11,511,088.88
UV DISINFECTION uc 2,344,045.00 2,344,045.00 2,344,045.00
UPGRADE COSTS uc 11,680,924.61 11,680,924.61 9,198,709.99
BY-PASS AND OUTLET PIPES uc 12,991,708.13 12,991,708.13 12,991,708.13
SLUDGE STORAGE uc 7,257,937.50 7,257,937.50 7,257,937.50
ODOUR TREATMENT uc 4,237,183.91 4,237,183.91 4,237,183.91
STANDBY EMERGENCY POWER UPGRADE uc 3,440,262.38 3,440,262.38 3,440,262.38
DAF SLUDGE THICKENER uc 7,257,937.50 7,257,937.50 0.00
SITE COSTS uc 19,097,278.18 20,624,841.12 11,908,878.57
CONTINGENCIES FOR CONSTRUCTION CHANGE ORDERS uc 19,946,046.10 21,118,043.85 16,076,986.07
Table 111: CAPEX of the 3 pre-selected options estimation w/o R&O
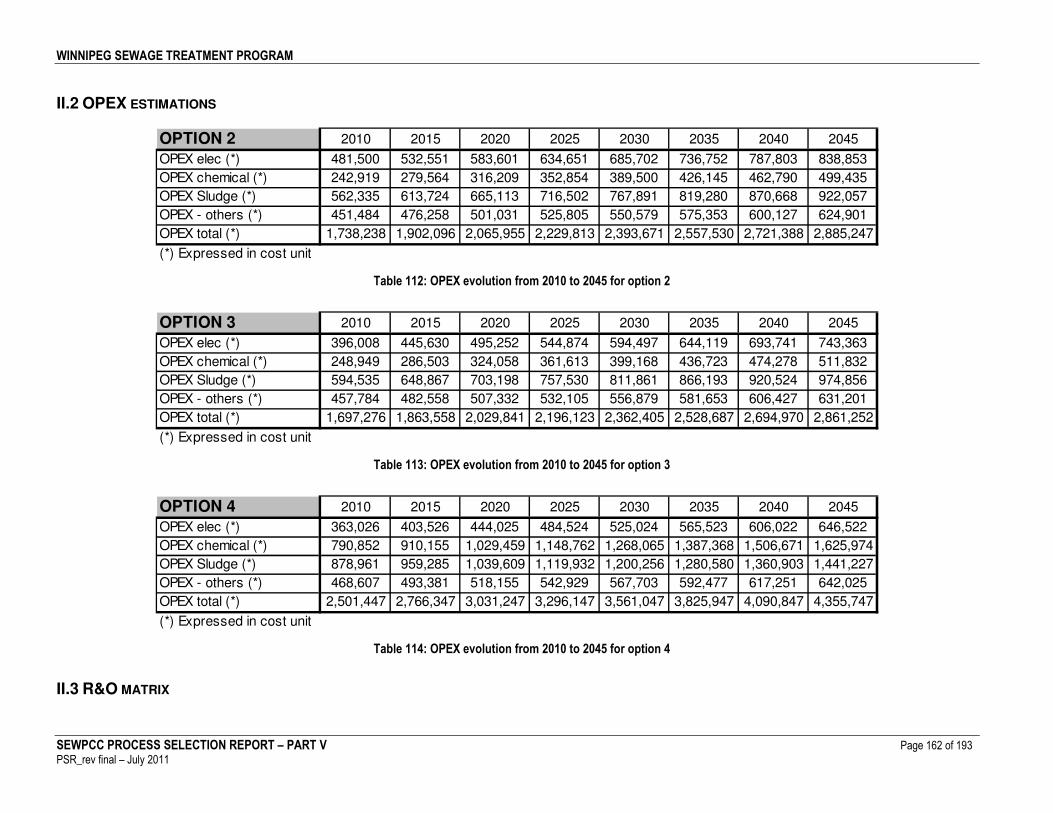
WINNIPEG SEWAGE TREATMENT PROGRAM
SEWPCC PROCESS SELECTION REPORT – PART V Page 162 of 193
PSR_rev final – July 2011
II.2 OPEX ESTIMATIONS
OPTION 2 2010 2015 2020 2025 2030 2035 2040 2045
OPEX elec (*) 481,500 532,551 583,601 634,651 685,702 736,752 787,803 838,853
OPEX chemical (*) 242,919 279,564 316,209 352,854 389,500 426,145 462,790 499,435
OPEX Sludge (*) 562,335 613,724 665,113 716,502 767,891 819,280 870,668 922,057
OPEX - others (*) 451,484 476,258 501,031 525,805 550,579 575,353 600,127 624,901
OPEX total (*) 1,738,238 1,902,096 2,065,955 2,229,813 2,393,671 2,557,530 2,721,388 2,885,247
(*) Expressed in cost unit
Table 112: OPEX evolution from 2010 to 2045 for option 2
OPTION 3 2010 2015 2020 2025 2030 2035 2040 2045
OPEX elec (*) 396,008 445,630 495,252 544,874 594,497 644,119 693,741 743,363
OPEX chemical (*) 248,949 286,503 324,058 361,613 399,168 436,723 474,278 511,832
OPEX Sludge (*) 594,535 648,867 703,198 757,530 811,861 866,193 920,524 974,856
OPEX - others (*) 457,784 482,558 507,332 532,105 556,879 581,653 606,427 631,201
OPEX total (*) 1,697,276 1,863,558 2,029,841 2,196,123 2,362,405 2,528,687 2,694,970 2,861,252
(*) Expressed in cost unit
Table 113: OPEX evolution from 2010 to 2045 for option 3
OPTION 4 2010 2015 2020 2025 2030 2035 2040 2045
OPEX elec (*) 363,026 403,526 444,025 484,524 525,024 565,523 606,022 646,522
OPEX chemical (*) 790,852 910,155 1,029,459 1,148,762 1,268,065 1,387,368 1,506,671 1,625,974
OPEX Sludge (*) 878,961 959,285 1,039,609 1,119,932 1,200,256 1,280,580 1,360,903 1,441,227
OPEX - others (*) 468,607 493,381 518,155 542,929 567,703 592,477 617,251 642,025
OPEX total (*) 2,501,447 2,766,347 3,031,247 3,296,147 3,561,047 3,825,947 4,090,847 4,355,747
(*) Expressed in cost unit
Table 114: OPEX evolution from 2010 to 2045 for option 4
II.3 R&O MATRIX

WINNIPEG SEWAGE TREATMENT PROGRAM
SEWPCC PROCESS SELECTION REPORT – PART V Page 163 of 193
PSR_rev final – July 2011
I. RISKS TABLE
Construction
Geotechnics Program
Additional cost + delay s. The risk is assessed as f ollows :
20% increase on price of buildings x 50% occurrence of the
risk 50%
Launching a geotechnical surv ey as soon as the process is
selected and the localization of the main works is roughly
known. Meanwhile the risk as to be considered in CAPEX
estimation
Option 2 50% 3,594,922 1,797,461
Option 3 50% 3,574,604 1,787,302
Option 4 50% 1,711,604 855,802
Impact of winter on the CW Program
Winter => 20% increase on price of concrete. 30 month
duration will imply at least 2 winters (4 months each), 36 and
40 months duration will imply at least 3 winters
Option 2 33% 3,882,337 1,294,112
Option 3 30% 4,809,936 1,442,981
Option 4 27% 2,777,650 740,707
Intermediate pumping station Program
we considered that intermediate pumping plants will be
needed f or options 3 and 4. For option 2 it is likely that we
could do without one but it has to be checked.
Option 2 50% 2,579,850 1,289,925
Option 3 2,579,850
Option 4 2,579,850
Reuse of existing equipments f or secondary
clarif iers Program
Option 2 Equipements are upgraded
Option 3 Equipements are upgraded
Option 4 Equipments are reused 50% 551,603 Ref urbishment cost assessed as 25% of eqt cost 275,802
Total risks option 2 4,381,499
Total risks option 3 3,230,283
Total risks option 4 1,872,310
Only f or R&O owned by the Program
Risk Description
Ris
k o
wn
er
Impact
Ran
kin
g
Lik
elih
oo
d
Sev
eri
ty
Ris
k S
co
re
Action Plan & Expected Result
Ris
k C
ost:
Pro
jec
t
Ma
na
ger
Ris
k C
ost:
In b
ud
get
Table 115: Risks form
Note: for option 4, the risk that the Regulator doesn’t approve the recourse to a chemicaly P removal process cannot be included in the R&O matric for the following reasons:
• Its approval (or not) will be given before any option 4 specific expenses is done and • The flexibility and modularity of option 4 allows to turn the option into a bio-P process, as shown in Appendix 12: Assessment of options 2 and 4
possible delivery options.

WINNIPEG SEWAGE TREATMENT PROGRAM
SEWPCC PROCESS SELECTION REPORT – PART V Page 164 of 193
PSR_rev final – July 2011
II. OPPORTUNITIES TABLE
Description Nature
Action Plan & Expected Result
Su
cc
es
s
Lik
elih
oo
d
To
tal
Imp
ac
t
Op
po
rtu
nit
y
Ga
in:
Pro
jec
t
Ma
na
ge
r
Op
po
rtu
nit
y
Ga
in:
In
Bu
dg
et
Interconnection piping and valves above ground
Option 2
Option 3
Option 4
Odour treatment
Option 2
Option 3 301,768
Option 4 2,049,965
Roads and external works
Option 2 30,580
Option 3 24,080
Option 4 105,915
Total opportunities option 2 30,580
Total opportunities option 3 325,848
Total opportunities option 4 2,155,880
The option with a smaller size will generate less air v olume to treat
The dif f erent options don't hav e the same f ootprint thus the roads and external works won't be the
same f or all three options.
Roads estimations : option 2 : 530 m new roads / option 3 : 750 m new roads / option 4 : 285 m new
roads
Fence estimations : option 2 : 1570 m / option 3 : 1500 m / option 4 : 1450 m
Option 2 shall hav e less interconnecting pipes and v alv es abov e ground than option 3
Option 4 shall hav e less interconnecting pipes and v alv es than options 2 and 3
Table 116: Opportunity form

WINNIPEG SEWAGE TREATMENT PROGRAM
SEWPCC PROCESS SELECTION REPORT – PART V Page 165 of 193
PSR_rev final – July 2011
II.4 FINAL RESULTS OPTION 2 OPTION 3 OPTION 4
MECHANICAL EQUIPMENTS
HEADWORKS uc 3,862,587.51 3,862,587.51 3,862,587.51
PRIMARY CLARIFIERS uc 842,169.07 842,169.07 905,885.81
BIOREACTORS (IFAS prop. Tech. not included) uc 21,452,124.42 6,186,726.30
BIOREACTORS (IFAS prop. Tech.) uc 10,413,735.30
Among which the following propriatary technology package 6,900,000.00
BIOFILTERS uc 25,911,911.71 36,634,859.92
Among which the following propriatary technology package 9,400,000.00 14,000,000.00
SECONDARY CLARIFIERS uc 4,710,427.48 4,898,844.58 695,977.04
CSO BALLASTED PRIMARY CLARIFIERS uc 9,308,613.61 9,308,613.61 9,308,613.61
Among which the following propriatary technology package 3,340,076.38 3,340,076.38 3,340,076.38
DISINFECTION - CHLORINATION uc 87,076.56 87,076.56 87,076.56
OTHER MECHANICALS uc 697,087.00 2,554,210.14 3,420,865.03
TOTAL M&E uc 51,373,820.96 53,652,139.49 54,915,865.48
CIVIL WORKS COSTS 59,203,071.63 66,386,686.25 35,544,794.17
GENERAL CONTRACTING 9,065,202.32 9,795,683.69 7,419,386.73
SITE WORKS uc 11,511,088.88 11,511,088.88 11,511,088.88
UV DISINFECTION uc 2,344,045.00 2,344,045.00 2,344,045.00
UPGRADE COSTS uc 11,680,924.61 11,680,924.61 9,198,709.99
BY-PASS AND OUTLET PIPES uc 12,991,708.13 12,991,708.13 12,991,708.13
SLUDGE STORAGE uc 7,257,937.50 7,257,937.50 7,257,937.50
ODOUR TREATMENT uc 4,237,183.91 4,237,183.91 4,237,183.91
STANDBY EMERGENCY POWER UPGRADE uc 3,440,262.38 3,440,262.38 3,440,262.38
DAF SLUDGE THICKENER uc 7,257,937.50 7,257,937.50 0.00
SITE COSTS uc 19,097,278.18 20,624,841.12 11,908,878.57
CONTINGENCIES FOR CONSTRUCTION CHANGE ORDERS % 10% 10% 10%
CONTINGENCIES FOR CONSTRUCTION CHANGE ORDERS uc 19,946,046.10 21,118,043.85 16,076,986.07
CAPEX RISKS & OPPORTUNITIES
Risks uc 4,381,498.58 3,230,282.50 1,872,310.40
Opportunities uc 30,580.00 325,848.08 2,155,880.44
TOTAL CAPEX RISKS & OPPORTUNITIES uc 4,350,918.58 2,904,434.42 -283,570.04
TOTAL CAPEX PROJECT VALUE uc 223,757,425.00 235,202,916.00 176,563,276.00
OPEX RISKS & OPPORTUNITIES
Risks uc
Opportunities uc
TOTAL OPEX RISKS & OPPORTUNITIES uc
TOTAL OPEX PROJECT VALUE (average 2010 - 2031) uc 2,082,340.00 2,046,468.00 3,057,737.00
WHOLE LIFE COST (Construction + 30 year operation NPV w ith 6% discount rate) uc 234,311,677.00 243,435,624.00 215,322,052.00
OPEX including sludge hauling cost and excluding : HVAC on operation and human resources
All solution CAPEX Excluding : decommissioning costs
Table 117: CAPEX and OPEX estimations for the 3 pre-selected options
WINNIPEG SEWAGE TREATMENT PROGRAM
SEWPCC PROCESS SELECTION REPORT – PART V Page 166 of 193
PSR_rev final – July 2011
Note: different delivery options have been assessed for the options 2 and 4 in order to check if their ranking could be impacted. These delivery options are presented in Appendix 12 and consist of:
• Assessment of construction phasing, • Assessment of option 4 modularity (in regard to bio-P), • Assessment of option 4 flexibility in regard to i) de-nitrification as a future option and ii) use of DAF
to equalise the sludge volume between the two options.

WINNIPEG SEWAGE TREATMENT PROGRAM
SEWPCC PROCESS SELECTION REPORT – PART V Page 167 of 193
PSR_rev final – July 2011
III. CARBON FOOTPRINT ESTIMATIONS -ooOoo-
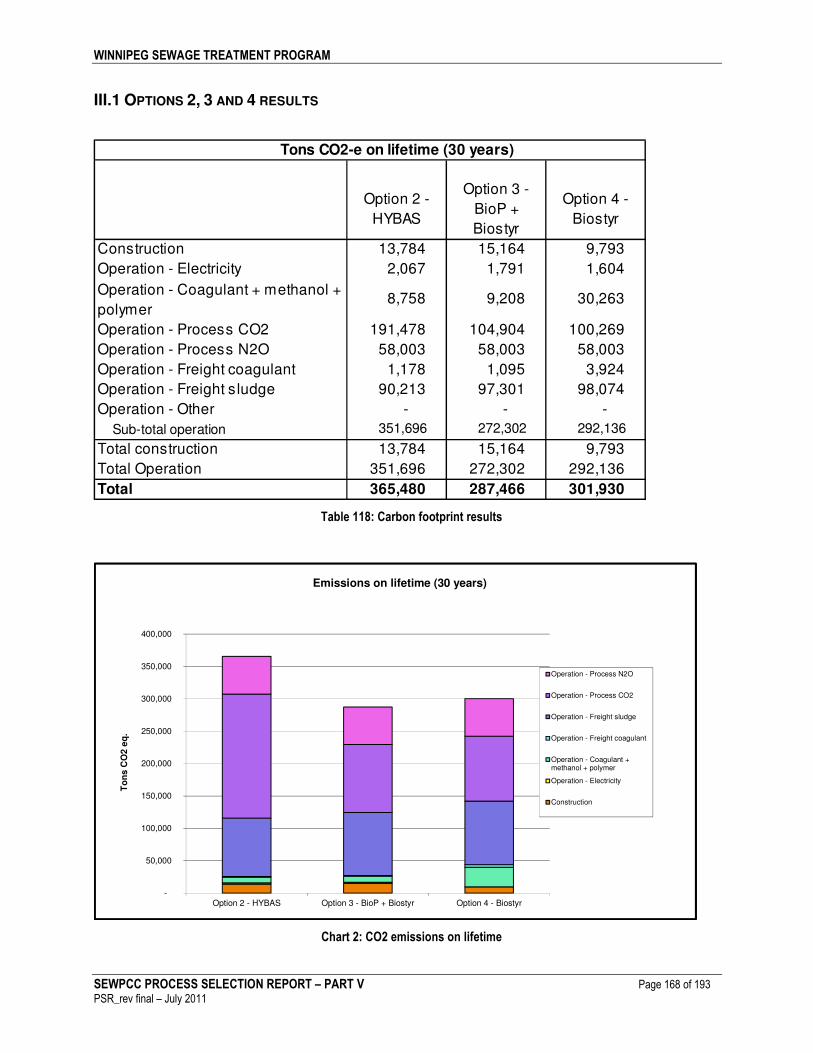
WINNIPEG SEWAGE TREATMENT PROGRAM
SEWPCC PROCESS SELECTION REPORT – PART V Page 168 of 193
PSR_rev final – July 2011
III.1 OPTIONS 2, 3 AND 4 RESULTS
Tons CO2-e on lifetime (30 years)
Option 2 -
HYBAS
Option 3 -
BioP +
Biostyr
Option 4 -
Biostyr
Construction 13,784 15,164 9,793
Operation - Electricity 2,067 1,791 1,604
8,758 9,208 30,263
Operation - Process CO2 191,478 104,904 100,269
Operation - Process N2O 58,003 58,003 58,003
Operation - Freight coagulant 1,178 1,095 3,924
Operation - Freight sludge 90,213 97,301 98,074
Operation - Other - - -
Sub-total operation 351,696 272,302 292,136
Total construction 13,784 15,164 9,793
Total Operation 351,696 272,302 292,136
Total 365,480 287,466 301,930
Operation - Coagulant + methanol +
polymer
Table 118: Carbon footprint results
-
50,000
100,000
150,000
200,000
250,000
300,000
350,000
400,000
Option 2 - HYBAS Option 3 - BioP + Biostyr Option 4 - Biostyr
To
ns
CO
2 e
q.
Emissions on lifetime (30 years)
Operation - Process N2O
Operation - Process CO2
Operation - Freight sludge
Operation - Freight coagulant
Operation - Coagulant +methanol + polymer
Operation - Electricity
Construction
Chart 2: CO2 emissions on lifetime

WINNIPEG SEWAGE TREATMENT PROGRAM
SEWPCC PROCESS SELECTION REPORT – PART V Page 169 of 193
PSR_rev final – July 2011
III.2 INTERPRETATION The analysis indicates that carbon footprint for construction is not significant compared to that of the operation (construction carbon footprint is less than 4% of the total footprint for all the options as shown in Chart 3: CO2 emissions in representative percentage below.
0%
10%
20%
30%
40%
50%
60%
70%
80%
90%
100%
Option 2 - HYBAS Option 3 - BioP + Biostyr Option 4 - Biostyr
Emissions in representative percentage
Operation - Freight sludge
Operation - Freight coagulant
Operation - Process N2O
Operation - Process CO2
Operation - Coagulant + methanol + polymer
Operation - Electricity
Construction
Chart 3: CO2 emissions in representative percentage
Although option 4 uses some chemicals, its global carbon footprint is lower than for options 2 and 3. The main reason is that, in this process, a significant part of the carbon is removed in the primary clarifiers and stored into the sludge when it is mostly oxidised and released as CO2 in secondary’s in the options 2 and 3. Consequently, to be complete and balanced, the carbon footprint calculation should also consider the sludge treatment process. Since the sludge treatment is not chosen yet, there remain a large number of scenarios that cannot be assessed realistically. Nevertheless, there is for option 4 some significant opportunities for reducing its carbon footprint compared to the other options by chosing a sustainable sludge treatment process. Indeed, by using the carbon stored in the sludge in processes that generate whether bio-gas or fertilizers, option 4 will allow saving some fossil carbon resources. To capitalize this opportunity which is specific to option 4, the results of the carbon footprint assessment described above are considred relevant.

WINNIPEG SEWAGE TREATMENT PROGRAM
SEWPCC PROCESS SELECTION REPORT – PART V Page 170 of 193
PSR_rev final – July 2011
IV. PROCESS OPTION SELECTION -ooOoo-

WINNIPEG SEWAGE TREATMENT PROGRAM
SEWPCC PROCESS SELECTION REPORT – PART V Page 171 of 193
PSR_rev final – July 2011
IV.1 GLOBAL SCORING OF THE PRE-SELECTED OPTIONS The combination of the technical and financial scoring gives the following results:
Average scores Weight Weighted scores
Option 2 660.28
Option 3 629.60
Option 4 728.60
Option 2 7.29 0.00
Option 3 10.00 0.00
Option 4 9.50 0.00
Option 2 7.33 30.77
Option 3 6.68 28.05
Option 4 10.00 42.00
Option 2 9.82 61.90
Option 3 10.00 63.00
Option 4 5.06 31.87
Option 2 9.12 95.74
Option 3 8.69 91.29
Option 4 10.00 105.00
GLOBAL SCORING
Option 2 848.69
Option 3 811.95
Option 4 907.46
Operating cost 6.30%
18
TECHNICAL SCORING
20
Carbon footprint 0.00%
19 Capital cost 4.20%
21 Whole life cost 10.50%
Table 119: Global scoring of the 3 pre-selected options
Note: to complete the sensibility analysis already made on the technical results, if the weightings of the financial criteria were equal, the final ranking of the options wouldn’t change, as shown hereunder.

WINNIPEG SEWAGE TREATMENT PROGRAM
SEWPCC PROCESS SELECTION REPORT – PART V Page 172 of 193
PSR_rev final – July 2011
Average scores Weight Weighted scores
Option 2 660.28
Option 3 629.60
Option 4 728.60
Option 2 7.29 38.25
Option 3 10.00 52.50
Option 4 9.50 49.86
Option 2 7.33 38.47
Option 3 6.68 35.06
Option 4 10.00 52.50
Option 2 9.82 51.58
Option 3 10.00 52.50
Option 4 5.06 26.56
Option 2 9.12 47.87
Option 3 8.69 45.65
Option 4 10.00 52.50
GLOBAL SCORING
Option 2 798.20
Option 3 762.81
Option 4 860.15
TECHNICAL SCORING
19 Capital cost
WITHOUT WEIGHTING OF FINANCIAL CRITERIA
5.25%
18 Carbon footprint 5.25%
21 Whole life cost 5.25%
20 Operating cost 5.25%
Table 120: Sensitivity analysis to assess the impact of carbon footprint
IV.2 AUDIT OF THE SLUDGE IMPACT ISSUE As previously discussed, in order to ascertain the validity of the ranking presented above, the Program has audited the impact that the pending sludge issue could have on this final option selection. The scoring in Table 119: Global scoring of the 3 pre-selected options was subject to a review of the practicable sludge options to determine if they would materially impact process selection for SEWPCC. The treatability of the sludges produced by the 3 probable pre-selected options is deemed to be the same. Consequently, the two main differences between the pre-selected options with respect to sludge treatment are firstly, the importance of the potential for bioP recovery and secondly, the quantity of sludge produced. The first issue has already been taken into account and scored in the technical evaluation of the main treatment process in each option (criterion #15). Any BioP recovery process required, whatever is the option selected, would be accomplished in an additional process separate from the main treatment. The bioP issue can therefore be considered as financial with respect to its impact on option selection. The second point is purely a financial issue. Consequently, the Program considers that the type of sludge process selected will not be determined by the main treatment process options. However it is necessary to compare the whole life cost of the total treatment process (main treatment plus sludge treatment) to determine if the combined cost would make a difference to the selection of the main process treatment option. The Program therefore assessed the financial scores each option would receive if a full sludge treatment process was included in the scope of option selection.

WINNIPEG SEWAGE TREATMENT PROGRAM
SEWPCC PROCESS SELECTION REPORT – PART V Page 173 of 193
PSR_rev final – July 2011
To assess the financial impact of sludge treatment the Program assumed the following:
The assessment can be made on options 2 and 4 only as they are the two extreme options in respect to the sludge production and
That the sludge treatment process will be within the following alternatives:
A1 Pel leti zation
A2 Therma l oxidation
A3 Composting
A4 Landfi l l ing = s ludge treatment in SEWPCC for SEWPCC s ludge
A5 Land appl ication = current s ludge mana gement : a l l trea tment in NEWPCC ALT
ER
NA
TIV
ES
Table 121: Unit rates assumption for sludge hauling
In addition, for the numeric calculation we assume that:
The current OPEX of the sludge treatment in 2010 is: 1.7 MCAD/year (alternative A5) The current sludge production at NEWPCC in 2010 is: 13,000 Dtons/y at 25% dry solids The sludge hauled from SEWPCC and WEWPCC to NEWPCC are at 4% dry solids and The unit rates for hauling are:
Hauling from SEWPCC to NEWPCC 130 $/truck Hauling from WEWPCC to NEWPCC 87 $/truck Hauling from WEWPCC to SEWPCC 43 $/truck
Table 122: Unit rates assumption for sludge hauling

WINNIPEG SEWAGE TREATMENT PROGRAM
SEWPCC PROCESS SELECTION REPORT – PART V Page 174 of 193
PSR_rev final – July 2011
For the capital costs of sludge treatment, the Programs retained the following figures from Stantec’s PDR (SEWPCC Upgrading/Expansion Preliminary Design Report, March 31, 2008 – Section 16.6):
2006 values expressed in CAD CAPEX OPEX
A1 Pel letiza tion 35,888,000 1,821,000
A2 Thermal oxidati on 46,880,000 1,976,000
A3 Compos ting 29,305,000 3,091,000
A4 Landfi l l ing 27,698,000 1,574,000
A5 Land appl ication 10,430,000 2,056,000
Table 123: CAPEX and OPEX for sludge treatment alternatives from Stantec’s PDR (2006)
These monetary assessments were based on a 27.57 Dtons/d sludge production by SEWPCC in 2006. The details of the calculation are given in Appendix 13: Details of calculation of the sludge issue impact. The NPV calculations of the options 2 and 4 including the sludge treatment are:
Sludge alternative Option 2 Option 4 Difference
A1 - pelletization 267.03 257.99 9.04-CAD
A2 - thermal oxidation 274.80 261.01 13.79-CAD
A3 - composting 275.31 260.62 14.69-CAD
A4 - landf illing 257.90 246.04 11.85-CAD
A5 - land application 256.93 246.50 10.43-CAD
Water process option
NPV total
(w ater + sludge treatments)
Table 124: NPV results including the sludge treatment
Important note: compared to the NPV results presented in Table 117: CAPEX and OPEX estimations for the 3 pre-selected options, the sludge hauling has been removed from the “water NPV” calculation. These results suggest that although it would reduce the gap between the whole life NPV for the options, the sludge issue won’t change the monetary ranking nor the global one (refer to the tables herebelow).
A1 - Pelletization GLOBAL SCORING A2 - Thermal oxidation GLOBAL SCORING
Option 2 859.31 Option 2 857.08
Option 4 913.05 Option 4 918.81
A3 - Composting GLOBAL SCORING A4 - Landfilling GLOBAL SCORING
Option 2 855.63 Option 2 857.21
Option 4 920.27 Option 4 910.81
A5 - Land application GLOBAL SCORING
Option 2 855.90
Option 4 909.13
Table 125: Global scoring with the sludge treatment alternatives
Consequently, the pending sludge issue can be considered not to have any significant impact on the process selection of SEWPCC.

WINNIPEG SEWAGE TREATMENT PROGRAM
SEWPCC PROCESS SELECTION REPORT – PART V Page 175 of 193
PSR_rev final – July 2011
IV.3 CONCLUSION AND RECOMMENDATION Based on the results of the technical and financial assessment of the three pre-selected options and after having ascertained that the scoring procedure was relevant and comprehensive enough not to jeopardize in any way the best interest of the project, the Program recommends the following ranking of process options for SEWPCC to meet the Project objectives:
Preferred option: option 4 based on biofilter technology 2
nd preferred option: option 2 based on IFAS technology
3rd
preferred option: option 3 based on an hybrid technology (activated sludge + biofilters) During the Process Selection Report presentation, some issues have been raised that will have to be addressed in the next steps. They are listed in Appendix 14: Issues to be addressed in the next steps.

APPENDICES

WINNIPEG SEWAGE TREATMENT PROGRAM
SEWPCC PROCESS SELECTION REPORT – APPENDICES Page 177 of 193
PSR_rev final – July 2011
Appendix 1: Review workshop guideline

WINNIPEG SEWAGE TREATMENT PROGRAM
SEWPCC PROCESS SELECTION REPORT – APPENDICES Page 178 of 193
PSR_rev final – July 2011
Appendix 2: Stantec’s option G estimate

WINNIPEG SEWAGE TREATMENT PROGRAM
SEWPCC PROCESS SELECTION REPORT – APPENDICES Page 179 of 193
PSR_rev final – July 2011
Appendix 3: EAP report

WINNIPEG SEWAGE TREATMENT PROGRAM
SEWPCC PROCESS SELECTION REPORT – APPENDICES Page 180 of 193
PSR_rev final – July 2011
Appendix 4: Pre-scoring scan results

WINNIPEG SEWAGE TREATMENT PROGRAM
SEWPCC PROCESS SELECTION REPORT – APPENDICES Page 181 of 193
PSR_rev final – July 2011
Appendix 5: Benchmark analysis details

WINNIPEG SEWAGE TREATMENT PROGRAM
SEWPCC PROCESS SELECTION REPORT – APPENDICES Page 182 of 193
PSR_rev final – July 2011
Appendix 6: Civil works bill of quantities methodology

WINNIPEG SEWAGE TREATMENT PROGRAM
SEWPCC PROCESS SELECTION REPORT – APPENDICES Page 183 of 193
PSR_rev final – July 2011
Appendix 7: CO2 emission factors database

WINNIPEG SEWAGE TREATMENT PROGRAM
SEWPCC PROCESS SELECTION REPORT – APPENDICES Page 184 of 193
PSR_rev final – July 2011
Appendix 8: Scoring table sensitivity analysis

WINNIPEG SEWAGE TREATMENT PROGRAM
SEWPCC PROCESS SELECTION REPORT – APPENDICES Page 185 of 193
PSR_rev final – July 2011
Appendix 9: Biofilter list of references

WINNIPEG SEWAGE TREATMENT PROGRAM
SEWPCC PROCESS SELECTION REPORT – APPENDICES Page 186 of 193
PSR_rev final – July 2011
Appendix 10: Commissioning plans

WINNIPEG SEWAGE TREATMENT PROGRAM
SEWPCC PROCESS SELECTION REPORT – APPENDICES Page 187 of 193
PSR_rev final – July 2011
Appendix 11: Construction schedules

WINNIPEG SEWAGE TREATMENT PROGRAM
SEWPCC PROCESS SELECTION REPORT – APPENDICES Page 188 of 193
PSR_rev final – July 2011
Appendix 12: Assessment of options 2 and 4 possible delivery options

WINNIPEG SEWAGE TREATMENT PROGRAM
SEWPCC PROCESS SELECTION REPORT – APPENDICES Page 189 of 193
PSR_rev final – July 2011
Appendix 13: Details of calculation of the sludge issue impact

WINNIPEG SEWAGE TREATMENT PROGRAM
SEWPCC PROCESS SELECTION REPORT – APPENDICES Page 190 of 193
PSR_rev final – July 2011
Appendix 14: Issues to be addressed in the next steps

WINNIPEG SEWAGE TREATMENT PROGRAM
SEWPCC PROCESS SELECTION REPORT – APPENDICES Page 191 of 193
PSR_rev final – July 2011
Appendix 15: Presentation of January 24, 2011

WINNIPEG SEWAGE TREATMENT PROGRAM
SEWPCC PROCESS SELECTION REPORT – APPENDICES Page 192 of 193
PSR_rev final – July 2011
Appendix 16: Presentation of January 27, 2011

WINNIPEG SEWAGE TREATMENT PROGRAM
SEWPCC PROCESS SELECTION REPORT – APPENDICES Page 193 of 193
PSR_rev final – July 2011
Appendix 17: Presentation of April 29, 2011


