
Willis Towers Watson Data Services
2017 Company Car Benefits Survey Report - SAMPLE PAGES
© 2017 Willis Towers Watson. All rights reserved. Proprietary and Confidential. For Willis Towers Watson and Willis Towers Watson client use only.

2017 Company Car Benefits Survey Report – SAMPLE COUNTRY
The topics in the Company Car Benefits Survey report:
Policies – By Employee Level Eligibility for Company Car or Car Allowance
Prevalence by Global Grade
Financing Method
Selection Criteria
Maximum Purchase Price / Leasing Cost / Rental charges
Car Make and Model
Personal Use of Company Cars
Replacement Period
Options to Purchase Company Car
Company Financed Employee Car Purchase (Latin America)
Car Purchase Bonus (Latin America)
Use of Employee Personal Cars for Business
Policy Decision Making
Policy Review / Policy Change
Part-time Policies
Taxes
Trade-up/Trade-down Arrangement
Car Accessories and Other Features (options, prohibited vehicles)
Fuel
Tires
Running Costs (maintenance, repair, car wash, road assistance)
Chauffeur
Promotions/Changes of Position
Accidents/Damages/Penalties
Insurance (Mexico)
Second Car (Latin America)
Security Items (Mexico)
Car Allowances Policies
Car/cash Alternatives
Garage/parking, Congestion Charges, Toll
Expatriate (Latin America)
Motorcycles
Green Initiatives (co2 emisson ceilings, policy changes)
Tax Treatment Highlights
Benefits Value – By Position
Prevalence by type of car benefits Eligibility Critieria Types of Car Lease Top Three Car Make, Models and Engine Size Car Purchase Cost Leasing Cost Car Allowance Car Purchase Bonus (Latin America)
© 2017 Willis Towers Watson. All rights reserved. Proprietary and Confidential. For Willis Towers Watson and Willis Towers Watson client use only.

2017 Company Car Benefits Survey Report – SAMPLE CountryData Output by Position
Company Car Benefits Survey | Position Detailed View
SAMPLE COUNTRYCSD000 Direct Sales Generalist/Multidiscipline
CSD000-S3-11
Valued Benefits #Orgs #Cases Avg 10th 25th Median 75th 90th
Car Benefits - Car Purchase Cost 34 457 27 191 21 630 23 620 25 590 30 495 33 296
Car Benefits - Annual Leasing Cost 37 443 5 423 3 720 4 548 5 459 6 132 6 907
Car Benefits - Annual Car Allowance 37 172 5 530 3 689 4 850 6 000 6 000 6 700
Prevalence Data
Car Benefits - Type Car Benefits - Eligibility Criteria 29.4% Company Car 56.6% Job Status39.2% Car Allowance 13.3% Nature of Job / Job Requirements8.4% Choice - Car or Car Allowance 30.1% No Response/Policy21.0% No Benefits2.1% Not Responding
Car Benefits - Types of Car Lease Car Benefits - Top 3 Make/Model32.9% Contract hire/operating lease WITH maintenance Most Frequent0.0% Contract hire/operating lease WITHOUT maintenance Second Most Frequent 0.7% Finance Lease
BMW 3 Series BMW 5 Series Audi A3 Third Most Frequent
66.4% No Response/Policy
Data displayed are for illustrative purposes only
Organizations: 125 | Incumbents: 1517
© 2017 Willis Towers Watson. All rights reserved. Proprietary and Confidential. For Willis Towers Watson and Willis Towers Watson client use only.

2017 Company Car Benefits Survey Report - Sample Country
Business Unit
Head and Country
Manager Executive
Middle Manager
and Senior
Professional
Supervisory and
Professional Sales Manager Sales Professional
Number of Responses 132 139 177 131 135 140
80.3% 78.4% 78.0% 53.4% 88.1% 80.7%
1.5% 1.4% 2.3% 1.5% 1.5% 1.4%
Eligible to Choose between a Company Car
and a Cash Allowance 17.4% 19.4% 15.3% 10.7% 9.6% 8.6%
0.8% 0.7% 4.5% 34.4% 0.7% 9.3%
Number of
Responses 10th Percentile 25th Percentile Median 75th Percentile 90th Percentile Average
20 0% 0% 4% 11% 20% 7%
2017 Company Car Benefits Survey Report - SAMPLE Country Policies Arrangement Type
Organization Provides Company Car Benefits (Company Car or Cash Allowance)
Number of Responses Percent Responding Yes
Percent
Not Eligble for a company car benefit
Percentage of Employees Entitled to Choose Between a Company Car and a Cash Allowance Who Have Chosen the
Cash Allowance Option
200 92.5%
Eligibility for Company-Owned or Leased Car or Car-related Cash Allowances
Employee Categories Eligible for a Company Car or a Car Allowance
Non-Sales Employee Categories Sales Employee Categories
Eligible for Company Car ONLY -
No Option to Take Cash Allowance Instead of a Car
Eligible for Cash Allowance ONLY - No Option to Take a Car
© 2017 Willis Towers Watson. All rights reserved. Proprietary and Confidential. For Willis Towers Watson and Willis Towers Watson client use only.

2017 Company Car Benefits Survey Report - Sample Country
Number of Responses
Number of Responses
Business Unit
Head and Country
Manager Executive
Middle Manager
and Senior
Professional
Supervisory and
Professional Sales Manager Sales Professional
Number of Responses 127 132 160 75 128 120
3.9% 3.0% 4.4% 5.3% 8.6% 5.0%
53.5% 56.1% 51.9% 52.0% 52.3% 55.8%
37.8% 35.6% 39.4% 36.0% 36.7% 35.8%
0.0% 0.0% 0.0% 0.0% 0.0% 0.0%
4.7% 5.3% 4.4% 6.7% 2.3% 3.3%
Contract hire/operating lease WITHOUT maintenance
(i.e., finance company does not have responsibility for maintenance) 4.4%
Contract hire/operating lease WITH maintenance (i.e., finance company maintains the car) 84.6%
Finance lease (i.e., leases that transfer to the lessee substantially all the risks and rewards incidental
to ownership of the car. All other leases are contract hire/operating leases. Finance leases do not
typically include maintenance.) 9.9%
Financing Method Used When Company Cars Are Provided to Employees
Percent of Responses
Cash purchase by organization (i.e., organization-owned fleet) 13.2%
182
Employee Choice up to a Maximum Cost
Designated by the Organization
Employee Choice Without Limits
Other
Car insurance is arranged directly with an insurance company 26.8%
Type of Car
How Company-Owned or Leased Cars Are Selected by Employees
Non-Sales Employee Categories Sales Employee Categories
Car purchase bonus in lieu of a car (i.e., payment by organization to employee of lump sum equal to
car value or annual amount equal to car payment cost) 0.0%
How Organization Arranges Insurance for Company Cars Provided to Employees
Percent of Responses
Car insurance is covered through the lease/rental arrangement 73.2%
157
No Choice (Make and Model Designated by the Organization
Employee Choice from a Range of Makes and Models
Designated by the Organization
© 2017 Willis Towers Watson. All rights reserved. Proprietary and Confidential. For Willis Towers Watson and Willis Towers Watson client use only.

2017 Company Car Benefits Survey Report - Sample Country
Number of
Responses 10th Percentile 25th Percentile Median 75th Percentile 90th Percentile Average
16 43,908 47,214 54,201 60,000 62,105 53,506
16 41,408 45,000 49,200 50,724 54,425 48,125
24 25,000 30,375 39,726 41,413 45,000 37,138
7 - 26,500 30,000 38,185 - 32,196
17 25,000 25,000 32,677 35,500 42,600 32,659
17 25,836 30,000 33,000 36,875 40,000 33,373
Number of
Responses 10th Percentile 25th Percentile Median 75th Percentile 90th Percentile Average
64 847 950 1,088 1,276 1,300 1,100
66 704 800 963 1,150 1,250 973
79 600 650 755 920 950 778
39 500 550 659 800 852 673
53 601 682 783 898 998 794
55 550 598 700 785 856 691
Sales Employee Categories
Sales Manager
Sales Professional
* i.e., finance company maintains the car
Non-Sales Employee Categories
Business Unit Head and Country Manager
Executive
Middle Manager and Senior Professional
Supervisory and Professional
Supervisory and Professional
Sales Employee Categories
Sales Manager
Sales Professional
Maximum Monthly Rental Charge (Contract Hire/Operating Lease WITH Maintenance*) Excluding Value-Added Tax
(in Local Currency)
Maximum Purchase Price/List Price (Before Discount) Including Value-Added Tax and Other Local Taxes (in Local Currency)
Non-Sales Employee Categories
Business Unit Head and Country Manager
Executive
Middle Manager and Senior Professional
© 20
17 W
illis T
ower
s Wats
on. A
ll righ
ts re
serve
d. Pr
opri
© 2017 Willis Towers Watson. All rights reserved. Proprietary and Confidential. For Willis Towers Watson and Willis Towers Watson client use only.

2017 Company Car Benefits Survey Report - Sample Country
Number of
Responses
Up To 60,000
Kilometers
60,001 - 90,000
Kilometers
90,001 - 120,000
Kilometers
120,001 - 150,000
Kilometers
Over 150,000
Kilometers
4 - - - - -
10 - - 885 - 1,000
12 - - 750 700 975
6 - - 690 - -
11 - - 750 700 900
10 - - - 650 690
Percent of
Responses
BMW 5 Series 26.1%
Audi A6 17.0%
BMW 3 Series 5.2%
Audi A6 19.5%
BMW 5 Series 18.5%
Audi A4 9.5%
BMW 3 Series 21.0%
Audi A4 15.7%
VW Passat 9.7%
BMW 3 Series 18.3%
VW Passat 10.1%
Audi A4 9.2%
Maximum Monthly Amount of Leasing Value (Finance Lease*) Excluding Value-Added Tax in Relation to the Car Replacement
Period in Kilometer/Miles- Median Value (in Local Currency)
Executive
1.
2.
3.
Middle Manager and Senior Professional
Non-Sales Employee Categories
Business Unit Head and Country Manager
1.
2.
3.
Sales Employee Categories
Sales Manager
Sales Professional
*Finance leases are leases that transfer to the lessee substantially all the risks and rewards incidental to ownership of the car. Finance leases do not typically include maintenance.
All other leases are contract hire/operating leases.
Three Most Frequently Available Car Makes and Models for Each Employee Category
Non-Sales Employee Categories
Business Unit Head and Country Manager
Executive
Middle Manager and Senior Professional
Supervisory and Professional
2.
3.
1.
2.
3.
Supervisory and Professional
1.
© 2017 Willis Towers Watson. All rights reserved. Proprietary and Confidential. For Willis Towers Watson and Willis Towers Watson client use only.

2017 Company Car Benefits Survey Report - Sample Country
Number of Responses
Number of Responses
Employee Options to Purchase Company Car
Organization Allows Employees to Purchase Their Company Car at the End of the Replacement Period
Number of Responses Percent Responding Yes
Other 8.8%
No Formal policy 38.6%
Use of Employee Personal Cars for Organization Business
Blue Book/Official Table Price (Resale value) 1.8%
Original Invoice Price 0.0%
Average between Market and Original Invoice Price 0.0%
180 50.0%
How the Purchase Option is Offered
Percent of Responses
Market Price (Resale value) 50.9%
57
Single rate per kilometer (if different from reimbursement table of widely recognized organization) 27.8%
Graduated distance (kilometer) allowance 11.4%
Flat allowance 0.6%
How Organization Reimburses Employees for Business Use of Their Personal Owned or Leased Cars
Percent of Responses
According to the reimbursement table of a widely recognized organization
(e.g., automobile clubs, government tables) 58.2%
158
This section refers to employees who are NOT eligible for a company car or a cash allowance in lieu of a company car, but occasionally use their personal
car for business purposes.
Organization Allows Employees to Use Their Personal Cars for Company Business
Number of Responses Percent Responding Yes
200 79.0%
Flat allowance plus rate per kilometer 0.6%
Fuel and oil only 1.3%
© 2017 Willis Towers Watson. All rights reserved. Proprietary and Confidential. For Willis Towers Watson and Willis Towers Watson client use only.

2017 Company Car Benefits Survey Report - Sample Country
Number of Responses
Number of Responses
Reducing costs 20.0%
Introduction of flexibility 75.0%
Reduction of administration 5.0%
55 36.4%
Main Objective/Issue for Changes
Percent of Responses
Alignment with market best practices/competitiveness 80.0%
20
Policy Review
Company Reviewed Its Company Car Benefits Policy During the Last 12-Month Period
Number of Responses Percent Responding Yes
Percent of Responses
Acquisition/financing method 5.3%
19
Makes and models allocated 26.3%
Introduce more environmentally friendly policies/behaviors 65.0%
Other 50.0%
Changes Made
Harmonization across countries or subsidiary companies 80.0%
Maximize tax effectiveness to employee/employer 0.0%
Adapt policy in light of increasing taxes 0.0%
Extend replacement periods for rented/leased cars 0.0%
Reduce replacement periods for rented/leased cars 0.0%
Introduction of more environmentally friendly cars 68.4%
Phase out from a cash allowance policy to a company car policy 0.0%
Introduction of trade up/trade down option 10.5%
Introduction of a flexible benefits scheme 52.6%
Restriction of the company car benefit provision 5.3%
Introduction of possibility to choose between a company car or a cash allowance 10.5%
Phase out from a company car policy to a cash allowance policy 0.0%
Other 15.8%
© 2017 Willis Towers Watson. All rights reserved. Proprietary and Confidential. For Willis Towers Watson and Willis Towers Watson client use only.
2017 Company Car Benefits Survey Report - Sample Country
Number of Responses
Business Unit
Head and Country
Manager Executive
Middle Manager
and Senior
Professional
Supervisory and
Professional Sales Manager Sales Professional
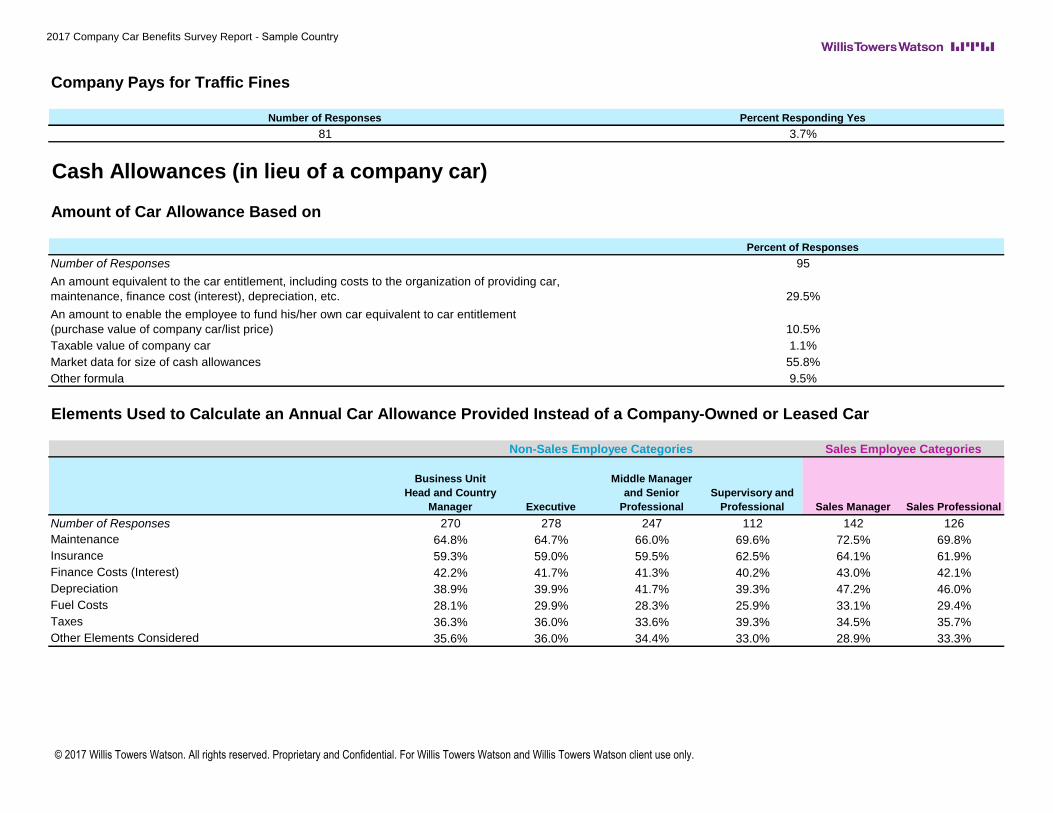
Number of Responses 270 278 247 112 142 126
Maintenance 64.8% 64.7% 66.0% 69.6% 72.5% 69.8%
Insurance 59.3% 59.0% 59.5% 62.5% 64.1% 61.9%
Finance Costs (Interest) 42.2% 41.7% 41.3% 40.2% 43.0% 42.1%
Depreciation 38.9% 39.9% 41.7% 39.3% 47.2% 46.0%
Fuel Costs 28.1% 29.9% 28.3% 25.9% 33.1% 29.4%
Taxes 36.3% 36.0% 33.6% 39.3% 34.5% 35.7%
Other Elements Considered 35.6% 36.0% 34.4% 33.0% 28.9% 33.3%
Company Pays for Traffic Fines
Percent of Responses
95
An amount equivalent to the car entitlement, including costs to the organization of providing car,
maintenance, finance cost (interest), depreciation, etc. 29.5%
An amount to enable the employee to fund his/her own car equivalent to car entitlement
(purchase value of company car/list price) 10.5%
Number of Responses Percent Responding Yes
81 3.7%
Cash Allowances (in lieu of a company car)
Amount of Car Allowance Based on
Elements Used to Calculate an Annual Car Allowance Provided Instead of a Company-Owned or Leased Car
Non-Sales Employee Categories Sales Employee Categories
Taxable value of company car 1.1%
Market data for size of cash allowances 55.8%
Other formula 9.5%
© 2017 Willis Towers Watson. All rights reserved. Proprietary and Confidential. For Willis Towers Watson and Willis Towers Watson client use only.

2017 Company Car Benefits Survey Report - Sample Country
Number of
Responses 10th Percentile 25th Percentile Median 75th Percentile 90th Percentile Average
Business Unit Head and Country Manager 290 6,718 8,400 10,000 12,000 13,446 10,130
Executive 311 6,000 7,500 8,730 10,200 12,000 8,956
Middle Manager and Senior Professional 276 5,000 6,000 6,700 7,713 8,500 6,747
Supervisory and Professional 113 4,260 5,000 6,000 7,000 8,000 5,951
Sales Manager 148 4,626 5,500 6,221 7,200 8,400 6,496
Sales Professional 128 4,076 4,738 5,500 6,525 7,518 5,685
Number of
Responses 10th Percentile 25th Percentile Median 75th Percentile 90th Percentile Average
Business Unit Head and Country Manager 41 5% 6% 8% 10% 12% 8%
Executive 44 6% 7% 9% 10% 12% 9%
Middle Manager and Senior Professional 37 7% 9% 10% 11% 12% 10%
Supervisory and Professional 14 9% 10% 10% 11% 12% 10%
Sales Manager 23 7% 9% 10% 12% 13% 10%
Sales Professional 21 10% 10% 12% 13% 15% 11%
Typical Annual Car Allowance Amount (in Local Currency)
Non-Sales Employee Categories
Sales Employee Categories
The total allowance(s) amount(s) of all car expenses covered such as but not limited to car, fuel for private use, maintenance, insurance, tolls, etc. Please exclude expenses for business fuel. Please
note that the trip to and from office/plant (work location) would be considered private use.
Typical Annual Car Allowance Amount as a Percent of Annual Base Salary
Non-Sales Employee Categories
Sales Employee Categories
The total allowance(s) amount(s) of all car expenses covered such as but not limited to car, fuel for private use, maintenance, insurance, tolls, etc. Please exclude expenses for business fuel. Please
note that the trip to and from office/plant (work location) would be considered private use.
© 2017 Willis Towers Watson. All rights reserved. Proprietary and Confidential. For Willis Towers Watson and Willis Towers Watson client use only.

2017 Company Car Benefits Survey Report - Sample Country
Business Unit
Head and Country
Manager Executive
Middle Manager
and Senior
Professional
Supervisory and
Professional Sales Manager Sales Professional
Number of Responses 69 71 76 73 65 71
Company imposes a diesel car only policy 18.8% 19.7% 19.7% 20.5% 16.9% 21.1%
Company imposes a petrol car only policy 79.7% 78.9% 78.9% 78.1% 81.5% 77.5%
1.4% 1.4% 1.3% 1.4% 1.5% 1.4%
Fuel choice is not restricted 0.0% 0.0% 0.0% 0.0% 0.0% 0.0%
Business Unit
Head and Country
Manager Executive
Middle Manager
and Senior
Professional
Supervisory and
Professional Sales Manager Sales Professional
Number of Responses 68 70 75 72 65 63
Reimbursement to the employee 61.8% 61.4% 60.0% 59.7% 49.2% 52.4%
Vouchers 0.0% 0.0% 0.0% 0.0% 0.0% 0.0%
Fuel Card 38.2% 38.6% 40.0% 40.3% 50.8% 47.6%
Percent of
Responses
Number of Responses 18
1. Allstar 55.6%
2. Arval 11.1%
3. BP 11.1%
Fuel
Restrictions in Place on the Type of Fuel an Employee can Choose
Non-Sales Employee Categories Sales Employee Categories
How Cost of Fuel is Paid
Non-Sales Employee Categories Sales Employee Categories
Top Three Responses to Fuel Card Providers Specified - Most Frequent Reported
Company imposes an ethanol only car policy
© 2017 Willis Towers Watson. All rights reserved. Proprietary and Confidential. For Willis Towers Watson and Willis Towers Watson client use only.

2017 Company Car Benefits Survey Report - Sample Country
Number of Responses
Number of Responses
Cash allowances for employees entitled to a car due to their status within the company, were introduced 9.7%
Cash allowances for employees entitled to a car due to their job needs/requirement were introduced 3.2%
Buying out' of company cars - All company cars were replaced with cash allowances 1.1%
Green Initiatives
Environmentally Friendly Changes Made to Car Policies
Percent of Responses
93
No change 57.0%
Encourage employees to work from home 15.1%
Encourage employees to travel less and make use of tele/web conferencing 31.2%
Other 7.5%
Introduced trading down to promote more fuel efficient cars 16.1%
Installation of standard soot filters on diesel cars 3.2%
Adapt fuel policy in order to reduce consumption 7.5%
Number of Responses Percent Responding Yes
51 13.7%
Steps Organization has Taken to Deal with New/Enhanced Taxes Affecting its Employees
Percent of Responses
Eligible Employees can Select LPG/Bio Fuel/Hybrid or Electric Cars
Number of Responses Percent Responding Yes
71 71.8%
Organization Offers Incentives for Choosing LPG/Bio Fuel/Hybrid or Electric Cars
Provided short-term cash compensation 0.0%
Undertaken a case-by-case review 5.8%
Not applicable 19.2%
104
No change 72.1%
Identified employees "at risk", and notified them of the changes 1.9%
Allowed accelerated replacement of existing company car 1.0%
© 2017 Willis Towers Watson. All rights reserved. Proprietary and Confidential. For Willis Towers Watson and Willis Towers Watson client use only.

2017 Company Car Benefits Survey Report - Sample Country
Number of Responses
Number of
Responses 10th Percentile 25th Percentile Median 75th Percentile 90th Percentile Average
Business Unit Head and Country Manager 31 120 130 135 152 160 140
Executive 35 120 128 130 148 160 138
Middle Manager and Senior Professional 36 120 125 130 140 160 136
Supervisory and Professional 35 116 120 130 140 160 134
Sales Manager 31 120 130 135 144 160 138
Sales Professional 31 120 127 130 140 160 136
Cars over a certain CO² emission level are still offered, but the employee has to contribute to the
imputed tax 1.9%
Not applicable 13.5%
Company has a Ceiling on CO2 Emissions
Number of Responses Percent Responding Yes
Policy Changes due to Emission Related Tax Regulations
Percent of Responses
104
No change 41.3%
Cars over a certain CO² emission level are no longer offered 43.3%
Percent Responding Yes
109 24.8%
109 37.6%
CO2 Emission Ceiling Per Category (g per Kilometer/Mile)
Non-Sales Employee Categories
Sales Employee Categories
Company Modified its Policy in Order to Avoid Offering Fuel for Private Use
Number of Responses
© 2017 Willis Towers Watson. All rights reserved. Proprietary and Confidential. For Willis Towers Watson and Willis Towers Watson client use only.

2017 Company Car Benefits Survey Report - Sample Country
Fax: +1 416 960 7093
United States
Email: [email protected]
Phone: +1 800 645 5771 (toll free)
Phone: +1 914 289 3282 (outside the U.S.)
Fax: +1 914 289 3201
NORTH AMERICA
Canada
Email: [email protected]
Phone: +1 877 550 4402 (toll free)
Phone: +1 416 960 2700 (outside Canada)
Phone: +1 866 824 5815 (toll free in the U.S.)
Fax: +1 954 430 0345
LATIN AMERICA
Email: [email protected]
Phone: +1 954 767 1345
Email: [email protected]
Phone: +32 2 678 15 11 or +44 20 7170 2999
Fax: +32 2 675 36 01 or +44 20 7170 2222
ASIA PACIFIC
Email: [email protected]: +65 6880 5688 or +63 2 982 3913Fax: +65 6880 5699 or +63 2 902 0700
EUROPE, MIDDLE EAST AND AFRICA
If you have any questions, contact your local account manager or the regional office nearest you. Details on local office phone numbers can be
found under Help on our online data analysis tool.
Contacts
Contact
© 2017 Willis Towers Watson. All rights reserved. Proprietary and Confidential. For Willis Towers Watson and Willis Towers Watson client use only.


