
© ICBTS Copyright by Author(s) The 2016 International Academic Research Conference in Paris 1
WHICH RESOURCES DO PARTNERS SHARE IN DYNAMIC
ENVIRONMENTS?
Lee Li
York University, Canada
Email: [email protected]
ABSTRACT
The strategic management literature posits that a major motive of strategic alliances is to share
resources. However, empirical studies indicate that such sharing leads to high transaction costs
in highly dynamic environments. As such, it is not clear why firms are willing to cover high
transaction costs for sharing resources in these environments. This study categorizes resources
into tangible and intangible resource and examine how environmental dynamism and the
scale/ scope free property of resources affect partners’ resource sharing. Using data from
Canadian firms in technology industries, we find that sharing intangible resources is negatively
correlated with environmental dynamism but sharing tangible resources is positively correlated
with environmental dynamism. Moreover, such relationships are moderated by the scale/scope
free property of resources.
Keywords: strategic alliances, resource sharing, environmental dynamism, scope/ scale free
property.
INTRODUCTION
Which resources do partners share in their strategic alliances? The mainstream management
literature indicates that a major motive for firms to create strategic alliances is to share
resources among others (e.g. Goerzen, 2007). However, the literature also acknowledges that
such sharing increases transaction costs which are positively correlated with environmental
dynamism (e.g. Luo, 2007). The costs include partner opportunism, coordination costs, equity
hostage and dependence, etc. ( Williamson, 1985) . Empirical studies show that these costs,
under certain conditions, can surpass benefits provided by partners’ sharing resources (e.g.
Kumar, 2011). For example, Joshi and Nerkar (2011) find that partners’ resource sharing may
even make partners’ R&D and production activities unproductive. A logical explanation for
the dilemma is that sharing certain resources leads to high transaction costs and sharing other
resources may not incur high levels of such costs. As such, an important question emerges as
to how to differentiate these resources. Moreover, resources have scale/scope free property and
the property affects partners’ resource sharing (Levinthal and Wu, 2010).
This paper aims to differentiate resources. It develops and tests the hypotheses that the costs
and the benefits of sharing resources between partners depend, to a great extent, on categories
of resources and the environments within which such sharing occurs. In a highly dynamic
market, the transaction costs of sharing intangible resources between partners may be much
higher than the transaction costs of sharing tangible resources between the same partners. The
partners can specify how they share the risks and costs in the contract when they share tangible
resources. However, they can hardly determine accurately the partner’s opportunistic behavior
in sharing intangible resources and the impacts of environmental dynamism on such sharing.
In contrast, in such a market, the benefit of sharing tangible resources may be higher than the

© ICBTS Copyright by Author(s) The 2016 International Academic Research Conference in Paris 2
benefits of sharing intangible resources because firms do not want to invest substantially on
tangible resources when they face high environmental dynamism. More importantly, the
scale/scope free property of resources moderates these relationships between resource sharing
and environmental dynamism.
The findings of this study make significant contributions to the existing literature on two fronts.
First, it clarifies the fact that the benefits and the costs of sharing resources between partners
depend on the types of resources and the environments within which the sharing occurs. The
finding explains why firms are willing to share resources in highly dynamic environments.
Second, this study indicates that the scape/ scope free property of resources affect resource
sharing between partners. The scale/scope free property of resources has been widely discussed
in the diversification literature. However, as far as we know, existing studies have not reported
how the property affects the efficiency of utilizing resources pooled from different companies.
THEORY AND HYPOTHESIS
Resources include anything that might be related to a strength or weakness of a given firm
(Wernerfelt, 1984). A large number of researchers have differentiated resources into different
categories. Some researchers grouped resources into physical, human, and capital categories
(Barney, 1991). Others added employed finer categories, such as financial, technological, and
reputational resources, to name just a few ( Miller & Shamsie, 1996) . To simplify the
differentiation, this study follows Wernerfelt’ s ( 1984) definition and differentiates resources
into tangible and intangible ones. Physical and financial resources are tangible while
technological and reputational resources are intangible. We believe such definition facilitates
the employment of transaction cost theory and resource-based view in analyzing the properties
of resources. Resource- based view suggests that important resources not only enable
companies to pursue opportunities or avoid threats but also are rare, or hard to imitate, and
have no direct substitutes ( Barney, 1991) . In comparison, intangible resources are more
difficult to duplicate or substitute than tangible resources because the value, the components
and the causal relationships between the components of the former is more difficult to
determine. Due to the same properties, it is more difficult for firms to determine the asset
specificity and uncertainty of intangible resources. Consequently, opportunism by partners in
sharing intangible resources can be higher and protection of intangible resources is more costly
(Rindfleisch & Heide, 1997). Transaction cost theory uses these dimensions to determine the
governance costs.
Sharing tangible and intangible resources has important implications in dynamic environments.
Environmental dynamism is manifest in velocity, ambiguity, unpredictability and complexity
(Davis et al. , 2009) . In stable environments, new opportunities or threats may emerge but
slowly and infrequently. In dynamic environments, new opportunities or threats may show up
abruptly before firms are prepared. Ambiguity is lack of clarity. Ambiguity makes it difficult
for firms to interpret or distinguish opportunities or threats. Unpredictability leads to disorder
or turbulence. In an unpredictable setting, there is no consistent pattern of opportunities or
threats. Complexity is associated with the number of opportunities or threats present in the
markets. The more opportunities or threats firms experience in the market, the more dynamic
the market is.
Sharing intangible resources relatively does not make much economic sense in highly dynamic
environments. Intangible resources, such as technological know-how and reputation, are subtle,
© ICBTS Copyright by Author(s) The 2016 International Academic Research Conference in Paris 3
hard-to-understand, or built on accumulation of experiences and knowledge, and continuous
financial and human investments (Nelson & Winter, 1982). Some intangible resources may be
property based while others can be knowledge based or financial/ human investment based.
Partners may share intangible resources through licensing/ franchising, joint ventures or R&D
consortia. From intangible resource suppliers’ point of view, protecting intangible resources is
difficult and costly. The firms who own the resources mainly use partnership contracts to
safeguard the value of these resources in order to maximize its economic rents from alliances
and sustain the value of these resources. Transaction cost theory indicates that environmental
dynamism makes such safeguards difficult because, with the ambiguity associated with the
environmental dynamism, partners can hardly specify each partner’ s responsibilities and
obligations in the contracts in sharing intangible resources (Luo, 2007) . Monitoring partners’
behavior is difficult in a highly dynamic environment. Moreover, sharing intangible resources
is a firm-specific investment and such investments have, by definition, limited economic value
in alternative settings. If the alliance agreements are terminated unexpectedly due to the
environmental changes, firms can hardly recoup their initial investments. On the other hand, it
is difficult for partners to appraise the value of intangible resources when market changes are
ambiguous and unpredictable (Miller and Shamsie, 1996). With unpredictability, the longevity
of these resources is difficult to estimate and is at risk of becoming obsolete. More importantly,
sharing intangible resources needs fine coordination between firms and such fine coordination
is difficult to achieve in dynamic environments. Increased environmental dynamism can easily
ruin partners’ existing resource complementarity or make partners’ contributions to the existing
alliance replaceable (Goerzen, 2007; Lin et al., 2009). Such environmental dynamism may also
alter task requirements and thus render partners’ existing operating systems and processes
incompatible ( Santoro and McGill, 2005) . Each partner has to frequently adapt its operating
systems and processes to fit rapidly changing environments and such adaption diverts the firm
away from its existing routines, cultures and norms. As such, firms tend to avoid sharing
intangible resources in highly dynamic environments.
From intangible resource beneficiaries’ point of view, sharing such resources does not make
sense either in dynamic environments. Sharing resources is based on the value and the
complementarity of resources. Such value and complementarity may decrease fast in dynamic
environments.
Hypothesis 1: The higher the environmental dynamism, the fewer intangible resources partners
will share.
General resources are different from firm-specific ones in that general resources are subject to
ready imitation by other firms. Capital, land and unskilled labor are examples of general
resources. Environmental dynamism provides a flow of opportunities that typically is fast,
complex, ambiguous, and unpredictable (Davis et al. , 2009). Firms may not have sufficient
general resources under their direct control to exploit these opportunities. Direct control over
abundant general resources results in inflexibility which makes firms inefficient to manage the
complexities and ambiguity. Strategic alliances enable these firms to get access to external
general resources. Through joint venture in foreign countries, for example, partners can have
access to local production infrastructure and low-cost labor. On the other hand, sharing general
resources may not lead to high transaction costs because these resources are widely available
in the markets. Sharing general resources rather than owning general resources provides
important strategic benefits, such as loose coupling, ambidexterity and improvisation, which

© ICBTS Copyright by Author(s) The 2016 International Academic Research Conference in Paris 4
increase firms’ learning speed and responsiveness to manage environmental dynamism (Luo,
2007) . More importantly, sharing general resources reduces investment risks ( Miller and
Reuer, 1996). As such, firms tend to get access to these resources through strategic alliances
when they experience high environmental dynamism. Accordingly, we predict that:
Hypothesis 2: The higher the environmental dynamism, the more tangible resources partners
will share.
Accounting costs and non-accounting costs
Environmental dynamism raises firms’ accounting costs because the dynamism leads to both
opportunities and threats, and managing increased opportunities and threats incurs accounting
costs. Partners may not have sufficient financial resources to cover the costs on their own. More
importantly, unexpected accounting costs may increase substantially in dynamic environments
due to the high unpredictability and velocity and sourcing from partners is an effective way to
manage such sharp cost fluctuations. Sourcing cash from partners, for example, is a frequently
used option for firms in high- tech industries. Because accounting costs are specified in
numbers, both parties’ responsibilities and obligations in sharing these costs can be relatively
precisely defined in partnership contracts. In other words, transaction costs for such sharing is
minimal.
Non-accounting costs include transaction costs and opportunity costs. Non-accounting costs
are mutual between partners. Both partners share such costs when they form strategic alliances.
Existing studies have shown that both parties may earn private benefits unilaterally from the
alliance ( e. g. , Kumar, 2011) . Such private benefits vary from cheating to learning by
observation without other party’s permission. Consequently, both partners have to monitor
each other’s behavior to reduce the possibilities of opportunism because both partners invest
in the alliances and they have to protect such partner-specific investments.
Similarly, both partners pay opportunity costs. As all partners suffer resource limitations,
allocation of resources toward a particular partnership project would reduce the resources
available for other market opportunities. Environmental dynamism increases opportunity costs
because environmental dynamism results in abundance of unpredictable threats and
opportunities. Alliances help partners to manage certain threats and opportunities but not the
others.
Specifying and negotiating each party’ s responsibilities and obligations in sharing non-
accounting costs is difficult. First of all, it is difficult for firms to determine these non-
accounting costs, especially when the environments are highly dynamic. Moreover, non-
accounting costs are positively correlated with environmental dynamism ( Luo, 2007) . If
partners jointly develop a new technology, for example, both parties have to monitor and
control each other’s behavior to ensure that the partner does not use the technology for purposes
unspecified in the contract. Such monitoring and controlling are difficult in dynamic
environments because information can be unavailable or outdated fast. More importantly,
partner opportunism to use the technology with guilt may increase with the dynamism because
such behavior may not be detected in ambiguous and complex contexts. High uncertainties
enable opportunistic partners to seek their own unilateral gains at the expense of others by
breaching the contract or agreement, exercising private control, withholding or distorting
information, withdrawing commitment, shirking obligation, or grafting joint earnings (Luo,
2007).

© ICBTS Copyright by Author(s) The 2016 International Academic Research Conference in Paris 5
High levels of environmental dynamism not only increase non-accounting costs but also make
the non-accounting cost forecasting inaccurate. Dynamism creates the causal ambiguity which
blurs the links between non-accounting costs and the effectiveness to reduce transaction costs
and opportunity costs, and many contingencies will distort cost estimates (Sirmon et al., 2007).
Because accurate cost forecasting is difficult to achieve, partners have to identify and correct
their forecasting problems by frequently re-estimating and reallocating costs between them.
Such frequent re-estimation and reallocation not only make existing partnership agreements
non-binding, but also create enormous uncertainties for the future of these agreements.
Firms try to minimize non-accounting costs because, like accounting costs, non-accounting
costs reduce profits. Therefore, partners will share less non-accounting costs by making less
commitment to the alliances when they experience high environmental dynamism.
Accordingly, we predict that:
Hypothesis 2a: The higher the environmental dynamism, the more accounting costs partners
will share.
Hypothesis 2b: The higher the environmental dynamism, the less non- accounting costs
partners will share.
Visible and invisible risks
Visible risks are the possibilities that a hazard may occur in a decision-maker's perception. In
other words, they can be defined and specified in partnership contracts. When partners jointly
develop a new product, for example, they may predict the possible failure of the new product.
Invisible risks are unforeseeable risks. For example, the sudden death or resignation of a firm's
CEO may cause sharp fluctuations in the firm’ s stock value. Because of such unforeseeablity
and unexpectedness, invisible risks can hardly be specified and each party’s responsibility and
obligations in sharing these invisible risks can hardly be clearly determined in the partnership
contracts.
Environmental dynamism increases both visible and invisible risks. However, its impacts on
these risks are different. Environmental dynamism enhances partners’ desire to share the visible
risks because the dynamism increases the risks and the costs to cover the risks. Firms may not
have sufficient resources, such as cash, to manage these risks on their own. More importantly,
the responsibilities and obligations to share risks between partners can be specified in
partnership contracts so the possibilities of partner opportunism are minimal.
Because the invisible risks are unforeseeable, the responsibilities and obligations in sharing
invisible risks are mainly based on partners’ mutual trusts. However, existing studies have
shown that such trusts are negatively correlated with environmental dynamism (e.g. Cui et al.,
2011; Kumar, 2011) . Moreover, environmental dynamism constrains partners’ ability to
specify contract contingencies, clarify mutual responsibilities, control the implementation of
alliance agreements, and evaluate the outcomes of the agreements ( Agarwal et al. , 2010) .
Generally, firms share invisible risks only when they are confident that the risk-adjusted returns
of a joint project will be positive. High levels of environmental dynamism may reduce or even
damage the confidence because risk forecasting and measurements become highly inaccurate,
if not impossible, in such environments. Accordingly, we predict that:
© ICBTS Copyright by Author(s) The 2016 International Academic Research Conference in Paris 6
Hypothesis 3a: The higher the environmental dynamism, the more visible risks partners will
share.
Hypothesis 3b: The higher the environmental dynamism, the less invisible risks partners will
share.
METHODOLOGY
Setting, sample, and data
This study used data of Canadian technology firms to test the hypotheses. 1 Existing studies
show that technology industries are likely to experience high environmental dynamism ( e. g.
Qian and Li, 2003).2 To be selected in this study, sample firms should have working experience
with at least one partner, be at least 5 years old to ensure that firms had outgrown the dynamic
turmoil of the early establishment years; and employ at least ten people to differentiate them
from “mom-and-pop” enterprises. Using these criteria, we identified and targeted 761 firms.
Prior to conducting the survey, we selected three Canadian multinationals in Western Ontario
for a pilot case study. In addition to making field observations, we interviewed the chief
executive officer (CEO) of each firm using a semi- structured format. Selection of constructs
and their measurements in the questionnaires were based on the qualitative data collected in
these interviews. Two waves of questionnaires were mailed to the CEOs or the highest-ranking
officers of the target firms. All questions in the questionnaires were presented as a seven-point
Likert- type scale ( ranging from 1 = strongly disagree to 7 = strongly agree) . Completed
responses were received from 167 firms, yielding a response rate of 22% . To assess non-
response bias in the survey, early respondents were compared to late respondents, with the
latter assumed to be similar to non-respondents. A t-test was used to compare the two groups
on the three known attributes: age (t = 1.16, p < 0.22), number of partners (t = 0.78, p =0.41)
and number of employees (t = 0.93, p = 0.36). Consequently, it was concluded that the sample
represented its target population.
Main variables
Firm-specific resources consist of five measurement items: (1) patents; (2) expertise in making
a product; (3) possession of a unique technology; (4) skilled labor; and (5) brand equity (Miller
and Shamsie, 1996). General resources are composed of four measurement items: (1) cash; (2)
production and storage infrastructure; ( 3) unskilled labor; and ( 4)
communication/ transportation/distribution facilities (Bradley et al. , 2011) . Accounting costs
include: (1) prime costs; (2) conversion costs; and (3) non-manufacturing costs (Claycomb and
Frankwick, 2005) . Non- accounting costs are composed of both transaction costs and
opportunity costs. Measurement items of transaction costs include (1) monitoring/controlling
costs; ( 2) coordination costs; ( 3) information collecting/ processing costs; ( 4) partner
1 The sample firms were selected from Sedar, Financial Post Advisor, and the Canadian government website at http://www.ic.gc.ca/eic/site/ic-ic.nsf/eng/h_dh00006.html.
2 The technology industries selected include biotechnology, hydrogen and fuel cells, information & communications technologies, life
sciences, nanotechnologies, ocean technologies, and others.
© ICBTS Copyright by Author(s) The 2016 International Academic Research Conference in Paris 7
maximizing unilateral interests; and ( 5) partner cheating. Measurement items of opportunity
costs include (1) the loss of other market opportunities; (2) failure to address other threats; and
(3) loss of possible profits in other business. Measurement items of visible risks consist of (1)
magnitude of possible loss; ( 2) chances of possible loss; and ( 3) exposure to possible loss
( Miller and Reuer, 1996) . Measurement items of invisible risks include ( 1) feelings that
unfavorable hazards would occur; ( 2) the perceived possibilities that unknown unfavorable
hazards would occur; and (3) past experiences that unfavorable hazards which were undefined
in partnership contracts occurred when contracts were executed (Das and Teng, 2001).
We used a composite index of four items to measure sharing of each above-mentioned category
between partners. These four items include necessity, magnitude, duration, and possible
impacts of sharing ( see Appendix 1) . Measurement of environmental dynamism ( EV) was
based on the items developed by Boyd and associates (1993) and Zahra and associates (1997),
and there were seven such items that compose the construct (see Appendix 1). Both linear and
squared terms of the variable ( EV and EV2) were used to denote low and high levels of
environmental changes.
We assessed the constructs’ reliability and validity using different statistics such as Cronbach’s
alpha, internal consistency reliability (ICR) , individual item loading (and also t statistic) , and
square root of average variance extrated (AVE). These statistics indicate all constructs satisfied
both reliability and validity (see Appendix 1).
Control variables
Following previous studies (e.g., Qian and Li, 2003; Zahra et al., 1997), we control for various
firm- and industry- specific variables. ( 1) Firm size is measured by the log of a firm’ s total
number of employees. ( 2) Firm age is measured by the number of years a firm has been
operating. (3) Firm leverage is calculated as long-term debt divided by total capital. (4) R&D
intensity is measured using annual R&D expenditure divided by total sales. ( 5) We compute
the firm’s average annual expenditure on advertising and divide it by average sales revenue to
derive advertising intensity. Finally, dummy variables are used to represent the influence of
the main operating industry. For econometric reasons, we omit one industry ( Others) so that
the estimated coefficients should be interpreted as the difference in the dependent variable by
the industry in question from the omitted group.
RESULTS
Table 1 presents the descriptive statistics and intercorrelations of the quantitative variables
examined in the study. The correlation coefficients among the variables are generally low,
suggesting that multicollinearity is not a serious problem for hypotheses testing. Moreover, we
conduct an additional regression diagnosis using the variance- inflating factor ( VIF) . The
average VIF score is 1.11 and the range of VIF scores is between 1.03 and 1.36. These results
provide further confirmation that there is no significant problem of multicollinearity.
[Insert Table 1 about here]
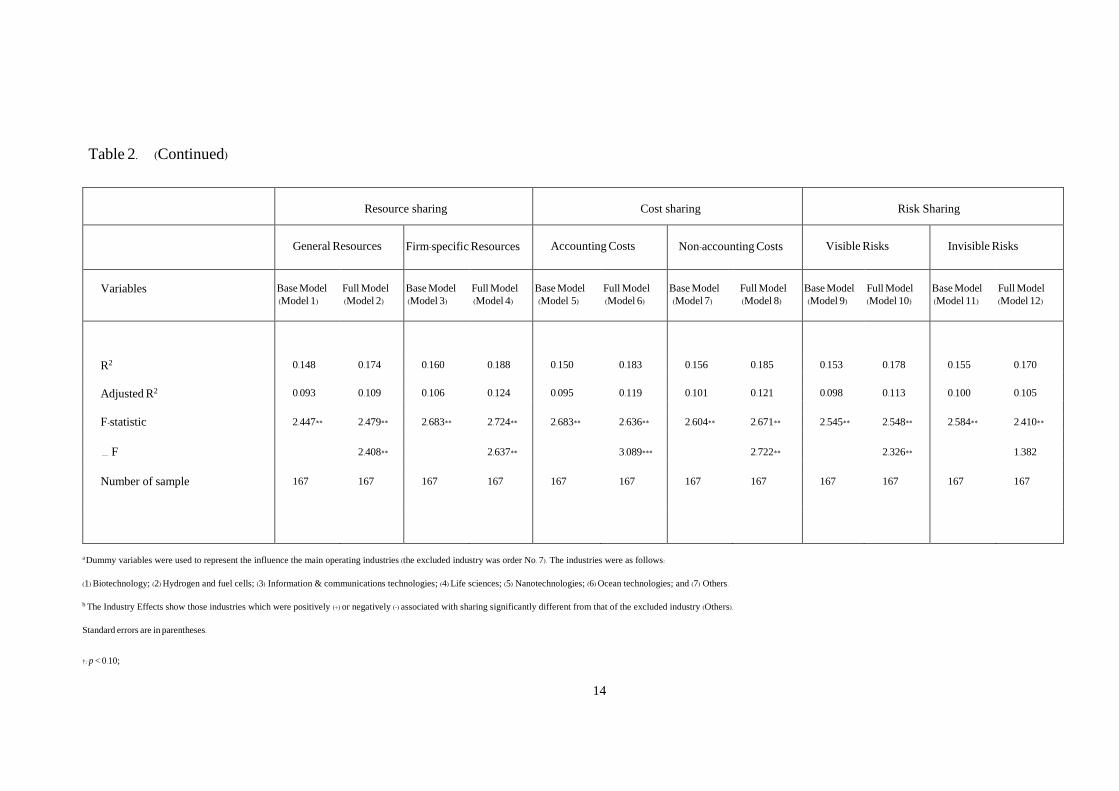
Table 2 presents three sets of models to test our hypotheses, each model dealing with sharing
resources (general and firm-specific), costs (accounting and non-accounting), and risks (visible
and invisible). In each set, we have both base and full models. The former includes all of the
control variables while the latter further adds both linear and squared terms of environmental
dynamism.

© ICBTS Copyright by Author(s) The 2016 International Academic Research Conference in Paris 8
[Insert Table 2 about here]
Model 2, which tests H1a, indicates that though both linear and quadratic environmental
dynamism variables are positive in sign, the latter variable (ED2 = 0.1095, p < .01) has a much
higher level of significance than the former one (ED = 0.0782, p < .10). Thus, the results fully
support H1a. We also find support for H1b, which is tested in Model 4. The results show that
the linear term of environmental dynamism is positive (ED = 0.0926, p < .05) while the squared
term of the variable is negative (ED2 = -0.0958, p < .05).
H2a and H2b are tested in the two respective models (Model 6 and Model 8). In Model 6, both
linear and quadratic environmental dynamism variables are positive and significant at the 0.05
(ED = 0.0981) and 0.01 (ED2 = 0.1239) levels, respectively. In Model 8, the sign of both linear
and squared term variables is opposite though both variables are significant both at the 0. 05
levels. Taken together, we find support for both H2a and H2b.
Finally, Model 10 and Model 12 test H3a and H3b, respectively. The results in Model 10
indicate that the effect of environmental dynamism on visible risk sharing is higher when
environmental dynamism takes a quadratic (than linear) term, though both are positive in sign
( ED = 0. 0794, p < . 10; ED2 = 0. 1057, p < . 01) . The results in Model 12 show that the
relationship between environmental dynamism and invisible risk sharing is non- significant
whenever the term of environment dynamism is linear (ED = 0.0561, n.s.) or quadratic (ED2 =
-0.0493, n.s.), though both being opposite in sign. Results support H3a but not H3b.
All other models (except in Model 12) are significant. The adjusted R2 values for the six full
models range from 0.105 (F = 2.410) to 0.124 (F = 2.724). The addition of environmental
dynamism ( both linear and quadratic terms) into the base models increases the explanatory
power of the five full models as shown in F change (F) , being significant at the 0.01 and
0.001 levels, respectively.
DISCUSSION AND CONCLUSION
The evidence collected in this study indicates that sharing firm- specific resources and non-
accounting costs is feasible at low level of environmental dynamism. In other words, a low
level of environmental dynamism does not impede such sharing. When environmental
dynamism grows high, however, sharing firm- specific resources and non- accounting costs
becomes unlikely. In contrast, partners share general resources, accounting costs and visible
risks in a highly dynamic environment. It should be noted that sharing invisible risks between
partners may not be affected by the levels of environmental dynamism. Two possible
interpretations emerge from this study. Frist, invisible risks increase substantially when
environments grow dynamic. As such, partners have to share more invisible risks if they want
to keep their partnerships. Second, it is difficult for managers to define invisible risks regardless
of the level of environmental dynamism and they cannot negotiate and specify such risks in the
partnership contracts. Consequently, they do not have a clear idea of how to deal with such
risks. Perhaps both causes co-exist and they work in combination.
The findings of this study have important theoretical implications. First, partners share more
general resources, accounting costs and visible risks when environments grow dynamic. As
such, sharing general resources, accounting costs and visible risks may not necessarily increase
transaction costs and increased environmental dynamism enhances the needs for partners to
share general resources, accounting costs and visible risks. The evidence explains why firms
use strategic alliances in highly dynamic environments. Transaction costs are associated not
only with environmental dynamism but also with the nature of the resources, costs and risks
that partners share. Second, sharing firm-specific resources and non-accounting costs between
© ICBTS Copyright by Author(s) The 2016 International Academic Research Conference in Paris 9
partners decreases with environmental dynamism. The evidence confirms the traditional belief
that sharing firm- specific resources incurs transaction costs in dynamic environments.
Moreover, such sharing may also increase opportunity costs which have been ignored in the
mainstream literature. Both transaction costs and opportunity costs vary positively with
environmental dynamism and both of them are sacrifice partners make in their partnerships.
Transaction costs have been widely discussed in the existing literature but opportunity costs do
not receive a similar attention. Finally, in contrast to the existing literature, partners are willing
to share more visible risks when environments are dynamic. Even their sharing of invisible
risks may not necessarily decrease in highly dynamic environments. In other words, the
traditional belief that environmental dynamism is negatively correlated with partners’ wishes
to share risks may not be true.
The findings of this study have important managerial implications. The intention of
partnerships varies with environmental dynamism. Managers should use partnerships to get
access to general resources and share accounting costs when environments are highly dynamic.
In contrast, they should use partnerships to share firm-specific resources, non-accounting costs
and visible risks when environments are stable. Risks can be invisible and partners may not
have a clear idea of what these risks are when they sign the contracts. However, sharing
invisible risks may not necessarily be insensible when environments are dynamic.
REFERENCES
Agarwal R, Croson R, Mahoney J. 2010. The roles of incentives and communication in
strategic alliances: an experimental investigation. Strategic Management Journal 31(4): 413-
437.
Barney J. 1991. Firm resources and sustained competitive advantage. Journal of Management
17(1): 99-120.
Boyd BK, Dess GG, Rasheed AMA. 1993. Divergence between archival and perceptual
measures of the environment: causes and consequences. Academy of Management Review
18(2): 204-226.
Bradley S, Aldrich H, Shepherd D, Wiklund J. 2011. Resources, environmental change and
survival: asymmetric paths of young independent and subsidiary organizations. Strategic
Management Journal 32: 456–509.
Claycomb C, Frankwick G. 2005. The dynamics of buyers' perceived costs during a
relationship development process: an empirical assessment. Journal of Business Research
58(12): 1662-1671.
Cui A, Calantone R, Griffith D. 2011. Strategic change and termination of interfirm
partnerships. Strategic Management Journal 32: 402-423.
Das T, Teng B-S. 2001. Strategic risk behavior and its temporalities: between risk propensity
and decision context. Journal of Management Studies 38 (4):515-534.
Davis J, Eisenhardt K, Bingham C. 2009. Optimal structure, market dynamism, and the strategy
of simple rules. Administrative Science Quarterly 54: 413–452.

© ICBTS Copyright by Author(s) The 2016 International Academic Research Conference in Paris 10
Goerzen A. 2007. Alliance networks and firm performance: the impact of repeated
partnerships. Strategic Management Journal 28: 487-509.
Joshi A, Nerkar A. 2011. When do strategic alliances inhibit innovations by firms? Evidence
from patent pools in the global optical disc industry. Strategic Management Journal 32: 1139-
1160.
Kumar S. 2011. Are joint ventures positive sum games? The relative effects of cooperative and
noncooperative behavior. Strategic Management Journal 32(1): 32-54.
Levinthal, D, Wu, B. 2010. Opportunity costs and non- scale free capabilities: profit
maximization. Corporate scope, and profit margins. Strategic Management Journal 31, 780-
801.
Lin Z, Yang H, Arya B. 2009. Alliance partners and firm performance: resource
complementarity and status association. Strategic Management Journal 30: 921-940.
Luo Y. 2007. Are joint venture partnerships more opportunistic in a more volatile environment?
Strategic Management Journal 28: 39-60.
Miller K, Reuer J. 1996. Measuring organizational downside risk. Strategic Management
Journal, 17: 671-691.
Miller D, Shamsie J. 1996. The resource-based view of the firm in two environments: the
Hollywood firm studios from 1936-1965. Academy of Management Journal 39(3): 519-543.
Nelson R, Winter SG. 1982. An Evolutionary Theory of Economic Change. Harvard University
Press: Cambridge, MA.
Qian G, Li L. 2003. Profitability of small- and medium- sized enterprises in high- tech
industries: the case of the biotechnology industry. Strategic Management Journal 24(9): 881-
887.
Santoro MD, McGill J. 2005. The effect of uncertainty and asset co- specialization and
governance in biotechnology alliances. Strategic Management Journal 26: 1261-1269.
Sirmon D, Hitt M, Ireland D. 2007. Managing firm resources in dynamic environments to
create value: looking inside the black box. Academy of Management Review 32: 273-292.
Williamson OE. 1985. The Economic Institutions of Capitalism. Free Press: New York.
Wang H, He J, Mahoney J. 2009. Firm- specific knowledge resources and competitive
advantage: the roles of economic – and relationship-based employee governance mechanism.
Strategic Management Journal 30: 1265-1285.
Wernerfelt, B. 1984. A resource- based view of the firm. Strategic Management Journal, 5:
171-180.
Wu, B. Opportunity costs, industry dynamics, and corporate diversification: Evidence from the
cardiovascular medical device industry, 1976-2004. Strategic Management Journal 34, 1265-
1287.

© ICBTS Copyright by Author(s) The 2016 International Academic Research Conference in Paris 11
Zahra SA, Neubaum DO, Huse H. 1997. The effect of the environment on export performance
among telecommunications new ventures. Entrepreneurship Theory and Practice 22: 25-46.

12
Table 1. Mean, standard deviations, and correlations for quantitative variables
Variables Mean S.D. 1 2 3 4 5 6 7 8 9 10 11
1. Firm age 12.07 4.63
2. Firm size (log) 1.87 0.29 0.0668
3. Firm leverage 0.464 0.185 0.0473 0.0541
4. R&D intensity 12.36 3.43 0.0383 0.0633 0.0332
5. Advertising intensity 4.83 2.05 0.0557 0.0607 0.0209 0.0339
6. Environmental dynamism 9.61 5.07 0.0447 0.0569 0.0252 0.1073* 0.0495
7. General resource sharing 6.03 0.71 0.0565 0.0252 0.0185 0.0535 0.0409 -0.1114*
8.Firm-specific resource sharing 5.59 0.47 0.0284 -0.0185 0.0127 -0.0262 -0.0218 0.0543 0.0607
9. Accounting cost sharing 5.94 0.73 0.0985† 0.0618 0.0388 -0.0933† -0.0852† -0.1127* 0.1307* -0.0625
10. Non-accounting cost sharing 6.08 0.81 0.1227* 0.0675 0.0534 -0.1132* -0.0927† -0.1252* 0.1434** -0.0668 0.0539
11. Visible risk sharing 5.49 0.58 0.0965† 0.0574 0.0382 -0.0894† 0.0812† -0.1143* 0.1268** -0.0621 0.0605 0.0581
12. Invisible risk sharing 5.77 0.64 0.1132* 0.0635 0.0416 -0.1150* 0.0846† -0.1224* 0.1451** -0.0613 0.0624 0.0553 0.0616
†: p < 0.10
*: p < 0.05
**:p < 0.01

13
Table 2. Regression results of sharing of resources, costs and risks in dynamic environmenta
Resource sharing
Cost sharing
Risk Sharing
Sharing category
General Resources
Firm-specific Resources
Accounting Costs
Non-accounting Costs
Visible Risks
Invisible Risks
Variables
Base Model
(Model 1)
Full Model (Model 2)
Base Model
(Model 3) Full Model
(Model 4) Base Model
(Model 5) Full Model
(Model 6) Base Model
(Model 7) Full Model
(Model 8) Base Model
(Model 9) Full Model
(Model 10) Base Model
(Model 11) Full Model
(Model 12)
Firm age -0.0397 -0.0410 -0.0333 -0.0343 -0.0451 -0.0467 -0.0425 -0.0438 -0.0373 -0.0388 -0.0356 -0.0368
(0.0285) (0.0291) (0.0254) (0.0259) (0.0309) (0.0316) (0.0297) (0.0303) (0.0272) (0.0280) (0.0265) (0.0271)
Firm size -0.0727† -0.0744† -0.0912* -0.0926* -0.0762† -0.0775† -0.0938* -0.0950* -0.0705† -0.0719† -0.0888* -0.0904* (0.0399) (0.0405) (0.0371) (0.0375) (0.0411) (0.0414) (0.0375) (0.0378) (0.0393) (0.0398) (0.0379) (0.0372)
Firm leverage 0.0118 0.0129 0.0151 0.0166 0.0104 0.0116 0.0132 0.0143 0.0095 0.0108 0.0122 0.0138
(0.0163) (0.0159) (0.0150) (0.0162) (0.0176) (0.0165) (0.0157) (0.0147) (0.0190) (0.0174) (0.0162) (0.0158)
R&D intensity 0.0767† 0.0784† 0.1069** 0.1084** 0.0809† 0.0823† 0.0953* 0.0968* 0.0909* 0.0927* 0.0823† 0.0835† (0.0412) (0.0416) (0.0370) (0.0374) (0.0424) (0.0429) (0.0378) (0.0382) (0.0371) (0.0374) (0.0431) (0.0432)
Advertising intensity -0.0229 -0.0245 -0.0183 -0.0195 -0.0147 -0.0161 -0.0118 -0.0135 -0.0154 -0.0178 -0.0125 -0.0139
(0.0210) (0.0221) (0.0175) (0.0185) (0.0148) (0.0158) (0.0163) (0.0156) (0.0152) (0.0172) (0.0160) (0.0153)
Environmental dynamism 0.0782† 0.0929* 0.0981* 0.0882* 0.0794† 0.0561
(0.0416) (0.0375) (0.0386) (0.0377) (0.0419) (0.0356)
Environmental dynamism squared 0.1095** -0.0958* 0.1239*** -0.0907* 0.1057** -0.0493
(0.0376) (0.0379) (0.0362) (0.0371) (0.0368) (0.0326)
Significant industry effectsb
1 1 1 1 1 1 1 1 1 1 1 1
3 3 3 3 3 3 3 3 3 3 3 3
4 4 4 4 4 4 4 4 4 4 4 4
14
Table 2. (Continued)
Resource sharing
Cost sharing
Risk Sharing
General Resources
Firm-specific Resources
Accounting Costs
Non-accounting Costs
Visible Risks
Invisible Risks
Variables
Base Model
(Model 1)
Full Model (Model 2)
Base Model
(Model 3) Full Model
(Model 4) Base Model
(Model 5) Full Model
(Model 6) Base Model
(Model 7) Full Model
(Model 8) Base Model
(Model 9) Full Model
(Model 10) Base Model
(Model 11) Full Model
(Model 12)
R2 0.148 0.174 0.160 0.188 0.150 0.183 0.156 0.185 0.153 0.178 0.155 0.170
Adjusted R2 0.093 0.109 0.106 0.124 0.095 0.119 0.101 0.121 0.098 0.113 0.100 0.105
F-statistic 2.447** 2.479** 2.683** 2.724** 2.683** 2.636** 2.604** 2.671** 2.545** 2.548** 2.584** 2.410**
F 2.408** 2.637** 3.089*** 2.722** 2.326** 1.382
Number of sample 167 167 167 167 167 167 167 167 167 167 167 167
a Dummy variables were used to represent the influence the main operating industries (the excluded industry was order No. 7). The industries were as follows:
(1) Biotechnology; (2) Hydrogen and fuel cells; (3) Information & communications technologies; (4) Life sciences; (5) Nanotechnologies; (6) Ocean technologies; and (7) Others. b The Industry Effects show those industries which were positively (+) or negatively (-) associated with sharing significantly different from that of the excluded industry (Others).
Standard errors are in parentheses.
†: p < 0.10;

15
*: p < 0.05;
**: p < 0.01
***: p < 0.001

16
Appendix1. Constructs and indicators __________________________________________________________________________________________________________________
Variable name and item Factor loading t-value __________________________________________________________________________________________________________________
1. General resource sharing (Cronbach’s Alpha = 0.74; ICR = 0.821; AVE = 0.535)
The firm has more agreements to share general resources than industry average 0.718 3.68
The firm shares more general resources than industry average 0.767 4.27
The firm shares general resources longer than industry average 0.734 3.92
Sharing general resources has greater effects on our operations than on industry average 0.704 3.25
2. Firm-specific resource sharing (Cronbach’s Alpha = 0.79; ICR = 0.873; AVE = 0.633)
The firm has more agreements to share firm-specific resources than industry average 0.787 4.43
The firm shares more firm-specific resources than industry average 0.835 4.85
The firm shares firm-specific resources longer than industry average 0.809 4.57
Sharing firm-specific resources has greater effects on our operations than on industry average 0.749 4.13
3. Accounting cost sharing (Cronbach’s Alpha = 0.73; ICR = 0.824; AVE = 0.539)
The firm has more agreements to share accounting costs than industry average 0.728 3.75
The firm shares more accounting costs than industry average 0.755 4.08
The firm shares accounting costs longer than industry average 0.741 3.86
Sharing accounting costs has greater effects on our operations than on industry average 0.711 3.45
4. Non-accounting resource sharing (Cronbach’s Alpha = 0.77; ICR = 0.870; AVE = 0.625)
The firm has more agreements to share non-accounting costs than industry average 0.781 4.29
The firm shares more non-accounting costs than industry average 0.817 4.72
The firm shares non-accounting costs longer than industry average 0.802 4.53
Sharing non-accounting costs has greater effects on our operations than on industry average 0.762 4.18
5. Visible risk sharing (Cronbach’s Alpha = 0.71; ICR = 0.800; AVE = 0.502)
The firm has more agreements to share visible risks than industry average 0.696 3.16
The firm shares more visible risks than industry average 0.730 3.79
The firm shares visible risks longer than industry average 0.715 3.54
Sharing visible risks has greater effects on our operations than on industry average 0.687 3.04
__________________________________________________________________________________________________________________

17
Appendix 1. (Continued) ____________________________________________________________________________________________________________________
6. Invisible risk sharing (Cronbach’s Alpha = 0.76; ICR = 0.843; AVE = 0.573)
The firm has more agreements to share invisible risks than industry average 0.737 4.06
The firm shares more invisible risks than industry average 0.791 4.46
The firm shares invisible risks longer than industry average 0.775 4.22
Sharing invisible risks has greater effects on our operations than on industry average 0.725 3.83
7. Environmental dynamism (Cronbach’s Alpha = 0.84; ICR = 0.956; AVE = 0.757)
Product obsolescence rate is high in the industry 0.887 5.14
Technology duplication/replacement rate is high in the industry 0.861 4.89
Rate of responses between competitors is high in the industry 0.898 5.38
Entry and exit rate is high in the industry 0.908 5.59
Bankruptcy rate is high in the industry 0.873 5.02
Rate of changes in consumer preference is high in the industry 0.826 4.49
The uncertainty rate of industry growth is high 0.831 4.68
__________________________________________________________________________________________________________________

© ICBTS Copyright by Author(s) The 2016 International Academic Research Conference in Munich 18
WHAT BRINGS HAPPINESS TO WORKPLACE?
Wan-Hsuan Yen
PhD Candidate, Department of Technology Application and Human Resource Development,
National Taiwan Normal University
Exchange Research Student, University Heidelberg
Bergheimer Straße 58, 69115 Heidelberg, Germany
ABSTRACT
Pursuing happiness is one, if not the most, important driver of human beings. In modern days,
workplace has taken the major part of a lot of people’ s life. As a consequence, the quality of
work time greatly impacts the quality of one’ s living. Although some of the external factors
have been studied on the influence of workplace happiness, the cross- influence with internal
characteristics is quite limited. In this research, we studied the influence on Workplace
Happiness by Meaningful Work, Perceived Organizational Support, Organization
Commitment, with the modulation of Psychology Capital.
151 knowledge workers were surveyed. We found all independent factors including external
and internal factors such as Meaningful Work, Perceived Organizational Support, and
Psychology Capital significantly contribute to Workplace Happiness, when Organization
Commitment mediate the effect of external factors. However, the modulation from
Psychological Capital to the influence from Organizational Commitment is not significant.
This might suggest the independence relationship in between and both internal and external
factors should be emphasized while we want to pursue greater happiness degree.
Keywords--- Workplace Happiness, Organization Commitment, Meaningful Work, Perceived
Organizational Support, Psychology Capital
ABBREVIATIONS
PsyCap (Psychological capital)
INTRODUCTION
With the progress of modern management, more companies aware both physical health
and mental health of employee should be taken care to ensure the stability and the productivity.
On top of this benefit, due to intensive ‘ Talent War’ , a workplace that takes good care of
employees can also enhance the employer branding to attract highly talented people. Since the
talent market is highly competitive, employees with the critical skills are much harder to find
and obtained than before. To make the situation even worse, modern technologies also help
good performing employees a quicker and wider access to new positions. These make the
employers branding even more crucial than before (Bersin, 2013).

© ICBTS Copyright by Author(s) The 2016 International Academic Research Conference in Munich 19
As a consequence, the trend of running for one of the best employers or best work place
gets its popularity among enterprises around world. Goffe and Jones ( 2013) proposed six
principles to create the best workplace on earth: 1. Let People Be Themselves, 2. Unleash the
Flow of Information, 3. Magnify People’ s Strengths, 4. Stand for More Than Shareholder
Value, 5. Show How the Daily Work Makes Sense, 6. Have Rules People Can Believe In.
According to the above suggestion, the meaning of work and the provided support and caring
from the company are the best ways to establish the best workplace.
Earlier researches revealed the importance of organizational commitment. It plays a
role that as a predictor of performance and engagement. Besides, organization commitment is
considered to relate to job satisfaction and motivation. The relationship between workplace
happiness and organization commitment worth further looks.
In addition, modern psychology has adopted the new paradigm, positive psychology.
As a consequence, more companies begin to emphasize on the positive state of human
mentality. Among other capitals such as financial capital and social capital, psychology capital
( PsyCap) is considered to be one of the important resources that able to enhance the
performance of individual and eventually of the organization. Whether PsyCap influence the
workplace happiness is yet to be considered.
LITERATURE & THEORY
Job Demands-Resources Model
Job Demands-Resources Model (JD-R) states there are potential factors that will trigger
pressure in workplace. These factors can be categorizes as job demands and job resources and
these two type have different impacts on employees and organizations. ( Bakker, Demerouti,
de Boer, & Schaufeli, 2003)
Bakker and Demerouti ( 2007) considered, job demands is the necessary physical and
psychological resource devoted when an employee is required to fulfill a job. Although job
demands don’ t necessary bring negative result ( Lu, Kao, Siu, & Lu, 2010; Lu, Siu, & Lu,
2010), it might bring pressure when it is higher than the tolerance of employee.
Job resources refer to the physical, psychological, social, or organizational resource,
such as learning and development opportunities. Although job resource may not thoroughly
resolve the pressure from job, these resources can motivate employees (Hackman and Oldham,
1980) . As long as job resources can fulfill the psychological demand, the employee’ s
willingness to work will also increase. (Meijman & Mulder, 1998)
Bakker, Emmerik, and Riet (2008) stated job demands and job resources have different
effect on employees: job demands have negative correlation with employee’s health while job
resources have positive correlation with attitude ( Schaufeli & Bakker, 2004) . According, to
balance the both side in a proper way is the purpose of optimizing human resource. ( Bakker,
et al., 2007)
© ICBTS Copyright by Author(s) The 2016 International Academic Research Conference in Munich 20
Besides, job resources can be categorizes into intrinsic resource and extrinsic resource.
Intrinsic job resources refer to automasy or competence. Extrinsic job resources refer to the
praise or support that might help employee achieve goals. Recent researches have shown
commitment human resource is an important initiative that can provide employee both intrinsic
and extrinsic job resource. (Arthur, 1994; Dyer & Holder, 1988)
Walton ( 1985) categorized strategic human resource management into two types,
control type and commitment type. Both strategies aim to increase the efficacy of employee
and productivity. Rather than forcing employees to work efficiently and paying by production,
commitment type takes encouraging and motivating approach. The organization will try to
fulfill the psychological demand of employees and help them understand the goal of the
organization while providing them with resources to complete individual’ s job goal more
efficiently. (Arthur, 1994; Whitener, 2001; Wood & de Menezes, 1998)
Researches revealed, commitment type organization will have higher organization
commitment and trust, and the behavior citizenship is more easily triggered ( Lin & Hsieh,
2007). This approach can also make employees more willingly to share individual’s knowledge
and experience and let employees have higher level of trust to organization.
Workplace Happiness
‘ Happiness is often operationalized as subjective well- being, a concept comprising
three components – life satisfaction, positive affect, and negative affect’ ( Gard, 2012) .
Carruthers and Hood ( 2004) considered well- being as the concepts make people considered
happiness, optimistic, and energetic, self- realization and satisfaction. Lu ( 1998) also
considered ‘ Subjective Wellbeing’ is a deep evaluation of life quality; it includes positive
emotions and subjective feelings about the whole satisfaction of life.
Many scholars considered ‘ Wellbeing’ is one subjective experience that includes
satisfaction, positive emotion, and negative emotion. Which means the evaluation of wellbeing
includes both emotion and cognitive level ( Andrew & Withey, 1976; Emmons, 1999; Watson
& Tellegen, 1985) . Keyes ( 2013) stated, ‘ there is growing recognition of the personal and
social utility of subjective well- being, both higher levels of hedonic and eudaimonic
wellbeing’.
Whether well- being comes from external or internal factors? Sheldon and Kasser
(2001) considered wellbeing comes from the satisfaction when achieving desired goal and the
experience then become the driving force for pursuing well-beings. Sarvimi and Stenbock-Hult
( 2000) claimed, it is not the high quality life if one has no pain completely, but if one have
balanced pain and happiness can man have the best quality of life and live well. Some scientists
stated well-being and ill-being born side-by-side and the combination of them is zero (Diener,
1984) Other scholars considered wellbeing is relating to characteristics that vary from different
type of persons ( Headey & Wearing, 1991; Stone & Kozma, 1985) . Yet another group of
scholars proposed well- being is through comparison to one’ s life goal or other circumstance,

© ICBTS Copyright by Author(s) The 2016 International Academic Research Conference in Munich 21
for instance, one’ s past history or others’ life situation ( Rim, 1993; Argyle, 1987) . This
indicates well-being can be influenced by life events.
As summarized above, there is no yet a single index that can cover all aspect of well-
being. Keyes (2006) summarized, “The nearly 50 years of research on subjective well-being
has yielded as many as 13 distinct dimensions of subjective well- being in the United States.
Consequently, new directions in subjective well-being are emerging such as the study of mental
health as a complete state, which suggest the need for greater scientific attention to the
integration of hedonic and eudaimonic measures and theory.”
We can at least found three aspects that can be put into consideration when talking about
well- being, such as emotional, psychological, and social levels. If one can fulfill self-
expectation and self-assurance, then this individual can build his/her own value and so is one’s
workplace happiness.
Workplace happiness is the satisfying feeling one experienced when one interact with
one’s boss, colleges, or client. Taris and Schreurs (2009) stated happy workers are productive
workers. The improvement of mutual relationship can increase organizational performance. In
addition, the increment of wellbeing among employees is not only important to workers, it also
provides good influence to organizations and customers. On the contrary, low well-being will
bring low engagement or even loss of employee (Parker and Martin, 2009). From the research
by Cenkseven and Sari (2009), workers’ subjective wellbeing can be predicted by life quality
in workplace. As a brief conclusion, Workplace happiness means the satisfaction and happiness
when workers interact with managers, colleagues, subordinates, and clients. This may also be
influenced by one’s own experience, background, and pressures.
Organization Commitment
Organization Commitment is an indicator of the affiliation, the degree of devotion and
the intention of resign between the employee and the company. An employee with higher
organization commitment identify oneself more with the organization while devoting more
effort in one’s job and less likely to resign.
The cause of organization commitment has been discussed from different aspect. Earlier
researches considered organizational commitment an exchange mechanism between employee
and employer. The exchange can be through benefits or feelings ( Becker, 1960; Morris &
Sherman, 1981) . Kanter ( 1968) and Herbiniak and Alutto ( 1972) both considered
organizational commitment as the result of considering the opportunity cost or afraid of the
loss of established relationships. From psychological view, organization commitment is
considered as employees have positive and active attitude, including the loyalty or the
acceptance of organizational goal and value (Porter & Smith, 1970; Porter,Steers, Mowday, &
Boulian, 1974; Meyer, Allen, & Gellatly, 1990; Price, 1997) . Kawakudo ( 1987) defined
organization commitment the wiliness to stay in the organization while Mowaday, Porter, and
Steers ( 1982) considered organizational commitment should also include the attitude to make
positive contribution. This does not only influence the devotion one hav in the organization but
© ICBTS Copyright by Author(s) The 2016 International Academic Research Conference in Munich 22
also reprsent the combination between individual and the organization. This linkage is not just
important for the individual but also to the organization and the society.
Robbins ( 2001) claimed organization commitment is when employee accept the
organization and it goal then this employee has the commitment to become one part of the
organization. Accordingly, organization commitment is often used as a tool to measure loyalty.
Other researches revealed it can be used as an indicator for the organizational effectiveness
(Steers, 1997). Clinebell and Shadwick (2005) proposed organizations with higher organization
commitment have employees rely more on and have more trust in the organization.
Simultaneously the flow rate and the number of late arrival is reduced. It can also reinforce the
perceived value of the organization’ s goal and effectively increase the production of
employees.
Meaningful Works
Works can be defined as paid employment ( Guest, 2002) . Brief and Nord ( 1990)
considered the meaning of work relies on the understanding of the purpose of job, aka,
pespected achievement on jobs. Earlier researches also indicated the meaning of work is quite
influential to several important organizational results ( Hackman & Oldham, 1980; Locke &
Taylor, 1990; Wrzesniewski, McCauley, Rozin, & Schwartz, 1997; Wrzesniewski, 2003) .
Although ‘ meaning’ is a common word indaily life, there are at least two levels of contents
within, such as what is meaning and what brings meaning. In addition, ‘ meaning’ and
‘meaningfulness’ are usually interchanged (Rosso, Dekas, & Wrzesniewski, 2010). Basically,
meaning stands for what one considers his or her job represents (Pratt & Ashforth, 2003). On
the other hand, although individual’ s definition to job meaning is still influenced by
environment and social context, it is still very subjective ( Wrzesniewski, Dutton, & Debebe,
2003) . On top of that, even if a job has its own specific role to the society, does not
automatically mean it is meaningful to individual. ‘ Meaningful’ refers to the degree of
importance one thing means to the individual and ‘ meaningful job’ refers to when individual
experiences the specific importance to one and has positive meanings at the same time.
‘Being happy and finding life meaningful overlap, but there are important differences’,
stated Baumeister, Vohs, Aaker, and Garbinsky (2013). In a recent review, Rosso et. al. (2010)
considered the meanings of job can come from four aspects: self, others, work context, and
spiritual life. Although several fundamental concepts in the study of meaning of work such as
callings and vocations have deep theological roots, limited empirical researches have been
generated on the topic of spirituality and work, even lesser on the meaning of work ( Calvin,
1574, Luther, 1520; Rosso et. al., 2010; Weaver & Agle, 2002).
Perceived Organizational Support
Comparing to the labor intensive industrialization times, modern business relies mainly
on knowledge workers. These new generation workers are more privileged with their own
knowledge assets and do not need to cling to a sole enterprise through one’s career. Companies
© ICBTS Copyright by Author(s) The 2016 International Academic Research Conference in Munich 23
should be aware of this situation and consider from employees’ perspective to evaluate each
initiation.
Levinson ( 1965) proposed employee view organization as a living entity through
“ personified” and view the policies come from an integrated unit rather from the separated
decision makers. Eisenberger, Huntington, Hutchison, and Sowa ( 1986) stated perceived
organizational support is the employee’s feeling about the degree the organization cares about
their well- being and emphasizing their contribution. When employees feel the balance in
between, they will pay more effort and commit more to exchange the physical and spiritual
rewards (Esienberger et al., 1986; Wayne, et al., 1997).
The psychological mechanism behind perceived organizational support is social
exchange and the psychological contract between employee and the organization (Esienberger
et al., 1986; Guzzo, Noonan, & Elron, 1994). Eiseberger et. al. consider the exchange is mainly
composited by work effort and compensation. Witt (1991) proposed perspective organization
support is mere a belief within employees own mind.
In addition, both effort- reward expectancy and needs for socioemotional are also
mentioned when referring to perceived organizational support. When employees feel support
from organizations, both mechanisms will trigger employee to commit extra effort to achieve
organization’s goal (Armeil, Eisenberger, Fasolo& Lynch, 1998).
Rhoades and Eisenberger ( 2002) considered there are three antecedents for perceived
organizational support: fairness, supervisor support, and organizational rewards and job
conditions. The effect of perceived organizational support can be discussed in two levels,
individual and organizational. At individual level, perceived organizational support can cause
positive attributes then increases satisfaction toward job and salary. Organization theory also
considered higher perceived organizational support can increase the obligation from employee
and increases one’ s diligence, organization commitment and creativity ( Eisenberger,et al. ,
1990), while reduce the confliction between roles and pressure (Harris, Harris, Harvey, 2007).
At organizational level, perceived organizational support can enhance job performance and
reduce resignation and unasked absence (Rhoades, et. al., 2002).
Psychological capital
On the other side, the business world begins to emphasize the importance of
‘Psychological Capital’ (Luthans, F., Luthans, K. W., and Luthans, B. C., 2004). This index
was raised to capture the essence of long term competitive advantage under today’ s hyper
competition. Although this sounds more as a commercial term, the content of it is highly
correlated to the positive psychology status. Luthans et al. (2004) compared traditional capital,
human capital, social capital, and psychological capital and suggested traditional capital as
‘ what you have’ , human capital as ‘ what you know’ , social capital as ‘ who you know’ and
lastly psychological capital as ‘who you are’.
Luthans, Youssef & Avolio ( 2007) and Luthans et al. ( 2004) defined psychological
capital that can bring positive emotion as:
© ICBTS Copyright by Author(s) The 2016 International Academic Research Conference in Munich 24
1. Self-Efficacy: The development of individual’s positive status such as confidence to
devote oneself and complete all challenging work successfully;
2. Optimism: Positive attributions to current and future success;
3. Hope: Persistence and willing to change the way to do things in order to achieve
success;
4. Resiliency: When facing difficulties, one can endure, jump back, and even pass
beyond to achieve success.
Along with the trends of increasing competition and more focus on human beings,
organizations begin to put more emphasis on the psychological status of employee as this also
affect the success and performance of organizations.
Relationship between variables
Happiness can come from the fulfilling process of one’ s goal and this intension to be
satisfied can be a key driver for the increment of happiness (Sheldon, et. al., 2001). Work can
bring the feeling of achievement, reveal one’ s value, help individual blend in social groups,
and increase happiness ( Morse & Weiss, 1955) . A meaningful job brings the feeling of more
valuable to the participants and provide positive expectations. We then propose hypothesis I:
meaningful job positively affects workplace happiness.
Perceived organization support indicates the degree of employees’ feeling about how
the organization cares about their well- being and emphasizing their contribution. One
experienced the support from organization mainly through the interaction with colleges and
managers, which are the key elements for workplace happiness. As a sequence, our hypothesis
II is: perceived organizational support positively affects workplace happiness.
Rosso et. all (2010) stated the meanings of work come from four aspects: 1. self, such
as value system, motivation, and belief ; 2. Others, such as colleges, leaders, communities, and
families; 3. Work context, such as work design, financial environment, and nationwide culture;
and, 4. spiritual life, such as spiritual and religious callings. Organizational commitment comes
from the strong belief and the wiliness to accept the goal and value of an organization. One has
the intention to make effort and to become part of the organization. Our hypothesis III:
meaningful works positively affects organizational commitment.
Employees intend to form holistic impression toward organization about the degree
about the support and faith from organization. Perceived organizational support reflects the
subjective feeling on this measurement (Esienberger et al., 1986 ; Wayne, et al., 1997). When
employees feel the balance between contribution and feedback, one will pay more effort and
demonstrate commitment toward organization in exchange of material and mental rewards.
The hypothesis IV is: perceived organizational support positively affects organizational
commitment.

© ICBTS Copyright by Author(s) The 2016 International Academic Research Conference in Munich 25
Porter et al. (1970) stated perceived organizational support as employees’ positive and
aggressive tendency according to psychological viewpoints. We proposed hypothesis V:
organizational commitment positively affects workplace happiness. Accordingly, organization
commitment should mediate the influence between meaningful job and workplace happiness
( hypothesis VI) and between perceived organizational support and workplace happiness
(hypothesis VII).
PsyCap refers to the four characteristics that can contribute to positive emotions.
Individuals with higher PsyCap can stay positive more easily in difficult situations or can they
rebound quicker from down times. This capital helps individuals be aggressive and effective
under various circumstances. People with higher PsyCap should be more emotionally peaceful
and less effected by other factors. As a result, our hypothesis VIII is PsyCap modulates the
relationship from organization commitment to workplace happiness.
METHODOLOGY
We investigated relating theories and extracted the suitable inventories. Although
workplaces come in various sizes and shapes, this study particularly focuses on the office
worker who has several colleagues and managers, so the various indexes can be fully examined.
The inventory is then distributed through training institute and various organizations. Total 151
effective responses was collected.
Among the 151 response, more than 78% of the participants have worked for the current
company for more than a year, which can represent a good sign that these respondents already
have an existing impression of their own employing organization.
Workplace happiness is assessed with the instrument adopted from Liu ( 2011) . This
15-item-inventory is to evaluate the satisfaction and happiness when one works in the working
environment and interact with manager, colleagues, subordinates, and clients. Each item is in
five- point scale. Organizational commitment is measured with Organizational Commitment
Inventory modified from Mowday (1982). The inventory has 11 items. The 8-item Perceived
Organization Support Questionnaire is the abbreviation from the origin inventory (Eisenberger,
et. al., 1986, 1990, 1997). The 10-item Work and Meaning Inventory by Steger, Dik, & Duffy
( 2012) is used to evaluate Meaningful Work. Psychology Capital is evaluated with PsyCap
Questionnaire (Luthans, et. al, 2007). It includes 24 items and each item is five-scale.
The data were analyzed by the SPSS statistical package, using the frequencies,
reliability, Pearson correlation, and multi-level regression.
RESULTS
The Cronbach’s alpha correlation coefficient for workplace happiness is 0.915, and the
Cronbach’s alpha correlation coefficient for PsyCap is 0.954. The Cronbach’s alpha correlation
coefficient for meaningful work, perceived organizational support, and organizational
commitment is 0.892, 0.901 and 0.929, respectively. The reliability is high and the results are
acceptable.

© ICBTS Copyright by Author(s) The 2016 International Academic Research Conference in Munich 26
As shown on Table 1, the correlation between meaningful works and organizational
commitment ( r= 0. 565, p<0. 01) and workplace happiness ( r= 0. 589, p<0. 01) are both
significant. The relationship between perceived organizational support and organizational
commitment is also significant ( r= 0. 721, p<0. 01) , so is with workplace happiness ( r= 0. 578,
p<0. 01) . Organizational commitment also significantly correlates with workplace happiness
( r= 0. 674, p<0. 01) . Psychological capital is also significantly correlated with workplace
happiness (r= 0.680, p<0.01). Our hypotheses I to V are verified.
Table 1 Correlation Matrix of Dependent and Independent Variables
1 2 3 4 5
1. Workplace Happiness -
2. Organizational Commitment 0.674** -
3. Psychological Capital 0.680** 0.540** -
4. Meaningful works 0.589** 0.565** 0.460** -
5. Perceived Organizational Support 0.578** 0.721** 0.478** 0.562** -
With the existence of organization commitment, the correlation between meaningful
works and workplace happiness dropped to 0. 306 ( p<0. 01) . Hypothesis VI is partially
supported. The correlation between perceived organizational support and workplace happiness
dropped to 0.192 and become insignificant. Our hypothesis VII is fully supported.
In order to test hypothesis VIII, we extracted samples into high and low PsyCap groups,
which is one standard deviation above or below the average. The count of high PsyCap is 24
and the count of low Psycap is 23. Z score is 0. 1578 and p( two- tail) is 0. 8746, which is not
significant. Hypothesis VIII is not supported.
CONCLUSION AND FUTURE WORK
The result of this study, with office workers as participants, indicated the influence
through organizational commitment from the work itself and the environment on the happiness
of workplace. From the result of this research, the more meaningful a work is to a worker, the
worker will enjoy more when doing it. While the correlation between happiness and
meaningfulness are wildly varied from previous researches, as simply having fun or suitable
relaxing can also bring the feeling of happiness, our research suggests the making of meaning
in workplace seems to be an effective strategy to enhance happiness at workplace. At the same
time, when one feels the work one does is valuable to oneself, the worker also commits more
to it. However, the contribution to workplace happiness from meaningful work is not fully
mediated by organizational commitment. One may enjoy and devote to the work due to the
intrinsic value rather than commits oneself to the organization.
According to Job Demands- Resource model, the more resource an employee has, the
more challenge one can face and overcome. When one feels subjectively being supported by
the employer, one will likely to pay back accordingly due to mainly psychological balancing
desire. Workers tend to commit more when such circumstance exists. On the other hand,
© ICBTS Copyright by Author(s) The 2016 International Academic Research Conference in Munich 27
happiness also comes from the positive relationships with others. The support from
organization comes through the behaviors of executives, managers, and colleagues. As a result,
the higher the perceived organizational support is indeed the abstraction of social support from
workplace and can reflect on workplace happiness.
The result echoes earlier researches on the positive relationship between PsyCap and
workplace happiness. However, the resistance effect of PsyCap is not supported in this study.
The possible cause might be the differentiation between the high and low group is not large
enough as both of the cut-off points (4.42 and 3.42, respectively) are still above the fifty percent
threshold, which is “three” from the 5-point Likert scale.
A possible direction for the evaluation of the modulation effect from PsyCap is to
specifically choosing the base with the average around three as well as with larger deviation.
With the increment of difference in between, the true effect from PsyCap can be magnified and
the relationship will then be highlighted.
Earlier researchers have verified the positive relationship between workplace happiness
and productivity ( Lin, Lu, Wu, & Wu, 2012) . The competition among modern business
environment also pushes organizations put more emphasis on the well- being of employees to
ensure the sustainable productivity. We recommended managers, human resource
professionals and even individual workers can make meanings of works. Management level
can also work with human resource department to provide a friendlier and more supportive
environment, so the employee can also enjoy the closeness and reduce distress. These findings
echo the components of evolving happiness (Buss, 2000) and suit modern society.
REFERENCES
Andrew, F. M. , & Withey, S. B. (1976) . “Social indicators of well-being” . New York and
London: Plenum.
Argyle, M. (1987). “The psychology of happiness”. London and New York: Routedge.
Armeil, S. , Eisenberger, R. , Fasolo, P. & Lynch, P. (1998). Perceived organizational support
and police performance: the moderating influence of socioemotional needs. Journal of Applied
Psychology, Vol. 83, No. 2, Pp. 288-297.
Arthur, J. B. (1994). “Effects of human resource systems on manufacturing performance and
turnover”. Academy of Management Journal, Vol. 37, Pp. 670-687
Bakker, A. B., & Demerouti, E. (2007). “The job demands-resources model: State of the art”.
Journal of Managerial Psychology, Vol. 22, Pp.309-328.
Bakker, A. B. , Demerouti, E. , de Boer, E. , & Schaufeli, W. ( 2003) . “ Job demands and job
resources as predictors of absence duration and frequency” . Journal of Vocational Behavior,
Vol. 62, Pp. 341-356.

© ICBTS Copyright by Author(s) The 2016 International Academic Research Conference in Munich 28
Bakker, A. B. , Emmerik, H. V. , & Riet, P. V. ( 2008) . “ How job demands, resources, and
burnout predict objective performance: A constructive replication” . Anxiety, Stress and
Coping, Vol. 21, Pp. 309-324.
Baumeister R., Vohs K., Aaker J., and Garbinsky E. (2013), “Some key differences between a
happy life and a meaningful life”, The Journal of Positive Psychology: Dedicated to furthering
research and promoting good practice Vol. 8, No. 6, Pp. 505-516
Becker, H. S. (1960). “Notes on the concept commitment” , American Journal of Sociology,
Vol. 66, Pp. 32-42.
Bersin, Josh, (2013), “Corporate Talent, Leadership and HR—Nexus of Global Forces Drives
New Models for Talent: Predictions for 2013”, Bersin by Deloitte
Brief, A. P., & Nord, W. R. (1990). “Meanings of occupational work: A collection of essays”.
Lexington, MA: Lexington Books.
Buss, David, (2000) , “The Evolution of Happiness” , American Psychologist, Vol. 55, No. 1,
Pp.15-23
Calvin, J. (1574). “Sermons of M. John Calvin upon the Epistle of Saint Paul to the Galatians”.
London: Lucas Harison and George Bishop.
Carruthers, C. , & Hood, C. ( 2004) . “ The power of the positive: Leisure & well- being. ”
Therapeutic Recreation Journal, Vol.38, No.2, Pp. 225-245.
Cenkseven, O. F., & Sari, M. (2009). “The quality of school life and burnout as Predictors of
subjective well-being among teachers”. Kuram VE Uygulamada Egitim Bilimleri, Vol. 9, No.3,
Pp.1223-1235
Clinebell S, & Shadwick, G (2005). “The Importance of Organizational Context on Employees’
Attitude: an Examination of Working in Main Offices Versus Branch Offices” . Journal of
Leadership & Organizational Studies, Vol. 11, No. 2, Pp. 89-100.
Diener, E. (1984). “Subjective well-being”. Psychological Bulletin, Vol. 95, No.3, Pp. 542-
575.
Dyer, L., & Holder, G. (1988). “A strategic perspective of human resource management”. In
L. Dyer (Ed. ) , Human resource management: Evolving roles and responsibilities: Pp. 1-46.
Washington, DC: Bureau of National Affairs
Emmons, R. A. (1999). “The psychology of ultimate concerns”. New York: Guilford.
Eisenberger, R. , Huntington, R. , Hutchison, S. , & Sowa, D. ( 1986 ) . “ Perceived
organizational support”. Journal of Applied Psychology, Vol. 71 No. 3, Pp. 500-507.
Gard, T., Brach, N., Hölzel, B., Noggle, J., Conboy, L., Lazar, S., (2012), “Effects of a yoga-
based intervention for young adults on quality of life and perceived stress: The potential

© ICBTS Copyright by Author(s) The 2016 International Academic Research Conference in Munich 29
mediating roles of mindfulness and self-compassion”, The Journal of Positive Psychology Vol.
7, No. 3, Pp. 165-175
Goffee, R. & Jones. G. (2013) , “Creating the Best Workplace on Earth” , Harvard Business
Review, May 2013 Issue
Guest, D. E. ( 2002) . “ Perspectives on the study of work- life balance” . Social Science
Information, Vol. 41, No. 2, Pp. 255-279.
Guzzo, R. A. , Noonan, K. A. & Elron, E. ( 1994) . “ Expatriate managers and psychological
contract”. Journal of Applied Psychology, Vol. 79, No. 4, Pp.617-626.
Hackman, J. R., & Oldham, G. R. (1980). “Work redesign. Reading”, MA: Addison-Wesley
Harris, R. B. , Harris, K. J. , & Harvey, P. ( 2007) . “ A test of competing models of the
relationships among perceptions of organizational politics, perceived organizational support,
and individual outcomes”. The Journal of Social Psychology, Vol. 147, No. 6, Pp. 631-655.
Headey, B., & Wearing, A. (1991). “Subjective well-being and coping with adversity”. Social
Indicators Research, Vol. 22, Pp. 327-349.
Herbiniak, L. G.and Alutto,J. A. (1972). “Personal and role-related factors in the development
of organizational commitment”. Administrative Science Quarterly , Vol. 17, Pp. 556-560.
Kanter, M. ( 1968) . “ Commitment and society organization: a study of commitment
mechanisms in auatopian communities”. American Sociological Review, Vol. 33, Pp. 499-517.
Kawakubo, M. K. ( 1987 ) . “ Perception of authority, control, and commitment in Japanese
organizations”. The University of Wisconsin-Madison.
Keyes, C. L. M ( 2006) , “ Subjective Well- Being in Mental Health and Human Development
Research Worldwide: An Introduction”, Social Indicators Research, Vol. 77, No. 1, Pp. 1-10
Levinson, H. ( 1965) . “ Reciprocation: the relationship between man and organization” .
Administrative Science Quarterly, Vol. 9, Pp. 370-390.
Lin, C. , & Hsieh, Y. ( 2007) , “ An Examination of the Effects of Strategic Human- Resource
Management and Organizational Citizenship Behavior” , Journal of Humanities and Social
Sciences, Vol. 3, Pp.1-15
Lin, H., Lu, L., Wu, P., & Wu, W., (2012), “Are Happy Workers More Productive? The Dual
Influences of Organizational Support and Work Attitudes” , Chinese Journal of Psychology,
Vol.54, No.4, Pp.451-469
Liu, H ( 2011) , “ The relationship between workplace well- being and job satisfaction of
kindergarten teachers”, Journal of Early Childhood Education & Care, Vol. 6, Pp.87-115

© ICBTS Copyright by Author(s) The 2016 International Academic Research Conference in Munich 30
Lu, L. ( 1998) , "The meaning, measure, and correlates of happiness among Chinese people” ,
Proceedings of the National Science Council: Part C, Vol. 8, Pp.115-137.
Lu, L., Kao, S. F., Siu, O. L., & Lu, C. Q. (2010). “Work stressors, Chinese coping strategies,
and job performance in the Greater China” . International Journal of Psychology, Vol. 45,
pp.294-302.
Lu, L., Siu, O. L., & Lu, C. Q. (2010). “Does loyalty protect Chinese workers from stress? The
role of affective organizational commitment in the Greater China region” . Stress and Health,
Vol. 26, pp.161-168.
Luthans, F., Luthans, K. W., & Luthans, B. C. (2004), “Positive psychological capital: Beyond
human and social capital”, Business Horizon, Vol. 47, No. 1, Pp. 45-50.
Luthans, F. , Youssef. C. M. , & Avolio, B. J. (2007) , “Psychological capital” , Oxford, UK:
Oxford University Press.
Luther, M. (1520). “Treatise on good works” (W. A. Lambert, Trans.). In Atkinson, J. (Ed.).
The Christian in Society I (Vol. 44). Philadelphia: Fortress Press.
Locke, E. A. , & Taylor, M. S. (1990) . “Stress, coping, and the meaning of work”. In A. P.
Brief & W. R. Nord (Eds.), Meanings of occupational work. Lexington, MA: Lexington Books.
Meijman, T. F., & Mulder, G. (1998). “Psychological aspects of workload”. In P. J. D. Drenth,
H. Thierry, & C. J. Wolff (Eds.), Handbook of work and organizational psychology (Vol. 2):
Pp. 5-33. Hove, UK: Psychology Press
Meyer, J.P.; Allen, N.J.; Gellatly, I. R., ( 1990 ) . “Affective and Continuance Commitment to
the Organization: Evaluation of Measures and Analysis of Concurrent and Time Lagged
Relations”. Journal of Applied Psychology, Vol. 75. Pp. 710-720.
Morris, J. H., & Sherman, J. D. ( 1981 ) . “Generalizability of an organizational commitment”.
Academy of Management Journal, Vol. 24. Pp. 512-526.
Morse, N. C. , & Weiss, R. S. ( 1955) . “ The function and meaning of work and the job” .
American Sociological Review, Vol. 20, No. 2, Pp. 191-198.
Mowday, R.T., & Porter, L.W., & Steers, R.M. ( 1982 ). “Employee-Organization linkage”.
New York: Academic Press.
Parker, P. D., & Martin, A. J. (2009). “Coping and buoyancy in the workplace: Understanding
their effects on teachers’ work- related well- being and engagement” . Teaching and Teacher
Education: An International Journal of Research and Studies, Vol. 25, No. 1, Pp. 68-75.
Porter, L. W. & Smith, F. J., (1970). “The Etiology of Organizational Commitment”. University
of California Unpublished Paper.

© ICBTS Copyright by Author(s) The 2016 International Academic Research Conference in Munich 31
Porter, L. W. , Steers, R. M. , Mowday, R. T. , & Boulian, P. V. ( 1974) . “ Organizational
Commitment, Job Satisfaction, and Turnover among Psychiatric Technicians” . Journal of
Applied Psychology, Vol. 59, Pp. 603-609.
Price J. L. , ( 1997 ) . “Handbook of Organizational Measurement”. International Journal of
Manpower, Vol.18, Pp. 305-558.
Rhoades, L. , & Eisenberger, R. ( 2002) . “ Perceived organizational support: A review of the
literature”. Journal of Applied Psychology, Vol. 87, No. 4, Pp. 698–714.
Rim, Y. ( 1993 ) . “Values, happiness and family structure variable”. Personality and Individual
Difference, Vol. 15, No. 15, Pp. 595-598.
Robbins, S. P. (2001). “Organizational behavior”. Upper Saddle River, NJ: Prentice Hall.
Rosso, B. D. , Dekas, K. H. , & Wrzesniewski, A. ( 2010) . “ On the meaning of work: A
theoretical integration and review” Research in Organizational Behavior, Vol. 30, Pp. 91-127.
Sarvimi, A. , & Stenbock-Hult, B. (2000) . “Quality of life in old age described as a sense of
well-being meaning and value”. Journal of Advanced Nursing, Vol. 32, Pp. 1025-1033.
Schaufeli, W. B., & Bakker, A. B. (2004). “Job demands, job resources, and their relationship
with burnout and engagement: A multi-sample study”. Journal of Organizational Behaviour,
25, 293-315
Sheldon, K. M. , & Kasser, T. ( 2001) . “ Goals,congruence, and positive well- being: New
empirical support for humanistic theories”. Journal of Humanistic Psychology, Vol. 41, Pp.30-
50.
Steers, R. M. ( 1977) . “ Antecedents and outcomes of organizational commitment” .
Administrative Science Quarterly, Vol. 22, No. 1, Pp. 44-56.
Steger, M. , Dik, B. , & Duffy, R. ( 2012) . “ Measuring Meaningful Work: The Work and
Meaning Inventory (WAMI)”. Journal of Career Assessment, Vol. 00, No. 0, Pp. 1-16.
Stone, M. J., & Kozma, A. (1985). “Structural relationships among happiness scales: a second
order factorial study”. Social Indictors Research, Vol. 17, Pp.19-28.
Taris, T. W., & Schreurs, P. J. G. (2009). “Well-being and organizational performance: An
organizational- level test of the happy- productive worker hypothesis” . Work and Stress, Vol.
23, No. 2, Pp. 120-136.
Walton, R. E. ( 1985) . “ From control to commitment in the workplace” . Harvard Business
Review, Vol. 63, No.2, Pp. 77-84
Watson, D., & Tellegen, A. (1985). “Toward a consensual structure of mood”. Psychological
Bulletin, Vol. 8, Pp. 219-245.

© ICBTS Copyright by Author(s) The 2016 International Academic Research Conference in Munich 32
Wayne, S. J., Shore, L. M., & Liden, R. C. (1997). “Perceptions of organizational support and
leader-member exchange: A social exchange perspective”. Academy of Management Journal,
Vol. 40, No. 1, Pp. 82-111.
Weaver, G. R. , & Agle, B. R. ( 2002) . “ Religiosity as an influence on ethical behavior in
organizations: A theoretical model and research agenda” . Academy of Management Review,
Vol. 27, No. 1, Pp. 77–97.
Whitener, E. M. (2001). “Do “high commitment” human resource practices affect employee
commitment? A cross- level analysis using hierarchical linear modeling” . Journal of
Management, Vol. 27, Pp. 515-535.
Witt, L. A. ( 1991) . “ Exchange ideology as a moderator of job- attitudes- organizational
behaviors relationships”. Journal of Applied Social Psychology, Vol. 21, Pp. 1490-1501.
Wood, S., & de Menezes, L. (1998). “High commitment management in the U.K.: Evidence
from the workplace industrial relations survey and 83 employers’ manpower and skills
practices survey”. Human Relations, Vol. 51, pp. 485-515
Wrzesniewski, A. (2003). “Finding positive meaning in work”. In K. S. Cameron, J. E. Dutton,
& R. E. Quinn (Eds.), Positive organizational scholarship. San Francisco, CA: Berrett-Koehler
Wrzesniewski, A. , Dutton, J. E. , & Debebe, G. (2003) . “ Interpersonal sensemaking and the
meaning of work” . Research in Organizational Behavior: An Annual Series of Analytical
Essays and Critical Reviews, Vol.25, Pp. 93-135.
Wrzesniewski, A. , McCauley, C. , Rozin, P. , & Schwartz, B. ( 1997) . “ Jobs, careers, and
callings: People’s relations to their work”. Journal of Research in Personality, Vol. 31, Pp.21-
33.
© ICBTS Copyright by Author(s) The 2016 International Academic Research Conference in Paris 33
VIEWS OF TEACHER'S ON USAGE OF ORGANIZATIONAL LEARNING
MECHANISMS IN PRIMARY SCHOOLS1
Ali Unal*& Esra Yetim**
* Ali Unal, Necmettin Erbakan University,Ahmet Kelesoglu Education Faculty,Konya, Turkey,
E-Mail: [email protected]
** Esra Yetim, The Ministry of Education,ELT,İzmir, Turkey,
E-Mail: [email protected]
ABSTRACT
Organizational learning mechanism is a critical component of increasing schools'
organizational learning competence. The aim of this study is to determine level of usage
organizational learning competencies in primary schools regarding to teacher's views. Research
was carried out by survey method, in accordance with the subject and aims. The population of
study consists of public and private primary school teachers working in central district of Konya
province in 2011 – 2012 educational years. The study sample includes 640 public and private
primary school teachers chosen with stratified sampling method. Data have been collected with
demographic traits form and organizational learning mechanism scale developed by Schechter and
adapted into Turkish by Unal Collecting data was analyzed by using SPSS 16 packaged software.
According to the research findings, perceptions of primary school teachers about organizational
learning mechanism are "medium – level" in public school and "high – level" in private school.
Public schools' success, also have increased when level of use of organizational learning
mechanisms have been increased at the school. Teachers opinions' on use of organizational
learning mechanisms at their school are analyzed with regarding to demographic traits. As a result,
significant statistical differences are observed between teachers' opinions and number of teachers
in school, working period together with principal.
Key Words: Organizational Learning Mechanism (OLM), School Success, School that
learns
INTRODUCTION
Idea of school learnability is one of the prominent subject in recent years. This is because;
schools must be harmonized with their environment. They also behave proactively in order to get
prepared new circumstances without changing environment. Learning school is an organization
including learning process, strategy and structure that increasing the capacity of coping up with
and reacting powerfully to alteration in a dynamic and uncertain environment(Schechter, 2008;
Schechter & Atarchi 2013; Silins, Mulford & Zarrins, 2002; Silins, Zarins, & Mulford,.2002).
1 This paper is generated from the part of the Master thesis titled as “İlköğretim okullarında örgütsel öğrenme mekanizmalarının kullanılmasına
ilişkin öğretmen görüşleri” which was supervised by Ali Unal at the Necmettin Erbakan University, 2015.
© ICBTS Copyright by Author(s) The 2016 International Academic Research Conference in Paris 34
Learning organization has actualized with organizational learning. Therefore; organizational
learning is a critical component of effectuating school efficiency (Schechter & Atarchi 2014).
According to Schechter (2008), organizational learning expresses different meaning as
dependent or independent variable. Organizational learning means strategy, process and activities
that applied by organization on the purpose of encouraging learning as dependent variable and
outcomes of learning processes as a independent variables. On the other hand, outcomes of
learning processes state: a) changing of members’ of organizations objectives, desired behaviors,
tacit assumptions, and strategies related to mental models, b)changing of behavioral output
operating organizational standards such as performance, habits and procedures.
Organizational learning can be examined two different dimensions, structural and cultural.
Learning mechanisms constitute the side of structure and learning culture constitutes the side of
cultural (Popper and Lipshitz,1998, 2000; Schechter,2008). This research is focused on the
structural side of organizational learning, learning mechanisms.
As Popper and Lipshitz(1998, 2000), Organizational Learning Mechanisms(OLM) refer to
structural and procedural arrangements allowing organizations to learn directly or indirectly. At
the same time; OLM creates an environment that transferring individual learning to organizational
knowledge or causing information exchange and acquisition of new information (Unal, 2014).
From this respect, OLM helps explaining perceptibly how to learn organizations (Popper &
Lipshitz, 1998, 2000). According to Schechter (2008) and Schechter and Qadach (2012),
demonstrate the process concretely by defining five OLMs that work dynamic and cyclical.
a. Information Acquisition: This includes experiential learning, vicarious learning, grafting,
and searching and noticing environment.
b. Information Distribution: This expresses the process by which an organization shares
information among its units and members.
c. Information Interpretation: A socio cognitive process that gives meaning to the
distributed information. These sense-making activities share and develop interpretations.
Organizational members decide whether incorporate the information into organizational routines
or not.
d. Organizational memory: The processes and means by which organizational experiences
are stored and coded into organizational memory for future use. These are both mental artifacts
such as stories that represent organizational cultural pattern and values and structural –
technological artifacts such as resource room, written policies, dress, furniture and operating
procedures within an organization.
e. Retrieving information from memory for organizational use: Past encoded information is
used to influence present decision making process.
In order to interacting other teachers in school, there is a need for learning mechanisms that
provide dialog and collaborative structure to school (Kruse, 2003; Silins & Mulford, 2002). As a
consequence, schools must be established OLMs for teachers to determine structures that help
them sharing information and common thought constantly.
The aim of this study is to determine level of usage of organizational competencies in
primary schools regarding to teacher’s views and whether or not level of the usage of
organizational learning mechanisms influence academic success of students. Based on this aim,
following questions have been answered:
1. At which level do Primary schools (public – private) use organizational learning
mechanisms according to its dimensions?
2. Do learning mechanisms that used in primary schools differentiate according to types of
school ( public or private)?

© ICBTS Copyright by Author(s) The 2016 International Academic Research Conference in Paris 35
3. Does students’ academic achievement differentiate according to level of organizational
learning mechanisms used in school?
4. Does usage of organizational learning mechanisms in primary school differentiate
according to numbers of teachers in school?
5. Does the level of organizational learning mechanisms differentiate according to working
years of teachers with school headmaster?
METHODOLOGY
This research was carried out by survey methods in accordance with the subject and aims.
The populations of study consist of 10.713 primary school teachers who work at 206 public
schools and 3471 primary school teachers who work at 18 private schools in central district of
Konya province. The study sample is defined by using stratified sampling method. In order to
stratify schools, achievement exam that is applied in 2011 by Konya provincial directorate of
national education, results are used. According to this exam result, schools are put in order from
the most successful to the most unsuccessful. Then, schools are divided into three group,
successful, middle successful and low unsuccessful. In each layer, the most successful 25 public
schools are chosen and study is carried out with them. The other hands, all of private schools in
Konya province are involved in research. As a result, sample of this research consists of 640 public
and private school teachers. Qualities of these teachers are shown Table - 1.
Demographic traits form which prepared for defining personal and occupational information
about teachers whom participating survey and organizational learning mechanism scale developed
by Schechter (2008) and adapted into Turkish by Unal (2014) are used as a measurement
instrument. Organizational learning mechanisms scale includes four dimensions; analyzing
information, storing-retrieving-putting use of information, receiving and disseminating
information and seeking information, and 27 items that purposed to measure these dimensions.
Table 1
Demographic traits of research sample
Demographic
traits Type of School f %
School Type Public 480 75
Private 160 25
Gender Female 349 54,5
Male 291 45,5
Working years
0-10 years 168 26,2
11-18years 292 45,6
19 + years 180 28,2
Education
Associate degree 46 7,2
Undergraduate 533 83,3
Master degree 61 9,3
Numbers of
teachers
at school
0-35 104 16,2
36-75 420 65,6
75 + 116 18,2

© ICBTS Copyright by Author(s) The 2016 International Academic Research Conference in Paris 36
Working years with
headmaster
1 year 283 44,2
2-3 years 298 46,6
4 years and over 59 9,2
Total 640 100
RESULTS
First sub-problem is that “At which level do Primary schools (public – private) use
organizational learning mechanisms according to its dimensions?”. For explaining this sub-
problem’s values, Mean and standard deviation are figured out and results are shown in Table –
2.
Table 2
Usage level of organizational learning mechanisms
Organizational learning
mechanisms Type of school N M SS
Seeking Information Public 480 2,94 ,67
Private 160 3,54 ,46
Analyzing Information Public 480 3,49 ,97
Private 160 4,29 ,62
Receiving - Disseminating
Information
Public 480 3,38 1,01
Private 160 4,74 ,78
Storing Information Public 480 3,51 ,86
Private 160 4,40 ,54
According to teachers worked in public schools; organizational learning mechanisms are
used under the “medium – level” in receiving and disseminating information dimension and the
other dimensions are used in “medium – level”.
According to teachers worked in private schools, organizational learning mechanisms are
used in “medium – level” in receiving and disseminating information dimension and the other
dimensions are used in “high – level”.
Second sub-problem seeks an answer that "Do learning mechanisms that used in primary
schools differentiate according to types of school (public or private) ? The results of t test are
shown Table -3 that weather the usage of organizational learning mechanisms differentiates or
not, according to types of schools.
Table3
Usage of Organizational Learning Mechanisms according to type of school
Organizational learning
mechanisms
Type of
school N M SS T sd P
Seeking Information Public 480 14,71 3,35 10,59 638 ,00
Private 160 17,72 2,29
Analyzing Information Public 480 10,46 2,90 9,82 638 ,00
Private 160 12,86 1,85
Receiving - Disseminating
Information
Public 480 23,69 7,06 15,52 638 ,00
Private 160 33,18 5,48
Storing Information Public 480 42,18 10,35 12,14 638 ,00

© ICBTS Copyright by Author(s) The 2016 International Academic Research Conference in Paris 37
Private 160 52,74 6,48
Organizational learning mechanisms both used in public and private schools show
statistically significant difference in all dimensions. Mean demonstrates that private schools are
mostly used organizational learning mechanisms in all dimensions.
Third sub- problem seeks an answer "Does students’ academic achievement differentiate
according to level of organizational learning mechanisms used in school?" The results of Anova
and LSD test are shown on Table – 4 .
Table 4.
Usage of Organizational Learning Mechanisms according to Students' Achievement
Variable
Dimensions Achievement* N Mean Std.
Dev. F P
(LCD Test)
Mean
Difference*
Seeking
Information
1 160 15,72 3,00
19,30 ,00
1-3
2 160 14,88 3,21 2-3
3 160 13,50 3,45
Analyzing
Information
1 160 11,60 2,46
26,72 ,00
1-2
2 160 10,42 2,59 1-3
3 160 9,35 3,16 2-3
Receiving –
Disseminating Information
1 160 27,32 6,53
45,41 ,00
1-2
2 160 23,29 6,38 1-3
3 160 20,45 6,54 2-3
Storing
Information
1 160 47,46 9,14
49,39 ,00
1-2
2 160 42,10 8,71 1-3
3 160 36,97 10,40 2-3
*1.Successful, 2. middle successful, 3.low unsuccessful
According to the results of analysis, students’ academic achievements differentiate related
to the usage level of organizational learning mechanisms at school. Mean shows that schools the
more use organizational learning mechanisms, the more their students being successful.
Fourth sub- problem is that "Does usage of organizational learning mechanisms in primary
school differentiate according to numbers of teachers in school?"Anova test results to seek an
answer this question are given Table – 5. Table 5.
Usage of Organizational Learning Mechanisms according to Numbers of Teachers
Working at School
Dimensions Teacher
numbers* N Mean Std.
Deviation F P
(LCD Test)
Mean
Difference*
1 104 15,20 3,25 23,14 ,00 1-3

© ICBTS Copyright by Author(s) The 2016 International Academic Research Conference in Paris 38
Seeking
Information
2 420 16,00 3,11 2-3
3 116 13,69 3,79
Analyzing
Information
1 104 10,95 2,82
12,47 ,00
1-3
2 420 11,40 2,69 2-3
3 116 9,93 3,26
Receiving –
Disseminating Information
1 104 24,64 7,12
21,99 ,00
1-3
2 420 27,43 7,70 2-3
3 116 22,39 7,72
Storing
Information
1 104 44,28 9,66
24,31 ,00
1-2
2 420 46,53 9,81 1-3
3 116 39,09 11,96 2-3
*1.1-35 teachers, 2.36-75 teachers, 3.76 and over teachers
As an analysis result, usage of organizational learning mechanisms differentiate in all
dimensions with regard to numbers of teachers working at school. All analysis results demonstrate
that when numbers of teacher are over 76 at school, usage of organizational learning mechanisms
is “the least” and when numbers of teachers are between 36 and 75; usage of organizational
learning mechanisms is “the most”.
Fifth sub- problem is that "Does the level of organizational learning mechanisms
differentiate according to working years of teachers with school headmaster?” Anova test results
are shown Table – 6.
Table 6.
Usage Of Organizational Learning Mechanisms according to working years of teachers with school
headmaster.
Dimensions Working
years* N Mean Std.
Deviation F P
(LCD Test)
Mean
Difference*
Seeking
Information
1 283 15,57 3,52 ,84 ,430
2 298 15,29 3,37 --
3 59 15,81 2,64
Analyzing
Information
1 283 11,28 2,88 4,32 ,014 2-3
2 298 10,73 2,96
3 59 11,71 2,08
Receiving -
Disseminating
Information
1 283 26,71 8,13 10,66 ,000 1-2
2 298 24,78 7,72 1-3
3 59 29,42 5,62 2-3
Storing
Information
1 283 45,20 11,11 6,28 ,002 1-3
2 298 43,66 10,37 2-3
3 59 48,81 7,52
*1.1 Year, 2.2-3 Years, 3. 4 and over Years

© ICBTS Copyright by Author(s) The 2016 International Academic Research Conference in Paris 39
As a result of analysis, usage of organizational learning mechanisms at school has
differentiated related to working years with headmaster for three dimensions except the
dimension of storing information.
Means demonstrate that all dimensions of organizational learning mechanisms are mostly
used when working years with headmaster are four years and over.
CONCLUSION AND FUTURE WORK
In this work which aims to reveal determination of utilization levels and effects on student's
academic success of organizational learning mechanisms in primary schools, it has been showed
that organizational learning mechanisms are being used "medium- level" in public schools and
"high- level" in private schools. This result has similarity with research of Omur (2014) and Unal
(2014). It is remarkable that both public and private school teachers have "the least" perception
level on seeking information dimension.
According to Schechter (2008) seeking information dimension is an actively researching
process of information. Schools are structured as more bureaucratic institutions and teachers are
expected to adapt to existing rules instead of learning.
Seeking information is the basis of other dimensions; therefore, less activities in seeking
information dimension also means decreasing the efficiencies of other dimensions.
Greater usage of organizational learning mechanisms for all dimensions in private schools shows
that public schools structured as bureaucratic institutions and are expected to comply with the rules
instaed of making innovation or teachers perceive to comply with the rules as their duties.
Yumusak and Yildiz’s findings (2011) are on the same direction. Omur’s (2014) research
result as high schools putting organizational learning mechanism to forefront more than vocational
schools supports comment that private schools pay attention to academic achievement more than
public schools.
Students have more academic achievement in public schools that using learning mechanisms than
others point out the accuracy of the hypothesis about organizational learning and organizational
learning mechanisms. This result is the expected situation.
In relation to use of organizational learning mechanisms, it has been ascertained that these
mechanisms are used "the least" in schools having 76 or more teachers, "the most" in schools
having 36-75 teachers. Omur's findings (2014) show the same results for high schools.
According to researches' results, it is possible to say that organizational learning
mechanisms can be used in medium-sized schools effectively, however using in larger schools
create problems. The reason for this situation might be increasing numbers of teachers in school
making difficult to know each other and avoiding cooperation.
When working time of teachers with headmaster is 4 years and over, organizational learning
mechanisms are used mostly in schools. Increasing working hours of headmaster and teachers
within school is expected to lead to trust each other and get to know each other better. Performance
of headmaster has been evaluated in every-4-year-in-Turkey. After evaluation, successful
headmaster can continue working the same school or be appointed to another school. According
© ICBTS Copyright by Author(s) The 2016 International Academic Research Conference in Paris 40
to the results obtained in this research, if headmaster who being evaluated as successful can
continue in the same schools, the use of organizational learning mechanisms can be increased.
Based on findings, encouraging new knowledge seeking and implementing teachers,
identification and reduction of bureaucratic practices in public schools, forming the schools with
36-75 teachers and ensuring headmaster work for longer than 4 years in the same schools
proposals can be made
REFERENCES
Kruse, S. D. (2003). Remembering as an organizational memory. Journal of Educational
Administration, 41(4), 332-347.
Omur, Y. E. (2014). Teacher opinions on innovation management skills of school administrators
and organizational learning mechanisms at high schools (Unpublished master’s thesis). Abant
Izzet Baysal University, Bolu, Turkey.
Popper, M., & Lipshitz, R. (1998). Organizational learning mechanisms: A cultural and structural
approach to organizational learning. Journal of Applied Behavioral Science, 34(2), 161-179.
doi: 10.1177/0021886398342003
Popper, M., & Lipshitz, R. (2000). Organizational learning: mechanisms, culture and feasibility.
Journal of Management Learning, 31 (2), 181-196. doi: 10.1177/1350507600312003
Schechter, C. (2008). Organizational learning mechanisms:The meaning, measure, and
implications for school improvement. Educational Administration Quarterly, 44(2), 155-186.
doi:10.1177/0013161X07312189
Schechter, C., & Atarchi, L. (2014). The meaning and measure of organizational learning
mechanisms in secondary schools. Educational Administration Quarterly, 50 (4), 577-609.
doi:10.1177/0013161X13508772
Schechter, C., & Qadach, M. (2012). Toward an organizational model of change in elementary
schools:The contribution of organizational learning mechanisms. Educational Administration
Quarterly, 48 (1),116-153. doi:10.1177/0013161X11419653
Silins, H. C., Mulford, W. R., & Zarins, S. (2002). Organizational learning and school change.
Educational Administration Quarterly, 38 (5), 613-642. doi:10.1177/0013161X02239641
Silins, H., Zarins, S., & Mulford, B. (2002). What characteristics and processes define a school as
a learning organisation? Is this a useful concept to apply to schools? International Education
Journal, 3 (1), 24-32.
Unal, A. (2014). The Opinions of Teachers About Use Of Organizational Learning Mechanisms
in Schools. Pamukkale Üniversitesi Eğitim Fakültesi Dergisi, 35(1), 19-32. doi: 10.9779/PUJE551

© ICBTS Copyright by Author(s) The 2016 International Academic Research Conference in Paris 41
Yumusak, S. & Yildiz, H. (2011). Do Education Organizations Show Learning Organizations
Charecterics? A Comparative Case Study in term of Balıkesir Province. Business ve Economics
Research Journal, 2(4), 159-177.

© ICBTS Copyright by Author(s) The 2016 International Academic Research Conference in Munich 42
ENTREPRENEURIAL LEADERSHIP: A THEORETİCAL RESEARCH
Lec. Yusuf ESMER
University of Sinop, Vocational High School
Lec.Faruk DAYI
University of Kastamonu, Tosya Vocational High School
ABSTRACT
A high level of competition in today's business world, enterprises are experiencing about business
growth, innovation around the business. Managers can follow to maintain its existence and
development, and requires them to be leaders who can see the opportunity for risk-taking. At this
point arises the concept of entrepreneurial leadership. Entrepreneurial leadership is a leading
entrepreneur prescriptions. In other words, entrepreneurial leadership; Leaders who taking risks,
seize opportunities, to pursue innovation, innovative manufacturers, innovative and state of the
entrepreneurial characteristics such as having to be strategic. In this context movement of the
research conducted in this studyis primarily focused on the importance of leadership and shortly
after the announcement recently on business concepts, the concept of entrepreneurship,
entrepreneurial leadership characteristics, dimensions and tried to explain the importance it has for
businesses.
Keywords: Entrepreneurship, Leadership, Administration, Entrepreneurial Leadership

© ICBTS Copyright by Author(s) The 2016 International Academic Research Conference in Munich 43
IMPACT OF PERCEIVED QUALITY OF WORK LIFE ON JOB
ATTITUDES IN ACADEMY: DOSE GENERATION MATTER?
Şebnem Alpbaz*
İzmir University, Üçkuyular / İZMİR, Turkey
Corresponding author: Email: [email protected]
Nesrin Ada
Ege University, İzmir, Turkey
Email: [email protected]
Serhan Barutçu
Email: İzmir University, İzmir,Turkey
ABSTRACT
Background: The major challenge for the organizations of today is to attract and retain the
talented employees and create a qualified work life for those who are ready to shift from one
company to another. Therefore, in markets where human resource is more dominant -academia,
healthcare, and other service industries- creating a qualified work life become more important.
In addition, organizations of our age are trying to comprehend the diversified needs and wants
of different generations at work. Today three generation (Baby Boomers, Generation X and
Generation Y) is dominating the workforce and together they bring into the most crucial
resources of millennium organizations which are skill, creativity, and conscientiousness.
Besides, each group has its own diverse perceptions, personalities, values and attitudes toward
work. Consequently, managers of today should know how different generations in
organizations perceived “quality of work life” and how those perceptions affect their major job
attitudes at work. Knowing this will help them to reduce the turnover and increase the
satisfaction and performance of their team.
Objectives: The main motive of the proposed study was constituted as a result of these two
significant streams of research. Hence, the aim of the study is two explore the perceived quality
of work life among different generations in academy ( Generation X, Generation Y and Baby
Boomers) and the relation between their perceptions, and specific job attitudes that are intention
to leave, work alienation and coping strategies against work stress.
Research Design: The proposed research has been adapted a quantitative method to develop a
model and explain the relationship between variables. A survey was administrated to collect
data and questionnaires will investigate work life quality, intention to leave, work, and coping
strategies against stress and work alienation in addition to demographic questions.
Participants: Thorough literature review about the quality of work life points out that it’ s
decreasing in universities. Therefore the data is being collected from academicians who work
in 9 different universities in Turkey.
Keywords: Generation, Quality of Work Life, Job Attitudes, Academy
© ICBTS Copyright by Author(s) The 2016 International Academic Research Conference in Munich 44
A CONSUMER APPROACH TOWARDS
TRADITIONAL/CONTINENTAL FOOD IN INDIAN MARKET
Mayank Parikh
Pandit Deendayal Petroleum University, India
Email: [email protected]
ABSTRACT
The cuisine of India is characterized by the use of various spices, herbs and other vegetables
grown in India and also for the widespread practice of vegetarianism across many sections of
its society. India's religious beliefs and culture have played an influential role in the evolution
of its cuisine.. Today people are very much health conscious and their preference regarding the
food they eat is also changing. Every few days there a restaurant opening this serves continental
and fast food with traditional food also. Expansion of "Modern Family" (i.e Nuclear Family)
segment also play an important role in market growth. Traditionally Indians likes to have a
home cooked food- a concept which is supported individually as well as religiously.. However
with times increasing awareness and influence of western culture there is a slight shift in urban
Indian families. The research tries to identify factors affecting the choice of fast food outlets
by Indian consumers. The researcher has done exploratory research to indentify critical success
factor in this industry followed by conclusive research of various food outlets.
Keywords: Food Industry, Western influence, Cullture.

© ICBTS Copyright by Author(s) The 2016 International Academic Research Conference in Munich 45
“MUSEUMS’ ADVERTISING” AS A PUBLIC RELATIONS ACTIVITY: THE
PROBLEMS AND SOLUTIONS ABOUT CREATING AWARENESS
Nesrin Ada
Ege University, Department of Business
Şebnem Alpbaz
İzmir University, Department of Business, Üçkuyular / İZMİR / TÜRKİYE
Corresponding Author Email: [email protected]
Erkut Cantimur
İzmir University,MBA Candidate
ABSREACT
Background: Culture is one of the important codes in social perception. The attitudes and
behaviors of institutions and organizations, which constructing this culture by the means of
creating, developing, advertising and internalizing positive relations with their environments,
are dependent to capacity and ability of institutions to create awareness. Together with the
values, traditions, rituals and beliefs, “museums” are the representative of the cultures that they
are located in. Therefore, museums are the major values of cities that should be exalted. At this
point, local and international visitors whom are interested in museums, become vital for
museums’ managements, as they are the ones that ensure the sustainability of museums. While,
the socially grounded marketing activities of profit- based organizations are mostly revenue
oriented such as new customer creation, increasing sales and creating positive brand; the social
aims and responsibilities of museums are correspondingly creating brand loyalty together with
strengthening brand position of museums. Museums, at the same time, can have difficulties
sustaining visibility and awareness among the public. From this point of view, public relations
gain more of an issue as it helps the museum managers in creating the atmosphere that will
retain the attention of visitors to museums. Addition to this, corporate social marketing can ease
some processes for museums like strengthening brand position, creating brand preferences and
reaching targets.
Aim of the study: Within this perspective this study will include a qualitative research aimed
at increasing museum visitors and creating awareness Thus the aim of the proposed study is
two folded: First the study targets to explore the public relation hence the corporate social
marketing activities of museums, and develop a model that exhibits the major public relation
operations which structure the interest of “public/visitors” against museums. Secondly the study
objects to expose the moderating factors in the relationship between public relation activities
of museums and their effectiveness on visitors. Some of the moderators in this relation are
estimated to be financial disabilities, managerial lacks, economic and political volatilities and
substitution of attraction areas around the museums.
Research Design: The proposed research has been adapted a qualitative method to develop a
model and explore the relationship between variables. The data is being collected via
interviews made with public relation managers’ , and senior managers’ of community and

© ICBTS Copyright by Author(s) The 2016 International Academic Research Conference in Munich 46
private museums in Turkey. The sample is targeted to be composed of 30 in-depth interviews.
With open- ended questions, the interviews were semi structured with a protocol to assist
interviewer to recall the main themes. All interviews are being recorded with the permissions
of the informants, and it is ensured that any personal information will not be declared. Interview
records are being transcribed and coded to observe if it is required to revise the interview
protocol. The findings will be supported by the secondary data about the museums and public
relation activities in national and international settings for reinforcing the results and managerial
implications
Keywords: Museums, Public Relations, Corporate Social Marketing, Moderating Factors
© ICBTS Copyright by Author(s) The 2016 International Academic Research Conference in Munich 47
THE ROLE OF SOCIAL MEDIA IN INSTIGATING SOCIAL CHANGE
BOUYAHI Hamid
Ibn Tofail University, Morocco
Email: [email protected]
ABSTRACT
This paper aims at comparing the events of the Arab spring in Morocco and Egypt, the former
being a case that does not fit into the Arab spring’s rhetoric about the triumph of the masses in
the age of social media, while the latter seems to be a perfect fit. However, to avoid the bias of
focusing solely on social media, the paper tries to illustrate all the other probable causes and
procedures that the two movements pursued, before deciding to what extent the social media
actually affected, and was affected by, each one of them. For this reason, “relative deprivation” perspective will be used to explain the people’s grievances at each stage of the upheavals. After
that, the “political opportunity structures” that occurred previous to the Arab spring will be
explained before we move to the discussion of the opportunities and threats that the Arab spring
offered and that each of the movements imposed. There will also be a discussion of the “resource
mobilization” tactics and the “framing processes” that activist used at each stage of the two
movements. Simultaneously, the paper will focus on the use of social media from all the
previously mentioned perspectives to see how the virtual space affected the upheavals on the
ground. In order to cover all theses sides the paper tends towards the adaptation of this multi-perspectival approach which may adopt a systematic procedure in which the two events are
seen each time from a different perspective. Each perspective or theory will be illustrated then
applied to the emergence, coalescence, bureaucratization, and decline of the 25th January
movement (In Egypt) and the 20th February movement (In Morocco). As a result, the role of
social media in each of these four stages will be concluded, only after all the other factors are
explained.

© ICBTS Copyright by Author(s) The 2016 International Academic Research Conference in Munich 48
ACQUISITION OF TAMIL PHONOLOGY AMONG MALAY STUDENTS
IN A SECOND LANGUAGE LEARNING CONTEXT
Kaaminy Kanapathy
Sultan Idris Education University, Tanjong Malim, Malaysia
Email: [email protected]
ABSTRACT
The purpose of this paper is to evaluate Tamil phonological acquisition among Malaysian Malay
students in a second language (L2) learning context. The participants were 20 native speakers of
Malay (15 girls and 5 boys) aged seven years old. The participants were limited to students of SK
Behrang 2020, a primary school in Tanjong Malim district, Malaysia. All the participants were
considered to be functional monolingual, that they were not actually using L2 or in the process of
learning a L2. Two types of phonological screening were administrated as techniques to assess the
participant’ s Tamil phonological acquisition. In part A, the participants were required to identify
the vowels. This is done by playing the pronunciation sound of the vowels while all the vowels
were being displayed on a computer’ s screen. Following this, an oral test is done whereby the
researcher has displayed all the vowels one by one and the participants were required to pronounce
the shown vowels. A clear asymmetric pattern of acquisition between both the tests emerged that
the participants were able to acquire the non-identical Tamil phonology from Malay by sound than
from the structure. Alongside with this findings, it is also found that the participants were able to
acquire the long vowels which were not available in the L1.
Keywords: second language acquisition, phonology
© ICBTS Copyright by Author(s) The 2016 International Academic Research Conference in Munich 49
COMPARATIVE ANALYSIS OF ICT ADOPTION AS CHANGE
MANAGEMENT STRATEGY WITHIN BUSINESS ORGANISATIONS A
CASE OF NIGERIA AND UK
Abdullahi Mohammed ¹, Isa Shehu Shagari ²
¹,²Department of Business and Management Studies.
The Polytechnic of Sokoto State, Nigeria
ABSTRACT
Despite the growing number of studies on ICT and the development of E- commerce the concept
is still new among different organisations especially underdeveloped and developing countries the
literature still suggests the need for advancing understanding of the key factors experienced in
different contexts around the world. The re- branding of business activities brought about by an
extensive use of ICT adoption has become and essential elements of business success and a factor
for competitive advantage in electronic commerce today. Government and Business organisations
are no exceptions, as their survival, growth and development depends to large extent on the
application of ICT towards organizational modeling and enhancing efficiency within their
functional units and maintaining customer relations management. The paper is intends to compare
the challenges of ICT adoption and level of development attained among developed and
developing countries, where ICT adoption serve as alternative for survival, growth and
development among constraints of inexperienced IT management and substandard employees,
poor infrastructure and high rate of cybercrime
Keywords: ICT Adoption, E-Commerce and Organizational performance.


