Current Issues Emerging markets
Corporate bond markets in Asia have expanded rapidly. Since the global
financial crisis, Asian corporates have made increasing use of bond issuance for
their funding needs, complementing traditional channels such as bank lending.
The boom in bond issuance, which grew more than fourfold since 2008, has
been fuelled by favourable global liquidity conditions and regional initiatives.
Asian corporate bond markets provide a mixed picture. While the bond markets
of Hong Kong, Singapore and Korea are comparatively advanced and liquid,
markets in China, India, Indonesia and Thailand are still at an early stage of
development. Using data based on bond issuance also reveals variations in
terms of structural characteristics by sector, currency, issuing volume and use of
funds.
While fast growth in bond markets has provided an effective source of financing
for the corporate sector, its development is far from complete. Corporate
leverage and indebtedness have risen throughout the region, notably in China.
More needs to be done to build a framework that is both conducive to market
innovation and enables companies to seek funding from a broader range of
sources without increasing vulnerability to shocks.
There is a structural imperative underpinning growth in corporate bond markets. Long-term projects increasingly require funding from the non-public sector, given the region’s demographic challenges, emerging middle classes and substantial needs in infrastructure and urban development, which cannot all be met via fiscal spending only.
Authors
Hannah Levinger
+49 69 910-31753
Chen Li
Editor
Maria Laura Lanzeni
Deutsche Bank AG
Deutsche Bank Research
Frankfurt am Main
Germany
E-mail: [email protected]
Fax: +49 69 910-31877
www.dbresearch.com
DB Research Management
Ralf Hoffmann
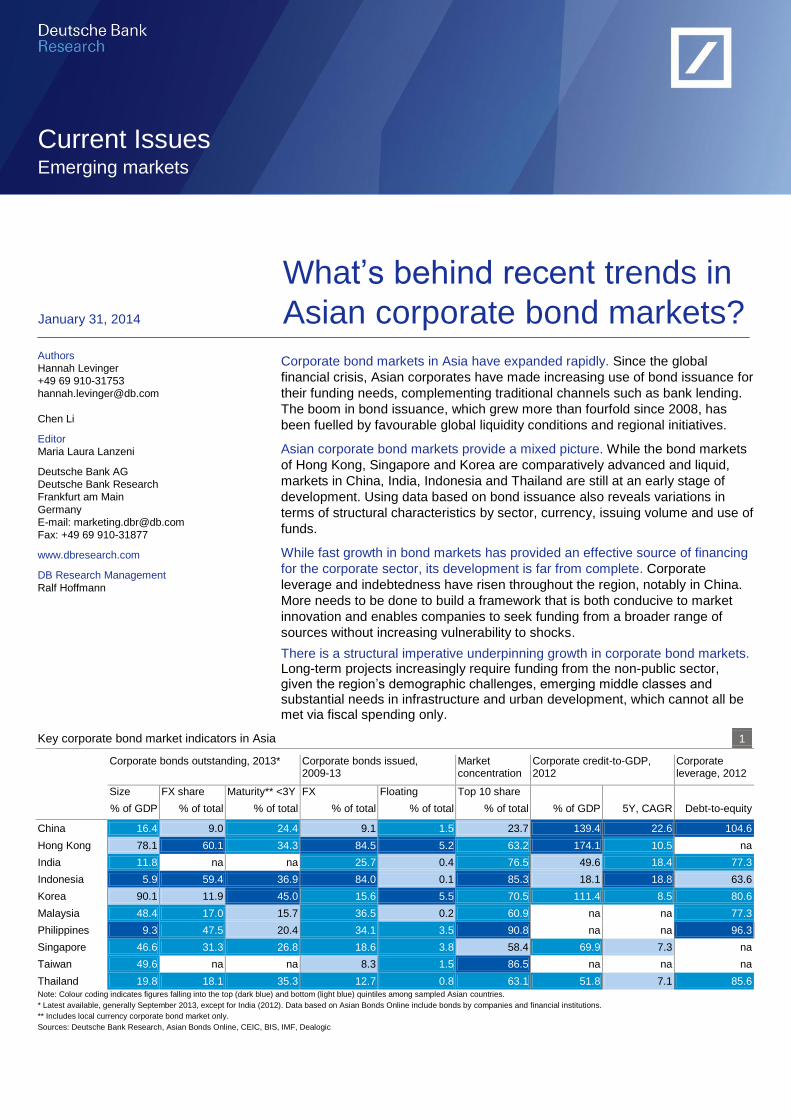
Key corporate bond market indicators in Asia 1
Corporate bonds outstanding, 2013* Corporate bonds issued, 2009-13
Market concentration
Corporate credit-to-GDP, 2012
Corporate leverage, 2012
Size FX share Maturity** <3Y FX Floating Top 10 share
% of GDP % of total % of total % of total % of total % of total % of GDP 5Y, CAGR Debt-to-equity
China 16.4 9.0 24.4 9.1 1.5 23.7 139.4 22.6 104.6
Hong Kong 78.1 60.1 34.3 84.5 5.2 63.2 174.1 10.5 na
India 11.8 na na 25.7 0.4 76.5 49.6 18.4 77.3
Indonesia 5.9 59.4 36.9 84.0 0.1 85.3 18.1 18.8 63.6
Korea 90.1 11.9 45.0 15.6 5.5 70.5 111.4 8.5 80.6
Malaysia 48.4 17.0 15.7 36.5 0.2 60.9 na na 77.3
Philippines 9.3 47.5 20.4 34.1 3.5 90.8 na na 96.3
Singapore 46.6 31.3 26.8 18.6 3.8 58.4 69.9 7.3 na
Taiwan 49.6 na na 8.3 1.5 86.5 na na na
Thailand 19.8 18.1 35.3 12.7 0.8 63.1 51.8 7.1 85.6 Note: Colour coding indicates figures falling into the top (dark blue) and bottom (light blue) quintiles among sampled Asian countries.
* Latest available, generally September 2013, except for India (2012). Data based on Asian Bonds Online include bonds by companies and financial institutions.
** Includes local currency corporate bond market only.
Sources: Deutsche Bank Research, Asian Bonds Online, CEIC, BIS, IMF, Dealogic
January 31, 2014
What’s behind recent trends in
Asian corporate bond markets?

What’s behind recent trends in Asian corporate bond markets?
2 | January 31, 2014 Current Issues
What’s behind recent trends in Asian corporate bond markets?
3 | January 31, 2014 Current Issues
I. Asia’s corporate bond markets: Drivers and risks
Asia’s corporate borrowers have been very well received in recent years.
Resilient fundamentals and improved (sovereign) creditworthiness have served
as key “pull” factors, while a number of external conditions provided the fuel for
Asia’s borrowing spree. First, low rates in the developed economies drove
investors towards Asia in search for yield. Second, bond markets increasingly
fulfilled a “spare tyre” function for Asian firms, even as local and other
international banks stepped in to fill the gap when European lenders reined in
financing activities abroad.1 On the supply side, corporate issuance received a
strong boost from regulatory and policy initiatives aimed at deepening bond
markets and improving related infrastructure.
Against this backdrop, corporate bond markets in Asia have grown significantly.2
Corporate bond market capitalisation reached 24.2% of the region’s GDP by
2012 from just 16.7% in 2008. In value terms, the stock of outstanding corporate
bonds amounted to USD 3.2 tr by Q3 2013 – almost triple the value recorded at
the end of 2008. The pace of growth was especially high after 2009, with much
of the dynamism stemming from growth in the local currency market.
Rapid growth of Asia’s corporate bond markets has been partly an outcome of
the region’s efforts to establish domestic government bond markets. Helped by
targeted measures in this area, Asia’s local bond market has become a role
model for other emerging market countries trying to build resilience and reduce
currency mismatches in debt capital markets. Various initiatives (see Timeline)
have made a contribution and strengthened regional cooperation among Asian
countries. In doing so, Asian economies have drawn lessons from the 1990s
currency and maturity mismatches which soured corporate and sovereign
balance sheets and eventually triggered a systemic crisis in 1997/98.
Important financing source but not a silver bullet for capital market deepening
Corporate bonds constitute just one component in the funding mix for non-
financial companies, ranging from small and medium-sized enterprises (SMEs)
to large conglomerates. For emerging market firms, the domestic corporate
bond market may provide a stable source of financing for business needs,
thereby limiting the reliance on public-sector funds and fuelling economic
growth. Larger companies may tap global bond markets for capital to fund
longer-term projects catering to emerging middle classes and addressing the
substantial needs of infrastructure upgrading and urbanisation.
Fast growth in bond markets has enabled efficient financing for business needs,
stimulating investment and growth. However, Asian firms’ extensive use of the
debt capital market needs to be matched by progress in making the markets
deeper and more stable. Asia’s corporate bond markets remain, with few
exceptions, small and illiquid. Considerable variation exists in the region with
respect to market size as well as structural characteristics underlying corporate
bond issuance. In addition, corporate indebtedness and leverage have risen
throughout the region, notably in China, raising the vulnerability to a sudden dry-
up in funds.
Table 1 on page 1 summarises some of the key corporate bond market
characteristics – discussed in more detail throughout this report. The first part of
the report focuses on the drivers and risks associated with Asia’s fast growing
corporate bond markets. The second part uses data from Dealogic to provide a
more detailed overview of firms’ bond issuance in recent years. The third part
1 Feyen and del Mazo (2013).
2 Asia in this report comprises China, Hong Kong, India, Indonesia, Korea, Malaysia, Philippines,
Singapore, Taiwan, Thailand and (where available) Vietnam.
Timeline of bond market development 2
Date Selected initiatives
2002 Asia Bond Market Initiative (ABMI), launched under ASEAN+3 to encourage local currency bond market development and increase diversity of bonds and issuers.
2003 Asian Bond Fund 1: launched by central banks of EMEAP* countries to invest pooled savings in the region's (sovereign and quasi-sovereign) bond markets.
2005 Asian Bond Fund 2, follow-up to ABF1, with investment channelled into local currency bonds. Primary goal is to reduce market barriers for investors and improve liquidity in sovereign bond markets.
2008 ASEAN+3 New ABMI Roadmap, set up task forces to address specific issues in local bond market development.
2010 ASEAN+3 Bond Market Forum, created to promote harmonisation of market practices and regulations to facilitate cross-border bond issuance, also for corporate bonds.
2010 Launch of the Credit Guarantee and Investment Facility (CGIF) as a trust fund within the ADB; provides credit enhancement to promote larger and cross-border corporate bond issues.
2015 ASEAN Economic Community (AEC), establish a single market and production base and promote regional integration of trade, services and capital markets.
*Executives' Meeting of East Asia and Pacific
Sources: Chan et al. (2011), ADB (2012)
What’s behind recent trends in Asian corporate bond markets?
4 | January 31, 2014 Current Issues
offers an outlook for corporate bond markets in the region, based on the key
remaining issues and risks uncovered by recent issuance trends. Depending on
the source of data, the definition of corporate bonds may include or exclude
financial institutions, as will be indicated case-by-case.
Corporate funding is overwhelmingly bank-based but bonds are catching up
Throughout the region, bank-intermediated credit remains the dominant source
of financing for companies. Bank-based financial intermediation has a
traditionally strong position in Asia, where it can draw on the region’s sizeable
pool of domestic savings. Banks’ reliance on deposits as opposed to wholesale
funding is high – in Indonesia, Malaysia, Thailand and India, for instance, banks
depend on retail deposits for more than 75% of their funding.3 Bank-based
intermediation can also help to reduce information asymmetries that would
otherwise drive up monitoring costs and complicate access to funding, in
particular for smaller issuers.4 Incomplete information is still a relevant constraint
on corporate finance in Asia, given that most firms do not possess a long
issuance track record and uninformed borrowing proved to be fatal during the
Asian crisis. Relationship-based lending continues to play a role in Asia,
especially where the corporate sector is to a significant extent shaped by family-
controlled conglomerates.
However, the dominant position of bank credit is increasingly being challenged.
Firms’ attempts to tap funding sources outside the bank channel have received
fresh impetus due to a number of factors in recent years.
Bonds vs bank lending – shifting patterns
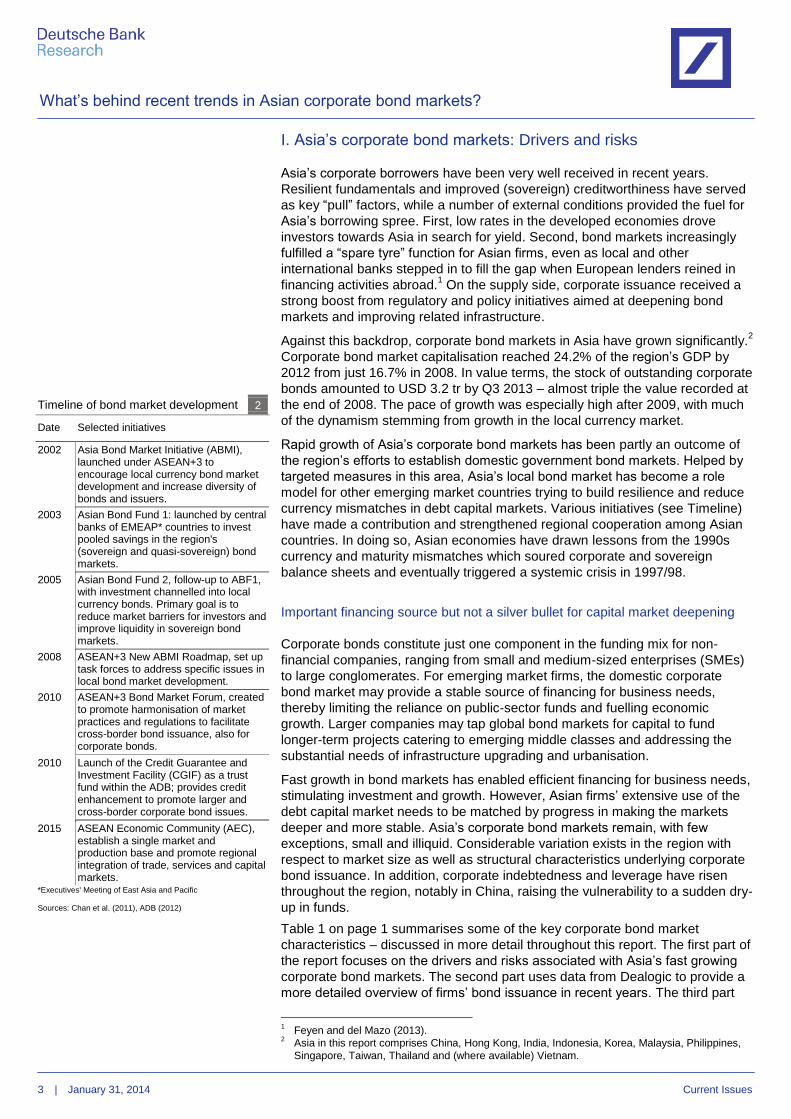
One of these factors is the shift in the composition and origin of international
debt flows in the course of the global financial crisis. While European banks’
lending to emerging markets decelerated sharply (chart 3), the impact of foreign
deleveraging on credit supply in Asian countries was more muted. Not only did
lenders from other regions (notably UK, US and Japan) at least partially
compensate for the shortfalls in cross-border flows from continental Europe, but
most countries also adopted policies geared at supporting credit to small and
medium enterprises and trade finance.5
Yet, the ease with which different types of funding flows could be substituted
seems to differ. Long-term syndicated bank loans with a maturity of 5 years or
more – a key financing method - appear to have contracted successively since
the onset of the crisis, according to a report by the G20.6 By contrast, long-term
international bond flows to Asia rebounded in 2009-10, suggesting that the bond
market contributed to stabilising long-term debt flows to the region. The G20
report also points out that investment grade borrowers accounted for 90% of
long-term bank lending in 2009-11, but only 75% thereafter, at the same time as
investment grade companies gained share in international bond issuance. This
implies at least some substitution may have taken place, helped by improved
access and lower financing costs in bond markets.
The growing relevance of bonds relative to syndicated loans for Asia’s non-
financial firms is also evident from Dealogic data, where bond issues gained
after 2010 as a share of GDP while the share of syndicated loans fell (chart 4).
In aggregate terms, bonds and syndicated loans may often be substituted for
each other, depending on whether liquidity in loan markets is favoured over
3 McKinsey (2013).
4 Takagi (2002).
5 Ayar and Jain-Chandra (2011).
6 G20 and World Bank (2013).
0
500
1,000
1,500
2,000
2,500
05 06 07 08 09 10 11 12
Europe, excl. UK UK
US Japan
Australia
Others step in as Europe deleverages 3
Source: BIS
USD bn, internat. claims vis-à-vis developing Asia
0.0
0.5
1.0
1.5
2.0
2.5
3.0
3.5
4.0
00 02 04 06 08 10 12
Bond issuance
Use of syndicated loans
Corp. bonds accelerate vs synd. loans 4
% of GDP
Sources: Deutsche Bank Research, Dealogic
Asia incl. CN, HK, IN, ID, MY, PH, SG, KR, TW, TH
0
1
2
3
4
5
6
7
8
05 06 07 08 09 10 11 12
China Philippines
Korea Taiwan
Sources: Deutsche Bank Research, Dealogic
Corporate bond to synd. loan volumes ratio
Bond issuance exceeds synd. loans 7-fold in China 5
What’s behind recent trends in Asian corporate bond markets?
5 | January 31, 2014 Current Issues
typically longer-term and fixed rate bond funding or vice versa. In 2012, firms’
bond issuance exceeded syndicated loan volumes in Hong Kong, Korea, the
Philippines, Malaysia and China (chart 5). Bond issuance growth in the latter
has been a key engine behind the rise in bonds versus loans in Asia, coupled
with a relatively flat development of syndicated loan volumes over the same
period.
Another supply-side driver of changes in Asian firms’ funding mix is the
regulatory challenge facing banks, both global and local ones. With Basel III
being phased in across the globe, higher capital requirements could constrain
bank lending to corporates and create higher demand for bond market funding.
Although the region seems relatively well-placed to meet higher standards,
individual banks’ abilities to serve firms’ financing needs may differ. In addition,
banks may be required to provide higher-quality liquid assets – such as high
grade corporate bonds – as collateral.7
Policy initiatives have facilitated local and non-rated bond issuance
Regulators across Asia have encouraged issuance of locally or unrated debt to
stimulate the use of the bond market. The Credit Guarantee and Investment
Facility (CGIF) – a trust set up in 2010 by ASEAN+3 (China, Japan, Korea) and
the Asian Development Bank (ADB) – provides guarantees for bonds issued by
firms facing constraints in securing long-term funding from the local bond
market. Another example is Thailand’s Securities and Exchange Commission
(SEC) which began to allow the sale of unrated bonds to accredited investors.8
The larger role played by local agencies (set up as either government initiatives
or joint ventures with international agencies) has facilitated firms’ access to the
bond market in countries such as China, India, Korea, Malaysia and Thailand.9
In Vietnam, by contrast, absence of an effective credit rating system may have
hampered corporate bond issuance. Of the bonds registered in 2012 up to mid-
2013 only a fraction has been issued.10
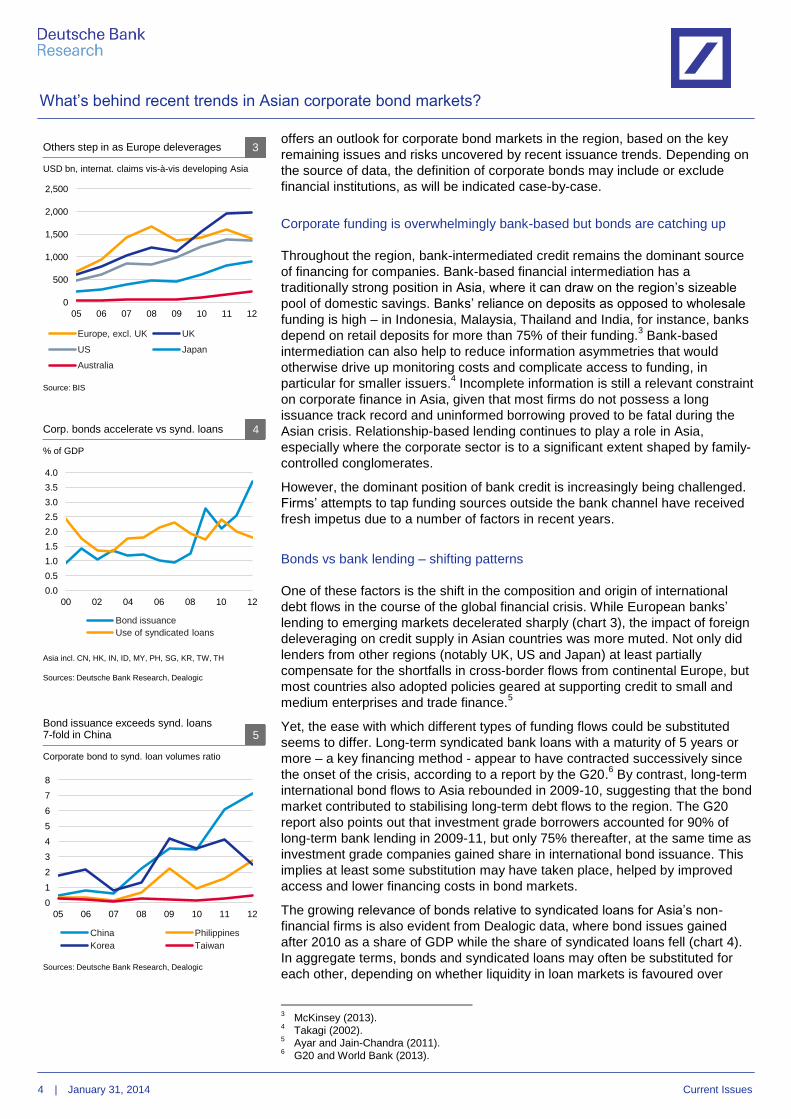
Corporate bond markets expanded most in China
The size of the corporate bond market remains mixed across countries. Only in
Korea, Hong Kong, Malaysia, Taiwan and Singapore are corporate bond
markets comparatively advanced with outstanding bonds close to or in excess of
50% of GDP (chart 6). This figure includes bonds both by companies and
financial institutions. ADB provides the split between the two only for foreign
currency denominated bonds, of which 39% constituted bonds by banks and
other financial institutions as of Sep 2013. Most other corporate bond markets in
the region start from a low base, with market capitalisation still below 20% of
GDP, and these include Thailand, China, the Philippines, Indonesia and
Vietnam (chart 7). The Indian corporate bond market at 11.8% of GDP as of
2012 is equally underdeveloped.11
China stands out as having doubled the size of its corporate bond market as a
share of GDP over the past 4 years (to reach 16.4% of GDP at the end of Q3
2013). In dollar terms, it increased more than fourfold from USD 280 bn at end-
2008 to more than USD 1.4 tr in 2013. This makes China the largest corporate
bond market in the region by USD value (chart 8). Excluding China, the
7 Deutsche Bank Research (2013a).
8 ADB (2013).
9 Shim (2012).
10 Vietnam News (2013).
11 Reserve Bank of India (2012)
0
10
20
30
40
50
60
70
80
90
100
KR HK MY TW SG
2008 2013
Sources: Asian Bonds Online, CEIC
Largest Asian corporate bond markets 6
Corporate bonds outstanding, % of GDP
6
Note: Includes bonds by financial institutions. 2013 data is as of September.
0
5
10
15
20
25
TH CN PH ID VN
2008 2013
Source: Asian Bonds Online
Some smaller markets 7
Corporate bonds outstanding, % of GDP
Note: Includes bonds by financial institutions. 2013 data is as of September.
0
200
400
600
800
1,000
1,200
1,400
1,600
CN KR HK MY SG TH TW ID PH VN
Local currency denominated bonds
Foreign currency denominated bonds
Sources: Asian Bonds Online, CEIC
In USD terms China, Korea dwarf others 8
Corporate bonds outstanding, USD bn
Note: Includes bonds by financial institutions. 2013 data is as of September. Data for Taiwan include both LCY and FCY.
What’s behind recent trends in Asian corporate bond markets?
6 | January 31, 2014 Current Issues
strongest USD growth was observed in Indonesia and the Philippines, where
the corporate bond market expanded by more than 170% since 2008.
It is important to note that the corporate bond market has provided a financing
platform not only to private sector firms but also government projects in line with
a broader policy agenda. State-owned companies continue to be important
players in Asian corporate bond markets, with some 40% of Asian corporate
bond issuance undertaken by public entities.12
Perhaps not surprisingly, China’s
fast-growing corporate bond market remains to a large extent state-dominated,
where the twenty largest state-owned issuers accounted for 41% of corporate
bonds outstanding as of Q3 2013.13
Moreover, local governments have tapped
the corporate bond market indirectly via financing vehicles to stimulate urban
and infrastructure development (see box on the next page).
The flipside: Asian corporate borrowing has increased faster than GDP
The strong expansion in Asia’s corporate bond markets has freed up funds
needed for investment and growth in recent years while also helping the
deepening of capital markets and diversification of financing sources. At the
same time, borrowing from debt capital markets has contributed to strongly
rising corporate debt levels in some countries.
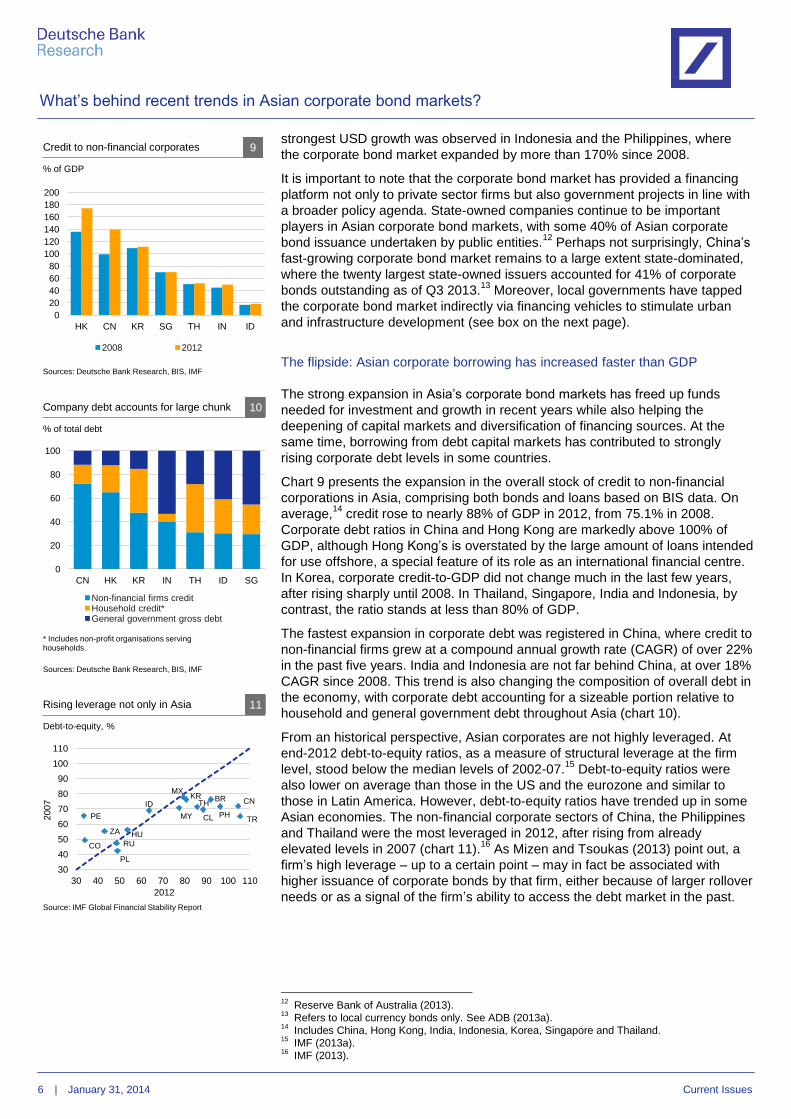
Chart 9 presents the expansion in the overall stock of credit to non-financial
corporations in Asia, comprising both bonds and loans based on BIS data. On
average,14
credit rose to nearly 88% of GDP in 2012, from 75.1% in 2008.
Corporate debt ratios in China and Hong Kong are markedly above 100% of
GDP, although Hong Kong’s is overstated by the large amount of loans intended
for use offshore, a special feature of its role as an international financial centre.
In Korea, corporate credit-to-GDP did not change much in the last few years,
after rising sharply until 2008. In Thailand, Singapore, India and Indonesia, by
contrast, the ratio stands at less than 80% of GDP.
The fastest expansion in corporate debt was registered in China, where credit to
non-financial firms grew at a compound annual growth rate (CAGR) of over 22%
in the past five years. India and Indonesia are not far behind China, at over 18%
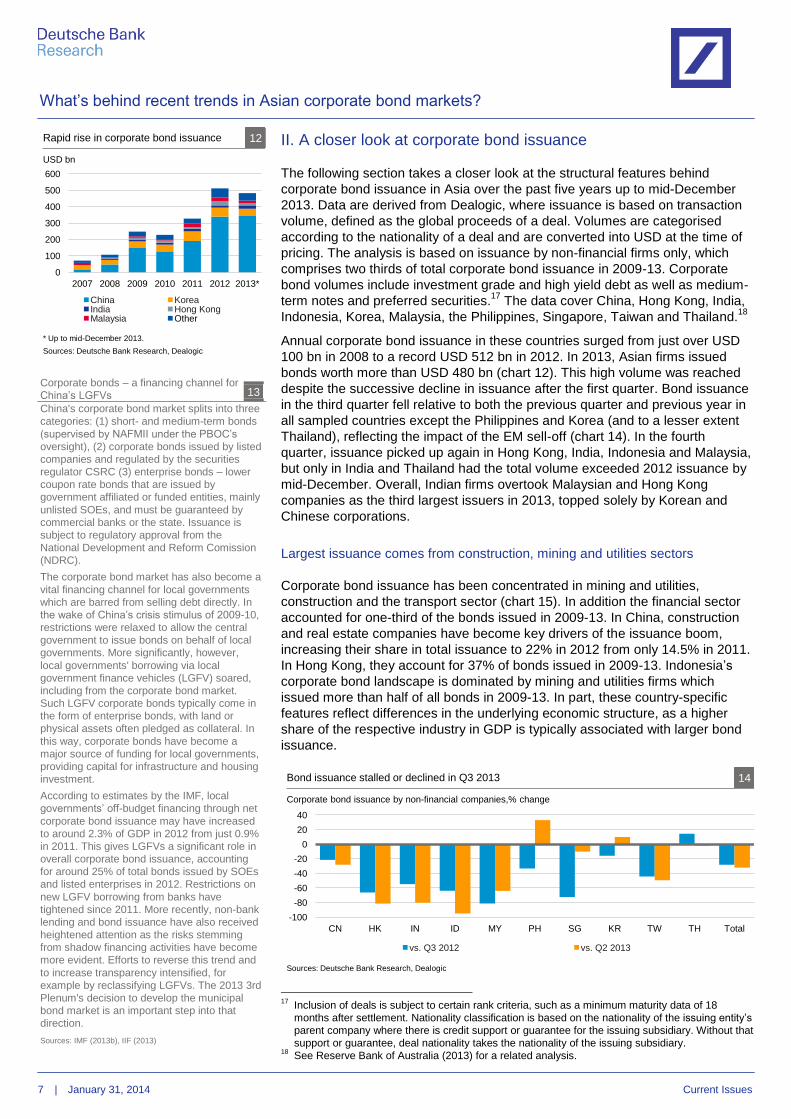
CAGR since 2008. This trend is also changing the composition of overall debt in
the economy, with corporate debt accounting for a sizeable portion relative to
household and general government debt throughout Asia (chart 10).
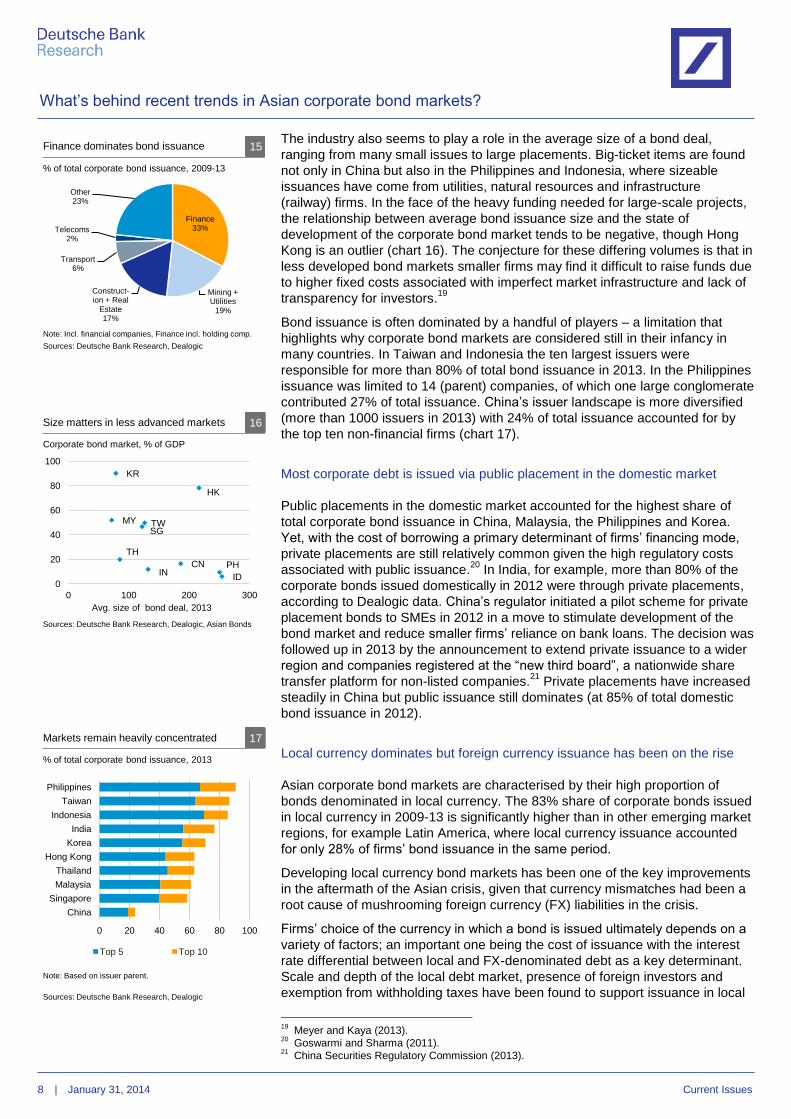
From an historical perspective, Asian corporates are not highly leveraged. At
end-2012 debt-to-equity ratios, as a measure of structural leverage at the firm
level, stood below the median levels of 2002-07.15
Debt-to-equity ratios were
also lower on average than those in the US and the eurozone and similar to
those in Latin America. However, debt-to-equity ratios have trended up in some
Asian economies. The non-financial corporate sectors of China, the Philippines
and Thailand were the most leveraged in 2012, after rising from already
elevated levels in 2007 (chart 11).16
As Mizen and Tsoukas (2013) point out, a
firm’s high leverage – up to a certain point – may in fact be associated with
higher issuance of corporate bonds by that firm, either because of larger rollover
needs or as a signal of the firm’s ability to access the debt market in the past.
12
Reserve Bank of Australia (2013). 13
Refers to local currency bonds only. See ADB (2013a). 14
Includes China, Hong Kong, India, Indonesia, Korea, Singapore and Thailand. 15
IMF (2013a). 16
IMF (2013).
0
20
40
60
80
100
120
140
160
180
200
HK CN KR SG TH IN ID
2008 2012
Credit to non-financial corporates 9
% of GDP
Sources: Deutsche Bank Research, BIS, IMF
0
20
40
60
80
100
CN HK KR IN TH ID SG
Non-financial firms credit Household credit* General government gross debt
Company debt accounts for large chunk 10
Sources: Deutsche Bank Research, BIS, IMF
% of total debt
* Includes non-profit organisations serving households.
TR
CN
PH
BR
CL
TH KR
MX
MY
ID
HU
PL
RU
ZA
CO
PE
30
40
50
60
70
80
90
100
110
30 40 50 60 70 80 90 100 110
Rising leverage not only in Asia 11
Debt-to-equity, %
2012
Source: IMF Global Financial Stability Report
2007
What’s behind recent trends in Asian corporate bond markets?
7 | January 31, 2014 Current Issues
II. A closer look at corporate bond issuance
The following section takes a closer look at the structural features behind
corporate bond issuance in Asia over the past five years up to mid-December
2013. Data are derived from Dealogic, where issuance is based on transaction
volume, defined as the global proceeds of a deal. Volumes are categorised
according to the nationality of a deal and are converted into USD at the time of
pricing. The analysis is based on issuance by non-financial firms only, which
comprises two thirds of total corporate bond issuance in 2009-13. Corporate
bond volumes include investment grade and high yield debt as well as medium-
term notes and preferred securities.17
The data cover China, Hong Kong, India,
Indonesia, Korea, Malaysia, the Philippines, Singapore, Taiwan and Thailand.18
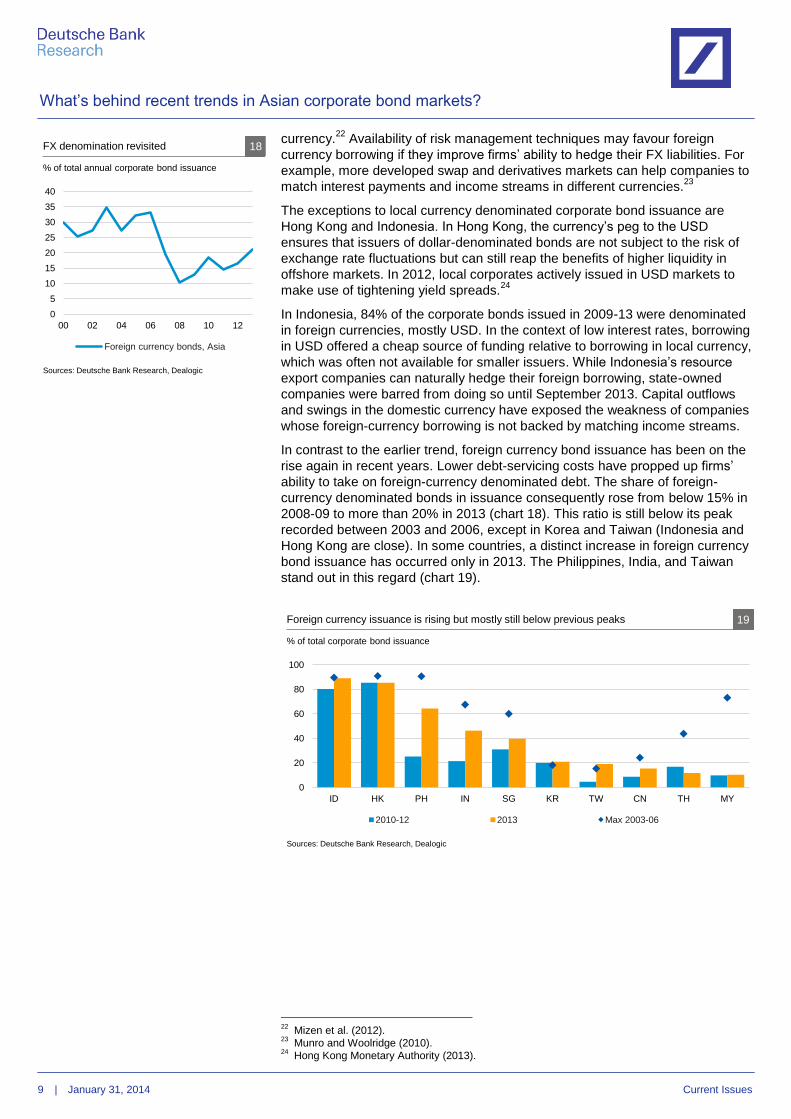
Annual corporate bond issuance in these countries surged from just over USD
100 bn in 2008 to a record USD 512 bn in 2012. In 2013, Asian firms issued
bonds worth more than USD 480 bn (chart 12). This high volume was reached
despite the successive decline in issuance after the first quarter. Bond issuance
in the third quarter fell relative to both the previous quarter and previous year in
all sampled countries except the Philippines and Korea (and to a lesser extent
Thailand), reflecting the impact of the EM sell-off (chart 14). In the fourth
quarter, issuance picked up again in Hong Kong, India, Indonesia and Malaysia,
but only in India and Thailand had the total volume exceeded 2012 issuance by
mid-December. Overall, Indian firms overtook Malaysian and Hong Kong
companies as the third largest issuers in 2013, topped solely by Korean and
Chinese corporations.
Largest issuance comes from construction, mining and utilities sectors
Corporate bond issuance has been concentrated in mining and utilities,
construction and the transport sector (chart 15). In addition the financial sector
accounted for one-third of the bonds issued in 2009-13. In China, construction
and real estate companies have become key drivers of the issuance boom,
increasing their share in total issuance to 22% in 2012 from only 14.5% in 2011.
In Hong Kong, they account for 37% of bonds issued in 2009-13. Indonesia’s
corporate bond landscape is dominated by mining and utilities firms which
issued more than half of all bonds in 2009-13. In part, these country-specific
features reflect differences in the underlying economic structure, as a higher
share of the respective industry in GDP is typically associated with larger bond
issuance.
17
Inclusion of deals is subject to certain rank criteria, such as a minimum maturity data of 18
months after settlement. Nationality classification is based on the nationality of the issuing entity’s
parent company where there is credit support or guarantee for the issuing subsidiary. Without that
support or guarantee, deal nationality takes the nationality of the issuing subsidiary. 18
See Reserve Bank of Australia (2013) for a related analysis.
Corporate bonds – a financing channel for
China’s LGFVs 13
China's corporate bond market splits into three
categories: (1) short- and medium-term bonds
(supervised by NAFMII under the PBOC’s
oversight), (2) corporate bonds issued by listed
companies and regulated by the securities
regulator CSRC (3) enterprise bonds – lower
coupon rate bonds that are issued by
government affiliated or funded entities, mainly
unlisted SOEs, and must be guaranteed by
commercial banks or the state. Issuance is
subject to regulatory approval from the
National Development and Reform Comission
(NDRC).
The corporate bond market has also become a
vital financing channel for local governments
which are barred from selling debt directly. In
the wake of China’s crisis stimulus of 2009-10,
restrictions were relaxed to allow the central
government to issue bonds on behalf of local
governments. More significantly, however,
local governments' borrowing via local
government finance vehicles (LGFV) soared,
including from the corporate bond market.
Such LGFV corporate bonds typically come in
the form of enterprise bonds, with land or
physical assets often pledged as collateral. In
this way, corporate bonds have become a
major source of funding for local governments,
providing capital for infrastructure and housing
investment.
According to estimates by the IMF, local
governments’ off-budget financing through net
corporate bond issuance may have increased
to around 2.3% of GDP in 2012 from just 0.9%
in 2011. This gives LGFVs a significant role in
overall corporate bond issuance, accounting
for around 25% of total bonds issued by SOEs
and listed enterprises in 2012. Restrictions on
new LGFV borrowing from banks have
tightened since 2011. More recently, non-bank
lending and bond issuance have also received
heightened attention as the risks stemming
from shadow financing activities have become
more evident. Efforts to reverse this trend and
to increase transparency intensified, for
example by reclassifying LGFVs. The 2013 3rd
Plenum's decision to develop the municipal
bond market is an important step into that
direction.
Sources: IMF (2013b), IIF (2013)
0
100
200
300
400
500
600
2007 2008 2009 2010 2011 2012 2013*
China Korea India Hong Kong Malaysia Other
Rapid rise in corporate bond issuance 12
USD bn
Sources: Deutsche Bank Research, Dealogic
* Up to mid-December 2013.
-100
-80
-60
-40
-20
0
20
40
CN HK IN ID MY PH SG KR TW TH Total
vs. Q3 2012 vs. Q2 2013
Bond issuance stalled or declined in Q3 2013 14
Corporate bond issuance by non-financial companies,% change
Sources: Deutsche Bank Research, Dealogic
What’s behind recent trends in Asian corporate bond markets?
8 | January 31, 2014 Current Issues
The industry also seems to play a role in the average size of a bond deal,
ranging from many small issues to large placements. Big-ticket items are found
not only in China but also in the Philippines and Indonesia, where sizeable
issuances have come from utilities, natural resources and infrastructure
(railway) firms. In the face of the heavy funding needed for large-scale projects,
the relationship between average bond issuance size and the state of
development of the corporate bond market tends to be negative, though Hong
Kong is an outlier (chart 16). The conjecture for these differing volumes is that in
less developed bond markets smaller firms may find it difficult to raise funds due
to higher fixed costs associated with imperfect market infrastructure and lack of
transparency for investors.19
Bond issuance is often dominated by a handful of players – a limitation that
highlights why corporate bond markets are considered still in their infancy in
many countries. In Taiwan and Indonesia the ten largest issuers were
responsible for more than 80% of total bond issuance in 2013. In the Philippines
issuance was limited to 14 (parent) companies, of which one large conglomerate
contributed 27% of total issuance. China’s issuer landscape is more diversified
(more than 1000 issuers in 2013) with 24% of total issuance accounted for by
the top ten non-financial firms (chart 17).
Most corporate debt is issued via public placement in the domestic market
Public placements in the domestic market accounted for the highest share of
total corporate bond issuance in China, Malaysia, the Philippines and Korea.
Yet, with the cost of borrowing a primary determinant of firms’ financing mode,
private placements are still relatively common given the high regulatory costs
associated with public issuance.20
In India, for example, more than 80% of the
corporate bonds issued domestically in 2012 were through private placements,
according to Dealogic data. China’s regulator initiated a pilot scheme for private
placement bonds to SMEs in 2012 in a move to stimulate development of the
bond market and reduce smaller firms’ reliance on bank loans. The decision was
followed up in 2013 by the announcement to extend private issuance to a wider
region and companies registered at the “new third board”, a nationwide share
transfer platform for non-listed companies.21
Private placements have increased
steadily in China but public issuance still dominates (at 85% of total domestic
bond issuance in 2012).
Local currency dominates but foreign currency issuance has been on the rise
Asian corporate bond markets are characterised by their high proportion of
bonds denominated in local currency. The 83% share of corporate bonds issued
in local currency in 2009-13 is significantly higher than in other emerging market
regions, for example Latin America, where local currency issuance accounted
for only 28% of firms’ bond issuance in the same period.
Developing local currency bond markets has been one of the key improvements
in the aftermath of the Asian crisis, given that currency mismatches had been a
root cause of mushrooming foreign currency (FX) liabilities in the crisis.
Firms’ choice of the currency in which a bond is issued ultimately depends on a
variety of factors; an important one being the cost of issuance with the interest
rate differential between local and FX-denominated debt as a key determinant.
Scale and depth of the local debt market, presence of foreign investors and
exemption from withholding taxes have been found to support issuance in local
19
Meyer and Kaya (2013). 20
Goswarmi and Sharma (2011). 21
China Securities Regulatory Commission (2013).
ID
PH
HK
CN IN
TW SG
TH
KR
MY
0
20
40
60
80
100
0 100 200 300
Size matters in less advanced markets 16
Corporate bond market, % of GDP
Avg. size of bond deal, 2013
Sources: Deutsche Bank Research, Dealogic, Asian Bonds
Finance 33%
Mining + Utilities
19%
Construct-ion + Real
Estate 17%
Transport 6%
Telecoms 2%
Other 23%
Finance dominates bond issuance 15
% of total corporate bond issuance, 2009-13
Sources: Deutsche Bank Research, Dealogic
Note: Incl. financial companies, Finance incl. holding comp.
0 20 40 60 80 100
Philippines
Taiwan
Indonesia
India
Korea
Hong Kong
Thailand
Malaysia
Singapore
China
Top 5 Top 10
Markets remain heavily concentrated 17
% of total corporate bond issuance, 2013
Sources: Deutsche Bank Research, Dealogic
Note: Based on issuer parent.
What’s behind recent trends in Asian corporate bond markets?
9 | January 31, 2014 Current Issues
currency.22
Availability of risk management techniques may favour foreign
currency borrowing if they improve firms’ ability to hedge their FX liabilities. For
example, more developed swap and derivatives markets can help companies to
match interest payments and income streams in different currencies.23
The exceptions to local currency denominated corporate bond issuance are
Hong Kong and Indonesia. In Hong Kong, the currency’s peg to the USD
ensures that issuers of dollar-denominated bonds are not subject to the risk of
exchange rate fluctuations but can still reap the benefits of higher liquidity in
offshore markets. In 2012, local corporates actively issued in USD markets to
make use of tightening yield spreads.24
In Indonesia, 84% of the corporate bonds issued in 2009-13 were denominated
in foreign currencies, mostly USD. In the context of low interest rates, borrowing
in USD offered a cheap source of funding relative to borrowing in local currency,
which was often not available for smaller issuers. While Indonesia’s resource
export companies can naturally hedge their foreign borrowing, state-owned
companies were barred from doing so until September 2013. Capital outflows
and swings in the domestic currency have exposed the weakness of companies
whose foreign-currency borrowing is not backed by matching income streams.
In contrast to the earlier trend, foreign currency bond issuance has been on the
rise again in recent years. Lower debt-servicing costs have propped up firms’
ability to take on foreign-currency denominated debt. The share of foreign-
currency denominated bonds in issuance consequently rose from below 15% in
2008-09 to more than 20% in 2013 (chart 18). This ratio is still below its peak
recorded between 2003 and 2006, except in Korea and Taiwan (Indonesia and
Hong Kong are close). In some countries, a distinct increase in foreign currency
bond issuance has occurred only in 2013. The Philippines, India, and Taiwan
stand out in this regard (chart 19).
22
Mizen et al. (2012). 23
Munro and Woolridge (2010). 24
Hong Kong Monetary Authority (2013).
0
5
10
15
20
25
30
35
40
00 02 04 06 08 10 12
Foreign currency bonds, Asia
FX denomination revisited 18
% of total annual corporate bond issuance
Sources: Deutsche Bank Research, Dealogic
0
20
40
60
80
100
ID HK PH IN SG KR TW CN TH MY
2010-12 2013 Max 2003-06
Foreign currency issuance is rising but mostly still below previous peaks 19
% of total corporate bond issuance
Sources: Deutsche Bank Research, Dealogic
What’s behind recent trends in Asian corporate bond markets?
10 | January 31, 2014 Current Issues
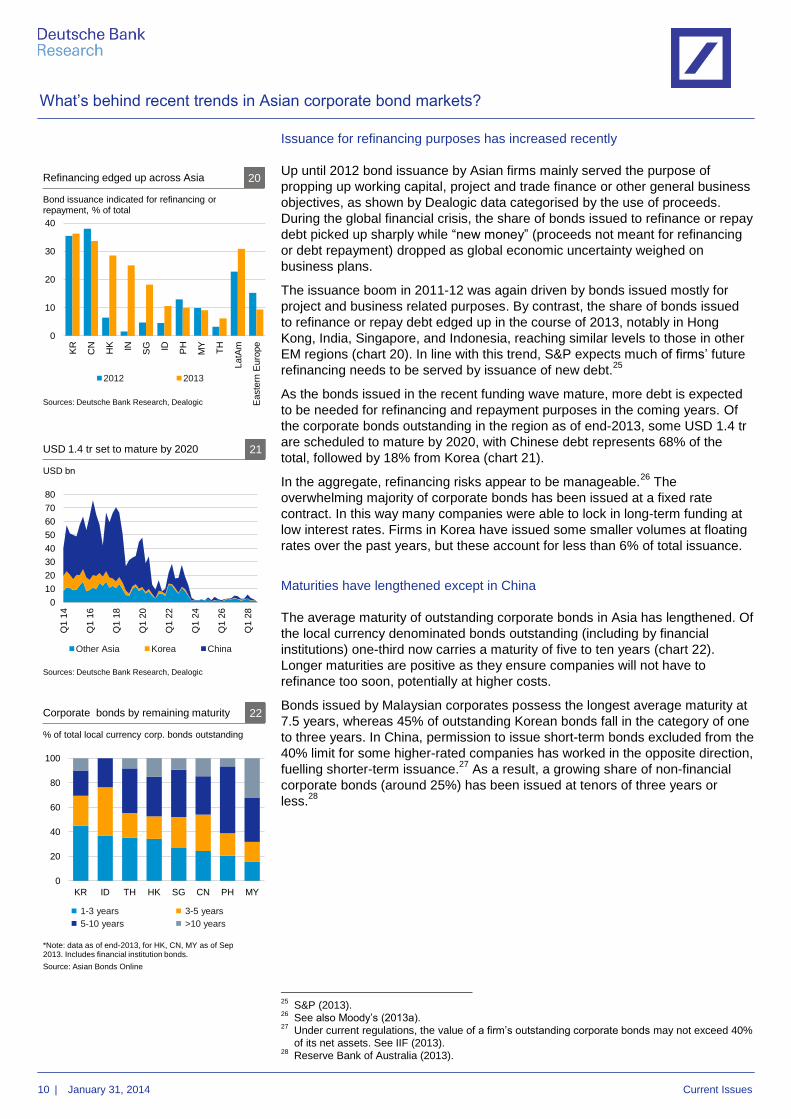
Issuance for refinancing purposes has increased recently
Up until 2012 bond issuance by Asian firms mainly served the purpose of
propping up working capital, project and trade finance or other general business
objectives, as shown by Dealogic data categorised by the use of proceeds.
During the global financial crisis, the share of bonds issued to refinance or repay
debt picked up sharply while “new money” (proceeds not meant for refinancing
or debt repayment) dropped as global economic uncertainty weighed on
business plans.
The issuance boom in 2011-12 was again driven by bonds issued mostly for
project and business related purposes. By contrast, the share of bonds issued
to refinance or repay debt edged up in the course of 2013, notably in Hong
Kong, India, Singapore, and Indonesia, reaching similar levels to those in other
EM regions (chart 20). In line with this trend, S&P expects much of firms’ future
refinancing needs to be served by issuance of new debt.25
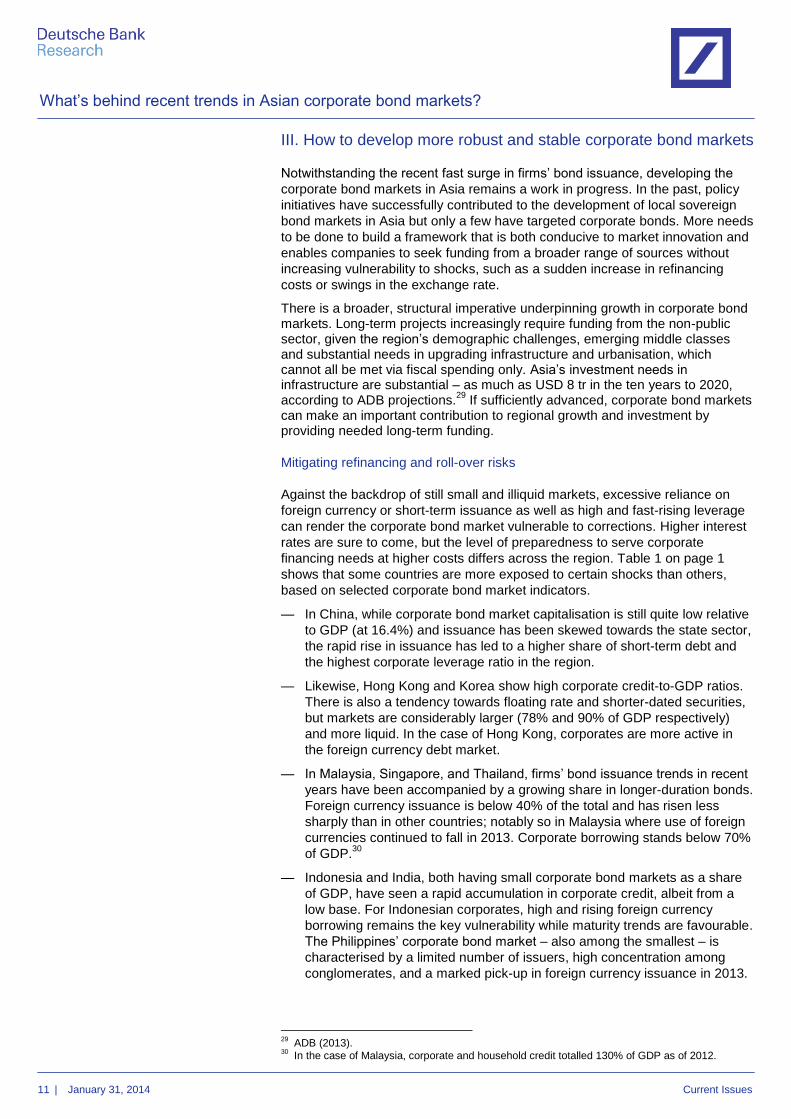
As the bonds issued in the recent funding wave mature, more debt is expected
to be needed for refinancing and repayment purposes in the coming years. Of
the corporate bonds outstanding in the region as of end-2013, some USD 1.4 tr
are scheduled to mature by 2020, with Chinese debt represents 68% of the
total, followed by 18% from Korea (chart 21).
In the aggregate, refinancing risks appear to be manageable.26
The
overwhelming majority of corporate bonds has been issued at a fixed rate
contract. In this way many companies were able to lock in long-term funding at
low interest rates. Firms in Korea have issued some smaller volumes at floating
rates over the past years, but these account for less than 6% of total issuance.
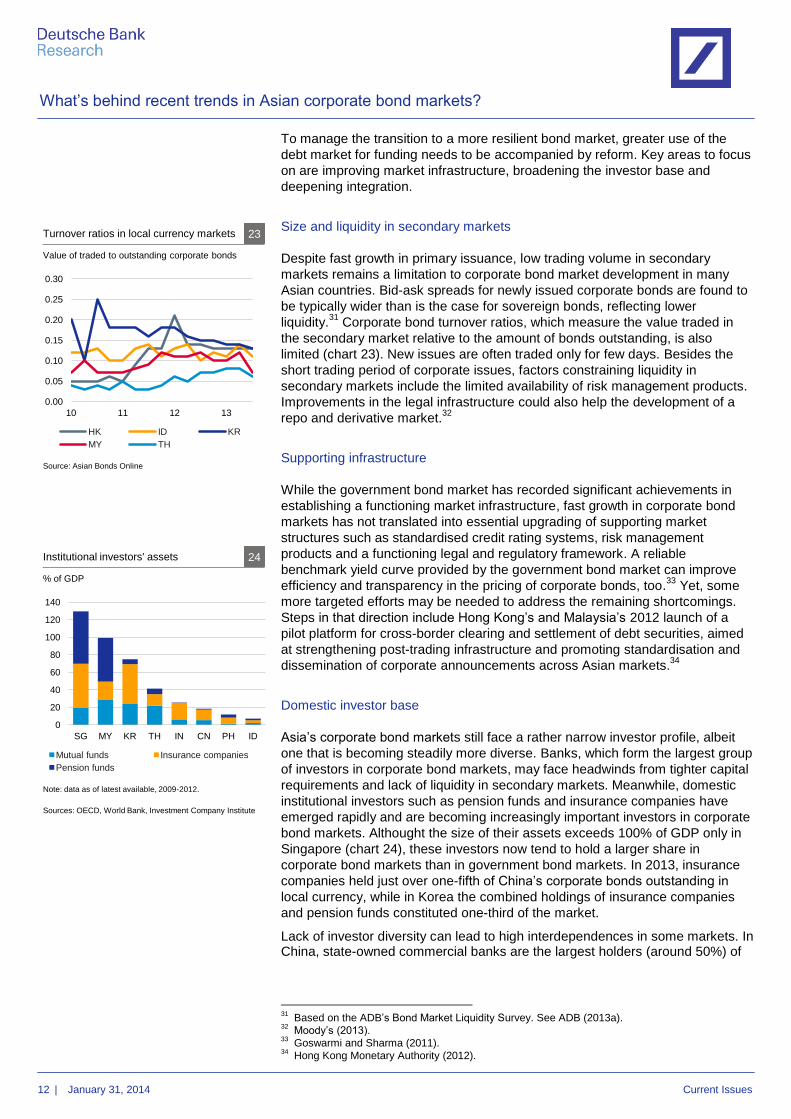
Maturities have lengthened except in China
The average maturity of outstanding corporate bonds in Asia has lengthened. Of
the local currency denominated bonds outstanding (including by financial
institutions) one-third now carries a maturity of five to ten years (chart 22).
Longer maturities are positive as they ensure companies will not have to
refinance too soon, potentially at higher costs.
Bonds issued by Malaysian corporates possess the longest average maturity at
7.5 years, whereas 45% of outstanding Korean bonds fall in the category of one
to three years. In China, permission to issue short-term bonds excluded from the
40% limit for some higher-rated companies has worked in the opposite direction,
fuelling shorter-term issuance.27
As a result, a growing share of non-financial
corporate bonds (around 25%) has been issued at tenors of three years or
less.28
25
S&P (2013). 26
See also Moody’s (2013a). 27
Under current regulations, the value of a firm’s outstanding corporate bonds may not exceed 40%
of its net assets. See IIF (2013). 28
Reserve Bank of Australia (2013).
0
10
20
30
40
KR
CN
HK
IN
SG
ID
PH
MY
TH
LatA
m
Easte
rn E
uro
pe
2012 2013
Refinancing edged up across Asia 20
Sources: Deutsche Bank Research, Dealogic
Bond issuance indicated for refinancing or repayment, % of total
0
10
20
30
40
50
60
70
80
Q1 1
4
Q1 1
6
Q1 1
8
Q1 2
0
Q1 2
2
Q1 2
4
Q1 2
6
Q1 2
8
Other Asia Korea China
USD bn
USD 1.4 tr set to mature by 2020 21
Sources: Deutsche Bank Research, Dealogic
0
20
40
60
80
100
KR ID TH HK SG CN PH MY
1-3 years 3-5 years
5-10 years >10 years
Corporate bonds by remaining maturity 22
% of total local currency corp. bonds outstanding
Source: Asian Bonds Online
*Note: data as of end-2013, for HK, CN, MY as of Sep 2013. Includes financial institution bonds.
What’s behind recent trends in Asian corporate bond markets?
11 | January 31, 2014 Current Issues
III. How to develop more robust and stable corporate bond markets
Notwithstanding the recent fast surge in firms’ bond issuance, developing the
corporate bond markets in Asia remains a work in progress. In the past, policy
initiatives have successfully contributed to the development of local sovereign
bond markets in Asia but only a few have targeted corporate bonds. More needs
to be done to build a framework that is both conducive to market innovation and
enables companies to seek funding from a broader range of sources without
increasing vulnerability to shocks, such as a sudden increase in refinancing
costs or swings in the exchange rate.
There is a broader, structural imperative underpinning growth in corporate bond markets. Long-term projects increasingly require funding from the non-public sector, given the region’s demographic challenges, emerging middle classes and substantial needs in upgrading infrastructure and urbanisation, which cannot all be met via fiscal spending only. Asia’s investment needs in infrastructure are substantial – as much as USD 8 tr in the ten years to 2020, according to ADB projections.
29 If sufficiently advanced, corporate bond markets
can make an important contribution to regional growth and investment by providing needed long-term funding.
Mitigating refinancing and roll-over risks
Against the backdrop of still small and illiquid markets, excessive reliance on
foreign currency or short-term issuance as well as high and fast-rising leverage
can render the corporate bond market vulnerable to corrections. Higher interest
rates are sure to come, but the level of preparedness to serve corporate
financing needs at higher costs differs across the region. Table 1 on page 1
shows that some countries are more exposed to certain shocks than others,
based on selected corporate bond market indicators.
— In China, while corporate bond market capitalisation is still quite low relative
to GDP (at 16.4%) and issuance has been skewed towards the state sector,
the rapid rise in issuance has led to a higher share of short-term debt and
the highest corporate leverage ratio in the region.
— Likewise, Hong Kong and Korea show high corporate credit-to-GDP ratios.
There is also a tendency towards floating rate and shorter-dated securities,
but markets are considerably larger (78% and 90% of GDP respectively)
and more liquid. In the case of Hong Kong, corporates are more active in
the foreign currency debt market.
— In Malaysia, Singapore, and Thailand, firms’ bond issuance trends in recent
years have been accompanied by a growing share in longer-duration bonds.
Foreign currency issuance is below 40% of the total and has risen less
sharply than in other countries; notably so in Malaysia where use of foreign
currencies continued to fall in 2013. Corporate borrowing stands below 70%
of GDP.30
— Indonesia and India, both having small corporate bond markets as a share
of GDP, have seen a rapid accumulation in corporate credit, albeit from a
low base. For Indonesian corporates, high and rising foreign currency
borrowing remains the key vulnerability while maturity trends are favourable.
The Philippines’ corporate bond market – also among the smallest – is
characterised by a limited number of issuers, high concentration among
conglomerates, and a marked pick-up in foreign currency issuance in 2013.
29
ADB (2013). 30
In the case of Malaysia, corporate and household credit totalled 130% of GDP as of 2012.
What’s behind recent trends in Asian corporate bond markets?
12 | January 31, 2014 Current Issues
To manage the transition to a more resilient bond market, greater use of the
debt market for funding needs to be accompanied by reform. Key areas to focus
on are improving market infrastructure, broadening the investor base and
deepening integration.
Size and liquidity in secondary markets
Despite fast growth in primary issuance, low trading volume in secondary
markets remains a limitation to corporate bond market development in many
Asian countries. Bid-ask spreads for newly issued corporate bonds are found to
be typically wider than is the case for sovereign bonds, reflecting lower
liquidity.31
Corporate bond turnover ratios, which measure the value traded in
the secondary market relative to the amount of bonds outstanding, is also
limited (chart 23). New issues are often traded only for few days. Besides the
short trading period of corporate issues, factors constraining liquidity in
secondary markets include the limited availability of risk management products.
Improvements in the legal infrastructure could also help the development of a
repo and derivative market.32
Supporting infrastructure
While the government bond market has recorded significant achievements in
establishing a functioning market infrastructure, fast growth in corporate bond
markets has not translated into essential upgrading of supporting market
structures such as standardised credit rating systems, risk management
products and a functioning legal and regulatory framework. A reliable
benchmark yield curve provided by the government bond market can improve
efficiency and transparency in the pricing of corporate bonds, too.33
Yet, some
more targeted efforts may be needed to address the remaining shortcomings.
Steps in that direction include Hong Kong’s and Malaysia’s 2012 launch of a
pilot platform for cross-border clearing and settlement of debt securities, aimed
at strengthening post-trading infrastructure and promoting standardisation and
dissemination of corporate announcements across Asian markets.34
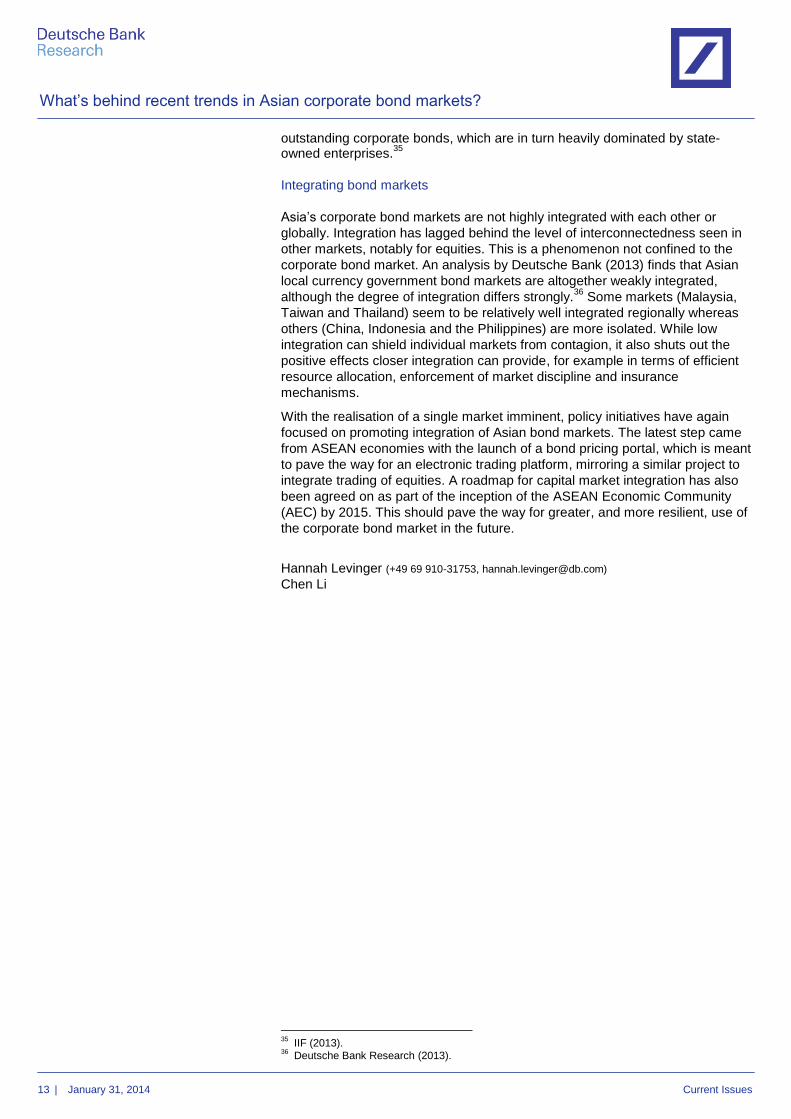
Domestic investor base
Asia’s corporate bond markets still face a rather narrow investor profile, albeit
one that is becoming steadily more diverse. Banks, which form the largest group
of investors in corporate bond markets, may face headwinds from tighter capital
requirements and lack of liquidity in secondary markets. Meanwhile, domestic
institutional investors such as pension funds and insurance companies have
emerged rapidly and are becoming increasingly important investors in corporate
bond markets. Althought the size of their assets exceeds 100% of GDP only in
Singapore (chart 24), these investors now tend to hold a larger share in
corporate bond markets than in government bond markets. In 2013, insurance
companies held just over one-fifth of China’s corporate bonds outstanding in
local currency, while in Korea the combined holdings of insurance companies
and pension funds constituted one-third of the market.
Lack of investor diversity can lead to high interdependences in some markets. In China, state-owned commercial banks are the largest holders (around 50%) of
31
Based on the ADB’s Bond Market Liquidity Survey. See ADB (2013a). 32
Moody’s (2013). 33
Goswarmi and Sharma (2011). 34
Hong Kong Monetary Authority (2012).
0.00
0.05
0.10
0.15
0.20
0.25
0.30
10 11 12 13
HK ID KR
MY TH
Turnover ratios in local currency markets 23
Value of traded to outstanding corporate bonds
Source: Asian Bonds Online
0
20
40
60
80
100
120
140
SG MY KR TH IN CN PH ID
Mutual funds Insurance companies
Pension funds
Institutional investors' assets 24
% of GDP
Sources: OECD, World Bank, Investment Company Institute
Note: data as of latest available, 2009-2012.
What’s behind recent trends in Asian corporate bond markets?
13 | January 31, 2014 Current Issues
outstanding corporate bonds, which are in turn heavily dominated by state-owned enterprises.
35
Integrating bond markets
Asia’s corporate bond markets are not highly integrated with each other or
globally. Integration has lagged behind the level of interconnectedness seen in
other markets, notably for equities. This is a phenomenon not confined to the
corporate bond market. An analysis by Deutsche Bank (2013) finds that Asian
local currency government bond markets are altogether weakly integrated,
although the degree of integration differs strongly.36
Some markets (Malaysia,
Taiwan and Thailand) seem to be relatively well integrated regionally whereas
others (China, Indonesia and the Philippines) are more isolated. While low
integration can shield individual markets from contagion, it also shuts out the
positive effects closer integration can provide, for example in terms of efficient
resource allocation, enforcement of market discipline and insurance
mechanisms.
With the realisation of a single market imminent, policy initiatives have again
focused on promoting integration of Asian bond markets. The latest step came
from ASEAN economies with the launch of a bond pricing portal, which is meant
to pave the way for an electronic trading platform, mirroring a similar project to
integrate trading of equities. A roadmap for capital market integration has also
been agreed on as part of the inception of the ASEAN Economic Community
(AEC) by 2015. This should pave the way for greater, and more resilient, use of
the corporate bond market in the future.
Hannah Levinger (+49 69 910-31753, [email protected])
Chen Li
35
IIF (2013). 36
Deutsche Bank Research (2013).
What’s behind recent trends in Asian corporate bond markets?
14 | January 31, 2014 Current Issues
References
ADB (2012). ASEAN+3 Bond Market Guide. Asian Development Bank.
ADB (2013,a). Asia Bond Monitor (Sep, Nov). Asian Development Bank.
Aiyar, Shekhar, and Sonali Jain-Chandra (2011). The Domestic Credit Supply
Response to International Bank Deleveraging: Is Asia Different. IMF Working
Paper 12/258.
Chan, Eric, Michael Chui, Frank Packer, Eli Remolona (2012). Local currency
bond markets and the Asian Bond Fund 2 initiative. BIS papers No 63.
China Securities Regulatory Commission (2013). CSRC Vice Chairman Jiang
Yang speaks at the 2013 CCTV Summit of Chinese Listed Companies.
www.csrc.gov.cn/pub/csrc_en/Informations/phgall/201309/t20130926_23542
5.htm
Deutsche Bank Research (2013a). Chinese Banks – Well prepared to embrace
the new regulatory landscape. Policy Update. October 2013.
Deutsche Bank Research (2013). Asian bond market or markets? Global
Economic Perspectives.
Feyen, Erik, and Inés González del Mazo (2013). European bank deleveraging
and global credit conditions: implications of a multi-year process on long-
term finance and beyond. World Bank policy research paper.
G-20 and World Bank DEC Prospects Group (2013). Trends in long-term cross-
border debt financing to developing countries.
www.g20russia.ru/load/781245803
Goswarmi, Mangal, and Sunil Sharma (2011). The Development of Local Debt
Markets in Asia. IMF Working Paper No 132/11.
Hong Kong Monetary Authority (2012). Pilot Platform for Cross-border
settlement of debt securities. Quarterly Bulletin. June 2012.
Hong Kong Monetary Authority (2013). The Hong Kong debt market in 2012.
Quarterly Bulletin. March 2013.
IIF (2013). China: The nascent bond market. Institute of International Finance
Research Note.
IMF (2013). Global Financial Stability Report. Old Risks New Challenges. April
2013.
IMF (2013a). Regional Economic Outlook Shifting Risks. New Foundations for
Growth. April 2013.
IMF (2013b). Art. IV consultation People’s Republic of China. IMF Country
Report No. 13/211.
McKinsey (2013). Between deluge and drought. Liquidity and funding for Asian
banks. Mc Kinsey Working Papers on Risk No 45.
Meyer, Thomas, and Orcun Kaya (2013). Corporate bond issuance in Europe –
Where do we stand and where are we heading? EU Monitor Global financial
markets, Deutsche Bank Research.
Mizen, Paul, and Serafeim Tsoukas (2013). What promotes greater use of the
corporate bond market? A study of the issuance behavior of firms in Asia.
Oxford Economic Papers.
Mizen, Paul, Frank Packer, Eli Remolona, Serafeim Tsoukas (2012). Why do
firms issue abroad. BIS Working Paper No. 401.
What’s behind recent trends in Asian corporate bond markets?
15 | January 31, 2014 Current Issues
Moody’s (2013). The next phase of bond market development. Special
comment. October 2013.
Moody’s (2013a). Corporates should be able to refinance. Special comment.
December 2013.
Munro, Anella, and Philip Wooldridge (2010). Motivations for swap-covered
borrowing and foreign-currency borrowing, in the international financial crisis
and policy challenges in Asia and the Pacific. BIS Papers No 2.
Reserve Bank of Australia (2013). East Asian Corporate Bond Markets.
Quarterly Bulletin September 2013.
Reserve Bank of India (2012). Special address delivered by Shri Harun R Khan
at FICCI’s 9th Annual Conference on Capital Markets: “Developing Indian
Capital Markets – The Way Forward” on October 12, 2012 in Mumbai.
S&P (2013). Emerging Markets Refinancing Study. Credit Trends. June 2013.
Shim, Ilhyock (2012). Development of Asia-Pacific corporate bond and
securitisation markets”. BIS papers No 63.
Tagaki, Shinji (2002). Fostering capital markets in a bank-based financial
system. Asian Development Review, vol. 19, no. 1, pp. 67-97.
Turner, Philip (2012). Weathering financial crises: domestic bond markets in the
EMEs. BIS papers No 63.
Vietnam News. Credit rating shortfalls hold back bond market.
Emerging markets publications
Our publications can be accessed, free of
charge, on our website www.dbresearch.com
You can also register there to receive our
publications regularly by E-mail.
Ordering address for the print version:
Deutsche Bank Research
Marketing
60262 Frankfurt am Main
Fax: +49 69 910-31877
E-mail: [email protected]
Available faster by E-mail: [email protected]
Central & Eastern Europe Credit Monitor:
2014 a better year for GDP, less so for credit......... December 18, 2013
Central & Eastern Europe Credit Monitor
Capital markets in Sub-Saharan Africa ......................... October 7, 2013
Research Briefing
CIS frontier countries:
Economic and political prospects ...................................... July 16, 2013
Current Issues
Sub-Saharan Africa: A bright spot
in spite of key challenges .................................................. July 15, 2013
Current Issues
Croatia facing challenges on the EU’s doorstep .............. June 18, 2013
Research Briefing
ASEAN Economic Community (AEC):
A potential game changer for ASEAN countries .............. June 14, 2013
Current Issues
German industry:
China market growing moderately .................................... April 10, 2013
Research Briefing
Emerging markets:
Who is vulnerable to overheating? ................................. March 12, 2013
Research Briefing
© Copyright 2014. Deutsche Bank AG, Deutsche Bank Research, 60262 Frankfurt am Main, Germany. All rights reserved. When quoting please cite
“Deutsche Bank Research”.
The above information does not constitute the provision of investment, legal or tax advice. Any views expressed reflect the current views of the author,
which do not necessarily correspond to the opinions of Deutsche Bank AG or its affiliates. Opinions expressed may change without notice. Opinions
expressed may differ from views set out in other documents, including research, published by Deutsche Bank. The above information is provided for
informational purposes only and without any obligation, whether contractual or otherwise. No warranty or representation is made as to the correctness,
completeness and accuracy of the information given or the assessments made.
In Germany this information is approved and/or communicated by Deutsche Bank AG Frankfurt, authorised by Bundesanstalt für Finanzdienst-
leistungsaufsicht. In the United Kingdom this information is approved and/or communicated by Deutsche Bank AG London, a member of the London
Stock Exchange regulated by the Financial Services Authority for the conduct of investment business in the UK. This information is distributed in Hong
Kong by Deutsche Bank AG, Hong Kong Branch, in Korea by Deutsche Securities Korea Co. and in Singapore by Deutsche Bank AG, Singapore
Branch. In Japan this information is approved and/or distributed by Deutsche Securities Limited, Tokyo Branch. In Australia, retail clients should obtain a
copy of a Product Disclosure Statement (PDS) relating to any financial product referred to in this report and consider the PDS before making any
decision about whether to acquire the product. Printed by: HST Offsetdruck Schadt & Tetzlaff GbR, Dieburg
Print: ISSN 1612-314X / Internet/E-Mail: ISSN 1612-3158


