
Penelope Beynon, Christelle Chapoy, Marie Gaarder and Edoardo Masset
August 2012
What Difference does a Policy Brief Make?
IDS_Master Logo

What Difference does a Policy Brief Make?
Penelope Beynon, Christelle Chapoy, Marie Gaarder and Edoardo Masset
August 2012

2 What Difference does a Policy Brief Make? Full Report of an IDS, 3ie, Norad study Beynon, P.; Chapoy, C.; Gaarder, M. and Masset, E.
What difference does a policy brief make?
Penelope Beynon, Christelle Chapoy, Marie Gaarder and Edoardo Masset
First published by the Institute of Development Studies the International Initiative for Impact Evaluation
(3ie) in June 2012
© Institute of Development Studies and the International Initiative for Impact Evaluation (3ie) 2012
All rights reserved.
Reproduction, copy, transmission, or translation of any part of this publication may be made only under
the following conditions:
• with the prior permission of the publisher; or
• with a licence from the Copyright Licensing Agency Ltd., 90 Tottenham Court Road, London W1P
9HE, UK,
or from another national licensing agency; or
• under the terms set out below.
This publication is copyright, but may be reproduced by any method without fee for teaching or non-
profit purposes, but not for resale. Formal permission is required for all such uses, but normally will be
granted immediately. For copying in any other circumstances, or for re-use in other publications, or for
translation or adaptation, prior written permission must be obtained from the publisher and a fee may
be payable.
This research was funded by the International Initiative for Impact Evaluation (3ie)
The views expressed in this publication are those of the authors, and do not necessarily represent the
views of the Institute of Development Studies (IDS), or 3ie or DFID. The publishers have made every
effort to ensure, but do not guarantee, the accuracy of the information within this publication. IDS is a
charitable company limited by guarantee and registered in England (No. 877338).

3 What Difference does a Policy Brief Make? Full Report of an IDS, 3ie, Norad study Beynon, P.; Chapoy, C.; Gaarder, M. and Masset, E.
Summary Research has potential to improve the lives of the world’s vulnerable people if it is appropriately
referred to in decision-making processes. While there is a significant industry of activity each year to
communicate research findings, little systematic research has tested or compared the effectiveness
of such efforts either for changing beliefs or for prompting action. Using a randomised control design,
this study explored the effectiveness of one popular research communication tool, a policy brief, and
queried whether different versions of a brief bring about different results. We find that the policy brief
had little effect on changing the beliefs of readers who held strong prior beliefs on entering the study,
but had some potential to create evidence-accurate beliefs among readers holding no prior beliefs.
Also, when it comes to beliefs, the impact of the policy brief seems to be independent of the specific
form of the policy brief. However, different versions of the brief (versions that include a research
Opinion with or without a suggestion that the opinion is from an Authoritative source) do achieve
different results when it comes to prompting actions. We find that other factors internal and external
to the brief (gender of the reader, reader’s self-perceived level of influence and the extent to which
the reader feels ‘convinced’ by the brief) are also linked to action. This first-of-its-kind study has
implications for how research communication experts design policy briefs, how they understand and
enable readers to act as knowledge brokers in their particular environment, and how we evaluate
research communication going forward.
Keywords: Research communication, RCT, randomised control trial, policy brief, beliefs, actions
Authors
Penelope Beynon is an independent M&E Advisor, with a particular interest in embedding
organisational learning systems and facilitating frontline-led change. Penelope believes that people
learn best when they identify issues and solutions themselves, and during her time as M&E Advisor
in IDS’ Impact and Learning Team she put this belief to the test developing a Facilitated Self
Evaluation approach that takes a non-expert project team through a robust evaluation of their own
work. She has undertaken research and evaluation focused on a range of social policy issues;
including labour market policy, pensions policy reform, research communication for international
development and a range of child-focused services.
4 What Difference does a Policy Brief Make? Full Report of an IDS, 3ie, Norad study Beynon, P.; Chapoy, C.; Gaarder, M. and Masset, E.
Christelle Chapoy leads on 3ie’s advocacy and policy influence services. Christelle has worked in
the field of communications for development for over 10 years with the United Nations Development
Programme in New York, London, Cambodia and in its Bangkok Regional Centre, and managed the
advocacy and communications project of Oxfam's largest humanitarian programme in Aceh. Prior to
joining 3ie, she was consulting with the leading publishing company Random House in India and the
Indian Ministry of Rural Development. She holds an MA in International Peace and Security from
King’s College London and a Master in political sciences from l’Institut d’Etudes Politiques d’Aix-en-
Provence, France.
Marie Gaarder is the Director of the Evaluation Department in the Norwegian Agency for
Development Cooperation (NORAD). Prior to joining NORAD she was the Deputy Executive Director
of the International Initiative for Impact Evaluation, 3ie, and a Senior Social Development Economist
at the Inter-American Development Bank. Marie holds a Ph.D. in Economics from University College
London. Her publications range a number of areas, including environmental health, conditional and
unconditional cash transfer programs, the institutionalization of government evaluation, and the use
of evidence in decision-making.
Edoardo Masset is an agricultural and development economist with over ten years of experience in
international development in Asia, Africa and Latin America. He has extensive experience in
designing and conducting impact evaluations of development interventions. He has excellent
statistical and econometric research skills, and considerable experience in managing local economic
development programmes in Honduras and Mongolia.

5 What Difference does a Policy Brief Make? Full Report of an IDS, 3ie, Norad study Beynon, P.; Chapoy, C.; Gaarder, M. and Masset, E.
Contents Summary, keywords, author notes
Acknowledgements
Acronyms
1 Introduction 1.1 Why does research communication matter?
1.2 A simple theory of change for a policy brief
1.3 Reader characteristics that could affect results
2 Methods 2.1 Developing the treatments
2.2 Identifying the study population and sample
2.3 Random allocation to treatment groups
2.4 Administering the treatment
2.5 Data collection tools
2.6 Attrition
2.7 Data analysis
2.8 Study limitations
2.9 Lessons from the study design
3 Results 3.1 What impact did the policy brief intervention have on readers’ beliefs?
3.2 What impact did the policy brief intervention have on readers’ intentions to act?
3.3 What impact did the policy brief intervention have on readers’ completed actions?
4 Discussion 4.1 Weak overall effect on beliefs, but a tendency to share
4.2 The Authority and Opinion effects influence behaviour more so than beliefs
4.3 Gender effect – why are women less likely to act?
4.4 Self-perceived influence effect
5 Conclusions Appendix 1 Round one qualitative interviews Appendix 2 Round two qualitative interviews
Background and purpose
Methods

6 What Difference does a Policy Brief Make? Full Report of an IDS, 3ie, Norad study Beynon, P.; Chapoy, C.; Gaarder, M. and Masset, E.
Findings
Interview schedules
Appendix 3 Persistence of change in beliefs Appendix 4 Further qualitative analysis References

7 What Difference does a Policy Brief Make? Full Report of an IDS, 3ie, Norad study Beynon, P.; Chapoy, C.; Gaarder, M. and Masset, E.
Tables Table 2.1 Comparison of means for the four groups at baseline
Table 3.1 Transition matrices showing beliefs about the strength of evidence for
bio-fortification and home gardens (average ratings in the cells) (DK = don’t know, K
= an opinion is stated)
Table 3.2 Transition matrices showing beliefs about the effectiveness of bio-fortification and
home gardens (average ratings in the cells) (DK = don’t know, K = an opinion is
stated)
Table 3.3 Attrition rates across the control and treatment groups, and across the four surveys
Table 3.4 Differences in prior beliefs between attritors and people who stay in the study at
immediate follow-up and 3-month follow-up
Table 3.5 Determinants of attrition
Table 3.6 Differential attrition determinants
Table 3.7 Difference in mean ratings of the intervention and placebo policy briefs
Table 3.8 Difference in difference between baseline and immediate follow-up survey
Table 3.9 Difference in difference between baseline and immediate follow-up survey
Table 3.10 Difference in difference between baseline and immediate follow-up survey
Table 3.11 Changes in belief for different policy brief treatments
Table 3.12 Respondents’ ratings of the policy brief by prior beliefs
Table 3.13 Mean rating of the intended follow-up actions (1 is no intended follow-up actions, 2 is
a maybe, and 3 is an expressed intention)
Table 3.14 Mean rating of the intended follow-up actions in treatment versus control
Table 3.15 Intended actions at immediate follow-up
Table 3.16 Mean rating of the follow-up actions in treatment versus control (1-week follow-up
survey)
Table 3.17 Proportion of respondents carrying out the intended actions
Table 3.18 Actions at 1 week follow-up
Table 3.19 Actions at 3 months’ follow-up
Table 3.20 Who found the policy brief convincing?
Table 3.21 Expected results of actions for respondents with different features
Table 3.22 Expected results of actions for respondents who carried out those actions
Table A1.1 Round 1 qualitative interviews
Table A2.1 Interview framework
Table A3.1 Difference in difference over four survey rounds with fixed effects
Table A3.2 Difference in difference over four survey rounds with fixed effects
Table A4.1 Frequency of key messages identified

8 What Difference does a Policy Brief Make? Full Report of an IDS, 3ie, Norad study Beynon, P.; Chapoy, C.; Gaarder, M. and Masset, E.
Table A4.2 Detailed breakdown of key messages identified by respondents
Boxes Box 2.1 A policy brief summarising findings of a systematic review
Box 3.1 Intended and actual actions explored through the survey
Figures Figure 1.1 A simple theory of change for evidence-based policy and practice
Figure 1.2 A simple theory of change for evidence-based policy and practice
Figure 2.1 Data collection points and methods
Figure 2.2 Standardised minimum detectable difference and sample size
Figure 3.1 Survey questions to capture beliefs
Figure 3.2 Proportion of respondents reporting a belief regarding strength of evidence for bio-
fortification and home gardens before and after intervention (DK = don’t know, K = an
opinion is stated)
Figure 3.3 Proportion of respondents reporting particular beliefs regarding the strength of
evidence for bio-fortification and home gardens before and after intervention
Figure 3.4 Proportion of respondents reporting a belief regarding the effectiveness for bio-
fortification and home gardens before and after intervention (DK = don’t know, K = an
opinion is stated)
Figure 3.5 Proportion of respondents reporting particular beliefs regarding the effectiveness of
bio-fortification and home gardens before and after intervention
Figure 4.1 Shortcuts through the simple theory of change

9 What Difference does a Policy Brief Make? Full Report of an IDS, 3ie, Norad study Beynon, P.; Chapoy, C.; Gaarder, M. and Masset, E.
Acknowledgements The authors are grateful to the following people for their various contributions to this study: Lawrence
Haddad, Howard White and Emilomo Ogbe, Ammar Rashid, Hugh Waddington and Louise Daniel,
Alan Stanley, Martin Greeley and Clare Gorman.

10 What Difference does a Policy Brief Make? Full Report of an IDS, 3ie, Norad study Beynon, P.; Chapoy, C.; Gaarder, M. and Masset, E.
Acronyms C4D Communication for Development
CATI Computer Assisted Telephone Interviewing
CCT conditional cash transfers
DD Difference in difference
DRM Disaster Risk Management
EBPDN Evidence-Based Policy in Development Network
IDRC International Development Research Centre
IFPRI International Food Policy Research Institute
KM4Dev Knowledge Management for Development
M & E Monitoring and Evaluation
MDG Millennium Development Goal
ODI Overseas Development Institute
RAPID Research and Policy in Development
RCT Randomised Controlled Trial
SciDev.Net Science and Development Network
SR Systematic reviews
UCT Unconditional cash transfers
UNICEF United Nations Children’s Fund
WFP World Food Programme
vif variance inflation factors
WHO World Health Organization

11 What Difference does a Policy Brief Make? Full Report of an IDS, 3ie, Norad study Beynon, P.; Chapoy, C.; Gaarder, M. and Masset, E.
1 Introduction 1.1 Why does research communication matter?
A large number of development conferences and a growing body of research and blogs are
dedicated to the mission of increasing use of research evidence in policymaking processes. Why?
The obvious answer is that policies, a broad term used for decisions that affect a significant number
of people’s lives, do affect a significant number of people’s lives, or at least they have the potential
to. Hence, we are interested in the decisions being as ‘good’ as possible. And we think ‘good’
decisions are achieved when they are informed by ‘evidence’ that show that these policies ‘work’;
that the decision chosen is the best available option given the set of outcomes it is designed to
achieve. While this line of argument should be timeless, the topic of evidence-based and evidence-
informed policies has gained new momentum over the last decade with the heightened focus on the
results agenda, aid quality, and development effectiveness, captured in the Paris and Busan
declarations. A mixture of aid fatigue and financial crises have increased the emphasis on ensuring
good returns for the investment of scarce public funds, and the constant improvements in the tools
and methods for measuring results is probably an adequate summary of what brought about this
evidence-revolution. Research provides one form of evidence in the evidence-revolution,1 and a key
question for those of us working in research institutions, is how best can we communicate research
so that it informs relevant policies and practice?
It has frequently been pointed out that policy influence rather than being a linear process is likely to be
complex, with feedback loops and two-way processes between research, policy and practice (ODI
2004; Walt 1994). ‘Searching for a direct connection between one masterpiece of scientific discovery
and policy is to misunderstand the nature of the policy environment. New information and knowledge
do percolate through the policy environment and become part of policymakers’ thinking, not in a clear
linear fashion, but in a much more diffuse way….like water falling on limestone’ (Walt 1994: 2). As
pointed out in a report by the WHO, policy change often begins before it is recognised as such. ‘At
every stage of this process – from the generation of knowledge, to its entry into the public discourse, to
the nature of the debate it provokes, to the policy options that are finally identified by decision-makers
over time, to the policy change that finally occurs – interest groups and conflicting coalitions are at
work…..While a robust policy debate may not directly influence governmental decisions, it serves a
critical enlightenment function by gradually altering concepts and assumptions of policy-makers over
1 While what constitutes evidence is subject to much debate and disagreements, we will limit our discussion in this paper to research-based evidence.
12 What Difference does a Policy Brief Make? Full Report of an IDS, 3ie, Norad study Beynon, P.; Chapoy, C.; Gaarder, M. and Masset, E.
time’. (WHO 2002: 10–11). The ODI identifies the relevant question to ask as being ‘Why are some of
the ideas that circulate in the research/policy networks picked up and acted on, while others are
ignored and disappear?’ (ODI 2004: 2). The institute suggests that it is in the interplay between the
political context, the evidence, the links between policy and research communities, and the external
context that the adoption of evidence by policymakers and practitioners is being determined. Walt
(1994) suggests that politics may affect how much notice policymakers take of research results;
‘Where governments are committed to policy on ideological grounds, they may be only secondarily
interested in research findings, especially if these challenge or question the policy impetus, its
ideological basis or authoritative knowledge’. (Walt 1994: 3).
While maximising the influence of development research on public policy and action is admittedly a
challenge in general, in his recent book ‘Knowledge to Policy’ Fred Carden points out how much
harder this is in developing countries due to greater challenges on the governance and
implementation front, greater staff turnover, a lack of demand for research, lack of data, and lack of
intermediary institutions that carry research to policy. (Carden 2009).
Most of the factors that influence research uptake are beyond the control of research
communicators. But one factor that is within their control is the design and dissemination of the
documents they produce for policy audiences. In particular, the design of their policy briefs.
A policy brief is a concise standalone document that prioritises a specific policy issue and presents
the evidence in non-technical and jargon-free language.2 In general, the purpose of a policy brief is
to distil or to synthesise evidence with the intention of influencing the thinking and actions of policy
actors as they take decisions in complex policy processes. That is, to achieve the elusive outcome of
evidence-informed policymaking.3 Many funders require research organisations to produce succinct
summaries of research findings in a ‘user-friendly format’ to ensure that funded research is
disseminated and understood by target audiences. For decades, policy briefs have dominated as the
format of choice for both scholarly and advocacy-based organisations seeking to influence
policymakers. But despite the proliferation of the policy brief,4 very little serious research has been
undertaken to explore their value, both in terms of usage and effect.
2 ‘Policy brief’ has been variously defined by a multitude of authors and institutes, generally in ‘how to’ guidance notes. Guidance is often conflicting (e.g. advice as to whether the brief should be neutral or include opinions), and while most guidance agrees on general principles, no single format has been proven to be best. 3 Policymaking is complex and the discussion of its complexity are well rehearsed elsewhere (See ODI, 2004; Walt, 1994; WHO 2002; Carden, 2009 for examples). We don’t suppose that any researcher or communication expert would propose to bring about evidence-informed policy using a standalone policy brief and no other tools or plan for engagement. 4 A search of the term ‘policy brief’ returned no less than 30 million results in general Google and 2.8 million results in Google Scholar.
13 What Difference does a Policy Brief Make? Full Report of an IDS, 3ie, Norad study Beynon, P.; Chapoy, C.; Gaarder, M. and Masset, E.
The Overseas Development Institute (ODI) and the Science and Development Network (SciDev.Net)
interviewed a sample of policymakers from developing and developed countries and reported that
while 50 per cent of policymakers and 65 per cent of researchers think that dissemination of
research findings is not sufficient to have an impact on policy, 79 per cent do think that policy briefs
are valuable communications tools. Thus justifying the demand for policy briefs, Jones and Walsh go
on to list a number of ‘key ingredients of effective policy briefs’, including two that are of interest to
this study: 1) authority, described as a messenger (individual or organisation) that has credibility in
eyes of policymaker, and 2) opinion, described as presentation of author’s own views about policy
implications of research finding (Jones et al. 2008). The findings of this study have been contested
due to the leading nature of some of the questions that were fielded (ibid), nonetheless they raise
interesting questions about what makes for an effective policy brief, and whether such a thing exists.
A policy community survey commissioned by IDRC’s Thank Tank Initiative and carried out across
Africa, Latin America and Asia, contests the findings from the ODI/SciDev survey and finds policy
briefs to be among the least useful forms of information exchange to support their work in national
policy. The study also shows that informal communications, such as newsletters and online forums,
are considered less useful than user-driven, self-directed information exchanges such as statistical
databanks, online publications and reports. In-person events and advice from individual experts was
also considered more useful than briefs and bulletins (Cottle 2011).
So we see that despite their popularity, the value of policy briefs is disputed. A lesson emerging from
these studies is that policy briefs are useful when policy interest exists, capacity is there to absorb,
timing and context are favourable, the message and conclusions are clear, and when the brief is but
one of the information and exchange tools used. In line with this perspective, some would argue that
a policy brief is never intended to have influence in and of itself but rather as part of a package of
engagement.5 Nonetheless, most organisations do put their policy briefs out on their own and into
the public domain, both electronically and in hard copy, where they can be (and are) read by any
interested actor. While they may be on the periphery of most influencing strategies, these actors are
many and varied and they have potential to be influenced by research communications, and
potential to go on to influence policy and practice processes in under-explored ways.
So, policy briefs remain one of the most commonly used tools by international development
agencies, research institutes and research-to-policy intermediaries. While opinions of their
5 In a recent blog discussion, Enrique Mendizabal describes policy brief use as ‘something one leaves behind after a meeting (or sends in advance). It is what gets forwarded, etc. But does it influence on its own? Certainly not.’ http://onthinktanks.org/2012/03/30/should-think-tanks-write-policy-briefs-what-an-rct-can-tell-us/ (Accessed 30 March 2012).

14 What Difference does a Policy Brief Make? Full Report of an IDS, 3ie, Norad study Beynon, P.; Chapoy, C.; Gaarder, M. and Masset, E.
usefulness diverge, actual experiments on the effectiveness of policy briefs have not previously been
carried out. We decided to do just that – both to shed some light on what makes for an effective
policy brief and to explore whether an experimental design could be used to better understand the
effectiveness of research communication tools.
1.2 A simple theory of change for a policy brief
A simple theory of change for a policy brief is presented in Figure 1.1. It predicts that a policy brief
reaches a reader and prompts him or her to engage with a message; by engaging with the message
readers update their knowledge on a topic and create an evidence-accurate belief; these new or
reinforced beliefs spark an action commensurate with the reader’s role; and depending on the
current opportunity for change, some or all of the reader’s actions will lead to changes in policies
and/or practice within their sphere of influence.6
Figure 1.1 A simple theory of change for evidence-based policy and practice
Figure 1.1 is certainly overly simplistic. Studies of media communication have focused on the
phenomenon that different individuals may receive the same message but act on it quite differently.
Influential studies conducted by Carl Hovland throughout his career (for example, Hovland 1954)
concluded that people are very selective in how they use media; in particular regarding exposure,
interpretation of information, and retention of information obtained through the media. In particular,
three types of selectivity are relevant to our study:
• selective exposure (whereby people seek out not only topics of interest to them but more
importantly viewpoints with which they expect to agree);
6 The piece of evidence does not necessarily entail change, as it could confirm and reinforce an existing attitude or policy, however demonstrating an active selection of the status quo poses a particular challenge to those interested in measuring policy influence activities.
15 What Difference does a Policy Brief Make? Full Report of an IDS, 3ie, Norad study Beynon, P.; Chapoy, C.; Gaarder, M. and Masset, E.
• selective perception (whereby people interpret facts to suit their existing biases), and;
• selective retention (whereby people remember messages that support their opinion longer
than they remember opposing messages).
So what would this mean for our simplified theory of change? Firstly, we cannot assume that when
readers receive a policy brief they automatically engage with the message by reading the brief. It is
far more likely (particularly in this era of information overload) that discerning readers discard a
significant amount of information they receive without ever reading it at all based on quick
judgements informed by a few features that are immediately apparent (e.g. title, source and whether
they find the visual layout pleasing). That is, they exercise selective exposure.
Secondly, selective perception and selective retention theories suggest that reading is not
(necessarily) believing. Depending on the type of priors a reader holds, it may take repeated
evidence before he or she actually updates his/her beliefs to form an evidence-accurate belief, and if
it is a firmly held belief (fundamental prior) it may not lead to any update at all. Indeed, evidence
suggests that when confronted with evidence that undermines a strongly held opinion (a
‘fundamental prior’) people tend to hold their prior belief even more fiercely (Edwards and Smith
1996; Lord et al. 1979). The tendency is to accept evidence that confirms one’s prior opinion at face
value while subjecting ‘disconfirming’ evidence to critical evaluation – the so-called ‘disconfirmation
bias’.7 Furthermore, the idea that attitudes and beliefs on any given subject are readily available in a
‘mental file’ that can be consulted and reported upon in a survey, the so-called file-drawer model
(Wilson and Hodges 1992), has been widely criticised (Tourangeau et al. 2000).8
Finally, some particularly challenging assumptions surround the actions step in our simple theory of
change, i.e. that information which is read, understood, and absorbed will lead to action. It is well
understood that a number of contextual factors will influence a reader’s tendency to translate
information to action, even if they have engaged with and been convinced by a message. So those
readers who do develop an evidence-accurate belief may still fail to act. Alternatively, readers who
don’t update their beliefs (either because they never engaged with the brief or because they
consciously or unconsciously rejected the message) may succeed in taking action. Just as readers
7 ‘To test these assumptions, 48 undergraduates supporting and opposing capital punishment were exposed to two purported studies, one seemingly confirming and one seemingly disconfirming their existing beliefs about the deterrent efficacy of the death penalty. As predicted, both proponents and opponents of capital punishment rated those results and procedures that confirmed their own beliefs to be the more convincing and probative ones, and they reported corresponding shifts in their beliefs as the various results and procedures were presented. The net effect of such evaluations and opinion shifts was the postulated increase in attitude polarisation’ (Lord et al. 1979). 8 ‘The evidence suggests that there are multiple paths to an answer to an attitude question, just as there are multiple routes to placing an event in time or making frequency judgements. Which path is taken in any given instance depends on the accessibility of the necessary information and on strategic considerations, such as the amount of time the respondent takes and his or her motivation to render a defensible judgement.’ (Tourangeau et al. 2000: 178).
16 What Difference does a Policy Brief Make? Full Report of an IDS, 3ie, Norad study Beynon, P.; Chapoy, C.; Gaarder, M. and Masset, E.
make quick decisions about whether or not they will read a brief themselves, they can also make
quick decisions to send the brief on to others within their knowledge network. Likewise, readers who
mistook the message of a brief could still succeed in taking any range of actions based on their
misunderstanding, and those who rejected the message of a brief may be prompted to research
further, for example.
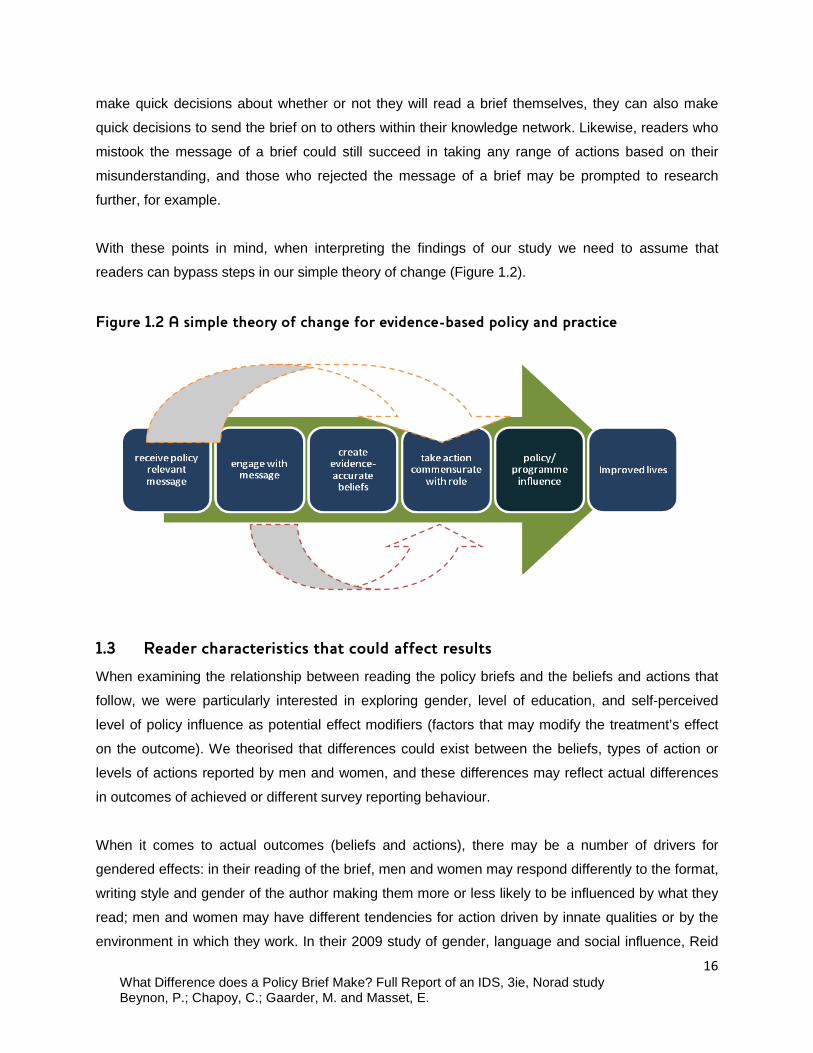
With these points in mind, when interpreting the findings of our study we need to assume that
readers can bypass steps in our simple theory of change (Figure 1.2).
Figure 1.2 A simple theory of change for evidence-based policy and practice
1.3 Reader characteristics that could affect results
When examining the relationship between reading the policy briefs and the beliefs and actions that
follow, we were particularly interested in exploring gender, level of education, and self-perceived
level of policy influence as potential effect modifiers (factors that may modify the treatment’s effect
on the outcome). We theorised that differences could exist between the beliefs, types of action or
levels of actions reported by men and women, and these differences may reflect actual differences
in outcomes of achieved or different survey reporting behaviour.
When it comes to actual outcomes (beliefs and actions), there may be a number of drivers for
gendered effects: in their reading of the brief, men and women may respond differently to the format,
writing style and gender of the author making them more or less likely to be influenced by what they
read; men and women may have different tendencies for action driven by innate qualities or by the
environment in which they work. In their 2009 study of gender, language and social influence, Reid

17 What Difference does a Policy Brief Make? Full Report of an IDS, 3ie, Norad study Beynon, P.; Chapoy, C.; Gaarder, M. and Masset, E.
and colleagues claim that ‘linguistic style, stereotypes and social influence are tightly intertwined’
(Reid et al. 2009: 466) and draw on self-categorisation theory, role congruity theory and expectation
states theory to explain variation in men and women’s responses to a social message presented by
a female reader who was introduced as either female or highly educated. They suggest that a
complex interplay of factors determined by the listener affect men’s and women’s responses to
messages;9 in particular, a) the listeners’ stereotyped expectations (regarding the style of delivery
that is appropriate to gender and message), b) context-based self-positioning (whether the listener
positions themselves alongside the reader or not) and c) context-based other-positioning (whether
the listener identifies gender to be a relevant or irrelevant factor in relation to the topic). Also,
research has found that in group situations information that was introduced by men was six times
more likely to influence the group decision than information introduced by women (Propp 1995; Carli
2001). All of these internal and external factors may have implications for women’s readings of the
brief and choices of follow-up actions.
With regard to survey reporting behaviour, there could be a number of factors influencing gender
differences. For example, education research (Bennett 1996; Furnham and Rawles 1999; Hogan
1978 cited by Mengelkamp and Jager 2007) suggests that girls and women tend to estimate their
performance to be poorer than do boys and men, when comparing similar performances. When
translated into survey response behaviour, this could mean that women would report a lower
intention to carry out follow-up actions.10 Other studies have shown that men’s and women’s self-
reported past behaviours are influenced by their expectations of what is socially acceptable or
socially empowering.11 If men and women perceive different follow-up actions to be either
appropriate or empowering based on their gender and social context (for example, if men perceive
that they gain status by sharing knowledge items with others face-to-face, and if women perceive
that they lose status by sharing knowledge items face-to-face) then when translated into survey
response behaviour, this could mean that men boast higher rates of action and women are overly
modest.
9 Particularly for our study, it may be that male and female readers will respond differently to the tentative nature of the policy brief message, the gender of the author (where known) and the interaction of these two. 10 Studies of gender effects in survey self-reporting show mixed outcomes, with women possibly over-reporting or under-reporting their behaviour compared to men depending on social expectations associated with the topic under scrutiny (e.g. potential under-reporting in surveys of sexual behaviour and potential over-reporting of healthy eating) and the method for data collection (e.g. a survey administered by a gendered interviewer or an electronic CATI survey). 11 For example, Jonason (2007a, b, c, cited by Haavio-Mannila and Roos 2008) gives psychological explanations for men over-reporting sexual behaviour if not otherwise instructed. He suggests that men may gauge their own status by comparing themselves to other men in terms of how many sexual partners they have had. However, it is likely that the nature of men’s and women’s over- or under-reporting in surveys will be influenced by the social expectations associated with the specific topic under scrutiny. We are as yet unclear what the gender-related social expectations are for the range of actions explored in this study, and how they may differ based on cultural context and power/status of the actor. These are interesting areas for further investigation.
18 What Difference does a Policy Brief Make? Full Report of an IDS, 3ie, Norad study Beynon, P.; Chapoy, C.; Gaarder, M. and Masset, E.
The level of education could have a number of (possibly offsetting) effects. While higher levels of
education would tend to imply a higher exposure to, and understanding of, research, it could also
make individuals more critical consumers of research evidence. Furthermore, very high levels of
education such as a having PhD and beyond, would tend to be positively correlated with an
academic position, which arguably would provide little room for any follow-up activities that translate
more directly into policy influence.
A particularly interesting issue is whether people who perceive themselves to have a higher level of
policy influence act in a different manner to others. Do they use different influence channels than
others? Are they perhaps more prone to action in general? Rather than relying on traditional
indicators of policy influence – job title and organisation – we developed a scale for self-reporting
influence in a number of areas for two reasons: 1) we recognise that policy processes are non-linear
and complex involving a number of actors inside and outside government, and 2) anecdotal
evidence suggests that unexpected actors can have significant influence and would not be identified
through job title and organisation. Further work is needed to interrogate the extent to which self-
reported influence correlates with actual influence, or whether this indicator is picking up other traits
such as a high internal locus of control. While this report does explore links between self-rated
degree of influence and impact, the interpretation of this is complicated and should be approached
with caution.

19 What Difference does a Policy Brief Make? Full Report of an IDS, 3ie, Norad study Beynon, P.; Chapoy, C.; Gaarder, M. and Masset, E.
2 Methods In short, the study used a multi-armed randomised controlled design to a) test the effectiveness of a
policy brief overall for changing beliefs and prompting actions compared to a placebo policy brief
delivered to a control group, and b) test whether different versions achieved greater or lesser effects.
2.1 Developing the treatments
In the summer of 2011, 3ie commissioned IDS Knowledge Services to work with them in developing
a policy brief format for their new briefing series Evidence Matters. The first issue of Evidence
Matters summarised a DFID funded systematic review of agriculture interventions that aim to
improve the nutritional status of children.12 Box 2.1 summarises findings of the systematic review,
which is important background for understanding the results of the policy brief study.
Box 2.1 A policy brief summarising findings of a systematic review
Three versions of the brief were developed to act as treatments for the study.
• Treatment 1: a basic 3-page policy brief. Testing for a policy brief effect.
• Treatment 2: the same basic 3-page policy brief as treatment 1, plus an opinion piece
credited to and written by a sector expert, Lawrence Haddad, a co-author of the
systematic review in question. Testing for an Authority effect.
• Treatment 3: the same basic 3-page policy brief and opinion piece as treatment 2, but
the opinion piece was credited to an unnamed research fellow at IDS. Testing for an
opinion effect.
12 Masset et al. (2011).
The policy brief treatments at the heart of this study summarised findings of a DFID funded systematic review conducted by E. Masset, L. Haddad, A. Cornelius and J. Isaza-Castro in 2011. The objective of the systematic review was to assess the effectiveness of food-based agricultural interventions, in particular bio-fortification, home gardens, fisheries, dairy development, and animal husbandry, in improving the nutritional status of children in developing countries. The review finds that food-based agricultural interventions increase the production and consumption of the food promoted, and this leads to higher vitamin A intake (particularly for home garden interventions). However, the overall effects on income and consumption, taking into account the substitution effects in labour supply and consumption, remain unexplored by the existing studies. The review finds little or no impact on the nutritional status of children, but underlines that this finding may be due to the poor statistical power of the included studies and that further studies are required to draw conclusions on nutrition impact.
20 What Difference does a Policy Brief Make? Full Report of an IDS, 3ie, Norad study Beynon, P.; Chapoy, C.; Gaarder, M. and Masset, E.
An existing IDS publication from the In Focus policy briefing series was chosen as a placebo
treatment for the control group. A placebo is a neutral treatment that has no ‘real’ effect on the
dependent variable – in this case for example, on acquired knowledge on the topics covered in the
agricultural brief. The main reason for choosing to include a placebo control was to be able to detect
and control for any Hawthorne or survey effects, the former being an effect that results from the
awareness of being studied,13 rather than from the treatment per se, whereas the latter would be an
effect induced by the fact that the surveyed individuals become more aware of issues raised in the
questionnaire, such as their role in influencing change through follow-up actions. Finally, the placebo
control was also intended to detect any external events beyond our control that might occur during
the study, for example publication of a high profile study related to the knowledge topics in question.
We did not want to alert the placebo control group to their position in the study, and therefore the
specific issue, Priorities for Accelerating Progress on the MDGs (Greeley and Gorman 2010), was
selected because it had a similar format and length to the basic 2-page policy brief for all treatments,
was published fairly recently and dealt with issues that while relevant to agriculture and nutrition did
not specifically focus on these.
2.2 Identifying the study population and sample
A study population of over 75,000 people were emailed directly and invited to take part in the study.
The study population was compiled from several contact lists held by the IDS Knowledge Services
department and 3ie’s own contacts database. Individuals had typically registered to receive one of
three information products provided by IDS’ Knowledge Services programmes: ID21,14 Eldis15 or
BRIDGE.16 In addition, the invitation was circulated through seven communities of practice that have
an interest in research communication, evaluation and impact.17
Apart from the convenience of using existing contact lists, we assumed this study population would
include people from diverse geographic and thematic interest areas; they were likely to be people
who have some level of interest in research evidence and were likely to seek out and read policy
13 In terms of the self-reported actions in the survey, we are not able to distinguish real actions from claimed actions by the individual; however, with the placebo control we should be able to control for both. 14 ID21 produced Insights, a now discontinued research briefing series that provided a thematic overview on issues in international development. At the time of the study, ID21 contributed 17,446 contacts to the study population. 15 Eldis is a searchable portal that provides free access to downloadable research and a number of subscribed to thematic and geographic products such as resource guides and country profiles. At the time of the study, Eldis contributed 50,518 contacts to the study population. 16 BRIDGE is a gender-focused research and information programme that produces resources such as Cutting Edge Packs and In Briefs. At the time of the study, BRIDGE contributed 6,331 contacts to the study population. 17 Research to Action blog, C4D network, EBPDN, 2 Eldis sub-communities (Results-based M&E Group, Manuals-Toolkits Readers’ group), Pelican, Knowledge Brokers Forum blog, KM4Dev.

21 What Difference does a Policy Brief Make? Full Report of an IDS, 3ie, Norad study Beynon, P.; Chapoy, C.; Gaarder, M. and Masset, E.
briefs as part of their usual practice. For example, the Eldis subscriber list (which contributed over
50,500 contacts for the study population) is an aggregated list of all subscribers to the 28 thematic
and regional email newsletters (Eldis Reporters) currently available via the Eldis platform. The
individual lists are of varying ages but many have been in operation for at least ten years. The lists
are primarily used to send regular (usually monthly) email newsletters to subscribers detailing the
latest development research included in that thematic area or regional profile.
Invitees were given just one week18 to complete a baseline survey by way of signing up for the
study. Invitees were advised of two incentives to take part:
• ‘You will be contributing to valuable research that we hope will enhance the policy impact
of all development research.’
• ‘And in addition, every time you complete a feedback questionnaire you will be entered
into the draw to win one of 5 prizes of £100. There are three feedback questionnaires, so
in total, 15 winners will each receive £100. If you win in the first round you can still
complete future questionnaires – so if you are very lucky you could win up to £300.’
A self-selecting sample of 807 people19 responded to our invitation by completing the full baseline
survey before the deadline. The sample is composed of highly educated people, with 60 per cent
holding a masters degree and a further 20 per cent holding a PhD, equally distributed between male
and female. Most participants are working in government and non-government institutions. Twenty
per cent are in academia, while 60 per cent work for international aid organisations or NGOs. Eighty
per cent of participants are aged between 25 and 55. Participants are from high-income countries
based on the World Bank classification in 46 per cent of cases. Seventy-five per cent of the
respondents engage with nutrition and agricultural issues in their work or research.
2.3 Random allocation to treatment groups
The self-selecting sample was randomly allocated to either the control group or one of the three
treatment groups. First, a stratification was performed to increase the precision of the estimates. Eight
strata were generated by crossing three categorisations: a) whether the respondent lives in a high-
income country or a medium to low-income country, b) whether the respondent states that they
18 We made the deadline short for three reasons: 1) we needed to move the project forward quickly if we were to ensure it did not collide with end-of-year holidays 2) we wanted to keep up the momentum with people who signed up and not allow a long lapse between sign-up and intervention 3) our experience shows that most people either respond immediately to this type of contact or not at all (this was borne out in this study also where more than half of our self-selecting sample signed up within 1 day of us sending out the invitation, and two thirds within 2 days). 19 A further 164 surveys were started, but not completed in full, and were hence discarded from the experiment. These were discounted from the eligible sample. One hundred and sixty-four surveys does not represent 164 interested individuals, as many people started more than one survey before completing it in full. Three people submitted more than one complete survey.

22 What Difference does a Policy Brief Make? Full Report of an IDS, 3ie, Norad study Beynon, P.; Chapoy, C.; Gaarder, M. and Masset, E.
conduct research or work in the field of agriculture and nutrition, c) whether the respondent believes
that they have an influence on decisions made by government on agriculture and nutrition made by the
government (self-assessment on a scale from 0 to 10, half of the respondents rated their influence
between 0 and 2 which was used as a cut-off point to create this category). Second, a random number
was generated for each observation drawing from a uniform distribution using the strata software. The
sampling programme was be set in such a way that the random selection can be exactly replicated.
Finally, observations were sorted by the random number within each stratum and observations within
each stratum were sequentially assigned to each of the four groups.
2.4 Administering the treatment
The control and treatment groups were contacted by email and provided with a link to the relevant
communication intervention for their group. Participants were expected to follow the link, download the
pdf document (or open it in their web browser) and read it in full. This was the only intervention
undertaken for the study. All other communication with participants was for the purpose of
administering data collection, awarding prizes or responding to specific queries.
2.5 Data collection tools
The primary data collection instrument for the study consisted of four online questionnaires built
using SurveyMonkey20. The questionnaires were largely quantitative and included both newly
developed question formats and established question formats used by IDS elsewhere (Figure 2.1).
In addition, qualitative interviews were carried out with a purposive sample of participants at two
stages in the study:
Semi-structured telephone interviews were undertaken with 34 participants at two points in time:
• In between the 1-week and 3-month questionnaires. Ten semi-structured interviews to
explore the reasons for the high attrition rate. Further details about the methods and
findings for the round 1 qualitative interviews can be found in Appendix 1.
• After the 3-month follow-up questionnaire. Twenty-four semi-structured interviews to
gather examples of outcomes in four areas that had been hypothesised for the study:
Belief, Behaviour – sharing information, Behaviour – seeking information, Behaviour –
other action. Further details about the methods and findings for the round 2 qualitative
interviews can be found in Appendix 2.
20 SurveyMonkey is a popular online surveying tool – www.surveymonkey.com.

23 What Difference does a Policy Brief Make? Full Report of an IDS, 3ie, Norad study Beynon, P.; Chapoy, C.; Gaarder, M. and Masset, E.
Figure 2.1 Data collection points and methods
1 week before intervention
Baseline survey of beliefs
1 week before intervention
Follow-up survey of immediate changes to beliefs and intentions to act
1 week before intervention
Follow-up survey of short-term changes to beliefs, short-term completed actions and short-term intentions to act Qualitative interviews with a sample of respondents to interrogate drivers for attrition
1 week before intervention
Follow-up survey of longer term changes to beliefs and longer term completed actions Qualitative interviews with a sample of respondents to gather examples of outcomes in four areas hypothesised for the study

24 What Difference does a Policy Brief Make? Full Report of an IDS, 3ie, Norad study Beynon, P.; Chapoy, C.; Gaarder, M. and Masset, E.
2.6 Attrition
Participation in the study decreased considerably over the three follow-up rounds. Only 50 per cent
of the original sample participated in the first follow-up, a further 36 per cent dropped out at the 1-
week follow-up. Finally, a further 11 per cent dropped out before the 3-month follow-up. There could
be a number of reasons for high attrition:
• Time of year – the study fell over the summer months for Northern hemisphere countries,
and we received a lot of out-of-office replies from people taking a summer break. It is
difficult to identify a suitable time for a four-month study with international respondents
that will not prove inconvenient for some.
• Spam and junk mail filters, incorrect email addresses – we suspect that spam and junk
mail filters were preventing some of our emails reaching signed-up participants. This is
likely a common problem for studies conducted online.
• Participant fatigue – four participants notified us that they were intentionally withdrawing
from the study because they found it demanding and repetitive. It is possible others
dropped out for similar reasons and did not advise us of this. Although no such feedback
was gleaned from telephone interviews.
• Participant error, confusion – we suspect that in many cases participants simply ‘missed’
the email about the study in their inbox or assumed that it referred to a survey they had
already completed. This suspicion was reinforced by telephone interviews and
unsolicited emails from several participants claiming they had already completed a
particular questionnaire.
Attrition may also reflect a selection bias, which is discussed below.
2.7 Data analysis
Statistical power is the probability of finding an effect when there is an effect. Statistical power is
irrelevant if a statistical difference is found. But it is relevant if no difference is found because the
reason for not finding the difference could be that the size of the sample used was too small.
Figure 2.2 shows the standardised minimum detectable difference between averages in a project
and control group over total sample size. For example, a comparison between 2 groups of 200
observations each (a total of 400 observations) corresponds to a standardised difference of .3. A
comparison between two groups of 100 observations each corresponds to a standardised difference

25 What Difference does a Policy Brief Make? Full Report of an IDS, 3ie, Norad study Beynon, P.; Chapoy, C.; Gaarder, M. and Masset, E.
of 0.4. This means that a total sample of 200 observations of which half are assigned to the
intervention will able to detect differences equal or above .4 standard deviations. These values are
calculated assuming an alpha of 5 per cent and a power of 80 per cent.
Most baseline outcome variables on beliefs and knowledge are measured on a scale from 0 to 5 and
have standard deviations between 1 and 1.5. If we accept that the population variance is similar to the
sampled variance, we find that a sample of 200 observations should be able to detect average
differences between groups (for a variable scaled 0 to 5) of the order of 0.4–0.7. For example, if the
average in the control group is 2.5 the sample should be able to detect a change in the project group
starting from 2.9–3.2 but smaller changes are unlikely to be detected. Note that these estimates are
conservative because we stratified the sample on a number of variables that were highly correlated with
responses: residence in a high-income country, self-assessed influence on policy, and experience in
conducting research or work in the subject area. Precision is increased by minimising the between-
groups differences in these variables that affect the outcomes.
Figure 2.2 Standardised minimum detectable difference and sample size
0.1
.2.3
.4.5
.6.7
.8.9
1de
lta
0 50 100 150 200 250 300 350 400 450 500observations
We calculated averages of a series of characteristics and outcome indicators for the four groups (see
Table 2.1). The p-value of an F-test is reported to assess the equality of the characteristics at the
baseline. In principle, this test is redundant. The purpose of a statistical test is to assess whether the
observed difference in the averages is a real difference in the population or is the result of chance. But

26 What Difference does a Policy Brief Make? Full Report of an IDS, 3ie, Norad study Beynon, P.; Chapoy, C.; Gaarder, M. and Masset, E.
in our case the difference is the result of chance by construction because people were assigned to the
four groups randomly. Therefore significance test really tests whether anything went wrong at the
randomisation stage. By looking at the data it is not the case.
What really matters is whether the four groups are very different in characteristics or baseline
outcomes. Background characteristics such as age, gender and education are evenly distributed
across the group as well as beliefs about RCTs, systematic reviews and knowledge of Haddad and
Sturman.21 Similarly, there are no large differences in beliefs regarding programme effectiveness,
evidence about effectiveness of the interventions and strength of this evidence.
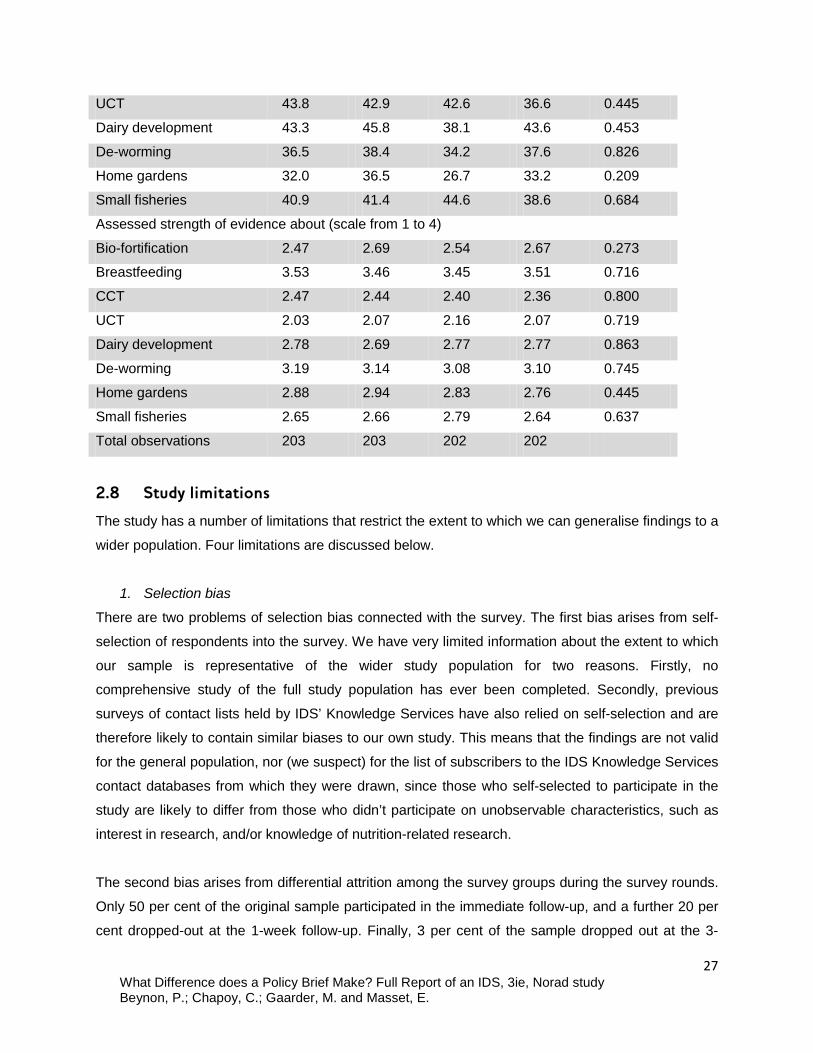
Table 2.1 Comparison of means for the four groups at baseline
Control T1 T2 T3 F-test
% Female 46.3 44.3 55.4 47.0 0.119
Age group 3.4 3.3 3.2 3.2 0.592
Education group 6.1 6.0 6.1 6.0 0.179
% believes RCT are strong 72.2 66.7 69.0 69.0 0.733
% believes SRs are strong 85.9 81.7 85.7 85.9 0.583
% knows L Haddad 23.1 21.7 19.8 21.3 0.878
% knows A Sturman 4.4 5.4 3.0 5.9 0.511
% believe intervention is effective
Bio-fortification 31.5 29.0 30.2 34.7 0.651
Breastfeeding 85.7 77.8 81.7 81.2 0.238
CCT 34.0 32.2 30.2 34.7 0.773
UCT 15.3 16.7 15.3 19.3 0.671
Dairy development 45.3 41.9 51.5 41.6 0.159
De-worming 63.5 58.6 63.9 64.4 0.605
Home gardens 64.5 58.6 70.3 60.4 0.071*
Small fisheries 51.2 46.8 51.0 52.0 0.723
% does not know about evidence about
Bio-fortification 51.7 55.7 52.0 55.9 0.736
Breastfeeding 16.7 21.7 19.3 19.8 0.659
CCT 42.4 34.0 37.1 29.2 0.044**
21 Antony Sturman is the fictitious sector expert we included in the study to identify potential over-reporting.
27 What Difference does a Policy Brief Make? Full Report of an IDS, 3ie, Norad study Beynon, P.; Chapoy, C.; Gaarder, M. and Masset, E.
UCT 43.8 42.9 42.6 36.6 0.445
Dairy development 43.3 45.8 38.1 43.6 0.453
De-worming 36.5 38.4 34.2 37.6 0.826
Home gardens 32.0 36.5 26.7 33.2 0.209
Small fisheries 40.9 41.4 44.6 38.6 0.684
Assessed strength of evidence about (scale from 1 to 4)
Bio-fortification 2.47 2.69 2.54 2.67 0.273
Breastfeeding 3.53 3.46 3.45 3.51 0.716
CCT 2.47 2.44 2.40 2.36 0.800
UCT 2.03 2.07 2.16 2.07 0.719
Dairy development 2.78 2.69 2.77 2.77 0.863
De-worming 3.19 3.14 3.08 3.10 0.745
Home gardens 2.88 2.94 2.83 2.76 0.445
Small fisheries 2.65 2.66 2.79 2.64 0.637
Total observations 203 203 202 202
2.8 Study limitations
The study has a number of limitations that restrict the extent to which we can generalise findings to a
wider population. Four limitations are discussed below.
1. Selection bias
There are two problems of selection bias connected with the survey. The first bias arises from self-
selection of respondents into the survey. We have very limited information about the extent to which
our sample is representative of the wider study population for two reasons. Firstly, no
comprehensive study of the full study population has ever been completed. Secondly, previous
surveys of contact lists held by IDS’ Knowledge Services have also relied on self-selection and are
therefore likely to contain similar biases to our own study. This means that the findings are not valid
for the general population, nor (we suspect) for the list of subscribers to the IDS Knowledge Services
contact databases from which they were drawn, since those who self-selected to participate in the
study are likely to differ from those who didn’t participate on unobservable characteristics, such as
interest in research, and/or knowledge of nutrition-related research.
The second bias arises from differential attrition among the survey groups during the survey rounds.
Only 50 per cent of the original sample participated in the immediate follow-up, and a further 20 per
cent dropped-out at the 1-week follow-up. Finally, 3 per cent of the sample dropped out at the 3-

28 What Difference does a Policy Brief Make? Full Report of an IDS, 3ie, Norad study Beynon, P.; Chapoy, C.; Gaarder, M. and Masset, E.
month follow-up. Retention rates are similar across the four intervention groups across survey
rounds. This suggests that the second bias resulting from differential attrition between groups should
not be very large.
Selection bias may affect the results of the study in a number of ways. Suppose that people with
stronger prior opinions on the topic are more likely to join the study and to remain in the study over
survey rounds. The bias consists of underestimating the impact of the intervention, because people
less likely to change their opinion are joining and remaining in the survey. Suppose instead that
people who joined the study have a more positive attitude towards research information. They may
be more inclined to engage with the message and more open minded towards the content of a policy
brief. In any case, selection bias means the findings are not generalisable to the wider population.
2. Reliance on self-report
All of the action data relies on self-report, and most cannot be verified through external observations.
It is possible that respondents may have ‘boasted’ higher levels of completed actions than they had
actually carried out; perhaps to appear consistent with their previously reported intended actions (if
they remembered these) or perhaps simply to appear active. There is no reason to believe
respondents would have been particularly inclined to over-reporting actions in this study, and the fact
that respondents reported lower levels of activity for actions that required higher levels of effort is
reassuring. Qualitative interviews with a sample of respondents (discussed in Appendix 2) did not
identify any over-reporting but did identify some under-reporting of actions. Nonetheless, findings
based on self-reported actions should be treated with caution.
3. A unique treatment
What is particular for the evidence presented in the policy briefs at the core of this study, but not that
unusual for systematic reviews in general, is that the evidence is not conclusive and hence not
highly actionable (except for the common conclusion that more research is needed). It may be that a
policy brief based on a more conclusive study with directive and actionable recommendations may
have achieved different results.
4. Relevance to a ‘real world’ situation
In a ‘real world’ situation, few research organisations would rely on a policy brief alone to influence
their key target audiences and would instead use a policy brief as one tool in a multi-pronged
influencing approach. Nonetheless, most research organisations do put their policy briefs into the
public domain on websites and in hard copy where they can be (and are) read as a standalone
resource by any interested actor. While they may be on the periphery of most influencing strategies,

29 What Difference does a Policy Brief Make? Full Report of an IDS, 3ie, Norad study Beynon, P.; Chapoy, C.; Gaarder, M. and Masset, E.
these actors are many and varied and they have potential to be influenced by research
communications, and potential to go on to influence policy and practice in previously under-explored
ways. Our study represents a pioneering effort to expand our understanding of the effectiveness of a
policy brief as a standalone tool, and provides some insights that could help research
communicators to develop effective policy briefs and to stimulate peripheral actors to keep their
ideas in circulation and broker their knowledge going forward.
2.9 Lessons from the study design
To the best of our knowledge this is the first study of its kind. As such, while we were able to draw on
our own and other people's experiences studying belief and behaviour change, there was no
'template' approach we could follow. Some of our design decisions proved useful. For example:
- in the 'beliefs' section of the surveys we asked about a range of interventions, including
some that were not mentioned in the policy brief (e.g. conditional cash transfers). This
helped us to test for survey effects.
- we asked respondents at baseline about their knowledge of a number of experts in the
nutrition field, including Lawrence Haddad (the named author of the opinion piece) and
Anthony Sturman (a fictitious name invented for the study). Asking about knowledge of
Haddad allowed us to test for more nuanced relationships in the Authority effect. And asking
about knowledge of Anthony Sturman allowed us to test for 'boasting' by survey
respondents.
- we asked about respondents' self-perceived level of influence in a number of areas. This
information has potential to allow us to develop a more nuanced understanding of the links
between role, organisation and influence.
And some of our design decisions led to limitations in the study. For example,
- in the 'actions' section of the survey all questions asked about self-reported behaviour. While
self-reported behaviour is easier and cheaper to collect than observed behaviour it is very
difficult to validate.
- in the first follow-up survey (the immediate survey), we asked respondents about their
intentions to act, and in the latter two follow-up surveys (1 week and 3 months after the
intervention) we asked about completed actions. By asking about 'intended' actions we may
have inadvertently increased the likelihood that respondents would act (some practitioners in
the training sector suggest that declaring an intention increases likelihood that an action will
be carried out). And, by asking about 'intended' actions before asking about 'completed'

30 What Difference does a Policy Brief Make? Full Report of an IDS, 3ie, Norad study Beynon, P.; Chapoy, C.; Gaarder, M. and Masset, E.
actions we may have inadvertently encouraged respondents to exaggerate their actions so
as to appear to have followed through.
We encountered a number of issues throughout the study that made it difficult to communicate
effectively with participants. These issues are likely to have contributed to the high rates of attrition.
For example, spam filters prevented emails from being delivered, website failures meant some
people couldn't access the treatments, and the time of year coincided with summer holidays in the
Northern hemisphere.
While the study was relatively small in scale and in budget22 it was proportionately a considerable
investment for evaluating a single policy brief. A greater budget is unlikely to have improved attrition,
but it may have allowed us to verify self-reported actions, for example. While we have established
that the effectiveness of research communication tools can be evaluated through an experimental
study design, we would not recommend this approach as standard for evaluating all research
communication activities. However, we would recommend further targeted studies to legitimise the
significant spending on research communication approaches, to improve our understanding about
what works in what situation to achieve research uptake and finally to further improve our knowledge
about how best to evaluate complex processes of influence.
22 3ie funded IDS £28,500 to complete the study, which included £1,500 prize money to incentivise participants. The budget is not a true reflection of the study cost as it does not include time required to a) develop the policy brief treatments, or b) time contributed by non-IDS co-authors to undertake analysis and reporting, which was considerable.

31 What Difference does a Policy Brief Make? Full Report of an IDS, 3ie, Norad study Beynon, P.; Chapoy, C.; Gaarder, M. and Masset, E.
3 Results
3.1 What impact did the policy brief intervention have on readers’ beliefs?
Study participants were asked at baseline, and in follow-up surveys to rate the strength of evidence
and effectiveness of a number of policy interventions for improving the nutrition status of children
(Figure 3.1).
Figure 3.1 Survey questions to capture beliefs
Two survey scales were used, and responses coded as follows:
- A) Effectiveness of intervention: Yes (3) / Sometimes (2) / No (1) / Don't know (0)
- B) Strength of evidence: Very Strong (4) / Strong (3) / Average (2) / Weak (1) / Don't know (0)
The policy brief increases the proportion of respondents who have an opinion about the strength of evidence and effectiveness of bio-fortification and home gardens We consider the impact on ratings of strength of evidence and effectiveness of two interventions:
bio-fortification and home gardens.23 The first is a new intervention of which little is known; the
second is a well-known intervention. Based on the systematic review we would rate the evidence on
23 The study also explored dairy development and small fisheries. For simplification, we only explore two policy interventions here.

32 What Difference does a Policy Brief Make? Full Report of an IDS, 3ie, Norad study Beynon, P.; Chapoy, C.; Gaarder, M. and Masset, E.
the effectiveness of bio-fortification as weak (code 1) and of home gardens as average (code 2). We
would also rate the effectiveness of these interventions as ‘sometimes’ positive (code 2) because of
the limited evidence and of the little evidence in favour of a positive impact of these interventions.
We would expect both the number of people having an opinion and the type of opinion to change
between the baseline and the follow-up survey as a result of the policy brief. Our expectations are
therefore that:
- more people know about evidence and effectiveness of home gardens than bio-fortification;
- the ratings of strength of evidence should be below or around ‘average’ (code 2) for bio-
fortification and home gardens;
- that at the baseline the variance on the effectiveness ratings of bio-fortification is larger than
the variance for home gardens (because as people have access to more information they
are more likely to have similar opinions);
- the distribution of evidence and effectiveness ratings should change between the baseline
and the follow-up.
Figure 3.2 Proportion of respondents reporting a belief regarding strength of evidence for bio-fortification and home gardens before and after intervention (DK = don’t know, K = an opinion is stated)
020
4060
80
KDK KDK
baseline immediate follow-up
Perc
ent
Has opinion on the strenght of evidenceGraphs by survey
Biofortification
050
100
KDK KDK
baseline immediate follow-up
Per
cent
Has opinion on the strenght of evidenceGraphs by survey
Home gardens
Figure 3.3 Proportion of respondents reporting particular beliefs regarding the strength of evidence for bio-fortification and home gardens before and after intervention

33 What Difference does a Policy Brief Make? Full Report of an IDS, 3ie, Norad study Beynon, P.; Chapoy, C.; Gaarder, M. and Masset, E.
010
2030
40
weak av strong v. strong weak av strong v. strong
baseline immediate follow-up
Per
cent
Weight of evidenceGraphs by survey
Biofortification
010
2030
40
weak av strong v. strong weak av strong v. strong
baseline immediate follow-up
Per
cent
Weight of evidenceGraphs by survey
Home gardens
Figure 3.4 Proportion of respondents reporting a belief regarding the effectiveness for bio-fortification and home gardens before and after intervention (DK = don’t know, K = an opinion is stated)
020
4060
80
KDK KDK
baseline immediate follow-up
Per
cent
Has opinion on effectivenessGraphs by survey
Biofortification
050
100
KDK KDK
baseline immediate follow-up
Per
cent
Has opinion on effectivenessGraphs by survey
Home gardens
Figure 3.5 Proportion of respondents reporting particular beliefs regarding the effectiveness of bio-fortification and home gardens before and after intervention
020
4060
no maybe yes no maybe yes
baseline immediate follow-up
Per
cent
EffectivenessGraphs by survey
Biofortification
020
4060
80
no maybe yes no maybe yes
baseline immediate follow-up
Per
cent
EffectivenessGraphs by survey
Home gardens

34 What Difference does a Policy Brief Make? Full Report of an IDS, 3ie, Norad study Beynon, P.; Chapoy, C.; Gaarder, M. and Masset, E.
Most of our expectations are confirmed:
- More people have an opinion about the strength of evidence and about the effectiveness of
home gardening interventions compared to bio-fortification.
- People have overly high expectations about the strength of evidence and the effectiveness of
the intervention than the systematic review suggests. About half of the sample rate strength
of evidence and effectiveness as ‘strong’ and ‘very strong’.
- Less information and more uncertainty increases the variability of responses. The baseline
variance of the distribution of effectiveness ratings of bio-fortification is larger than the
variance of home gardens (0.41 versus 0.22).
- The policy brief has the effect of increasing the number of people having an opinion about
both evidence strength and effectiveness.
- The policy brief has the effect of reducing the ratings of both evidence strength and
effectiveness.
There are a small number of participants who had an opinion at the baseline but no longer so at the
follow-up. This might suggest that the effect of the intervention for these respondents was to bring
uncertainty and that these respondents lost confidence in their prior beliefs. This is indeed possible
but the number of these respondents and the resulting effect size is so small (less than 10
respondent and less than 3 per cent of the sample) as to be irrelevant.
The policy brief is more effective in creating evidence-accurate beliefs among respondents with no priors, than changing beliefs of respondents who already have an opinion The policy brief has the effect of reducing evidence and effectiveness ratings. However, this effect
was calculated for all people having an opinion at either the baseline or the follow-up. But some
people formulated an opinion between the two surveys. It becomes of interest to see what is the
absolute size of the ratings of those who had an opinion at the baseline compared to those who
formulated an opinion between the two surveys. Our expectation is that those having an opinion at
the baseline are more likely to preserve their opinion after the policy brief while those formulating an
opinion after the policy brief are more likely to assign ratings similar to those suggested by the brief.
In other words, those who formed an opinion after reading the policy brief should assign lower
ratings to effectiveness and evidence than those having an opinion before reading the policy brief. In
order to test this we build a transition matrix for the ratings between the two surveys.

35 What Difference does a Policy Brief Make? Full Report of an IDS, 3ie, Norad study Beynon, P.; Chapoy, C.; Gaarder, M. and Masset, E.
Table 3.1 Transition matrices showing beliefs about the strength of evidence for bio-fortification and home gardens (average ratings in the cells) (DK = don’t know, K = an opinion is stated)
Bio-fortification Home gardens DK at follow-up K at follow-up DK at follow-up K at follow-up
DK at baseline - 1.9 - 2.0
K at baseline 2.6 2.7 changes to
2.4
2.0 2.9 changes to
2.6
Table 3.2 Transition matrices showing beliefs about the effectiveness of bio-fortification and home gardens (average ratings in the cells) (DK = don’t know, K = an opinion is stated) Bio-fortification Home gardens DK at follow-up K at follow-up DK at follow-up K at follow-up
DK at baseline - 2.3 - 2.5
K at baseline 2.2 2.6 changes to
2.5
1.0 2.8 changes to
2.7
Most expectations are confirmed. People forming their first opinion in between the surveys assign
lower ratings to both effectiveness and evidence. People having an opinion at baseline downgrade
their ratings after the policy brief but still have larger average ratings than those forming an opinion
after reading the policy brief. The change in ratings is larger for evidence than for effectiveness. In
conclusion, much of the change in average ratings between the two surveys is produced by the low
ratings of those forming their first opinion after reading the policy brief rather than by those with an
opinion at baseline changing their opinion. A lower rating reflects a more cautious view about the
strength of evidence and effectiveness of these interventions, which is in keeping with the messages
in the policy brief.
High attrition rates prevent us from drawing conclusions about persistence of changes in beliefs We undertook a difference in difference analysis over four survey rounds to explore the extent to
which changes in beliefs persist. The analysis only includes those individuals who answered all four
surveys, and the resulting cohorts are too small for us to draw any conclusions (tables are presented
in Appendix 3).

36 What Difference does a Policy Brief Make? Full Report of an IDS, 3ie, Norad study Beynon, P.; Chapoy, C.; Gaarder, M. and Masset, E.
Retention rates are similar across the four intervention groups, suggesting differential attrition should not bias results There are two problems of selection bias connected with the survey. The first bias arises from self-
selection of respondents into the survey. The second bias arises from differential attrition among the
survey groups during the survey rounds.
Suppose that people with stronger prior opinions on the topic are more likely to join the study and to
remain in the study over survey rounds. Suppose that people with stronger priors are also less likely
to change their opinion as a result of the intervention. The first bias consists of underestimating the
impact of the intervention, because people less likely to change their opinion are joining and
remaining in the survey. Because of this bias the results do not apply to the wide population of
potential readers of the policy brief. People with weaker priors would have changed their opinion
more easily had they participated in the survey. The second bias may underestimate or overestimate
the impact of the intervention in each intervention group if retention rates are correlated with
determinants of the outcomes. Different policy briefs can retain people in different ways and the
group end up being composed of people with a different likelihood of changing their opinions.
In order to test these hypotheses we look at attrition rates over survey rounds and at how they
correlate with individual characteristics and prior beliefs. The table below shows the attrition rates
over the four survey rounds. Only 50 per cent of the original sample participated in the follow-up, and
a further 20 per cent dropped-out at the 1-week follow-up. Finally, 3 per cent of the sample dropped
out at the 3-month follow-up. Retention rates are similar across the four intervention groups across
survey rounds. This suggests that the second bias resulting from differential attrition between groups
should not be very large.

37 What Difference does a Policy Brief Make? Full Report of an IDS, 3ie, Norad study Beynon, P.; Chapoy, C.; Gaarder, M. and Masset, E.
Table 3.3 Attrition rates across the control and treatment groups, and across the four surveys
Control – placebo
brief
T1 – Basic brief
T2 – Authority opinion piece
T3 – opinion piece by unnamed author
ALL
Baseline 202 203 201 201 807 Immediate follow-up
104 106 99 103 412
Retention rate 0.51 0.52 0.49 0.51 0.51 1-week follow-up 61 67 63 71 262 Retention rate 0.30 0.33 0.31 0.35 0.32 3-month follow-up 59 55 55 64 233 Final retention rate 0.29 0.27 0.27 0.32 0.29
Prior beliefs of attritors are not significantly different from those who stay in the study, but attritors are more likely to have particular characteristics which may bias the findings The sample is composed of highly educated people, with 60 per cent holding a masters degree and
a further 20 per cent holding a PhD, and equally distributed between male and female. Most
participants are working in government and non-government institutions. 20 per cent are in
academia, while 60 per cent work for international aid organisations or NGOs. 80 per cent of
participants are aged between 25 and 55. Participants are from high-income countries based on the
World Bank classification in 46 per cent of cases. 75 per cent of the respondents engage with
nutrition and agricultural issues in their work or research.
We tested the differences in prior beliefs of attritors and non-attritors between the immediate follow-
up and the baseline and between the 3-month follow-up and the baseline. Similarly, we tested
differences in baseline characteristics of attritors and non-attritors at immediate follow-up and 3-
month follow-up.

38 What Difference does a Policy Brief Make? Full Report of an IDS, 3ie, Norad study Beynon, P.; Chapoy, C.; Gaarder, M. and Masset, E.
Table 3.4 Differences in prior beliefs between attritors and people who stay in the study at immediate follow-up and 3-month follow-up
Immediate follow-up
3-month follow-up
Attritors Non-att. Attritors Non-att
Knowledge of strength of evidence for bio-fortification
0.43 0.49 0.45 0.49
Rating of strength of evidence for bio-fortification
2.5 2.6 2.6 2.6
Knowledge of effectiveness of bio-fortification
0.50 0.55 0.51 0.57
Rating of effectiveness of bio-fortification
2.5 2.5 2.5 2.5
Knowledge of strength of evidence for home gardens
0.65 0.70* 0.68 0.67
Rating of strength of evidence for home gardens
2.8 2.9 2.8 2.8
Knowledge of effectiveness of home gardens
0.78 0.80 0.79 0.79
Rating of effectiveness of home gardens
2.7 2.8 2.8 2.8
Attritors are less knowledgeable of the topics of the review and tend to assign lower ratings to both
evidence and effectiveness, but the differences are never statistically significant.

39 What Difference does a Policy Brief Make? Full Report of an IDS, 3ie, Norad study Beynon, P.; Chapoy, C.; Gaarder, M. and Masset, E.
Table 3.5 Determinants of attrition
Immediate follow-up 3-month follow-up sign significance sign significance
Female respondent - -
Age - -
Academic + -
Working in aid + + *
Higher education - * -
Engages with agriculture/nutrition through work
- ** - *
Self-assessed influence on policymaking
+ +
High-income country + -
Of the potential determinants of attrition considered, only higher education, self-assessed knowledge
about agriculture and work in a government or non-government aid agency seem to be correlated
with attrition. High education and knowledge in particular decrease the probability of attrition. A
similar mechanism might well have operated in the selection of the baseline sample from the
population of potential respondents. There is some sign that the sample is composed of people with
good knowledge of agriculture and nutrition. These people are also likely to be those with higher
attachment to their beliefs.
We found little variation in the profile of attritors across the control and intervention groups, with the
exception of T1 (who received the basic policy brief).

40 What Difference does a Policy Brief Make? Full Report of an IDS, 3ie, Norad study Beynon, P.; Chapoy, C.; Gaarder, M. and Masset, E.
Table 3.6 Differential attrition determinants
Control – placebo brief
T1 – Basic brief
T2 – Authority
opinion piece
T3 – opinion piece by unnamed author
Coeff P-
value
Coeff P-
value
Coeff P-
value
Coeff P-
value
Female respondent
-0.06 0.74 0.39* 0.06 -0.23 0.25 -0.01 0.98
Age -0.01 0.93 0.03 0.70 -
0.17**
0.04 -0.08 0.30
Academic 0.19 0.45 0.61** 0.03 -0.18 0.48 -
0.67**
0.01
Working in aid 0.33 0.13 0.37* 0.09 0.24 0.29 -0.05 0.83
Higher education -0.12 0.86 0.15 0.75 -0.01 0.99 -0.60 0.33
Engages with agriculture /nutrition in work
-0.37* 0.10 0.00 0.99 -0.42* 0.08 -0.04 0.86
Self-assessed influence on policymaking
0.32 0.11 0.03 0.87 -0.02 0.93 0.11 0.57
High-income country
-0.01 0.95 -0.19 0.36 -0.15 0.47 -0.03 0.86
Constant 0.67 0.38 0.01 0.99 1.66 0.03 1.47 0.05
Quality ratings of the intervention and placebo policy briefs were high, with little variation between the intervention briefs There are two quality issues related to the policy brief. The first is its objective quality, that is its
correct and effective representation of the results of the systematic review. The second issue is the
quality as it is perceived by the respondents. We deal here with the second issue.
The respondents rated the quality of the policy brief on a number of dimensions. Ratings are in
general high and slightly higher for the policy brief sample with a few exceptions. We tested the
differences between the two groups using the standard t-test. We also tested the difference in mean
ratings between the three groups receiving the policy brief using an F-test.
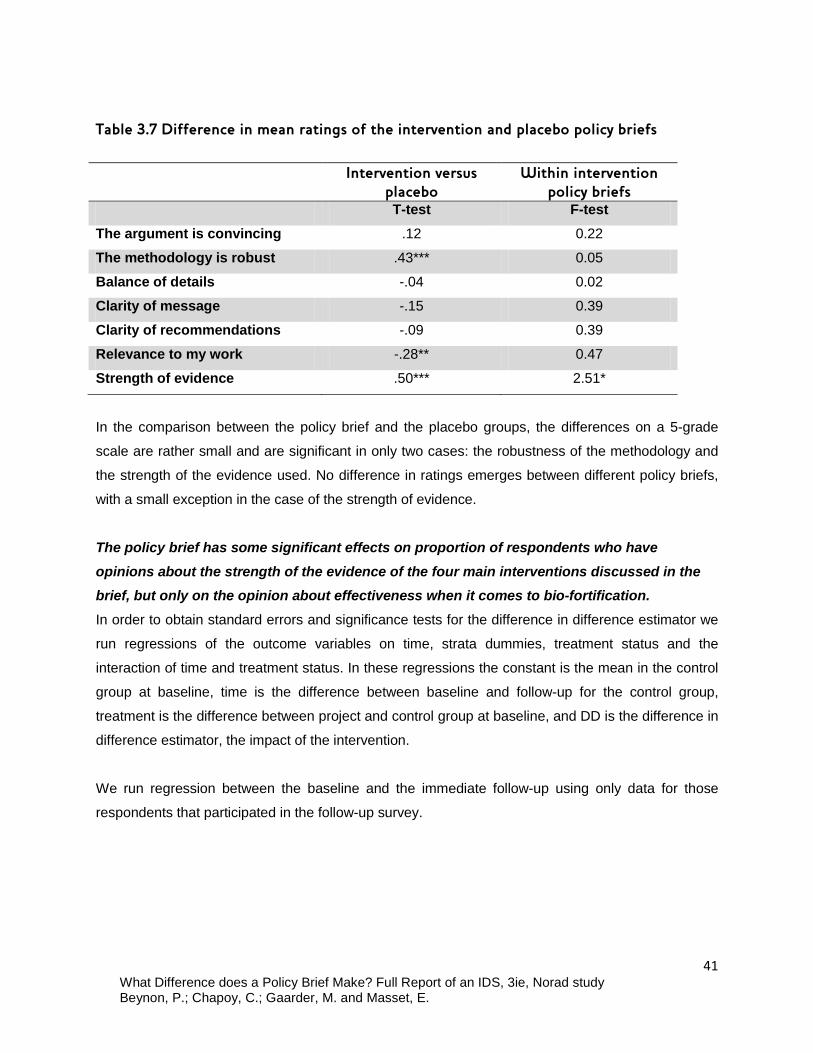
41 What Difference does a Policy Brief Make? Full Report of an IDS, 3ie, Norad study Beynon, P.; Chapoy, C.; Gaarder, M. and Masset, E.
Table 3.7 Difference in mean ratings of the intervention and placebo policy briefs
Intervention versus
placebo Within intervention
policy briefs T-test F-test The argument is convincing .12 0.22
The methodology is robust .43*** 0.05
Balance of details -.04 0.02
Clarity of message -.15 0.39
Clarity of recommendations -.09 0.39
Relevance to my work -.28** 0.47
Strength of evidence .50*** 2.51*
In the comparison between the policy brief and the placebo groups, the differences on a 5-grade
scale are rather small and are significant in only two cases: the robustness of the methodology and
the strength of the evidence used. No difference in ratings emerges between different policy briefs,
with a small exception in the case of the strength of evidence.
The policy brief has some significant effects on proportion of respondents who have opinions about the strength of the evidence of the four main interventions discussed in the brief, but only on the opinion about effectiveness when it comes to bio-fortification. In order to obtain standard errors and significance tests for the difference in difference estimator we
run regressions of the outcome variables on time, strata dummies, treatment status and the
interaction of time and treatment status. In these regressions the constant is the mean in the control
group at baseline, time is the difference between baseline and follow-up for the control group,
treatment is the difference between project and control group at baseline, and DD is the difference in
difference estimator, the impact of the intervention.
We run regression between the baseline and the immediate follow-up using only data for those
respondents that participated in the follow-up survey.

42 What Difference does a Policy Brief Make? Full Report of an IDS, 3ie, Norad study Beynon, P.; Chapoy, C.; Gaarder, M. and Masset, E.
Table 3.8 Difference in difference between baseline and immediate follow-up survey
Bio-fortification Home gardens coefficient P-value coefficient P-value Has opinion about evidence Constant 0.28*** 0.000 0.48*** 0.000
Time 0.08 0.710 0.02 0.710
Treatment -0.07 0.984 0.01 0.984
DD 0.27*** 0.000 0.17*** 0.000
Evidence ratings Constant 2.89*** 0.000 2.98*** 0.000
Time 0.08 0.130 -0.05 0.490
Treatment -0.07 0.843 -0.03 0.638
DD 0.27 0.965 -0.04 0.655
Has opinion about effectiveness Constant 0.48*** 0.000 0.76*** 0.000
Time 0.82 0.186 0.10** 0.021
Treatment -0.07 0.192 0.01 0.828
DD 0.22** 0.002 0.04 0.473
Effectiveness ratings Constant 2.96*** 0.000 2.98*** 0.000
Time 0.00 0.999 -0.05 0.490
Treatment 0.07 0.436 -0.03 0.638
DD 0.22 0.569 -0.04 0.655

43 What Difference does a Policy Brief Make? Full Report of an IDS, 3ie, Norad study Beynon, P.; Chapoy, C.; Gaarder, M. and Masset, E.
Table 3.9 Difference in difference between baseline and immediate follow-up survey
Dairy development Small-scale fisheries coefficient P-value coefficient P-value Has opinion about evidence Constant 0.48*** 0.000 0.49*** 0.000
Time 0.09 0.123 -0.02 0.738
Treatment 0.05 0.271 -0.01 0.908
DD 0.11* 0.099 0.20** 0.004
Evidence ratings Constant 3.44*** 0.000 2.72*** 0.000
Time -0.04 0.824 -0.15 0.419
Treatment -0.15 0.296 0.07 0.684
DD -0.03 0.868 -0.10 0.658
Has opinion about effectiveness Constant 0.59*** 0.000 0.75*** 0.000
Time 0.12** 0.023 0.05 0.145
Treatment 0.06 0.175 0.02 0.714
DD 0.07 0.290 0.12 0.876
Effectiveness ratings Constant 2.79*** 0.000 2.60*** 0.000
Time -0.03 0.745 -0.15 0.145
Treatment -0.11 0.178 0.03 0.714
DD 0.07 0.534 0.02 0.876
The regression results show that:
• the policy brief increases the fraction of respondents with an opinion with respect to strength
of evidence by between 11 and 27 per cent points;
• the policy brief is not found to have a significant effects on the average evidence ratings;
• the policy brief increases the proportion of respondents with an opinion about the
effectiveness of bio-fortification only by 22 per cent.
In order to control for potential survey effects or underlying differences in changes between project
and control groups, we also included policies in the survey for which there was no information in the
brief, and were hence able to carry out a ‘placebo test’. The placebo policies were conditional cash
transfers, breastfeeding and de-worming. The brief should have no impact on these policies.
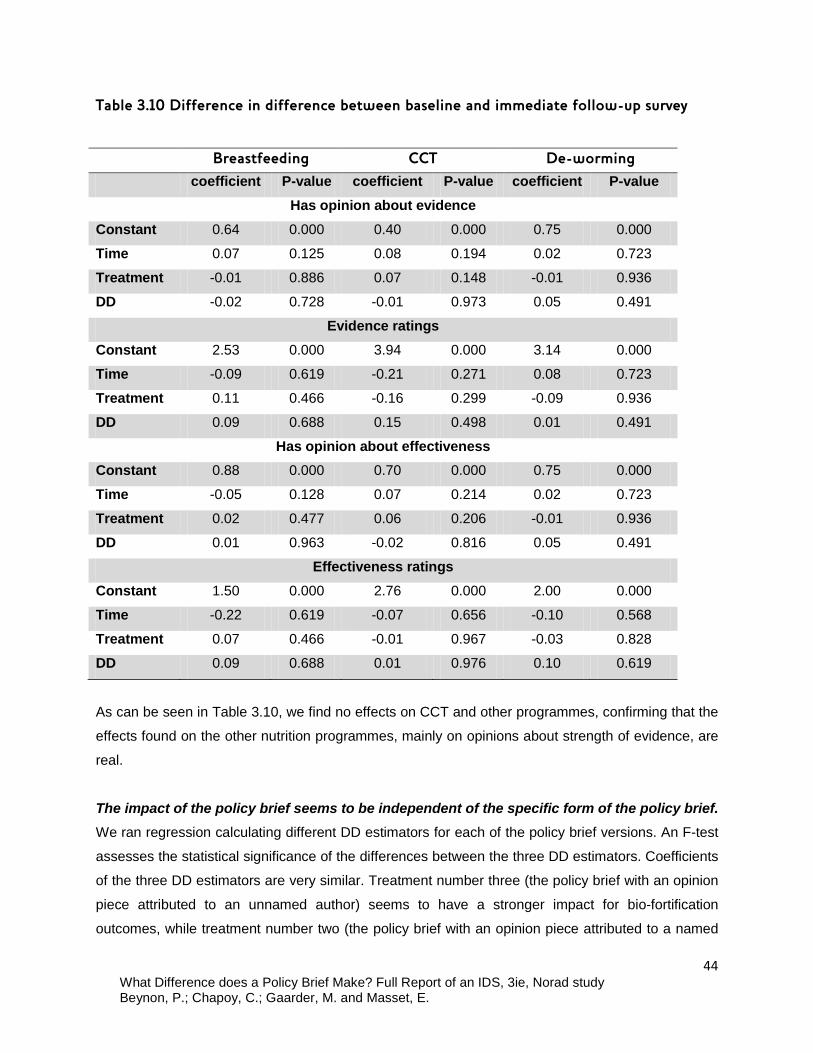
44 What Difference does a Policy Brief Make? Full Report of an IDS, 3ie, Norad study Beynon, P.; Chapoy, C.; Gaarder, M. and Masset, E.
Table 3.10 Difference in difference between baseline and immediate follow-up survey
Breastfeeding CCT De-worming coefficient P-value coefficient P-value coefficient P-value
Has opinion about evidence Constant 0.64 0.000 0.40 0.000 0.75 0.000
Time 0.07 0.125 0.08 0.194 0.02 0.723
Treatment -0.01 0.886 0.07 0.148 -0.01 0.936
DD -0.02 0.728 -0.01 0.973 0.05 0.491
Evidence ratings Constant 2.53 0.000 3.94 0.000 3.14 0.000
Time -0.09 0.619 -0.21 0.271 0.08 0.723
Treatment 0.11 0.466 -0.16 0.299 -0.09 0.936
DD 0.09 0.688 0.15 0.498 0.01 0.491
Has opinion about effectiveness Constant 0.88 0.000 0.70 0.000 0.75 0.000
Time -0.05 0.128 0.07 0.214 0.02 0.723
Treatment 0.02 0.477 0.06 0.206 -0.01 0.936
DD 0.01 0.963 -0.02 0.816 0.05 0.491
Effectiveness ratings Constant 1.50 0.000 2.76 0.000 2.00 0.000
Time -0.22 0.619 -0.07 0.656 -0.10 0.568
Treatment 0.07 0.466 -0.01 0.967 -0.03 0.828
DD 0.09 0.688 0.01 0.976 0.10 0.619
As can be seen in Table 3.10, we find no effects on CCT and other programmes, confirming that the
effects found on the other nutrition programmes, mainly on opinions about strength of evidence, are
real.
The impact of the policy brief seems to be independent of the specific form of the policy brief. We ran regression calculating different DD estimators for each of the policy brief versions. An F-test
assesses the statistical significance of the differences between the three DD estimators. Coefficients
of the three DD estimators are very similar. Treatment number three (the policy brief with an opinion
piece attributed to an unnamed author) seems to have a stronger impact for bio-fortification
outcomes, while treatment number two (the policy brief with an opinion piece attributed to a named

45 What Difference does a Policy Brief Make? Full Report of an IDS, 3ie, Norad study Beynon, P.; Chapoy, C.; Gaarder, M. and Masset, E.
author – Lawrence Haddad) seems to have a weaker impact in the case of home gardens outcomes.
None of the differences observed between the three DD estimators is statistically significant by the
F-test. In other words, the impact of the policy brief seems to be independent of the specific form of
the policy brief.
Table 3.11 Changes in belief for different policy brief treatments
Bio-fortification Home gardens coefficient P-value coefficient P-value
Has opinion about evidence DD T1 – Basic 0.24** 0.009 0.19** 0.015
DD T2 – Authority opinion piece
0.23** 0.014 0.08 0.340
DD T3 – opinion piece by unnamed author
0.27** 0.002 0.18** 0.024
F-test (P-value) 0.854 0.299
Evidence ratings DD T1 – Basic -0.44* 0.065 -0.24 0.272
DD T2 – Authority opinion piece
-0.67** 0.007 -0.16 0.451
DD T3 – opinion piece by unnamed author
-0.46* 0.062 -0.13 0.553
F test (P-value) 0.579 0.869
Has opinion about effectiveness DD T1 – Basic 0.17** 0.048 0.07 0.285
DD T2 – Authority opinion piece
0.17* 0.057 0.01 0.877
DD T3 – opinion piece by unnamed author
0.26** 0.003 0.02 0.699
F test (P-value) 0.521 0.639
Effectiveness ratings DD T1 – Basic -0.18 0.240 -0.04 0.698

46 What Difference does a Policy Brief Make? Full Report of an IDS, 3ie, Norad study Beynon, P.; Chapoy, C.; Gaarder, M. and Masset, E.
DD T2 – Authority opinion piece
-0.01 0.937 -0.05 0.648
DD T3 – opinion piece by unnamed author
-0.24 0.118 -0.03 0.739
F test (P-value) 0.300 0.992
Respondents with prior beliefs that are not in keeping with the message of the policy brief are not more likely to discredit it One reason for the absence of changes in ratings of evidence and effectiveness could be ‘belief
perseverance’. This happens when people persist in adhering to theories beyond what the evidence
would suggest. Beliefs tend to be resistant to new data.
About half of respondents reported that the evidence regarding the effectiveness of bio-fortification
and home gardens is either strong or very strong. A similar share of respondents reported that bio-
fortification and home gardens are effective interventions to reduce malnutrition. The policy brief
challenges these views. We found that in spite of the policy brief, most respondents hold their
original views. We might expect the respondent to discredit the policy brief when it is not in
agreement with prior beliefs.
The respondents provided ratings at follow-up for how convincing and robust they found the policy
brief, and for how strong they considered the evidence it contained. We regressed these ratings on
prior beliefs at baseline. The expectation was that respondents feeling strongly in favour of the
effectiveness of the interventions, and of the strength of the existing evidence at baseline, would rate
the policy brief less favourably at the follow-up. The regression also contains a number of control
variables. It is run only for the group receiving the treatment.
The results are contrary to our expectations. Respondents with stronger prior beliefs in favour of the
intervention rated the policy brief more favourably on all three accounts considered. It would seem
that respondents rate positively research challenging their priors but do not change these priors
nevertheless. Among the control variables considered, only residence in a high-income country and
higher education have a statistically significant effect. Respondents living in rich countries and more
highly educated tend to rate the policy brief less favourably.

47 What Difference does a Policy Brief Make? Full Report of an IDS, 3ie, Norad study Beynon, P.; Chapoy, C.; Gaarder, M. and Masset, E.
Table 3.12 Respondents’ ratings of the policy brief by prior beliefs
Agree with:
‘The argument presented in
the policy brief is convincing’
Agree with: ‘The methodology used for the
study described in the policy
brief is robust’
How do you rate the policy brief in terms of the
strength of evidence
presented? Coeff. P-value Coeff. P-value Coeff. P-value
Evidence on bio-fortification is strong
0.10 0.392 0.14 0.257 0.13 0.298
Evidence on bio-fortification is very strong
0.26* 0.096 0.36** 0.028 0.34** 0.042
Evidence on home gardens is strong
0.11 0.299 0.05 0.648 0.02 0.881
Evidence on home gardens is very strong
0.49*** 0.000 0.33** 0.008 0.44*** 0.000
Bio-fortification is effective 0.06 0.542 0.11 0.250 0.10 0.353
Home gardens is effective 0.13 0.161 0.16 0.107 0.18* 0.083
Time has a positive effect on changes in beliefs for both the treatment and non-treatment groups Time had a significant effect on changes in beliefs for both the treatment and non-treatment groups.
In particular, time had a negative effect on readers’ beliefs about the effectiveness of small-scale
fisheries and a positive effect on readers forming an opinion about all of the other interventions (bio-
fortification, dairy development, home gardens).
The time result could be picking up a study effect that is not true of the unsurveyed population. While
the treatment delivered to the control group did not include any reference to bio-fortification, dairy
development, home gardens or small-scale fisheries, the survey did. Simply by asking readers about
their beliefs in relation to these interventions the study may have catalysed them to seek more
information about these interventions, be alert to information they happen across or to ponder an
issue they had not pondered before. This explanation seems particularly true of the positive effect on
readers’ forming an opinion regarding three of the interventions. Alternately, the time result could be
picking up a universal effect that would also be true of the unsurveyed population. The majorities of
the control and treatment groups were invited to join the study from the IDS Knowledge Services

48 What Difference does a Policy Brief Make? Full Report of an IDS, 3ie, Norad study Beynon, P.; Chapoy, C.; Gaarder, M. and Masset, E.
contact lists, and are therefore likely to be present or past users of IDS Knowledge Services. It is
possible that over the study period they were similarly exposed to other information about these
interventions, either through use of our products or the wider media. This seems most likely in the
case of the negative effect of time on readers’ beliefs about the effectiveness of small-scale
fisheries.
3.2 What impact did the policy brief intervention have on readers’ intentions to
act?
We asked respondents immediately after the intervention and one week later about their intentions
to complete one or more of eleven follow-up actions (Box 3.1). The intended actions can be loosely
grouped into five categories that require progressively greater effort and progressively greater co-
operation from other people. The response options were ‘Yes’, ‘Maybe’, ‘No’, ‘Don’t know’ and were
given the numerical values 3, 2, 1 and 0 respectively.
Box 3.1 intended and actual actions explored through the survey
• Revise the message o Re-read the policy brief
• Share the message o Send the policy brief to someone else o Tell someone about the key message of the policy brief o Write a blog or article
• Seek further information o Read the full report of the study discussed in the policy brief o Source more information about some/all of the studies discussed
in the brief o Source other research/information related to the topic of the
policy brief • Review practice
o Review your current policies/practices regarding the topic of the policy brief
o Review your approach to researching/evaluating an intervention related to the topic of the policy brief
• Change practice o Change your current policies/practice regarding the topic of the
policy brief o Commission new research related to the topic of the policy brief

49 What Difference does a Policy Brief Make? Full Report of an IDS, 3ie, Norad study Beynon, P.; Chapoy, C.; Gaarder, M. and Masset, E.
Respondents are more likely to report an intention to revise and share the message of the policy brief, than to complete more effort-filled actions
We expect that as the effort and cooperation that is required to complete the action increases,
readers’ intentions to carry out that action will decrease.
Table 3.13 Mean rating of the intended follow-up actions (1 is no intended follow-up actions, 2 is a maybe, and 3 is an expressed intention)
Variable Mean Std. Dev. Obs.
Re-read the policy brief 2.38 0.82 406
Send the policy brief to someone else 2.30 0.80 402
Tell someone about the key message of the policy brief 2.39 0.78 408
Write a blog or article 1.48 0.68 389
Read the full report of the study discussed in the policy brief 2.16 0.82 409
Source more information about some/all of the studies discussed in the brief
2.15 0.78 402
Source other research/information related to the topic of the policy brief
2.20 0.77 402
Review your current policies/practices regarding the topic of the policy brief
1.93 0.85 380
Review your approach to researching/evaluating an intervention related to the topic of the policy brief
2.04 0.83 385
Change your current policies/practice regarding the topic of the policy brief
1.67 0.71 359
Commission new research related to the topic of the policy brief
1.54 0.72 364

50 What Difference does a Policy Brief Make? Full Report of an IDS, 3ie, Norad study Beynon, P.; Chapoy, C.; Gaarder, M. and Masset, E.
Table 3.14 Mean rating of the intended follow-up actions in treatment versus control
Control All treatments
t
Re-read the policy brief 2.28
0.88
2.41
0.79
-2.96
Send the policy brief to someone else 2.19
0.85
2.34
0.78
-3.15
Tell someone about the key message of the policy brief 2.24
0.86
2.44
0.74
-4.68
Write a blog or article 1.47
0.66
1.48
0.69
-0.37
Read the full report of the study discussed in the policy brief
2.21
0.84
2.14
0.81
1.45
Source more information about some/all of the studies discussed in the brief
2.26
0.80
2.11
0.77
3.48
Source other research/information related to the topic of the policy brief
2.24
0.81
2.18
0.76
1.24
Review your current policies/practices regarding the topic of the policy brief
1.90
0.85
1.94
0.85
-0.77
Review your approach to researching/evaluating an intervention related to the topic of the policy brief
1.92
0.85
2.08
0.83
-3.40
Change your current policies/practice regarding the topic of the policy brief
1.65
0.72
1.68
0.70
-0.83
Commission new research related to the topic of the policy brief
1.65
0.78
1.51
0.70
3.42
When looking at the sample as a whole, our hypothesis is confirmed. The intended actions that
score the highest are: ‘Re-read the policy brief’, ‘Send the policy brief to someone else’ and ‘Tell
someone about the key message of the policy brief.’ These are all actions that can be carried out
with fairly low effort and cooperation from others. Blogging/writing an article, commissioning new
research and changing policies have predictably the lowest means. However, these averages hide
significant differences across the treatment groups and the control group. The treatment group is
significantly more likely to tell, send and re-read the policy brief, as well as review their approach to
researching/evaluating an intervention related to the topic of the policy brief, whereas the placebo
group is more likely to ‘source more information about some/all of the studies discussed in the brief’
51 What Difference does a Policy Brief Make? Full Report of an IDS, 3ie, Norad study Beynon, P.; Chapoy, C.; Gaarder, M. and Masset, E.
and ‘commission new research related to the topic of the policy brief’. The greater intention to source
information and commission new research could be an indication that the placebo policy brief was
less satisfactory and conclusive (and therefore that it possibly got people more curious/interested).
We find a clear Authority effect, and opinion-piece effect on readers’ intentions to share the messages of the brief While in the previous section we explored the simple averages across treatment and placebo, in this
section we want to further disentangle the differences across different types of treatment, while
controlling for possible effect modifiers previously hypothesised to potentially make a difference;
education, gender, self-reported influence in central and local government and finding the policy brief
convincing. We expect that readers of the two treatments that included an opinion piece would be
more likely to report an intention to act, because the call to act was stronger in these briefs.
Tables 3.15 reports the results. Our hypothesis was partly confirmed. We find a clear authority-effect
on readers’ intentions to ‘send the policy brief to someone else’ and an opinion-piece effect (i.e. an
effect for both of the treatments that included the opinion piece) on ‘intending to tell someone about
the key messages’. We further find that the third treatment group (opinion piece without known
author) is less likely to read the full report and seek out more information than the other groups.
Gender and self-perceived levels of influence also affect respondents’ intention to act Two factors were found to be significant in relation to intentions to act. Firstly, readers’ own ratings of
the level of influence they have on central and local government decisions have differential effects24
(Table 3.15). Influence on central government is found to be positively correlated only with sending
the policy brief on to others. Influence on local government, on the other hand, is found to be
positively correlated with telling others about the findings, blogging, as well as reviewing and
changing policies and research approaches. The only intended actions where no significant
coefficient was detected for local influence were re-reading the policy brief, sending it on, and
sourcing more research/information about the topic.
The difference between the two levels of self-assessed influence is interesting – with those
influential at the central level not expressing more intentions to act than others (except for sending
on the policy brief) and those influential at the local government level found to be over the average
active, especially when it comes to those intended actions that do not require the person to seek
more information. There could be several explanations for these findings. Suppose that readers with
24 We calculated the variance inflation factors (vif), and did not find evidence of severe multi-colinearity.
52 What Difference does a Policy Brief Make? Full Report of an IDS, 3ie, Norad study Beynon, P.; Chapoy, C.; Gaarder, M. and Masset, E.
a higher self-perceived level of influence do have a higher actual level of influence. These readers
may be more inclined to intend to act because they have greater opportunity to make a difference
through their work. Suppose instead that self-perceived level of action is more an indicator of internal
locus of control. Readers with a higher internal locus of control may be more inclined to act because
they believe that their actions will make a difference. Both of these observations could explain the
findings for local level influence, but what about influence on central government? One possibility is
that our survey options do not adequately capture the type of actions that people use to influence
policy at central level. For example, the knowledge from the brief could be internalised and conveyed
as opinions or facts in meetings and corridor discussions without the person being conscientious of,
and acknowledging, where the information comes from. Another possibility is that for central
influence, self-assessment does not match reality.
Secondly, gender is significantly (negatively) correlated with the intention to act for most of the
intended actions, implying that women are less likely to claim that they will do follow-up actions than
men (also Table 3.15). Again, there could be several explanations for this finding. Suppose that
women are less inclined to act generally and therefore do not report an intention to act; that women
are less empowered to act or rewarded for acting within their workplace; or suppose that women are
less inclined to report an intention to act that they know they are unlikely to be able to fulfil.
Wondering whether there is a gender difference in the truthfulness with which individuals answer
surveys, we thought of looking at whether there was a difference between men and women when it
came to claiming having heard about our fictitious expert, Dr. Anthony Sturman. There was no
significant correlation.
The types of follow-up actions where gender is not found to matter are activities that do not entail
direct interaction with others (re-reading the brief and sending it on). This could be taken as
indicative evidence that it is in direct communication with others that women are facing
communication barriers.

53 What Difference does a Policy Brief Make? Full Report of an IDS, 3ie, Norad study Beynon, P.; Chapoy, C.; Gaarder, M. and Masset, E.
Table 3.15 Intended actions at immediate follow-up
Variables Re-read the policy brief
Send the policy brief to someone else
Tell someone about the key message of the policy brief
Write a blog or article
Read the full report of the study discussed in the policy brief
Source more information about some/all of the studies discussed in the brief
Source other research/ information related to the topic of the policy brief
Review your current policies/ practices regarding the topic of the policy brief
Review your approach to researching/ evaluating an intervention related to the topic of the policy brief
Change your current policies/ practice regarding the topic of the policy brief
Commission new research related to the topic of the policy brief
T1 – Basic brief
0.219 0.0829 0.0843 0.108 -0.0379 -0.228 -0.0160 -0.141 -0.162 0.176 -0.274*
(0.165) (0.161) (0.157) (0.148) (0.146) (0.158) (0.156) (0.163) (0.143) (0.165) (0.148)
T2 – Authority brief
0.208 -0.0511 0.371** 0.468*** 0.0130 -0.0895 -0.00112 0.166 0.151 0.237 -0.189
(0.167) (0.163) (0.159) (0.150) (0.148) (0.160) (0.157) (0.164) (0.145) (0.167) (0.150)
T3 – Opinion brief
0.198 -0.264 0.148 0.395*** 0.00802 -0.285* -0.0836 0.0419 0.179 0.201 -0.172
(0.165) (0.161) (0.157) (0.148) (0.146) (0.158) (0.155) (0.162) (0.143) (0.165) (0.148)
Education -0.105 -0.00307 -0.0996 -0.108 -0.241*** -0.134 -0.0783 -0.0728 -0.103 -0.0992 -0.0236
(0.0864)
(0.0841) (0.0821) (0.0774) (0.0764) (0.0827) (0.0814) (0.0851) (0.0751) (0.0863) (0.0774)
Gender -0.260** -0.545*** -0.159 -0.379*** -0.449*** -0.328*** -0.333*** -0.599*** -0.460*** -0.502*** -0.452***
(0.118) (0.115) (0.112) (0.106) (0.104) (0.113) (0.111) (0.116) (0.103) (0.118) (0.106)
Self-perceived 0.00710 -0.00236 0.0824*** 0.0415 0.00595 -0.00684 0.00995 0.0513* -0.00475 0.0282 0.0222
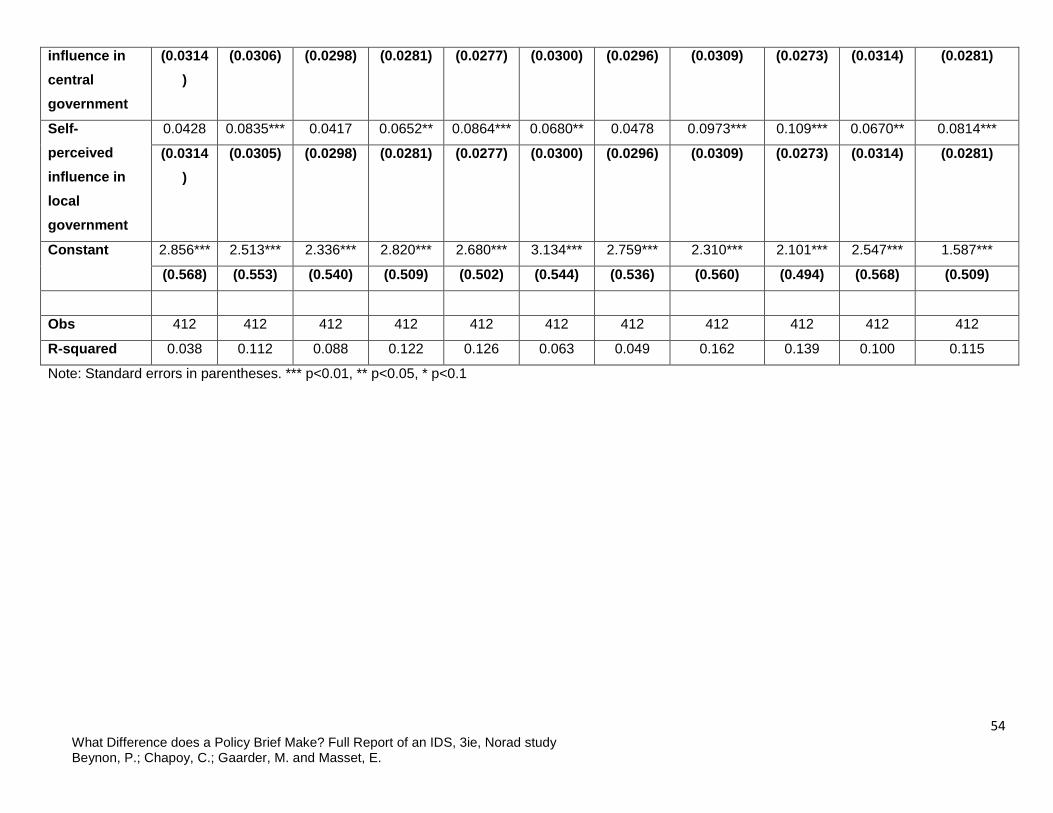
54 What Difference does a Policy Brief Make? Full Report of an IDS, 3ie, Norad study Beynon, P.; Chapoy, C.; Gaarder, M. and Masset, E.
influence in central government
(0.0314)
(0.0306) (0.0298) (0.0281) (0.0277) (0.0300) (0.0296) (0.0309) (0.0273) (0.0314) (0.0281)
Self- perceived influence in local government
0.0428 0.0835*** 0.0417 0.0652** 0.0864*** 0.0680** 0.0478 0.0973*** 0.109*** 0.0670** 0.0814***
(0.0314)
(0.0305) (0.0298) (0.0281) (0.0277) (0.0300) (0.0296) (0.0309) (0.0273) (0.0314) (0.0281)
Constant 2.856*** 2.513*** 2.336*** 2.820*** 2.680*** 3.134*** 2.759*** 2.310*** 2.101*** 2.547*** 1.587***
(0.568) (0.553) (0.540) (0.509) (0.502) (0.544) (0.536) (0.560) (0.494) (0.568) (0.509)
Obs 412 412 412 412 412 412 412 412 412 412 412
R-squared 0.038 0.112 0.088 0.122 0.126 0.063 0.049 0.162 0.139 0.100 0.115
Note: Standard errors in parentheses. *** p<0.01, ** p<0.05, * p<0.1

55 What Difference does a Policy Brief Make? Full Report of an IDS, 3ie, Norad study Beynon, P.; Chapoy, C.; Gaarder, M. and Masset, E.
3.3 What impact did the policy brief intervention have on readers’ completed
actions?
We asked respondents one week and three months after the intervention about whether they had
completed eleven follow-up actions. The list of completed actions is the same as the intended
actions (Box 3.1, at the start of the intentions section) and can be loosely grouped into five
categories that require progressively greater effort and progressively greater cooperation from other
people. The response options were ‘Yes’, ‘No but I intend to’, and ‘No’, and were given the numerical
values 3, 2, and 1 respectively.
Respondents are more likely to report completing actions that require little effort Again, we expect that as the required effort and required cooperation increases, readers reporting
they have carried out the action will decrease, and this is confirmed by looking at the mean ratings of
the follow-up actions in Table 3.16. Interestingly, the only significant difference detected between the
treatment and placebo control group is in the actions related to commissioning more information and
more research; the group receiving the placebo brief is more likely to report carrying out these
activities.
Table 3.16 Mean rating of the follow-up actions in treatment versus control (1-week follow-up survey)
Control All
treatments t
Re-read the policy brief 2.00
0.93
2.05
0.89
-0.34
Send the policy brief to someone else 1.63
0.84
1.82
0.91
-1.41
Tell someone about the key message of the policy brief
1.85
0.90
2.01
0.91
-1.16
Write a blog or article 1.20
0.44
1.13
0.40
1.12
Read the full report of the study discussed in the policy brief
1.56
0.73
1.55
0.70
0.12
Source more information about some/all of the studies discussed in the brief
1.74
0.85
1.53
0.76
1.78
Source other research/information related to 1.88 1.55 2.74

56 What Difference does a Policy Brief Make? Full Report of an IDS, 3ie, Norad study Beynon, P.; Chapoy, C.; Gaarder, M. and Masset, E.
the topic of the policy brief 0.89 0.78
Review your current policies/practices regarding the topic of the policy brief
1.45
0.80
1.40
0.72
0.40
Review your approach to researching/evaluating an intervention related to the topic of the policy brief
1.48
0.77
1.63
0.82
-1.22
Change your current policies/practice regarding the topic of the policy brief
1.27
0.58
1.26
0.57
0.07
Commission new research related to the topic of the policy brief
1.19
0.51
1.15
0.44
0.55
While we expected reported actions to increase over time, given that this was a cumulative question
(so those having reported having carried out an action in the 1-week follow-up should also report this
in the 3-month survey), the findings were not clear-cut. If attritors are similar to non-attritors in terms
of their reporting on actions, then the changes in percentages are an indication of whether reported
actions increased over time. An increase was found for the following actions: sending the policy
brief, telling about the policy brief message, blogging about it, reading the full report and changing a
policy. It is quite plausible, however, that attritors differ on unobservable features that are related to
how they would report on actions. For example, those who have reported that they intend to carry
out actions (either by replying ‘yes’ to the intended actions question in survey 2 or ‘no, but I intend to’
in survey 3) but then failed to do so, may be more likely to not want to admit to this and hence drop
out of the survey in round 4. Although our qualitative interviews with people who dropped out
between survey 2 and 3 (immediate and 1-week follow-up) suggests that other factors (lack of time,
confusion over process) were stronger drivers and many of these interviewees had taken actions
(Appendix 1).
The other interesting finding is that respondents are clearly more likely to act on stated intentions to
act for the ‘easy’ actions. 55 per cent of study participants who had indicated that they intended to
re-read the brief reported having done so after one week, and 46 per cent after three months. For
sending, re-reading and telling someone about the policy brief the intention to act was acted upon in
more than 50 per cent of the cases in survey round 3 and more than 46 per cent of cases in survey
round 4.

57 What Difference does a Policy Brief Make? Full Report of an IDS, 3ie, Norad study Beynon, P.; Chapoy, C.; Gaarder, M. and Masset, E.
Table 3.17 Proportion of respondents carrying out the intended actions
Action % carrying out intended action
after 1 week
% carrying out intended action after
3 months Re-read the policy brief 55% (85 / 154) 46% (57 / 123)
Send the policy brief to someone else 54% (74 / 138 ) 56% (58 / 103)
Tell someone about the key message of the policy brief
60% (84 / 141) 61% (67 / 109)
Write a blog or article 26% (5 / 19) 29% (6 / 21)
Read the full report of the study discussed in the policy brief
26% (26 / 99) 39% (29 / 75)
Source more information about some/all of the studies discussed in the brief
41% (35 / 86) 37% (25 / 67)
Source other research/information related to the topic of the policy brief
40% (38 / 94) 37% (26 / 71)
Review your current policies/ practices regarding the topic of the policy brief
35% (24 / 68) 33% (17 / 52)
Review your approach to researching/evaluating an intervention related to the topic of the policy brief
38% (35 / 91) 35% (23 / 66)
Change your current policies/practice regarding the topic of the policy brief
35% (9 / 26) 39% (7 / 18)
Commission new research related to the topic of the policy brief
20% (4 / 20) 16% (3 / 19)
We find that the Authority effect persists into actions related to sharing the messages of the brief
While declarations of intentions may be easy to make, we are particularly interested in finding out
whether these intentions are actually converted into actions. A weakness of our study is of course
that the actions are also self-declared, so people could potentially choose to appear consistent by
pretending to have done what they intended to do.

58 What Difference does a Policy Brief Make? Full Report of an IDS, 3ie, Norad study Beynon, P.; Chapoy, C.; Gaarder, M. and Masset, E.
Tables 3.18 and 3.19 report the results (later in this section). We find that the authority effect on
readers’ intentions to ‘send the policy brief to someone else’ and on ‘intending to tell someone about
the key messages’ persists into actions, but only when we exclude the variable ‘convincing’ from the
regression analysis. In other words, the fact that readers found the policy brief with an authority
piece convincing seems to explain why people were more inclined to share this brief. We further find
that all three treatment groups are significantly less likely than the placebo control group to source
more information and research about the topic. At 3 months’ follow-up, we observe that the readers
of the short brief are less likely than the others to report having reviewed policies.
Gender and self-perceived levels of influence also affect respondents’ declared actions Policy influence at the central and local levels appears to affect 1-week follow-up actions much the
same way it did intended actions one week earlier, with influence at central level only making it more
likely that the brief is sent to someone else, and local level influence making several of the other
actions more likely (Table 3.18). At 3 months’ follow-up, the only significant findings for those with
high self-reported influence in central government is that they are significantly less likely to have re-
read the policy brief or sourced more information than others. Self-declared influence in local
government continues to make several of the actions more likely (Table 3.19).
The significance of the gender variable has decreased when looking at actual reported actions. At 1
week follow-up, women are less likely to report having re-read the brief or the full report, they are
less likely to have told someone about the findings, and they are less likely to report having
resourced more information or research (Table 3.18). At 3 months’ follow-up, we find that the actions
they report significantly less of are different from the 1 week survey; they are here less inclined to
share the findings (send, tell or blog), as well as reviewing policies according to the insights gained
(Table 3.19). The main insight to be gauged from this analysis is that relative to men, women may be
more cautious in stating intentions to act than men, but that some of these differences decrease
when looking at actual actions.
Finally, it may be worth noting that higher education consistently makes blogging less likely (Tables
3.18 and 3.19). This could potentially have implications for the quality of blogs, as well as the chance
of reaching academic audiences with this type of activity.
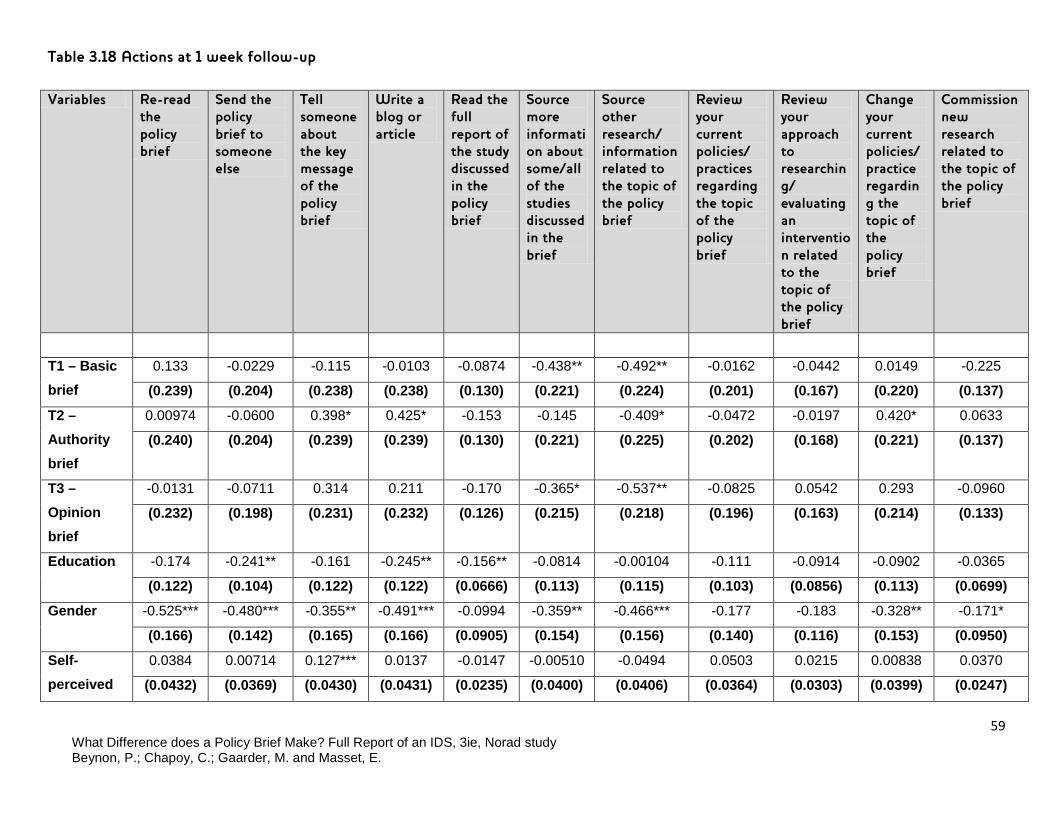
59 What Difference does a Policy Brief Make? Full Report of an IDS, 3ie, Norad study Beynon, P.; Chapoy, C.; Gaarder, M. and Masset, E.
Table 3.18 Actions at 1 week follow-up
Variables Re-read the policy brief
Send the policy brief to someone else
Tell someone about the key message of the policy brief
Write a blog or article
Read the full report of the study discussed in the policy brief
Source more information about some/all of the studies discussed in the brief
Source other research/ information related to the topic of the policy brief
Review your current policies/ practices regarding the topic of the policy brief
Review your approach to researching/ evaluating an intervention related to the topic of the policy brief
Change your current policies/ practice regarding the topic of the policy brief
Commission new research related to the topic of the policy brief
T1 – Basic brief
0.133 -0.0229 -0.115 -0.0103 -0.0874 -0.438** -0.492** -0.0162 -0.0442 0.0149 -0.225
(0.239) (0.204) (0.238) (0.238) (0.130) (0.221) (0.224) (0.201) (0.167) (0.220) (0.137)
T2 – Authority brief
0.00974 -0.0600 0.398* 0.425* -0.153 -0.145 -0.409* -0.0472 -0.0197 0.420* 0.0633
(0.240) (0.204) (0.239) (0.239) (0.130) (0.221) (0.225) (0.202) (0.168) (0.221) (0.137)
T3 – Opinion brief
-0.0131 -0.0711 0.314 0.211 -0.170 -0.365* -0.537** -0.0825 0.0542 0.293 -0.0960
(0.232) (0.198) (0.231) (0.232) (0.126) (0.215) (0.218) (0.196) (0.163) (0.214) (0.133)
Education -0.174 -0.241** -0.161 -0.245** -0.156** -0.0814 -0.00104 -0.111 -0.0914 -0.0902 -0.0365
(0.122) (0.104) (0.122) (0.122) (0.0666) (0.113) (0.115) (0.103) (0.0856) (0.113) (0.0699)
Gender -0.525*** -0.480*** -0.355** -0.491*** -0.0994 -0.359** -0.466*** -0.177 -0.183 -0.328** -0.171*
(0.166) (0.142) (0.165) (0.166) (0.0905) (0.154) (0.156) (0.140) (0.116) (0.153) (0.0950)
Self- perceived
0.0384 0.00714 0.127*** 0.0137 -0.0147 -0.00510 -0.0494 0.0503 0.0215 0.00838 0.0370
(0.0432) (0.0369) (0.0430) (0.0431) (0.0235) (0.0400) (0.0406) (0.0364) (0.0303) (0.0399) (0.0247)

60 What Difference does a Policy Brief Make? Full Report of an IDS, 3ie, Norad study Beynon, P.; Chapoy, C.; Gaarder, M. and Masset, E.
influence in central government
Self-perceived influence in local government
0.0196 0.0114 -0.00359 0.0800* 0.0427* 0.0480 0.0727* 0.0766** 0.0554* 0.0995** 0.0219
(0.0433) (0.0369) (0.0431) (0.0431) (0.0236) (0.0400) (0.0406) (0.0365) (0.0303) (0.0399) (0.0247)
Constant 3.282*** 3.149*** 2.203*** 3.313*** 1.382*** 2.129*** 2.058*** 1.257* 1.065* 1.503* 0.665
(0.832) (0.709) (0.828) (0.829) (0.453) (0.769) (0.781) (0.701) (0.582) (0.768) (0.475)
Obs 262 262 262 262 262 262 262 262 262 262 262
R-squared 0.066 0.068 0.100 0.095 0.051 0.051 0.077 0.080 0.056 0.087 0.064
Note: Standard errors in parentheses. *** p<0.01, ** p<0.05, * p<0.1.

61 What Difference does a Policy Brief Make? Full Report of an IDS, 3ie, Norad study Beynon, P.; Chapoy, C.; Gaarder, M. and Masset, E.
Table 3.19 Actions at 3 months’ follow-up Variables Re-read
the policy brief
Send the policy brief to someone else
Tell someone about the key message of the policy brief
Write a blog or article
Read full report of the study discussed in the policy brief
Source more information about some/all of the studies discussed in the brief
Source other research/ information related to the topic of the policy brief
Review your current policies/ practices regarding the topic of the policy brief
Review your approach to researching/ evaluating an intervention related to the topic of the policy brief
Change your current policies/ practice regarding the topic of the policy brief
Commission new research related to the topic of the policy brief
T1 – Basic brief
-0.337 -0.370 0.0950 -0.00767 -0.0927 -0.301 -0.562** -0.505** -0.0319 -0.0877 -0.0544
(0.253) (0.226) (0.256) (0.250) (0.146) (0.227) (0.233) (0.217) (0.182) (0.234) (0.146)
T2 – Authority brief
-0.0154 -0.357 0.459* 0.656*** 0.0726 -0.182 0.117 0.0132 -0.155 -0.0620 0.00882
(0.252) (0.225) (0.255) (0.249) (0.146) (0.227) (0.232) (0.216) (0.181) (0.233) (0.146)
T3 – Opinion brief
-0.209 -0.212 0.281 0.328 0.0670 -0.0208 -0.283 0.0544 0.0129 0.255 -0.0809
(0.242) (0.216) (0.245) (0.239) (0.140) (0.217) (0.223) (0.207) (0.174) (0.224) (0.140)
Education -0.377*** -0.260** -0.163 -0.239* -0.247*** -0.253** -0.207* -0.180* -0.254*** -0.139 -0.131*
(0.124) (0.111) (0.126) (0.123) (0.0719) (0.112) (0.115) (0.107) (0.0895) (0.115) (0.0719)
Gender -0.276 -0.300* -0.451** -0.575*** -0.223** -0.176 -0.227 -0.313** -0.194 -0.215 -0.138
(0.176) (0.157) (0.178) (0.174) (0.101) (0.158) (0.162) (0.151) (0.126) (0.162) (0.101)
Self- perceived influence in central governme
-0.0638 0.0247 0.0183 -0.0178 -0.00946 -0.0812* -0.0547 0.0223 -0.000768 0.0149 -0.0359
(0.0491) (0.0438) (0.0497) (0.0486) (0.0284) (0.0441) (0.0452) (0.0421) (0.0353) (0.0454) (0.0284)

62 What Difference does a Policy Brief Make? Full Report of an IDS, 3ie, Norad study Beynon, P.; Chapoy, C.; Gaarder, M. and Masset, E.
nt
Self- perceived influence in local government
0.149*** 0.121*** 0.0972** 0.194*** 0.0356 0.160*** 0.145*** 0.104*** 0.109*** 0.0715* 0.0786***
(0.0461) (0.0411) (0.0467) (0.0456) (0.0267) (0.0414) (0.0425) (0.0396) (0.0332) (0.0426) (0.0267)
Constant 3.995*** 2.744*** 2.342*** 2.933*** 2.034*** 2.529*** 2.420*** 2.003*** 2.007*** 1.690** 1.215**
(0.828) (0.739) (0.839) (0.819) (0.479) (0.744) (0.763) (0.711) (0.596) (0.766) (0.479)
Obs 233 233 233 233 233 233 233 233 233 233 233
R-squared
0.106 0.129 0.092 0.194 0.083 0.103 0.110 0.118 0.128 0.055 0.069
Note: Standard errors in parentheses. *** p<0.01, ** p<0.05, * p<0.1.
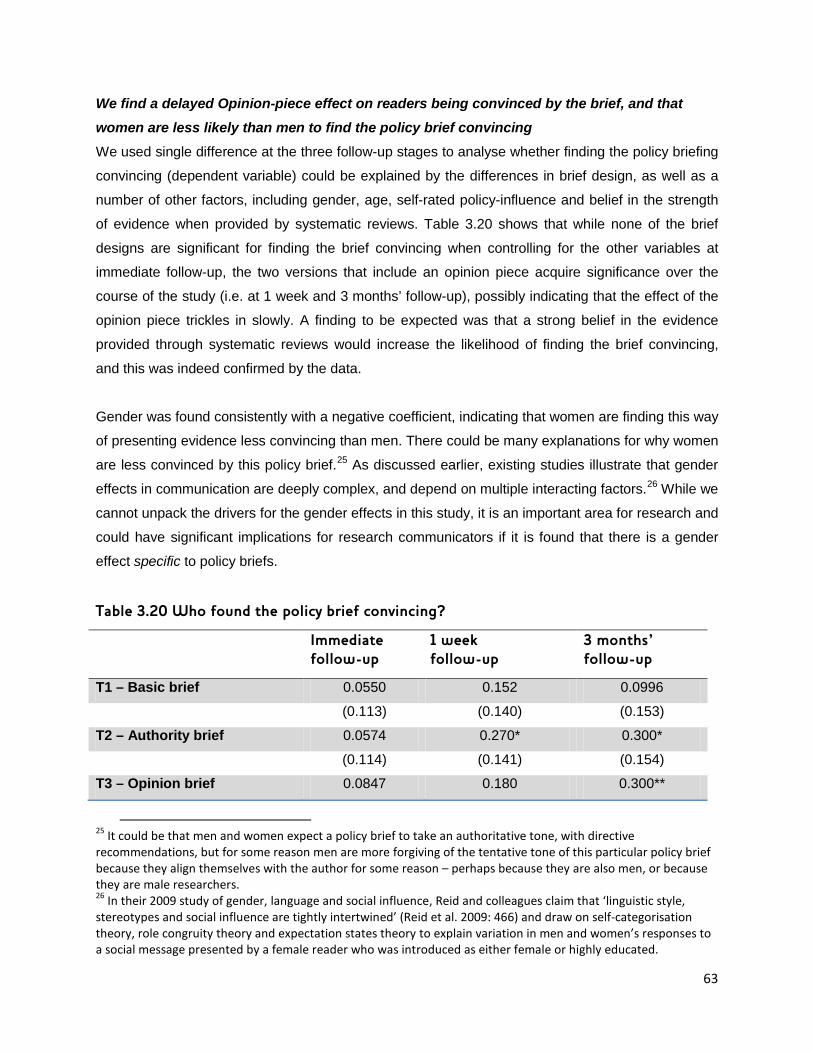
63
We find a delayed Opinion-piece effect on readers being convinced by the brief, and that women are less likely than men to find the policy brief convincing We used single difference at the three follow-up stages to analyse whether finding the policy briefing
convincing (dependent variable) could be explained by the differences in brief design, as well as a
number of other factors, including gender, age, self-rated policy-influence and belief in the strength
of evidence when provided by systematic reviews. Table 3.20 shows that while none of the brief
designs are significant for finding the brief convincing when controlling for the other variables at
immediate follow-up, the two versions that include an opinion piece acquire significance over the
course of the study (i.e. at 1 week and 3 months’ follow-up), possibly indicating that the effect of the
opinion piece trickles in slowly. A finding to be expected was that a strong belief in the evidence
provided through systematic reviews would increase the likelihood of finding the brief convincing,
and this was indeed confirmed by the data.
Gender was found consistently with a negative coefficient, indicating that women are finding this way
of presenting evidence less convincing than men. There could be many explanations for why women
are less convinced by this policy brief.25 As discussed earlier, existing studies illustrate that gender
effects in communication are deeply complex, and depend on multiple interacting factors.26 While we
cannot unpack the drivers for the gender effects in this study, it is an important area for research and
could have significant implications for research communicators if it is found that there is a gender
effect specific to policy briefs.
Table 3.20 Who found the policy brief convincing?
Immediate follow-up
1 week follow-up
3 months’ follow-up
T1 – Basic brief 0.0550 0.152 0.0996
(0.113) (0.140) (0.153)
T2 – Authority brief 0.0574 0.270* 0.300*
(0.114) (0.141) (0.154)
T3 – Opinion brief 0.0847 0.180 0.300**
25 It could be that men and women expect a policy brief to take an authoritative tone, with directive recommendations, but for some reason men are more forgiving of the tentative tone of this particular policy brief because they align themselves with the author for some reason – perhaps because they are also men, or because they are male researchers. 26 In their 2009 study of gender, language and social influence, Reid and colleagues claim that ‘linguistic style, stereotypes and social influence are tightly intertwined’ (Reid et al. 2009: 466) and draw on self-categorisation theory, role congruity theory and expectation states theory to explain variation in men and women’s responses to a social message presented by a female reader who was introduced as either female or highly educated.

64
(0.113) (0.138) (0.149)
Gender -0.237*** -0.298*** -0.238**
(0.0814) (0.0977) (0.105)
Age group -0.0388 -0.00911 -0.0912*
(0.0348) (0.0436) (0.0472)
Belief in effectiveness of actions Finally, we asked respondents about what effect they expected the various actions would have on
the results they achieved through their work. Results are reported in Tables 3.21 and 3.22. Not
surprisingly, we found that the correlation between carrying out a certain action and believing it to
have positive effects on results was very high for all actions. Two other observations may be worth
making: (i) higher education seems to make people more sceptical to the effectiveness of the
following activities: telling someone about the key messages, reviewing policy, and reviewing
research approach; (ii) organisation type, which is loosely organised from international development
agencies at one end to more academic institutions at the other, was found to affect the belief in
seeking more knowledge (sourcing information and research, commissioning additional research). In
particular, the more academically oriented institutions had a higher belief in this than the
international development-oriented ones.
By asking the participants in the survey first whether they had undertaken any of the listed actions,
and immediately thereafter what level of effect they expected the action to have on the results they
achieve through their work, we may have inadvertently introduced a bias through the survey order.
People are likely to want to appear rational by stating that their actions are likely to have significant
effects.

65
Table 3.21 Expected results of actions for respondents with different features Variables Re-read
the policy brief
Read the full
report of the study discussed
in the policy brief
Send the policy
brief to someone
else
Tell someone
about the key message of the policy brief
Write a blog or article
Source more
information about
some/all of the studies discussed
in the brief
Source other
research/ information
related to the topic
of the policy brief
Review your
current policies/ practices regarding the topic
of the policy brief
Change your
current policies/ practice regardin
g the topic of
the policy brief
Review approach to researching/ evaluating
an intervention related to
the topic of the policy
brief
Commission new
research related to the
topic of the
policy brief
Education -0.0471 -0.0509 -0.0375 -0.107** -0.0410 -0.0263 -0.0349 -0.0775** -0.0298 -0.122*** 0.00920
(0.0564) (0.0543) (0.0495) (0.0508) (0.0362) (0.0480) (0.0444) (0.0370) (0.0405) (0.0427) (0.0307)
Gender -0.0894 0.0886 0.0559 0.0971 0.0760 0.131** -0.0579 0.0109 0.0755 0.0697 0.0226
(0.0751) (0.0723) (0.0656) (0.0673) (0.0474) (0.0636) (0.0591) (0.0488) (0.0534) (0.0566) (0.0406)
Age group -0.00699 -0.0172 0.00711 0.000989 -0.0269 -0.00825 -0.0258 -0.0154 -0.00991 0.0155 -0.0106
(0.0332) (0.0318) (0.0294) (0.0299) (0.0211) (0.0282) (0.0261) (0.0218) (0.0239) (0.0252) (0.0181)
Organisation type
-0.00407 0.00391 0.00509 -0.00745 0.00338 0.0133* 0.0197*** 0.00628 0.00358 0.00763 0.0111**
(0.00859) (0.00825) (0.00757) (0.00773) (0.00551) (0.00731) (0.00677) (0.00564) (0.00617) (0.00652) (0.00468)
Self-perceived influence in central government
0.0276 0.0132 0.00229 0.0146 0.00525 0.0176 0.0260* 0.0124 0.0138 0.0181 0.0196*
(0.0190) (0.0183) (0.0169) (0.0171) (0.0121) (0.0162) (0.0151) (0.0125) (0.0137) (0.0144) (0.0104)
Self-perceived influence in
0.00746 -0.0174 0.0206 0.0315* 0.00571 0.00710 -0.00502 0.000324 -
0.000912
0.00230 0.00779
(0.0191) (0.0184) (0.0168) (0.0173) (0.0123) (0.0164) (0.0152) (0.0126) (0.0138) (0.0147) (0.0104)

66
local government
Found the brief convincing
0.190*** 0.109** 0.0586 0.0715 0.0453 0.0495 0.0662* 0.0474 0.0928*** 0.0884** 0.0500*
(0.0497) (0.0477) (0.0446) (0.0469) (0.0308) (0.0408) (0.0383) (0.0312) (0.0344) (0.0367) (0.0265)
Constant 0.403 0.187 0.0120 0.420 0.168 -0.182 0.186 0.427* -
0.000254
0.417 -0.223
(0.377) (0.364) (0.328) (0.339) (0.239) (0.318) (0.294) (0.244) (0.267) (0.283) (0.203)
Observations
262 262 262 262 262 262 262 262 262 262 262
R-squared 0.383 0.448 0.461 0.420 0.430 0.474 0.573 0.588 0.453 0.628 0.578
Note: Standard errors in parentheses *** p<0.01, ** p<0.05, * p<0.1.

67
Table 3.22 Expected results of actions for respondents who carried out those actions Variables Re-read
the policy brief
Read the full
report of the study discussed
in the policy brief
Send the policy
brief to someone
else
Tell someone about the
key message of the policy brief
Write a blog or article
Source more
information
about some/all of the studies discussed in the
brief
Source other
research/
information
related to the
topic of the
policy brief
Review your
current policies/ practices regardin
g the topic of
the policy brief
Change your current policies/ practice regarding the topic of the policy brief
Review approach to researching/evaluating
an intervention related to the topic of the policy
brief
Commission new
research related to
the topic of the policy
brief
Re-read the policy brief
0.248***
(0.0293)
Read the full report of the study discussed in the brief
0.400***
(0.0330)
Send the policy brief to someone else
0.320***
(0.0264)
Tell someone about the key message of the policy brief
0.273***
(0.0275)
Write a blog or article
0.408***
(0.0333)

68
Source more info about some/all of the studies discussed in the brief
0.363***
(0.0258)
Source other research/info related to the topic of the policy brie
0.389***
(0.0237)
Review your current policies/ practices re the topic of the policy brief
0.373***
(0.0219)
Change your current policies/practice re the topic of the policy brief
0.370***
(0.0291)
Review your approach to researching/evaluating an intervention related to the topic of the policy brief
0.418***
(0.0232)
Commission new research related to the topic of the brief
0.439***
(0.0270)

69
Constant 0.403 0.187 0.0120 0.420 0.168 -0.182 0.186 0.427* -
0.00025
4
0.417 -0.223
(0.377) (0.364) (0.328) (0.339) (0.239) (0.318) (0.294) (0.244) (0.267) (0.283) (0.203)
Observations 262 262 262 262 262 262 262 262 262 262 262
R-squared 0.383 0.448 0.461 0.420 0.430 0.474 0.573 0.588 0.453 0.628 0.578
Note: Standard errors in parentheses *** p<0.01, ** p<0.05, * p<0.1
70
4 Discussion
4.1 Weak overall effect on beliefs, but a tendency to share
Overall, we found the policy brief had a fairly weak effect on readers’ beliefs; creating more
evidence-accurate beliefs where no priors were held, but only slightly affecting those who entered
the study with prior beliefs.
We could explain this finding as an anomaly of the policy brief in question – it contained a number of
complex messages about the inconclusiveness of evidence that were nuanced in their presentation
throughout the brief. A thematic analysis of participants’ responses to the question ‘In your own
words what was the key message of the brief?’ showed readers took away many and varied
messages: some in keeping with the key messages of the brief (e.g. that bio-fortification is promising
but not proven), some contrary to the key messages of the brief (e.g. that bio-fortification is a proven
solution), some very generic messages incidental to the systematic review (e.g. that child nutrition is
a problem) and some that lead us to question whether the respondent read the brief at all (e.g.
directly quoting the first line of the brief ‘Agriculture interventions alone will not eradicate
malnutrition’.).27 It is possible that a policy brief dealing with a clearer cut set of messages may be
more effective in changing beliefs.
Attitude change research provides some alternative explanations. Studies of media communication
have focused on the phenomenon that different individuals may receive the same message but act
on it quite differently. Influential studies conducted by Carl Hovland throughout his career (for
example, Hovland 1954) concluded that people are very selective in how they use media; in
particular regarding exposure, interpretation of information, and retention of information obtained
through the media. In particular, three types of selectivity are relevant to our study:
• selective exposure (whereby people seek out not only topics of interest to them but more
importantly viewpoints with which they expect to agree);
• selective perception (whereby people interpret facts to suit their existing biases), and;
• selective retention (whereby people remember messages that support their opinion longer
than they remember opposing messages).
27 See Appendix 4 for a full summary of this qualitative analysis.

71
Selective exposure may explain the correlation we found between relevance and attrition; meaning
participants whose work does not touch on agriculture and nutrition were more likely to drop out of
the study. Suppose that people with strong prior beliefs are less likely to change them, and that
these people are also more likely to a) be attracted to the study in the first place – selective
exposure and b) stay in the study to the end. Were this the case, we would expect to find stronger
effects in a randomly chosen study sample representative of the general population. In reality,
however, readers of a policy brief will be self-selecting and therefore the concept of selective
exposure has implications for how a policy brief is branded, presented and disseminated to make it
appealing to the widest possible audience.
We found examples of selective perception and selective retention in qualitative interviews with five
participants who maintained an overstated belief in the effectiveness and strength of evidence for
bio-fortification and/or home gardens throughout the study period. For two of these interviewees their
work did not touch on agriculture and/or nutrition. One interviewee reported developing his prior
beliefs based on reading done some time ago; and another was not clear about how his belief was
formed, but did have a strong opinion that ‘bio-fortification is scientifically effective but socially
unacceptable to much of the population in the developing world where it is needed’. Both of these
interviewees had weak recall of the messages in the brief, and of the fact that the message of the
brief did not support their views (selective retention). It is likely that readers of a policy brief that
deals with a topic not directly relevant to their work pay less attention to the messages it contains. In
these two cases, the combination of prior belief and ‘light’ reading of the policy brief resulted in the
policy brief not affecting any change.
Three further interviewees, whose work is directly related to agriculture and/or nutrition, also
maintained an overstated belief about the effectiveness of bio-fortification and home gardens. They
had a stronger recall of the messages in the policy brief; however, two did not recognise that the
brief presented a more cautious message about the effectiveness and evidence for bio-fortification
than they presented in their survey responses (selective perception). The final interviewee who
maintained a strong belief did recognise the disparity between his view and the message of the brief.
He explained that his view was formed through experience and he thought the policy brief seemed to
show up a lack of readily available empirical data for or against bio-fortification rather than disprove
his prior belief.
Interviewees who formed and reformed their beliefs throughout the study had mixed views about the
role of the policy brief in this process. Some interviewees cited other sources of information including
personal experience, the internet and a BBC radio programme for changing their views:

72
It was probably more to do with experience I had gained subsequently in actual practical work I
had done. I had done some focus groups with farmers at that stage (3 months after reading the
policy brief) so I think it (change in opinion) was a general reviewing of the situation in the light of
practical observations and experience.
On the surface, finding that a significant proportion of participants pass on the message of the policy
brief would appear to be a good outcome for research communication – this activity would a) keep
our messages in circulation, thus increasing the chance they would land on the right desk at the right
time to influence the right decision-making process, and b) add currency to our messages as they
are brokered from a trusted source, thus increasing the chance they will be read by the receiver.
However, when coupled with a limited effect on belief, this finding gives us pause for thought.
Returning to our simple theory of change presented in the introduction to this study, we can
immediately add layers of complexity as readers move directly from receiving evidence to taking
action, either without engaging with that evidence at all (i.e. without reading it) or with engagement
but without an updated set of beliefs (Figure 4.1).
Figure 4.1 Shortcuts through the simple theory of change
Whatever the reason for the weak effect that the policy brief has on beliefs, if readers are telling
other people about the message (which we find that they do) without fully understanding it
themselves, this could have potentially negative outcomes for the researchers’ overall goal –
bringing about evidence-informed policy decisions. We need to further consider how we construct
policy briefs to ensure the key message is clear and easily recounted, and to encourage people who
then broker that knowledge to pass on the full brief rather than their interpretation of it.

73
4.2 The Authority and Opinion effects influence behaviour more so than beliefs
In their study of policymakers’ knowledge environments, the Research and Policy in Development
(RAPID) Group at ODI and the Science and Development Network (SciDev.Net) found that half of
policymakers and even more researchers felt that there is insufficient dissemination of research
findings for policy uptake and that as a valued communication tool, policy briefs may help to address
this gap (Jones and Walsh 2008). Thus justifying the demand for policy briefs, Jones and Walsh go
on to list a number of ‘key ingredients of effective policy briefs’, including two that are of interest to
us: 1) authority, described as a messenger (individual or organisation) has credibility in eyes of
policymaker, and 2) presentation of evidence-informed opinions, described as presentation of
author’s own views about policy implications of research finding (ibid: 4).
We explored the impact of Authority and Opinion in our study, and found no significant effect on
beliefs but some effect on intended follow-up behaviours. We asked fourteen study participants for
their views about the Authority effect. Interviewees had mixed views about whether Haddad’s
authorship influenced their reading – dependent on whether they were familiar with the author at all.
In general, interviews seemed to show that readers who have a closer relationship with the author or
his work were more likely to perceive an Authority effect. This is not to say they were more likely to
agree or change their beliefs but they did feel they were more likely to engage with the policy brief
and recall its message. Perhaps the Authority effect is to make the brief more memorable which in
turn leads to a greater likelihood of readers sharing the message with someone else.
These findings suggest a complex and yet unresolved interaction between readers and Authority
that would be interesting to unpack further for research communications going forward.
4.3 Gender effect – why are women less likely to act?
One surprising finding of the study was consistent negative correlation between being a woman and
intentions to act. As discussed earlier, we theorised a number of reasons that differences could exist
between men and women when it came to self-reporting behaviour in a survey. One of these
possibilities was a ‘boasting’ effect, whereby men over-report their actions and women under-report.
Our own study did not find greater or lesser honesty by either gender in their survey responses.
Specifically, we asked respondents at baseline whether they were familiar with the work of four
sector experts and one fictitious expert, Antony Sturman. We found no gender bias in ‘boasting’
knowledge of Sturman, meaning we have no basis for concluding that men over-reported their
behaviours in this study compared to women.
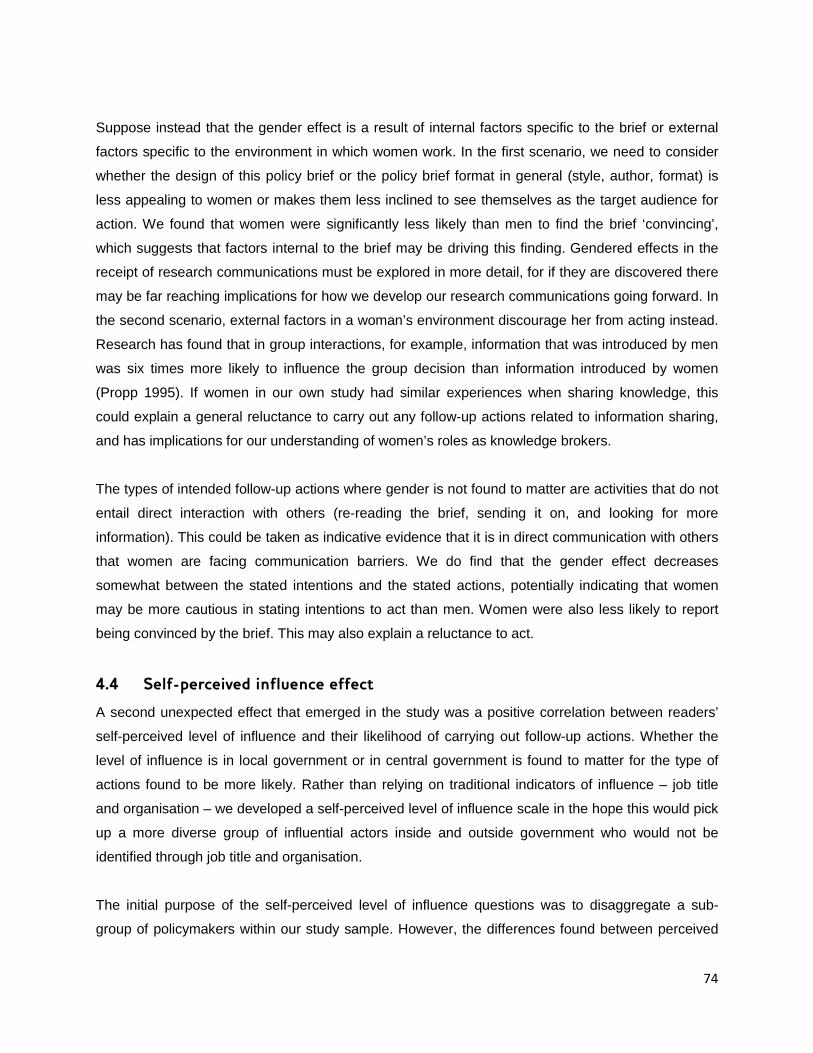
74
Suppose instead that the gender effect is a result of internal factors specific to the brief or external
factors specific to the environment in which women work. In the first scenario, we need to consider
whether the design of this policy brief or the policy brief format in general (style, author, format) is
less appealing to women or makes them less inclined to see themselves as the target audience for
action. We found that women were significantly less likely than men to find the brief ‘convincing’,
which suggests that factors internal to the brief may be driving this finding. Gendered effects in the
receipt of research communications must be explored in more detail, for if they are discovered there
may be far reaching implications for how we develop our research communications going forward. In
the second scenario, external factors in a woman’s environment discourage her from acting instead.
Research has found that in group interactions, for example, information that was introduced by men
was six times more likely to influence the group decision than information introduced by women
(Propp 1995). If women in our own study had similar experiences when sharing knowledge, this
could explain a general reluctance to carry out any follow-up actions related to information sharing,
and has implications for our understanding of women’s roles as knowledge brokers.
The types of intended follow-up actions where gender is not found to matter are activities that do not
entail direct interaction with others (re-reading the brief, sending it on, and looking for more
information). This could be taken as indicative evidence that it is in direct communication with others
that women are facing communication barriers. We do find that the gender effect decreases
somewhat between the stated intentions and the stated actions, potentially indicating that women
may be more cautious in stating intentions to act than men. Women were also less likely to report
being convinced by the brief. This may also explain a reluctance to act.
4.4 Self-perceived influence effect
A second unexpected effect that emerged in the study was a positive correlation between readers’
self-perceived level of influence and their likelihood of carrying out follow-up actions. Whether the
level of influence is in local government or in central government is found to matter for the type of
actions found to be more likely. Rather than relying on traditional indicators of influence – job title
and organisation – we developed a self-perceived level of influence scale in the hope this would pick
up a more diverse group of influential actors inside and outside government who would not be
identified through job title and organisation.
The initial purpose of the self-perceived level of influence questions was to disaggregate a sub-
group of policymakers within our study sample. However, the differences found between perceived

75
influence at the central and local level in terms of correlations with intended and completed follow-up
actions could suggest a number of other factors at play. Influence on central government is found to
be positively correlated only with sending the policy brief on to others. Influence on local
government, on the other hand, is found to positively correlate with telling others about the findings,
blogging, as well as reviewing and changing policies and research approaches.
Suppose firstly that a higher self-perception of influence does reflect higher level of actual influence.
Readers who have more influence may be more likely to recognise themselves as the audience for
the policy brief and be more inclined to take actions as a result. Suppose instead that self-perception
of influence does not reflect actual influence. It may be that the influence scale is instead picking up
a personality factor, such as a high internal locus of control. It would stand to reason that readers
who believe their actions have effect would be more inclined to take action at all. Both of these
observations could explain the findings for local level influence, but what about influence on central
government? One possibility is that our survey options do not adequately capture the type of actions
that people use to influence policy at central level. Another possibility is that for central influence,
self-assessment does not match reality.
Whatever the explanation, it could be that targeting these ‘movers and shakers’ could provide good
outcomes for research communications work. If they do in fact have influence, they are recognising
themselves as the audience and responding to the policy brief, if they do not have influence they are
keeping our ideas in circulation and potentially brokering knowledge to others who do. Furthermore,
if the respondents in our study are representative of those on the periphery of a sophisticated
influencing strategy, they may be contributing to knowledge circulation in ways previously
underestimated.
76
5 Conclusions The study set out to explore the effectiveness of a policy brief for creating evidence-accurate beliefs
and prompting actions by its readers.
We find that the policy brief increases the proportion of respondents who have an opinion about the
strength of evidence and effectiveness of two policies under discussion (bio-fortification and home
gardens), and is more effective in creating evidence-accurate beliefs among respondents with no
priors, than changing beliefs of respondents who already have an opinion. We find that with regard
to beliefs, the impact of the policy brief seems to be independent of the specific form, meaning that
the Opinion and Authority effects suggested by Jones and Walsh (2008) were not supported in this
case.
Unsurprisingly, readers in this study were more inclined to report intentions and actual follow-up
actions that require little effort or co-operation from others (e.g. revise and share the message of the
policy brief). Findings about the types of actions readers carry out help to unpack further our
assumptions about how knowledge continues to circulate which has implications for research
communication. Interestingly, when it comes to actions we find that the form of the policy brief does
matter – we find a clear Authority effect, and opinion-piece effect on readers’ intentions to share the
messages of the brief.
The study findings suggest a complex and yet unresolved interaction between readers and both
opinion and Authority effects. At the very least we found no negative impact associated with the
opinion and authority treatments, and some positive impacts. While further research is required to
unpack these effects further, at this stage it would seem advisable for those working in research
communication to consider including such features within policy briefs they are preparing.
Some other factors are also closely correlated to intended and carried out actions. In particular,
being a woman is negatively correlated with most actions, while rating highly one’s self-perceived
level of influence is positively correlated with most actions. These findings require further exploration
and could have implications for how we design policy briefs, how we target movers and shakers and
how we enable women to act as knowledge brokers.
While we have established through this study that the effectiveness of research communication tools
can be evaluated through an experimental study design we would not recommend this approach as

77
standard for evaluating all research communication activities in future. However, we would
recommend further targeted studies to legitimise the significant spending on research
communication approaches, to improve our understanding about what works in what situation to
achieve research uptake and finally to further improve our knowledge about how best to evaluate
complex processes of influence. The study does have limitations. Nevertheless, it can be considered
a pioneer, and a contribution to what in the future may constitute a larger body of knowledge around
how to best communicate evidence to influence policy.

78
Appendix 1: Round one qualitative interviews
The focus was on respondents who had signed up for the study, completed the immediate survey
but failed to complete the 1-week survey.
Sampling process Excel data was extracted for the immediate and one week surveys. A small macro was written to
compare names, and extract the ones who did not appear on both lists. This was not very complete
and we had no confidence in the output as some people had signed in with slight variants of their
names. We therefore manually checked that the names on the list did not show on the one-week
survey list. Having obtained a final list of ‘immediate NOT one week’ we highlighted every third
name. Counting off 15 respondents we checked that they had indeed signed up for being contacted.
Where a respondent had not opted in to being contacted we went to the next person on the list.
Email invitation Once the final list of interviewees had been created, we identified their full ‘sign in’ response and
‘immediate’ response, and emailed them a personalised invitation to have a 10-minute conversation.
Subject: Research comms impact study – phone call?
To: Actual email address as on survey
Actual name of person as they put in survey (full name, no attempt to abbreviate or find first
name only)
I would like to thank you for undertaking the survey after receiving the Policy Brief.
We have selected 10 respondents at random to have a brief 10 to 15 minute phone call with, to
understand the context of your responses and to give you a chance to expand on some of your
responses.
I would very much like to have such a conversation with you. I hope this might be acceptable and
that I might ring you on Actual Number or contact skype address. Is there a particular time over
the next 2 days that would be convenient to you?
Thank you for your response,
Regards
Name of researcher
Manager Impact and Learning Team

79
This message is for the addressee only and may contain privileged or confidential information. If
you have received it in error, please notify the sender immediately and delete the original. Any
views or opinions expressed are solely those of the author and do not necessarily represent
those of IDS.
Institute of Development Studies
at the University of Sussex, Brighton BN1 9RE
Tel: +44 (0)1273 606261; Fax: +44 (0)1273 621202
IDS, a charitable company limited by guarantee:
Registered Charity No. 306371; Registered in England 877338; VAT No. GB 350 899914
The responses varied from ‘call me anytime’ to a specific time and date. In a couple of cases the
time and date were not suitable and a subsequent email was sent asking for an alternative.
The phone call A call was made using skype to call out, either to a mobile phone, landline or skype. In all but one
case (Pakistan, to a mobile, and he was at a festival with significant background noise) the quality of
the call did not affect the conversation.
1) After introductions and confirmation that the time was convenient, the interviewer thanked
them for participating in the study and outlined how these calls were to provide context for
their answers. They were asked to describe their organisation and work in brief.
2) Depending on the answer, the next question explored the relevance, or if the relevance was
obvious because their programme of work was with Nutrition in Children, explored what they
had taken away from the briefing e.g. ‘So, how is the policy brief relevant to your work?’, or
‘So was there any particularly relevant items in the policy brief for your work?’
3) With the responses in front of the interviewer, if there had been a particular difference in their
answers from sign-up to immediate, this was discussed by saying ‘I notice that you seem to
have gained some knowledge about cash transfers from the brief, do you recall how the brief
helped you on this?’
4) Most respondents stated that the brief was good quality. The question was asked ‘So I see
that in the survey you thought the briefing was of good quality, what was it you liked about
it?’
5) Some respondents had the Opinion piece. If they did they were asked ‘The briefing had an
opinion piece – did you find this added to your understanding of the subject? Do you feel the
mix of facts and figures with opinion was balanced?’

80
6) Depending on the relationship established28 during the conversation, the question was asked
‘I notice that you didn’t fill in the second one-week later survey, was there any particular
reason for this?’
In some cases the ‘thank you’ for their country was looked up on the internet and some attempt was
made to conclude the meeting in their local language. In two cases, the interviewer promised to send
further information on related subjects (e.g. climate change).
A follow-up email was sent thanking them for their time.
Findings In total, ten participants were interviewed at this stage in the study, with five either not responding to
our invitation or responding positively but failing to connect. The interviews suggested that the
primary reasons for non-participation in the 1-week survey were: not receiving an invitation for the 1-
week survey or not understanding that the 1-week survey was different from the immediate survey
and lack of time. Despite dropping out of this round of the study, many interviewees reported having
taken follow-up actions to share information from the brief (Table 1.1).
Table A1.1 Round 1 qualitative interviews
BASIC
BRIEF
Had email communication. Initially, she thought she hadn’t participated in this study,
but after several emails established she had. At this point, I thought it better to ask
some brief questions via email rather than pursue a telephone interview. Retired
Gender advisor for CIDA, working for a Women’s Research Centre in South Asia.
‘The exercise has a direct relevance in its application to the health, malnutrition and
agricultural solutions and an indirect relevance in the context of investigating, looking
into and choosing from among several options of direct and indirect solutions to
development issues. I think there was some reference to a World Bank proposition
with the warning that even suggestions from such bodies should be tested and re-
tested. Ever so often the development worker is faced with the dilemma of following
Policies and instructions from funders, governments and even NGOs which may not
or are not the only or best solution to issues. This is not to exclude that the
development workers themselves need to be equally exploratory. …’
28 If the respondent was sending signals of deference to the interviewer, I felt I did not want to ask about why they didn’t do the second survey because it felt like they were being ‘policed’. Our ethics policies suggest that we should not make respondents feel uncomfortable unnecessarily.

81
‘Presuming that the reader is already familiar with the subject the detail is adequate.’
‘I have the opportunity to pass on information from this briefing as the organisation
that I work with currently is focused on research, advising, designing, selecting,
planning and implementing development projects with a range of partners –
government, non-government organisations as well as international agencies and
funders.’
‘I felt that my second questionnaire did not go through the computer (and it vanished!) and when I had no more responses I forgot about it!’
BASIC
BRIEF
Difficult poor quality line. Local NGO lobbying on Child Labour. Used briefing to
support lobbying and general info. Briefing seen as more relevant to international
work, so not passed on locally except for general info. No commentary so didn’t ask.
No follow-up due to time.
BASIC
BRIEF
Lecturer on climate change and livestock. Briefing relevant to: good animals = good
humans. Interested to be connected into climate change networks. Creates briefings
and newspaper articles. Asked specifically about opinion: briefings should be a mix of
facts and opinion. Didn’t ask about why not followed up.
AUTHORITY
OPINION
PIECE
Local NGO (3 HQ staff, 5 in field) doing urban agriculture, vulnerable children –
moved from institutional care to care in community. Briefing helpful for urban
agriculture making people aware of the nutrition aspects of the work. Mix of facts and
opinion workable – opinion grounded the ideas for her. Lack of response was due to being out of Addis and then it was too late.
AUTHORITY
OPINION
PIECE
Local NGO, struggling with funding. Briefing prompted interest in bio-fortification –
went off and did further research and now developing a programme within their
communities – may turn into a major theme of their NGO! Wanted more detail for the
layman, thought the opinion piece was very helpful (had not heard of Lawrence
Haddad – Authority Author). Didn’t remember seeing chaser email for 2nd survey, and so didn’t do because wasn’t aware.
AUTHORITY
OPINION
PIECE
Lecturer in medical Sociology – HIV. Nutrition very relevant – particularly HIV and
diabetes. Felt policymaking dominated by politics, example of messaging about male
circumcision – no one listened to her qualitative research. Policy brief very well
written and she is passing it on to colleagues. Didn’t follow through due to busyness.
UNNAMED
OPINION
PIECE
Journalist in Northern Uganda. Writes in local language on development and health.
Contributes to weekly paper associated with daily new vision paper, and weekly radio
station. Used policy brief in a committee discussion on nutrition at an African

82
University – deciding a national plan to get nutrition onto media agenda. (Had been
trained by Panos on how to report on children). Really appreciated briefing, very well
written. Saw the opinion piece as added value. Didn’t ask about why not second survey.
UNNAMED
OPINION
PIECE
Spoke on very bad Skype line. Tried several times, call quality didn’t improve, but
pursued interview as best we could. Assistant Professor in Development Economics
at a South Asian University. Conducts own research and teaches gender in
development (and other subjects – didn’t catch). Brief was very relevant as he did his
masters on nutrition and rural poverty. Was very interested in the overlap of
health/nutrition/agriculture research. Style of briefing ‘wonderful’ though he thought
there was a lack of distinction in recommending why you should follow a particular
policy/process. As from academic background thought brief needed more data to
validate the conclusions, but for a general reader it was good. Would definitely pass
on, as it was a good starting point for a researcher.
PLACEBO Works in an education institute teaching women on low incomes how to undertake
hospitality skills, in Venezuela. She found the brief interesting and easy to read and
understand. She thought it would be more useful if there were examples from her
local context as this would be directly relevant, though was interested in the global
perspective (as the current political situation in Venezuela encourages introspection!)
She was hoping that she might be able to implement some of the issues raised in the
brief at a local level. She also has a couple of contacts in government – but was
unsure whether this would come to anything. She has since tried to find out more
details on the aims and goals of the MDGs especially in the Latin American context.
She was happy with the balance of opinion and evidence though would obviously
appreciate data from South America. Didn’t know about the third survey but would definitely have done it if she had seen it.
PLACEBO Disaster risk management advisor for Tearfund. Brief not directly relevant to his work
as the MDGs don’t address resilience or risk. Hasn’t directly used or passed on brief,
though has informed some initial organisational thinking on DRM issues post MDGs.
Was a little concerned about lack of evidence in briefing – ‘Practitioners accept a lot
on authority’ – though he would circulate it as it came from a credible source. The
need for more evidence would depend on what the brief was used for. Didn’t see third questionnaire invite – would definitely have done it if he had seen it.
UNNAMED No response

83
OPINION
PIECE
AUTHORITY
OPINION
PIECE
Accepted by email. No interview achieved
PLACEBO
No response
BASIC
BRIEF
No response
BASIC
BRIEF
No response
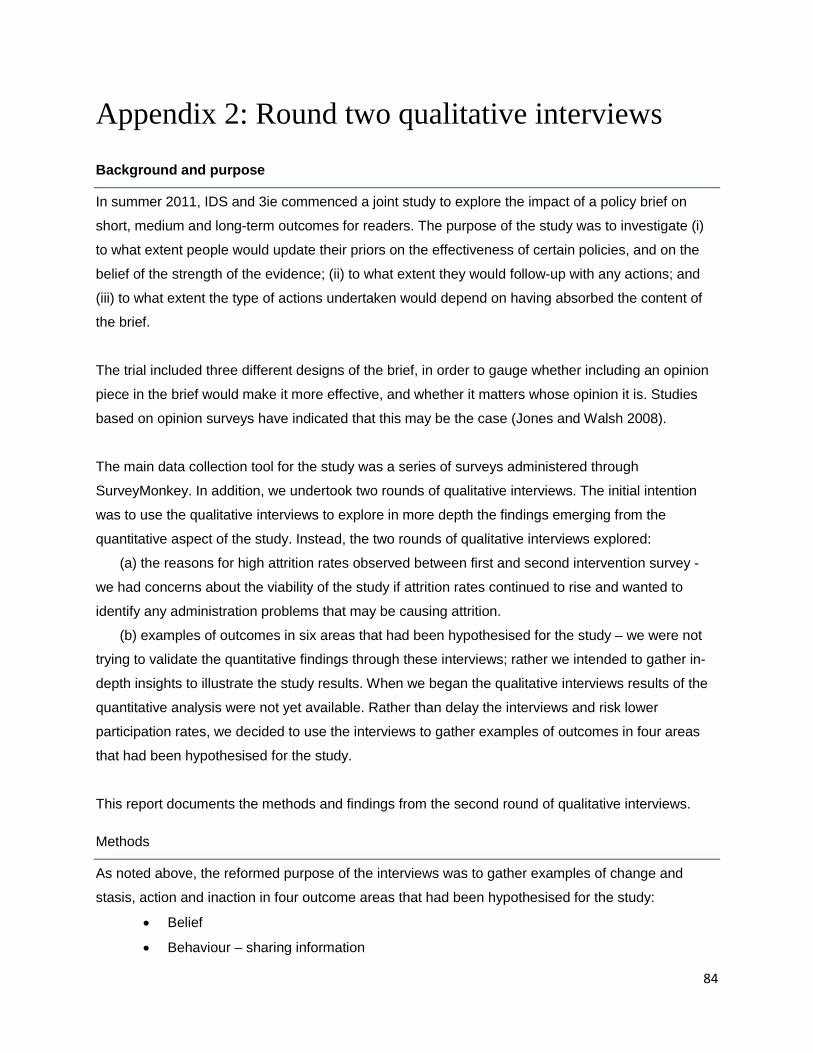
84
Appendix 2: Round two qualitative interviews
Background and purpose
In summer 2011, IDS and 3ie commenced a joint study to explore the impact of a policy brief on
short, medium and long-term outcomes for readers. The purpose of the study was to investigate (i)
to what extent people would update their priors on the effectiveness of certain policies, and on the
belief of the strength of the evidence; (ii) to what extent they would follow-up with any actions; and
(iii) to what extent the type of actions undertaken would depend on having absorbed the content of
the brief.
The trial included three different designs of the brief, in order to gauge whether including an opinion
piece in the brief would make it more effective, and whether it matters whose opinion it is. Studies
based on opinion surveys have indicated that this may be the case (Jones and Walsh 2008).
The main data collection tool for the study was a series of surveys administered through
SurveyMonkey. In addition, we undertook two rounds of qualitative interviews. The initial intention
was to use the qualitative interviews to explore in more depth the findings emerging from the
quantitative aspect of the study. Instead, the two rounds of qualitative interviews explored:
(a) the reasons for high attrition rates observed between first and second intervention survey -
we had concerns about the viability of the study if attrition rates continued to rise and wanted to
identify any administration problems that may be causing attrition.
(b) examples of outcomes in six areas that had been hypothesised for the study – we were not
trying to validate the quantitative findings through these interviews; rather we intended to gather in-
depth insights to illustrate the study results. When we began the qualitative interviews results of the
quantitative analysis were not yet available. Rather than delay the interviews and risk lower
participation rates, we decided to use the interviews to gather examples of outcomes in four areas
that had been hypothesised for the study.
This report documents the methods and findings from the second round of qualitative interviews.
Methods
As noted above, the reformed purpose of the interviews was to gather examples of change and
stasis, action and inaction in four outcome areas that had been hypothesised for the study:
• Belief
• Behaviour – sharing information

85
• Behaviour – seeking information
• Behaviour – other action
Table A2.1 sets out the interview framework for the second round of qualitative interviews. We
developed seven semi-structured questionnaires (see the end of this appendix), one for each cell in
the framework.
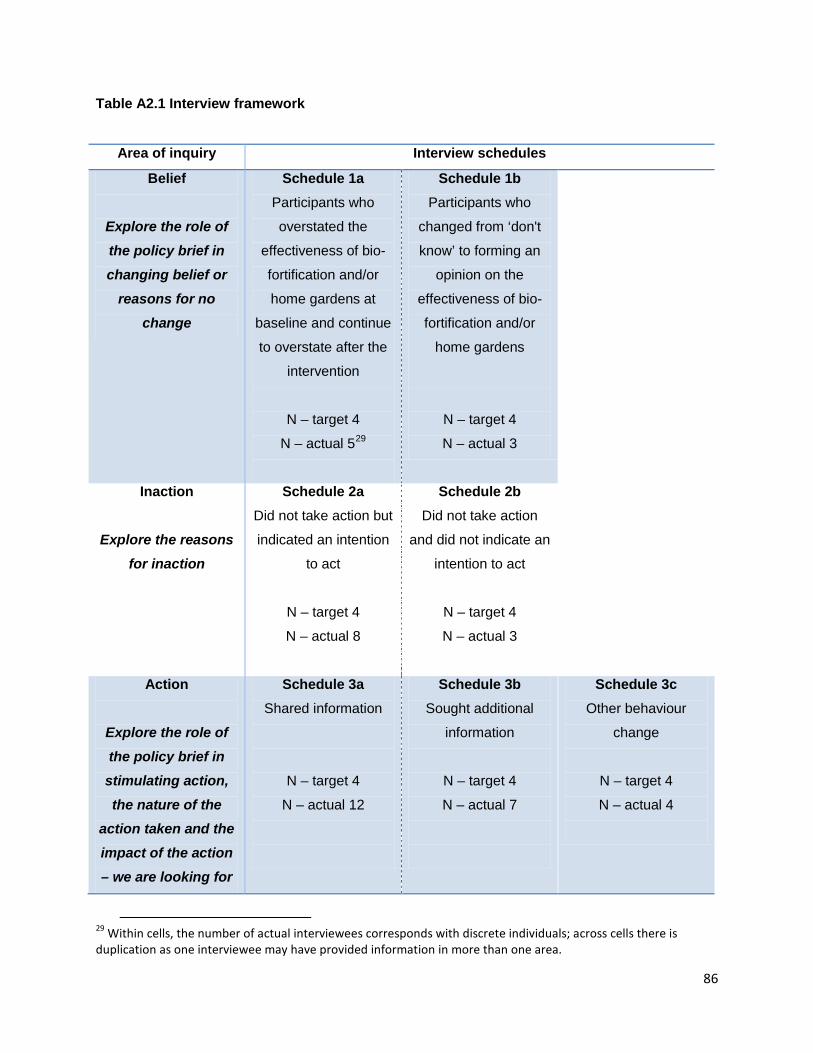
86
Table A2.1 Interview framework
Area of inquiry Interview schedules
Belief
Explore the role of the policy brief in changing belief or
reasons for no change
Schedule 1a Participants who
overstated the
effectiveness of bio-
fortification and/or
home gardens at
baseline and continue
to overstate after the
intervention
N – target 4
N – actual 529
Schedule 1b Participants who
changed from ‘don't
know’ to forming an
opinion on the
effectiveness of bio-
fortification and/or
home gardens
N – target 4
N – actual 3
Inaction Explore the reasons
for inaction
Schedule 2a Did not take action but
indicated an intention
to act
N – target 4
N – actual 8
Schedule 2b Did not take action
and did not indicate an
intention to act
N – target 4
N – actual 3
Action
Explore the role of the policy brief in stimulating action, the nature of the
action taken and the impact of the action – we are looking for
Schedule 3a Shared information
N – target 4
N – actual 12
Schedule 3b Sought additional
information
N – target 4
N – actual 7
Schedule 3c Other behaviour
change
N – target 4
N – actual 4
29 Within cells, the number of actual interviewees corresponds with discrete individuals; across cells there is duplication as one interviewee may have provided information in more than one area.

87
‘interesting stories’ signalled in the 3-
month survey
An eligible interview sample was selected from the full cohort of study participants. To be eligible for
interview, participants must:
• Have completed the 3-month survey;
• Be in one of the three treatment groups, i.e. not the control group
• Have opted-in to a follow-up interview by providing their telephone/skype details
• Fit the profile for at least one of the cells in the interview framework.
From the full eligible sample, we reviewed individual survey responses to identify 8–10 potential
interviewees for each cell in the framework (Table A2.1). The selection was not random; we sought
participants who we thought could provide an interesting story to illustrate the focus of the cell. While
we were mindful to source interviewees from across the 3 treatment groups, this was not a driving
factor in the sample selection.
The interviews were conducted via telephone/skype and took 10–15 minutes to complete. Most of
the interviews were carried out between late December and early January 2011/2012, with a few
conducted as late as February. While we intended to interview 4–5 participants in each cell, the
actual numbers were lower due to:
• Difficulty identifying participants who fit the eligibility criteria and profile of some cells
• Lowering response rates as more time lapsed
In total, 24 participants were interviewed, with at least one interviewee identified specifically to fit the
requirements of each cell in the interview framework. Many interviewees provided information that
cut across more than one interview schedule, e.g. many participants who reported seeking
information also volunteered that they had shared information, and this information was recorded
accordingly.
Findings
Belief – stasis

88
Five interviewees maintained an overstated belief in the effectiveness and strength of evidence for
bio-fortification and/or home gardens throughout the study period. Eliciting reasons for strong prior
beliefs proved difficult, possibly because most of these interviews were undertaken several months
after the intervention. For two of these interviewees their work did not touch on agriculture and/or
nutrition. Respondent AH reported developing his prior beliefs based on reading done some time
ago; and Respondent DN was not clear about how his belief was formed, but did have a strong
opinion that ‘bio-fortification is scientifically effective but socially unacceptable to much of the
population in the developing world where it is needed’. Both of these interviewees had weak recall of
the messages in the brief, and of the fact that the message of the brief did not support their views. It
is likely that readers of a policy brief that deals with a topic not directly relevant to their work pay less
attention to the messages it contains. In these two cases, the combination of prior belief and ‘light’
reading of the policy brief resulted in the policy brief not affecting any change.
Three further interviewees, whose work is directly related to agriculture and/or nutrition, also
maintained an overstated belief about the effectiveness of bio-fortification and home gardens.
Respondent UQ, Respondent DL and Respondent DP all had a stronger recall of the messages in
the policy brief than Respondent AH and Respondent DN, possibly because the brief was more
relevant to their work. Two of these interviewees (Respondent UQ and Respondent DL) did not
recognise that the brief presented a more cautious message about the effectiveness and evidence
for bio-fortification than they presented in their survey responses. Interestingly, both Respondent UQ
and Respondent DL made comments in their interviews that suggested some conflicting views about
the effectiveness of home gardens and bio-fortification, but any uncertainty was not apparent from
their survey responses. In the case of Respondent UQ, during the interview he mentioned that he
appreciated the succinct and non-technical style of the brief which he found easy to understand –
perhaps there are other personality traits not visible through this study that drive beliefs and survey
responses (e.g. appreciation of clarity and definitive answers).
The final interviewee who maintained a strong belief (Respondent DP) did recognise the disparity
between his view and the message of the brief. He explained that his view was formed through
experience and he thought the policy brief seemed to show up a lack of readily available empirical
data for or against bio-fortification rather than disprove his prior belief.
Belief – forming Three interviewees who reported no prior beliefs about the effectiveness and strength of evidence
for bio-fortification and/or home gardens, formed an opinion throughout the study period. These
interviewees all worked in areas that touched on agriculture and/or nutrition but had mixed recall of
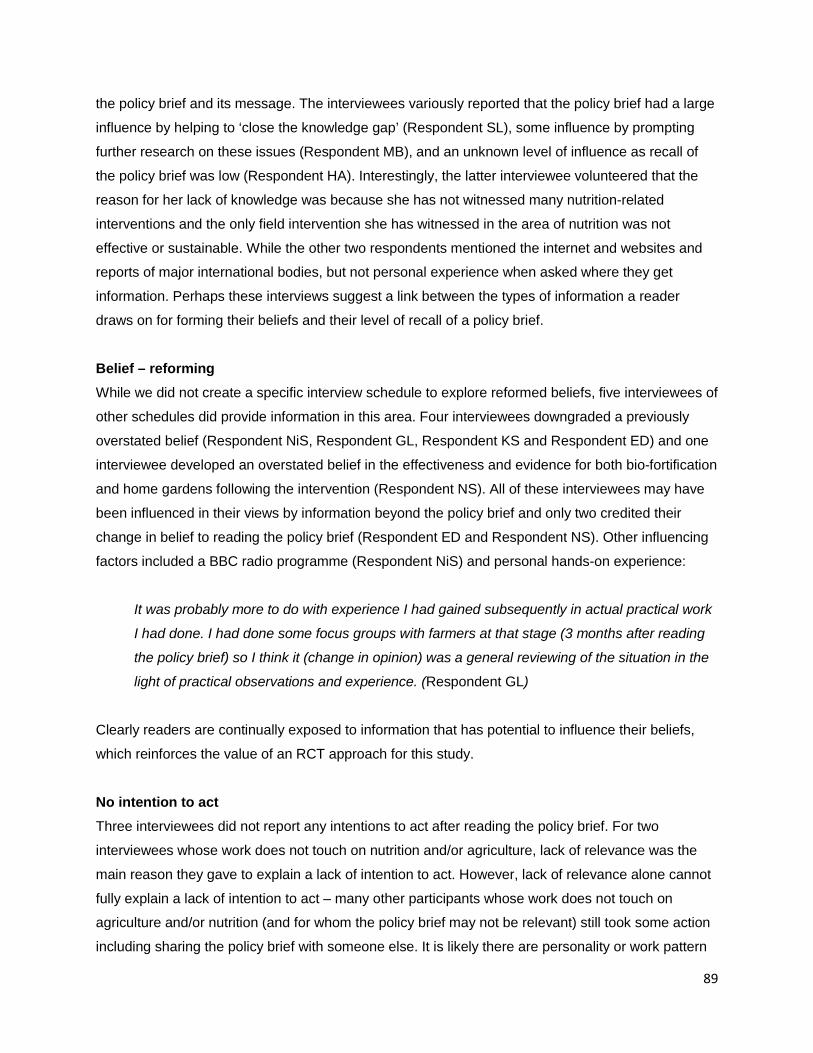
89
the policy brief and its message. The interviewees variously reported that the policy brief had a large
influence by helping to ‘close the knowledge gap’ (Respondent SL), some influence by prompting
further research on these issues (Respondent MB), and an unknown level of influence as recall of
the policy brief was low (Respondent HA). Interestingly, the latter interviewee volunteered that the
reason for her lack of knowledge was because she has not witnessed many nutrition-related
interventions and the only field intervention she has witnessed in the area of nutrition was not
effective or sustainable. While the other two respondents mentioned the internet and websites and
reports of major international bodies, but not personal experience when asked where they get
information. Perhaps these interviews suggest a link between the types of information a reader
draws on for forming their beliefs and their level of recall of a policy brief.
Belief – reforming While we did not create a specific interview schedule to explore reformed beliefs, five interviewees of
other schedules did provide information in this area. Four interviewees downgraded a previously
overstated belief (Respondent NiS, Respondent GL, Respondent KS and Respondent ED) and one
interviewee developed an overstated belief in the effectiveness and evidence for both bio-fortification
and home gardens following the intervention (Respondent NS). All of these interviewees may have
been influenced in their views by information beyond the policy brief and only two credited their
change in belief to reading the policy brief (Respondent ED and Respondent NS). Other influencing
factors included a BBC radio programme (Respondent NiS) and personal hands-on experience:
It was probably more to do with experience I had gained subsequently in actual practical work
I had done. I had done some focus groups with farmers at that stage (3 months after reading
the policy brief) so I think it (change in opinion) was a general reviewing of the situation in the
light of practical observations and experience. (Respondent GL)
Clearly readers are continually exposed to information that has potential to influence their beliefs,
which reinforces the value of an RCT approach for this study.
No intention to act Three interviewees did not report any intentions to act after reading the policy brief. For two
interviewees whose work does not touch on nutrition and/or agriculture, lack of relevance was the
main reason they gave to explain a lack of intention to act. However, lack of relevance alone cannot
fully explain a lack of intention to act – many other participants whose work does not touch on
agriculture and/or nutrition (and for whom the policy brief may not be relevant) still took some action
including sharing the policy brief with someone else. It is likely there are personality or work pattern
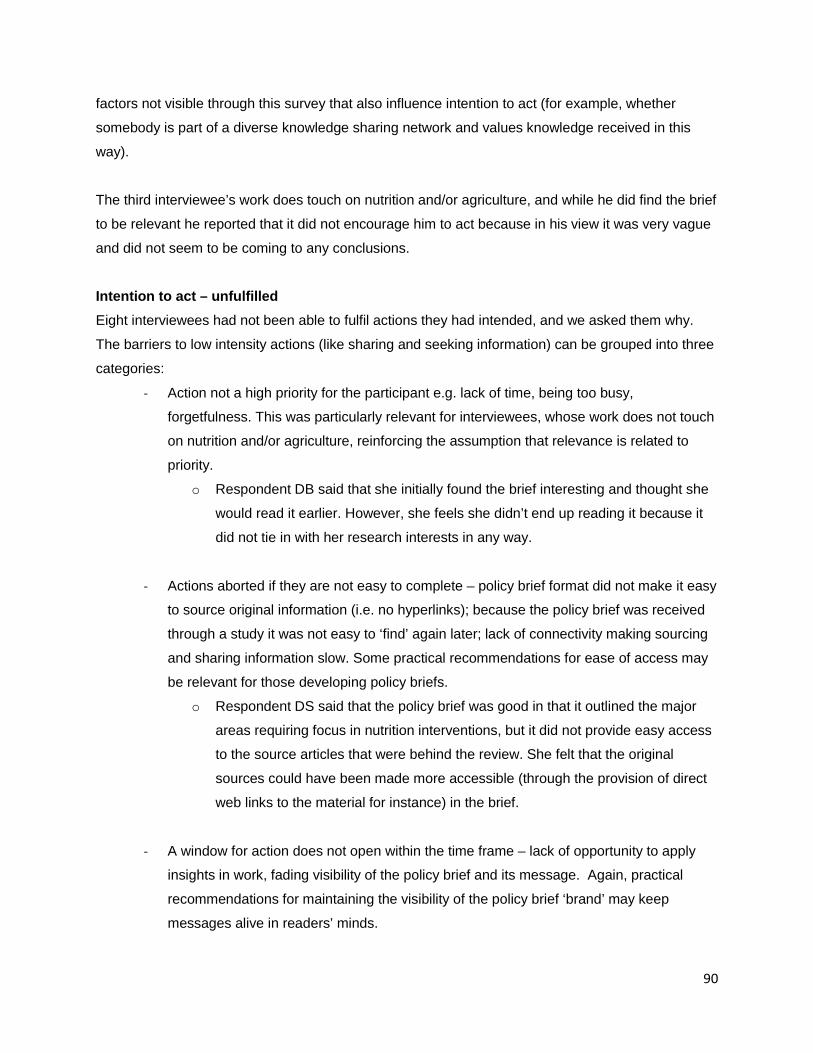
90
factors not visible through this survey that also influence intention to act (for example, whether
somebody is part of a diverse knowledge sharing network and values knowledge received in this
way).
The third interviewee’s work does touch on nutrition and/or agriculture, and while he did find the brief
to be relevant he reported that it did not encourage him to act because in his view it was very vague
and did not seem to be coming to any conclusions.
Intention to act – unfulfilled Eight interviewees had not been able to fulfil actions they had intended, and we asked them why.
The barriers to low intensity actions (like sharing and seeking information) can be grouped into three
categories:
- Action not a high priority for the participant e.g. lack of time, being too busy,
forgetfulness. This was particularly relevant for interviewees, whose work does not touch
on nutrition and/or agriculture, reinforcing the assumption that relevance is related to
priority.
o Respondent DB said that she initially found the brief interesting and thought she
would read it earlier. However, she feels she didn’t end up reading it because it
did not tie in with her research interests in any way.
- Actions aborted if they are not easy to complete – policy brief format did not make it easy
to source original information (i.e. no hyperlinks); because the policy brief was received
through a study it was not easy to ‘find’ again later; lack of connectivity making sourcing
and sharing information slow. Some practical recommendations for ease of access may
be relevant for those developing policy briefs.
o Respondent DS said that the policy brief was good in that it outlined the major
areas requiring focus in nutrition interventions, but it did not provide easy access
to the source articles that were behind the review. She felt that the original
sources could have been made more accessible (through the provision of direct
web links to the material for instance) in the brief.
- A window for action does not open within the time frame – lack of opportunity to apply
insights in work, fading visibility of the policy brief and its message. Again, practical
recommendations for maintaining the visibility of the policy brief ‘brand’ may keep
messages alive in readers’ minds.

91
o Respondent CJ had intended to re-read the policy brief and change his methods
of evaluating research interventions, but was not able to do so at the time of the
last survey. He explained that the obstacles to these actions were lack of an
opportunity to allow him to apply the insights from the policy brief in practice. He
indicated that there was a danger that if he didn’t have an opportunity to put them
into practice, they will ‘drift off his agenda’.
o ‘A lot of it is about time; I deal with and process a large amount of information on
a daily basis. So unless something is particularly relevant to something that I am
doing at that time, then I don’t have time to pursue something further’.
(Respondent GL)
Three interviewees (Respondent AH, Respondent UQ and Respondent KS) had been unable to
complete higher intensity actions, such as reviewing one’s approach to evaluating agriculture
interventions and changing policies regarding agriculture and nutrition within one’s organisation. In
all three cases, the intended action required the interviewee to act beyond his/her immediate sphere
of control, and they needed to influence other people in their organisation to make this change
happen. Interviewees reported organisational bureaucracy, entrenched attitudes, diverse opinions
and rigid programme cycles as barriers to them achieving these higher intensity changes. This is
perhaps not surprising given what we know about the multiple factors that affect research influence
on policy and practice.
Actions fulfilled Interviewees reported a number of actions completed within the study period that we have grouped
into three categories: (a) sharing information, (b) seeking information, (c) other behaviour.
Actions fulfilled – sharing information Twelve interviewees shared information contained in the policy brief through email and face-to-face
discussions with:
- existing information sharing networks who may have a general interest in the topic
o e.g. Respondent MB – he also indicated that he did his masters in natural
resource assets and management and his colleagues from that course all belong
to an email list, and he usually forwards information to this email list
o e.g. Respondent NS – she currently belongs to an informal network of
development researchers (mostly made up of colleagues and friends working in
development), and she indicated that this was a motivation to share the
information within the policy brief.

92
- particular individuals (including friends and family) who have a specific interest in the
topic
o e.g. Respondent GL shared the policy brief with one of her clients, a country
coordinator of an organisation that works on nutrition and agriculture (they breed
and disseminate vitamin A fortified maize). She shared it with her client because
‘she thought it was interesting and had direct relevance to what they were doing’.
o e.g. Respondent SK shared the policy brief with a friend who was a PhD student
studying health management, a colleague who is doing research on natural
resources in development, and a friend doing gender research.
o e.g. Respondent UQ, shared with brother who is a nutritionist
Regarding the format for sharing information, Respondent GL mentioned that though she regularly
disseminates information through formal methods like a research report or press release, if she feels
that it is directly relevant, she does it through more informal means, emails and verbal discussions.
For the most part, interviewees shared the information from the policy brief because they thought the
content would be of interest to others. In addition, one interviewee reported that they also thought
the format was of interest e.g. Respondent AH shared the policy brief with 22 colleagues because it
provided a format for writing policy briefs: ‘the information was contained within a policy brief and we
also write policy briefs. It was a good example on how to augment your arguments and make it
strong’.
Actions fulfilled – sourcing information Seven interviewees sourced more information, either by following up the reference contained in the
policy brief or searching out a wider collection of information related to nutrition and/or agriculture. All
of these interviewees indicated that their work does touch on agriculture and/or nutrition, although for
one interviewee this was not his primary field. In particular, interviewees sought more information
because:
- the policy brief peaked their interest in the topic but was not sufficient for their needs:
o e.g. Respondent ED sought out more information in order to find more
sustainable and affordable agricultural interventions than what was outlined in
the policy brief. He felt that the agricultural interventions mentioned within the
policy brief, like bio-fortification were too expensive for rural farmers.
o e.g. Respondent MB indicated that because he works in academia, it is always
necessary to find more information to expand his knowledge. Also, he teaches an
undergraduate course in Agriculture that is related to most of the issues covered

93
by the policy brief. Hence, he had to do more research to be able to share
enough information in his classes.
- the policy brief presented a particular perspective and they wanted to make their own
a judgement based on the source information
o e.g. Being a researcher, Respondent DS was of the opinion that sourcing the
background research behind such briefs is important as there often exists a gap
between the researcher and those conducting the systematic review, who have
their own biases. She spoke of research she had conducted earlier on female
access to credit under contract with a major multilateral organisation, which she
said was moulded by the multilateral through a review process to suit its own
organisational goals.
- The policy brief challenged their existing position and they wanted to verify the
findings through other sources
o e.g. Respondent AH: ‘...the issue is that before I read the policy brief, I didn’t
even know that bio-fortification is still contentious. The government of India is
talking in terms of using bio-fortification to increase nutrition levels in rural areas
as a proven method. When I read the policy brief, I realised that it is actually not
as proven as it seems, so when I went to ‘google’ some of the papers to see
what were the options, I was surprised to see that it’s actually not a very widely
accepted practice yet, but the government of India is still going ahead with it and
has actually launched a rough pilot to see... bio-fortification effects on nutrition in
children’.
For the most part, interviewees used online tools for seeking out information, but one interviewee
reported seeking out more information through discussions with the Nutrition advisers in his office
and partner organisations (Respondent ED).
Actions fulfilled – other actions Four interviewees reported taking other actions within the study period. All of these interviewees
reported that their work does touch on agriculture and/or nutrition. The four actions are reported
below.
Respondent DL – Researcher/Lecturer in Malaysia

94
Respondent DL indicated in her follow-up survey that she altered some of her recommendations on
food security following her reading of the policy brief. When asked about this, she said that it was the
policy brief’s nuanced take on bio-fortification that was of particular interest to her. Previous sources
of knowledge on bio-fortification that she had been reading had very extreme opinions in their
presentation of biotechnology – either completely for or completely against it. The policy brief,
however, according to Respondent DL, pointed out that bio-fortification may solve short-term
problems but may not necessarily have a significant long-term impact. This aspect of the brief was
what Respondent DL incorporated into her studies, to indicate that something else, additional to bio-
fortification must be done, and focus should not just be on short-term solutions. Further, Respondent
DL incorporated the figures provided in the research in the brief on children and food security.
Respondent MC – Country Director of Malawian (NGO)
When asked about his follow-up action, Respondent MC responded that the brief’s information on
bio-fortification was useful in terms of providing them with information to help develop a new
approach to giving children bio-fortified foods. He said that the research in the brief was very useful
information that he also ended up sharing with partners working in the field. Much of the research
sourced in the brief relating to bio-fortification was new to him and he wanted to be able to apply it to
the work he did to gauge its effectiveness for himself.
Respondent GA – Researcher/Lecturer in Nigeria
Respondent GA said that she works periodically with the Ministry of Agriculture, in terms of giving
them policy evaluation assistance. She says that she used the brief and the source information as
the basis on which to assess the instruments the ministry was using for evaluations and then
adapted the ministry’s existing evaluation instruments accordingly when going into the field. She
says that the brief helped her determine what information from the field was needed when evaluating
agricultural extension interventions.

95
Respondent HH – Consultant/Part-time PhD candidate/Lecturer
When asked about how she changed aspects of her lecture, following her reading of the policy brief,
Respondent HH responded: ‘I’m teaching a postgraduate course that is preparing German masters
students for working in Development corporations. Within this, I’m teaching a module on pro-poor
growth for which I’m using case study material from East Africa. As an agriculture person I am very
much into agriculture and rural poverty. After reading the brief, I included nutrition as an added and
separate area to be looked at on the intra-household level, rather than something subsumed within
agriculture and being of secondary importance.’ Respondent HH stated that the information she had
been receiving from IFPRI in recent times was already pointing her towards the need for focusing on
nutrition security when looking at rural poverty, something she felt she had overlooked earlier. The
policy brief reinforced this for her.
The four reported actions are commensurate with the areas of responsibility that each interviewee
has – i.e. they were able to act within their immediate sphere of control without requiring agreement
or sign-off from others. This is perhaps a reason for them being able to complete the action within a
relatively short time period.
Actions fulfilled – effectiveness We asked interviewees how completing an action (sharing information, sourcing information or
another action) had influenced their effectiveness in their work. Their responses showed a variety of
effects that can be grouped into direct research communication outcomes and indirect knowledge
intermediary outcomes:
- Direct research communications outcomes relate to use of the specific
knowledge/ideas contained in a research communications output, e.g.
o Using evidence from the policy brief to support advocacy actions Respondent
KS;
o Using evidence from the policy brief to apply new approaches in one’s work -
Respondent GC re: applied nutrition interventions, Respondent NS re: evaluation
methods;
- Indirect knowledge intermediary outcomes are somewhat of a by-product of the
research communication itself – they relate to changing views about the value of
knowledge, or use of knowledge for outcomes that don’t relate directly to acting on
the recommendations or content:

96
o The message Respondent NiS learnt was the need to ‘take a broader look at
things before drawing assumptions’ and that has influenced his work;
o Prompting more discussion about an issue, that may or may not challenge the
message of the brief – Respondent UQ;
o Gaining a broader knowledge of the topic improving general confidence to
engage in discussion of an issue – Respondent UQ felt more confident engaging
with nutrition experts from UNICEF, WFP and other multilaterals because of the
policy brief, in a meeting (on nutrition) he had last week;
o Use of the knowledge product to substantiate a connection or relationship with
someone else – Respondent CJ, Respondent GL. , Respondent CJ shared the
information within the policy brief with a professional colleague he met at an
Agricultural Knowledge Share Fair. He mentioned that they were having a
conversation on gender issues and nutrition, and the knowledge he gained from
the policy brief allowed him to provide informed insights on the topic. He then
offered to forward the policy brief to the colleague as a result of the conversation.
The Authority effect Where interviewees were part of a treatment group that received a policy brief plus opinion piece, we
tried to ascertain whether they were conscious of any ‘Authority effect’ at play. For interviewees who
received the opinion piece credited to Lawrence Haddad we asked the extent to which they thought
Lawrence’s name/reputation had influenced their reading of the policy brief (seven interviewees).
Of the three interviewees who had no prior knowledge of Lawrence Haddad, two could also not
recall the opinion piece. The remaining interviewee is familiar with IDS and said that if he had known
Lawrence Haddad was Director of IDS this would have influenced his reading of the opinion piece
(Respondent MB). Four further interviewees did have prior knowledge of Lawrence Haddad, both
personal and through his written work. These interviewees had mixed views about whether
Haddad’s authorship influenced their reading –
- Two interviewees thought it had little influence on their decisions to act (Respondent
NS and Respondent GA);
- Two interviewees claimed it had influenced their reading of the brief, giving it more
weight or conjuring assumptions about what Lawrence might say (Respondent HH
and Respondent CJ respectively).
The latter interviewees seemed to have the greatest depth of knowledge of Lawrence Haddad and
his work, perhaps suggesting there are degrees of influence achieved by degrees of awareness.

97
For interviewees who received the opinion piece credited to an unnamed IDS fellow, we asked the
extent to which they thought Lawrence Haddad’s name/reputation would have influenced their
reading of the policy brief if they had known he was the author (seven interviewees). Four of these
interviewees had no prior knowledge of Lawrence Haddad and only one of them felt that crediting
the opinion piece to Haddad would have influenced their reading of the brief (Respondent UQ). As
with Respondent MB, while not familiar with Lawrence Haddad Respondent UQ is familiar with IDS’
work and he thought that knowing the opinion piece was authored by the Director of IDS, he would
have ‘engaged with it more’.
The remaining three interviewees were familiar with Lawrence Haddad prior to the study and all
agreed that knowing he had authored the opinion piece would have changed their reading and recall
of the brief, if not their resulting actions.

98
Interview schedules
Schedule 1a – Knowledge (no change) Q 1. What is your role in relation to agriculture and nutrition?
Q 2. Where do you get most of your information about these areas? In recent times?
Q 3. Over the period of the study you seem to have maintained your position regarding
(particular nutrition intervention(s)).
a) Could you tell us more about how you formed your position on this issue?
b) The policy brief presented a different position about the effectiveness and evidence for
(particular intervention): Did this have any influence on your position?
i) If yes, why did this policy brief have an influence?
ii) If not, why do you feel it did not influence you?
If treatment group 2 THEN:
Q 4. The policy brief included an opinion piece by Lawrence Haddad.
a) Were you already familiar with his work when you read it?
b) Did his authorship of the opinion piece affect your reading of it?
If treatment group 3 THEN:
Q 4. The policy brief included an opinion piece by an anonymous author. The author was a
Researcher named Lawrence Haddad.
a) Were you already familiar with his work when you read it?
b) If you had known the author was Lawrence Haddad, would this have affected your
reading of it?
Schedule 1b – Knowledge (acquired opinion) Q 1. What is your role in relation to agriculture and nutrition?
Q 2. Where do you get most of your information about these areas? In recent times?
Q 3. Over the period of the study you seem to have changed your position regarding (particular
nutrition intervention(s)).
a) Could you tell us more about why your position changed in this regard?
b) Prompt if they haven’t mentioned it: Did the policy brief have anything to do with it?
i) If yes, why did this policy brief have an influence?
ii) If not, why do you feel it did not influence you?

99
b) Prompt if they only mention the brief: Were there any other factors that contributed to your
change in position?
If treatment group 2 THEN:
Q 4. The policy brief included an opinion piece by Lawrence Haddad.
a) Were you already familiar with his work when you read it?
b) Did his authorship of the opinion piece affect your reading of it?
If treatment group 3 THEN:
Q 4. The policy brief included an opinion piece by an anonymous author. The author was a
Researcher named Lawrence Haddad
a) Were you already familiar with his work when you read it?
b) If you had known the author was Lawrence Haddad, would this have affected your
reading of it?
Schedule 2a – Inaction (Intended but no action)
Q 1. What is your role in relation to agriculture and nutrition?
Q 2. Where do you get most of your information about these areas? In recent times?
Q 3. When you completed the first feedback questionnaire, you indicated an intention to do but
later you said that you hadn’t taken any action.
a) Why did you feel that was a useful act to perform in the first place?
b) What stopped you from performing this action (intended action)?
c) Could there have been anything particularly different about the policy brief that may have
led you to prioritise the action?
d) Were there any other factors influencing your decision not to act on what you intended?
If treatment group 2 THEN:
Q 4. The policy brief included an opinion piece by Lawrence Haddad.
a) Were you already familiar with his work when you read it?
b) Did his authorship of the opinion piece affect your reading of it?
If treatment group 3 THEN:
Q 4. The policy brief included an opinion piece by an anonymous author. The author was a
Researcher named Lawrence Haddad.
a) Were you already familiar with his work when you read it?

100
b) If you had known the author was Lawrence Haddad, would this have affected your
reading of it?
Schedule 2b – Inaction (no intention to act) Q 1. What is your role in relation to agriculture and nutrition?
Q 2. Where do you get most of your information about these areas? In recent times?
Q 3. In your response to the first feedback questionnaire you indicated that you did not
intend to take any follow-up action after reading the policy brief:
a) Why you did not consider taking any particular action?
b) Could there have been anything particularly different about the policy brief that may have
led you to consider any action?
c) Were there any other factors that made you decide to not consider action (Not relevant to
your work/interests, unclear with regard to how you could have acted?)
If treatment group 2 THEN:
Q 4. The policy brief included an opinion piece by Lawrence Haddad.
a) Were you already familiar with his work when you read it?
b) Did his authorship of the opinion piece affect your reading of it?
If treatment group 3 THEN:
Q 4. The policy brief included an opinion piece by an anonymous author. The author was a
Researcher named Lawrence Haddad.
a) Were you already familiar with his work when you read it?
b) If you had known the author was Lawrence Haddad, would this have affected your
reading of it?
Schedule 3a – Action (Shared Information)
Q 1. What is your role in relation to agriculture and nutrition?
Q 2. Where do you get most of your information about these areas? In recent times?
Q 3. In your response to the final questionnaire of the study, you indicated that you had
shared information with someone else (refer to own words for description).
a) Could you tell us more about the information sharing process? (Who did you share it
with, for what purpose)
b) Why did you decide to share information? Prompt for – do you always share such
information / was this business-as-usual?
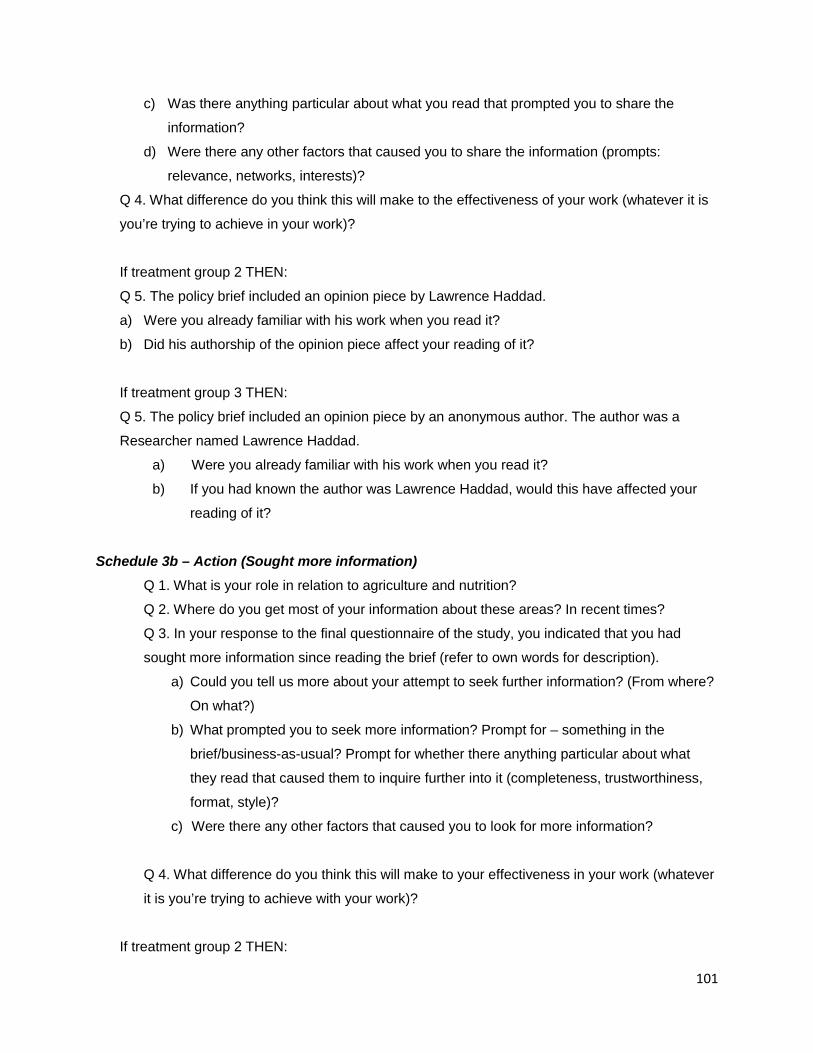
101
c) Was there anything particular about what you read that prompted you to share the
information?
d) Were there any other factors that caused you to share the information (prompts:
relevance, networks, interests)?
Q 4. What difference do you think this will make to the effectiveness of your work (whatever it is
you’re trying to achieve in your work)?
If treatment group 2 THEN:
Q 5. The policy brief included an opinion piece by Lawrence Haddad.
a) Were you already familiar with his work when you read it?
b) Did his authorship of the opinion piece affect your reading of it?
If treatment group 3 THEN:
Q 5. The policy brief included an opinion piece by an anonymous author. The author was a
Researcher named Lawrence Haddad.
a) Were you already familiar with his work when you read it?
b) If you had known the author was Lawrence Haddad, would this have affected your
reading of it?
Schedule 3b – Action (Sought more information)
Q 1. What is your role in relation to agriculture and nutrition?
Q 2. Where do you get most of your information about these areas? In recent times?
Q 3. In your response to the final questionnaire of the study, you indicated that you had
sought more information since reading the brief (refer to own words for description).
a) Could you tell us more about your attempt to seek further information? (From where?
On what?)
b) What prompted you to seek more information? Prompt for – something in the
brief/business-as-usual? Prompt for whether there anything particular about what
they read that caused them to inquire further into it (completeness, trustworthiness,
format, style)?
c) Were there any other factors that caused you to look for more information?
Q 4. What difference do you think this will make to your effectiveness in your work (whatever
it is you’re trying to achieve with your work)?
If treatment group 2 THEN:

102
Q 5. The policy brief included an opinion piece by Lawrence Haddad.
a) Were you already familiar with his work when you read it?
b) Did his authorship of the opinion piece affect your reading of it?
If treatment group 3 THEN:
Q 5. The policy brief included an opinion piece by an anonymous author. The author was a
Researcher named Lawrence Haddad.
a) Were you already familiar with his work when you read it?
b) If you had known the author was Lawrence Haddad, would this have affected your
reading of it?
Schedule 3c – Action (Other) Q 1. What is your role in relation to agriculture and nutrition?
Q 2. Where do you get most of your information about these areas? In recent times?
Q 3. In your response to the final questionnaire of the study, you indicated that you had taken
some action as a result of reading the brief (refer to own words).
a) Could you tell us more about your (other action)?
b) What prompted you to take this action? Prompt for Was there anything particular in
the policy brief that prompted you to perform this action?/Were you intending to do
this anyway?
Q 4. What difference do you think this will make to your effectiveness in your work (whatever it is
you’re trying to achieve with your work)?
If treatment group 2 THEN:
Q5. The policy brief included an opinion piece by Lawrence Haddad.
a) Were you already familiar with his work when you read it?
b) Did his authorship of the review affect your reading of it?
If treatment group 3 THEN:
Q 5. The policy brief included an opinion piece by an anonymous author. The author was a
Researcher named Lawrence Haddad.
a) Were you already familiar with his work when you read it?
b) If you had known the author was Lawrence Haddad, would this have affected your
reading of it?
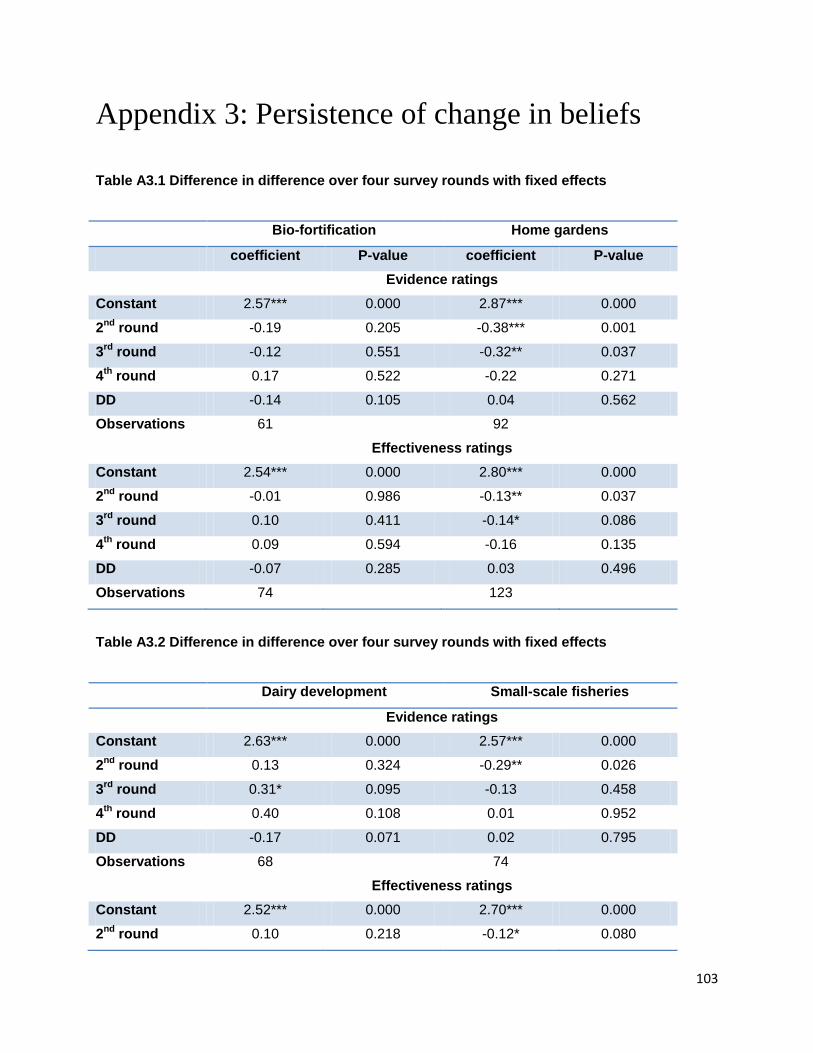
103
Appendix 3: Persistence of change in beliefs
Table A3.1 Difference in difference over four survey rounds with fixed effects
Bio-fortification Home gardens
coefficient P-value coefficient P-value Evidence ratings Constant 2.57*** 0.000 2.87*** 0.000
2nd round -0.19 0.205 -0.38*** 0.001
3rd round -0.12 0.551 -0.32** 0.037
4th round 0.17 0.522 -0.22 0.271
DD -0.14 0.105 0.04 0.562
Observations 61 92
Effectiveness ratings Constant 2.54*** 0.000 2.80*** 0.000
2nd round -0.01 0.986 -0.13** 0.037
3rd round 0.10 0.411 -0.14* 0.086
4th round 0.09 0.594 -0.16 0.135
DD -0.07 0.285 0.03 0.496
Observations 74 123
Table A3.2 Difference in difference over four survey rounds with fixed effects
Dairy development Small-scale fisheries
Evidence ratings Constant 2.63*** 0.000 2.57*** 0.000
2nd round 0.13 0.324 -0.29** 0.026
3rd round 0.31* 0.095 -0.13 0.458
4th round 0.40 0.108 0.01 0.952
DD -0.17 0.071 0.02 0.795
Observations 68 74
Effectiveness ratings Constant 2.52*** 0.000 2.70*** 0.000
2nd round 0.10 0.218 -0.12* 0.080

104
3rd round 0.15 0.195 -0.08 0.382
4th round 0.02 0.874 -0.06 0.606
DD -0.03 0.609 -0.03 0.473
Observations 89 103

105
Appendix 4: Further qualitative analysis Question 5 of the Immediate feedback questionnaire asked respondents ‘In your own words, what is
the key message of the policy brief?’ We undertook thematic analysis of 90 survey responses to this
question, to explore the extent to which respondents could identify and recount a key message, as
this is a key factor in information sharing, and to test for the effect of an opinion piece on the
recipient’s understanding of the key message.
Sampling The sample population included all study respondents who completed the full immediate feedback
questionnaire for the joint IDS-3ie study of the impact of research communications. The sample
population was divided into three groups, based on the three treatment groups for the overall study,
and a systematic random sampling was done within each group, where:
• N/n= nth number sampled;
• N= Total number of sample population;
• n= total number of sample wanted.
Coding When it came to analysing responses to this question we discovered the treatments themselves
contained a number of complex and nuanced messages, and it was not always clear which were
‘key’. To complete the qualitative analysis we coded a sample of responses according to whether
they had noted the following points:
Key messages included
in the basic policy brief:
Key messages unique
to the view point:
Key messages
reinforced by the
view point:
Other messages that
arose frequently
during coding:
NoM: nutrition- focused agricultural interventions alone will not eradicate malnutrition
IFNA: Invest fully in
nutrition-focused
agriculture – solely
from viewpoint
BioFNP: Bio-
fortification can
help but not yet a
proven solution
ChiNu: Issues
surrounding child
malnutrition,
(identification as the
key problem, focus of
interventions)
CiVC: Identifying vulnerable children
AgIS: Learn from
nutrition-focused
PNIE: Insist on
proper nutrition
BioFNPN: Incorrect
understanding of the

106
and finding ways to ensure their participation in nutrition programmes.
agriculture how to
make agricultural
interventions more
nutrition sensitive-
solely from viewpoint
Impact evaluation
and research
before funding and
implementation by
policymakers
key message about
Bio-fortification
BioFNP: Bio-fortification can help but not yet a proven solution
HuN: Hunger and
Nutrition focus only
IHC: Increasing Overall Household Income
Responses were coded by one reviewer based on the key messages above; phrases were sorted
through and coded based on inclusion of certain key words and ideas. Responses could include
reference to more than one key message. Specific details about the coding of each message are
available on request.
Limitations The policy brief contained a lot of key messages and information which made it difficult to analyse
for specific responses towards the viewpoint. The coder’s understanding of certain phrases and use
of the codes like ‘BioFNPN’ is limited by her understanding of the literature. It is also limited by her
knowledge of the subject matter and is taken without a deeper understanding of the respondents’
backgrounds.
Key findings Table A4.1 above shows the frequency of key messages identified by respondents. A more detailed
breakdown is at the end of this Appendix.
Table A4.1 Frequency of key messages identified
Code Basic policy brief
Authority opinion piece
Unnamed opinion piece
Total
FREQUENCY OF KEY MESSAGES UNIQUE TO THE opinion piece AgIS +/- other codes 0 0 0 0

107
IFNA +/- other codes 0 3 0 3
FREQUENCY OF KEY MESSAGES REINFORCED BY THE opinion piece PNIE+/-other codes 9 11 8 28
BioFNP+/- other codes 3 2 3 8
FREQUENCIES OF INFERENCES MADE NOT EXPLICITLY CONTAINED WITHIN THE POLICY BRIEF BioFNPN+/- other codes 3 1 4 8
EPO+/- Other codes 4 2 7 13
FREQUENCIES OF GENERIC CODES (ChiNU and HUN) ChiNu+/-Other codes 8 7 11 26
HuN+/- Other codes 10 3 6 19
FREQUENCIES OF MESSAGES NOT REINFORCED BY THE opinion piece IHC+/- Other codes 6 0 0 6
NoM+/-other codes 4 6 2 12
CiVC +/-other codes 2 2 0 4
Identify and recount key messages: Analysis showed a lot of variation in respondents’ ability to
identify and recount the key messages in the treatments. Across the sample as a whole, the mostly
commonly identified messages related to:
• a key message in the basic brief that was also reinforced in the opinion piece: insist on
proper nutrition Impact evaluation and research before funding and implementation by
policymakers (28/90), and;
• a generic issue: child malnutrition, e.g. identification as the key problem, focus of
interventions, (26/90)
The group who received the basic policy brief were also likely to identify messages with focus on
generic Hunger and Nutrition issues only (10/30). The multiple and nuanced messages in the treatments may have led to the lack of clear pattern or consistency in responses.
The ‘Authority effect’: Testing for the Authority effect was difficult, as key messages overlapped
throughout both the policy brief and the opinion piece. However, AgIS and IFNA were very unique to
the opinion piece. Respondents within the groups that had the opinion piece were the only ones who
identified these as key messages. In total, only 2 (2.2 per cent) respondents out of 90 identified AgIS
as a key message. This makes up 3.3 per cent of the population that received the opinion piece. The
two respondents had received the opinion piece, 1 was from the ‘Authority group’ and the other from

108
‘the unnamed IDS research fellow group’. For IFNA, only 3 (3.3 per cent) respondents out of 90
picked this as a key message. All the respondents were from the ‘Authority group’ (10 per cent of the
‘Authority’ population). They make up 5 per cent of the entire population that received the opinion
piece.
Other key messages, not coded: Often, rare responses that are inferences from the brief and opinion
piece as opposed to key messages arose within the sample. Those inferences were mostly policy
focused. They made up 14.4 per cent of all the key messages identified; 30.8 per cent of these
responses were about policy implementation or formulation. A large percentage of this group was
made up of respondents who received the opinion piece from the unnamed IDS fellow, totalling
about 53.8 per cent of all the responses in this group. They occasionally referred to maternal health
and sometimes to multi system approaches, policy formulation and implementation and coordination.
Sometimes they referred to participatory approaches. No distinct explanation could be noted for
them, as they did not occur a lot within the ‘Authority group’ (15.4 per cent) as compared to the other
groups with (53.8 per cent) or without (30.8 per cent) an opinion piece. They occurred across
groups. More knowledge about other face codes e.g. gender, job positions, academic background
might be helpful in identifying the reasons.
Child malnutrition and necessary interventions occurred as a key message through the responses.
26 (28.9 per cent) out of 90 respondents identified this as one of the key messages. A large
percentage of this was among those who got the opinion piece from an anonymous source (42.3 per
cent), followed by those without the opinion piece (30.8 per cent) and finally those with the Authority
opinion piece (7 per cent). However, this will be expected as the policy brief focused on child
malnutrition with images to reinforce its messages.
Hunger and nutrition identified as the key message solely was seen more in the group that was not
given the opinion piece (50 per cent) and rarely in groups that received the opinion piece [Authority
(20 per cent), unnamed fellow (30 per cent)]. It is possible that the reinforcement of certain points in
the opinion piece helped in bringing other key messages into focus.
Misunderstanding of Bio-fortification: Bio-fortification as a key message was often misunderstood.
This rang true for all the respondent groups. Among respondents who had the opinion piece from an
unnamed fellow, about 23 per cent identified bio-fortification as a key message; 55 per cent of those
respondents misunderstood the information. Among respondents who did not receive the opinion
piece, about 20 per cent identified bio-fortification as a key message and 50 per cent misunderstood
the information. Among respondents who received the Authority opinion piece, 10 per cent identified

109
it as a key message and only 33 per cent misunderstood its meaning. There may or may not be a
significant correlation. Further analysis is needed to explore the relationship.
Need for more research was an underlying theme that reoccurred across most of the sample
population (28 (31.1 per cent) out of 90 respondents). However, the group with the Authority opinion
piece identified PNIE more as a key message (39.3 per cent). Among those who identified PNIE
alone as a key message, the Authority group was greatest (50 per cent), followed by the group with
an opinion piece from an anonymous source (33.3 per cent). It is possible that the opinion piece
might have reinforced this message more clearly than the basic brief.
Increase of household income was a key message seen in respondents without the opinion piece
only. Increase in overall household income (6 out of 90 respondents) was often identified as a
nutrition intervention directly related to child malnutrition or as an intervention that had to be
evaluated more for its significance.
Interestingly enough, other key messages not reinforced by the opinion piece (NoM and CiVC) were
seen in both the Authority group and the group without an opinion piece, but not in the group with an
opinion piece from an unnamed fellow source. These are points illustrated and expanded within the
policy text; an insight into the background of the respondents might explain these differences more.
Multiple key messages: The population without the opinion piece mentioned more multiple key
messages in one answer, often in combination with other generic messages. Basic policy brief (63.6
per cent), Authority opinion piece (27.3 per cent), unnamed fellow opinion piece (9.1 per cent).
Multiple key messages were found in 11 (12.2 per cent) responses out of 90. The definition of
multiple key messages was if respondents mentioned more than one key message with or without
other generic messages.
Conclusion
From this brief qualitative analysis, an inclusion of an opinion piece seemed to help in reinforcing
certain key messages more than others. Respondents who did not receive an opinion piece tended
to identify other key messages within the text of the policy brief. However, there is a need for more
qualitative analysis of the respondent’s background to give better context. It was difficult to assess if
having an opinion piece by an Authoritative source as opposed to one by an anonymous researcher
made a difference. More qualitative analysis of other characteristics of the respondents might give a
better picture of its significance.

110
Table A4.2 Detailed breakdown of key messages identified by respondents
Code Basic policy brief
Authority opinion piece
Unnamed opinion piece
Total
FREQUENCY OF KEY MESSAGES UNIQUE TO THE opinion piece
AgIS only 0 1 1 2
AgIS +/- other codes 0 0 0 0
IFNA only 0 2 0 2
IFNA +/- other codes 0 3 0 3
FREQUENCY OF KEY MESSAGES REINFORCED BY THE opinion piece
PNIE+/-other codes 9 11 8 28
PNIE only 2 6 4 12
BioFNP + PNIE only 0 1 0 1
BioFNP+/- other codes 3 2 3 8
BioFNP only 1 1 2 4
FREQUENCIES OF INFERENCES MADE NOT EXPLICITLY CONTAINED WITHIN THE POLICY BRIEF
EPO+/- Other codes 4 2 7 13
EPO only 2 1 2 5
EPO +/- (policy implementation)
1 0 3 4
BioFNPN+/- other codes 3 1 4 8
BioFNPN only 0 1 3 4
FREQUENCIES OF GENERIC CODES (ChiNU and HUN)
ChiNu+/-Other codes 8 7 11 26
ChiNu only 2 3 5 10
ChiNu+ HuN only 1 0 0 1
HuN+/- Other codes 10 3 6 19
HuN only 5 2 3 10
FREQUENCIES OF MESSAGES NOT REINFORCED BY THE opinion piece
IHC+/- Other codes 6 0 0 6
IHC only 0 0 0 0
NoM+/-other codes 4 6 2 12

111
NoM only 4 5 0 9
CiVC +/_-other codes 2 2 0 4
CiVC only 0 0 0 0
NoM+CiVC+IHC only 0 0 0 0
CiVC + IHC 1 0 0 1
FREQUENCIES OF MULTIPLE KEY MESSAGES IN ANSWERS
Multiple key messages(>1) +/-other codes
7 3 1 11
Multiple key messages alone
3 3 0 6

112
References
Bennett, M. (1996) ‘Men's and Women's Self-Estimates of Intelligence’, Journal of Social Psychology
136.3: 411–12
Carden, F. (2009) ‘Knowledge to Policy: Making the Most of Development Research’, Ottawa, ON:
International Development Research Centre, and Thousand Oaks, CA: Sage Publications
Carli, L.L. (2001) ‘Gender and Social Influence’, Journal of Social Issues 57.4: 725–41
Cottle, G. (2011) ‘Report on the Policy Community Survey’, prepared for IDRC’s Think Tank
Initiative, Toronto, ON: GlobeScan
Edwards, K. and Smith, E. (1996) ‘A Disconfirmation Bias in the Evaluation of Arguments’, Journal of
Personality and Social Psychology 71.1: 5–24
Furnham, A. and Rawles, R. (1999) ‘Correlation between Self-Estimated and Psychometrically
Measured IQ’, Journal of Social Psychology 139, 405–10
Greeley, M. and Gorman, C. (2010) ‘Priorities for Accelerating Progress on the MDGs’, In Focus
Policy Briefing, special issue
Haavio-Mannila, E. and Roos, J.P. (2008) Why are Men Reporting More Sexual Partners than
Women?, University of Helsinki website, www.mv.helsinki.fi/home/jproos/jonasdottir.htm (accessed 3
July 2012)
Hogan, H.W. (1978) ‘IQ Self-Estimates of Males and Females’, Journal of Social Psychology
106.1: 137–38
Hovland, C. (1954) ‘Effects of the Mass Media of Communication’, in G. Lindzey (ed.), Handbook of
Social Psychology 2: 1062–1103, Cambridge, MA: Addison-Wesley
Jonason, P.K. (2007a) ‘An Evolutionary Perspective on Sex Differences in Exercise Behaviors and
Motivations’, Journal of Social Psychology 147.1: pp. 5–14

113
Jonason, P.K. (2007b) ‘A Mediation Hypothesis to Account for the Sex Difference in Reported
Number of Sexual Partners: An Intrasexual Competition Approach’, manuscript, New Mexico State
University
Jonason, P.K. (2007c) ‘The Power of Prestige: Why Men Report Having More Sex Partners than
Women’, manuscript, New Mexico State University
Jones, N.; Jones, H. and Walsh, C. (2008) Science? Strengthening Science–Policy Dialogue in
Developing Countries, ODI Working Paper 294, London: Overseas Development Institute
Jones, N. and Walsh, C. (2008) ‘Policy Briefs as a Communication Tool for Development Research’,
background note, Overseas Development Institute
Lavis J.N.; Posada F.B.; Haines A. and Osei, E. (2004) ‘Use of Research to Inform Public
Policymaking’, The Lancet 364: 1615–21
Lord, C.G.; Ross, L. and Lepper, M.R. (1979) ‘Biased Assimilation and Attitude Polarization: The
Effects of Prior Theories on Subsequently Considered Evidence’, Journal of Personality and Social
Psychology 37.11: 2098–2109
Masset, E.; Haddad, L.; Cornelius, A. and Isaza-Castro, J. (2011) A Systematic Review of
Agricultural Interventions that Aim to Improve Nutritional Status of Children, London: EPPI-Centre,
Social Science Research Unit, Institute of Education, University of London
Mengelkamp, C. and Jager, R.S. (2007) ‘Self-Estimates of Attention Performance’, Psychology
Science 49.3: 223–37
Propp, K.M. (1995) ‘An Experimental Examination of Biological Sex as a Status Cue in Decision-
Making Groups and its Influence on Information Use’, Small Group Research 26: 451–74
Reid, S.A.; Palomares, N.A.; Anderson, G.L. and Bondad-Brown, B. (2009) ‘Gender, Language, and
Social Influence: A Test of Expectation States, Role Congruity and Self-Categorization Theories’,
Human Communication Research 35: 465–90
114
Tourangeau, R.; Rips, L.J. and Rasinski, K. (2000) The Psychology of Survey Response,
Cambridge: Cambridge University Press
Walt, G. (1994) ‘How Far does Research Influence Policy?’, European Journal of Public Health 4:
233–35
WHO (2002) People’s Voices, Government’s Choices: Communications as a Determinant of Policy
Change, Noncommunicable Diseases and Mental Health, WHO/NMH/APC/02.01.Rev.1, Geneva,
Switzerland: WHO
Wilson, T.D. and Hodges, S.D. (1992) ‘Attitudes as Temporary Constructions’, in L. Martin and A.
Tesser (eds), The Construction of Social Judgment, pp.37–65, Hillsdale, NJ: Erlbaum
Young, J. and Court, J. (2004) ‘Bridging Research and Policy in International Development. An
Analytical and Practical Framework.’, ODI Bridging Paper, London: Overseas Development Institute


