
Georgia State University Georgia State University
ScholarWorks @ Georgia State University ScholarWorks @ Georgia State University
ICEPP Working Papers International Center for Public Policy
4-1-2019
What Accounts for the Education Gender Gap in Pakistan’s Khyber What Accounts for the Education Gender Gap in Pakistan’s Khyber
Pakhtunkhwa Province? Pakhtunkhwa Province?
Musharraf Cyan Georgia State University, [email protected]
Mark Rider Georgia State University, [email protected]
Michael Price Georgia State University, [email protected]
Stephanie J. Roberts Georgia State University, [email protected]
Follow this and additional works at: https://scholarworks.gsu.edu/icepp
Recommended Citation Recommended Citation Cyan, Musharraf; Rider, Mark; Price, Michael; and Roberts, Stephanie J., "What Accounts for the Education Gender Gap in Pakistan’s Khyber Pakhtunkhwa Province?" (2019). ICEPP Working Papers. 148. https://scholarworks.gsu.edu/icepp/148
This Article is brought to you for free and open access by the International Center for Public Policy at ScholarWorks @ Georgia State University. It has been accepted for inclusion in ICEPP Working Papers by an authorized administrator of ScholarWorks @ Georgia State University. For more information, please contact [email protected].

In
International Center for Public Policy
Working Paper 19-06
April 2019
What Accounts for the Education Gender Gap in
Pakistan’s Khyber Pakhtunkhwa Province?
Musharraf Cyan
Mark Rider
Michael Price
Stephanie J. Roberts
INTERNATIONAL
CENTER FOR
PUBLIC POLICY

International Center for Public Policy Working Paper 19-06
What Accounts for the Education Gender Gap in Pakistan’s Khyber Pakhtunkhwa Province? Musharraf Cyan
Mark Rider Michael Price Stephanie J. Roberts February 2019
International Center for Public Policy Andrew Young School of Policy Studies Georgia State University Atlanta, Georgia 30303 United States of America Phone: (404) 413-0235 Fax: (404) 651-4449 Email: [email protected] Website: http://icepp.gsu.edu/ Copyright 2019, the Andrew Young School of Policy Studies, Georgia State University. No part of the material protected by this copyright notice may be reproduced or utilized
in any form or by any means without prior written permission from the copyright owner.
International Center for Public Policy Andrew Young School of Policy Studies The Andrew Young School of Policy Studies was established at Georgia State University with the objective of promoting excellence in the design, implementation, and evaluation of public policy. In addition to two academic departments (economics and public administration), the Andrew Young School houses seven leading research centers and policy programs, including the International Center for Public Policy. The mission of the International Center for Public Policy (ICePP) at the Andrew Young School of Policy Studies is to provide academic and professional training, applied research, and technical assistance in support of sound public policy and sustainable economic growth in developing and transitional economies. ICePP is recognized worldwide for its efforts in support of economic and public policy reforms through technical assistance and training around the world. This reputation has been built serving a diverse client base, including the World Bank, the U.S. Agency for International Development (USAID), the United Nations Development Programme (UNDP), finance ministries, government organizations, legislative bodies, and private sector institutions. The success of ICePP reflects the breadth and depth of its in-house technical expertise. The Andrew Young School's faculty are leading experts in economics and public policy and have authored books, published in major academic and technical journals, and have extensive experience in designing and implementing technical assistance and training programs. Andrew Young School faculty have been active in policy reform in over 40 countries around the world. Our technical assistance strategy is not merely to provide technical prescriptions for policy reform, but to engage in a collaborative effort with host governments and donor agencies to identify and analyze the issues at hand, arrive at policy solutions, and implement reforms. ICePP specializes in four broad policy areas: Fiscal policy (including tax reforms, public expenditure reviews, tax administration reform) Fiscal decentralization (including decentralization reforms, design of intergovernmental
transfer systems, urban government finance) Budgeting and fiscal management (including local government budgeting, performance-
based budgeting, capital budgeting, multi-year budgeting) Economic analysis and revenue forecasting (including micro-simulation, time series
forecasting) For more information about our technical assistance activities and training programs, please
visit our website at http://icepp.gsu.edu or contact us by email at [email protected].

1
What Accounts for the Education Gender Gap
in Pakistan’s Khyber Pakhtunkhwa Province?
Musharraf Cyan,1 Mark Rider,2 Michael Price,3 and Stephanie J. Roberts4
April 2019
Abstract
There are competing explanations for the persistence of the education gender gap
in Pakistan’s Khyber Pakhtunkhwa Province (KPK). Three reasons are given for
this persistence, specifically parental and societal attitudes opposed to girls’
education and women’s employment outside the home; a lack of both family and
public resources; and low labor market returns to women’s education. We seek to
contribute to this debate by analyzing the results of a survey of a random sample
of 642 families in the Dir District of KPK with a high-school-aged girl that
attended at least some primary school. Our study shows that guardians of a high
school aged girl, irrespective of the guardian’s gender, report very strong support
for girls’ education and for women’s careers outside the home. These findings
contradict the widespread belief that the persistence of the education gender gap
in KPK is due to parental or societal attitudes opposed to girls’ education and
women’s careers. Rather than parental attitudes opposed to girls’ education,
respondents report that the lack of family resources is an important impediment to
girls’ school attendance. To test the authenticity of the expressions of strong
support for girls’ education, we examine the ability of the survey responses to
predict girls’ school attendance beyond the 5th class by estimating a model of the
determinants of girls’ school attendance beyond the 5th class.
Keywords: girls’ education, women’s employment, education gender gap
1 Cyan: International Center for Public Policy and Department of Economics, Andrew Young School of Policy
Studies, Georgia State University, USA | [email protected] | (404) 413-0238 2 Rider: International Center for Public Policy and Department of Economics, Andrew Young School of Policy
Studies, Georgia State University, USA | [email protected] | (404) 413-0227 3 Price: International Center for Public Policy and Department of Economics, Andrew Young School of Policy
Studies, Georgia State University, USA | [email protected] | (404) 413-0080 4 Roberts: International Center for Public Policy and Department of Economics, Andrew Young School of Policy
Studies, Georgia State University, USA | [email protected] | (678) 908-6441

2
1. Introduction
According to the academic literature, there are three broad benefits from women’s
education: humanistic, societal, and economic. Janzen (2008), King and Hill (1997), Patel
(1998), Rezai-Rashti and Moghadam (2011), and Ross et al. (2012) conclude that the humanistic
benefits of women’s education include increasing her sense of empowerment and self-esteem
which enhances her ability to exercise her rights and responsibilities. Duflo (2012), Glewwe
(1999), King and Hill (1997), Pervaiz et al. (2011), Rezai-Rashti and Moghadam (2011), and
Shapiro (2012) find that the societal benefits of women’s education include lower fertility rates,
lower infant mortality rates, lower maternal mortality rates, improved children’s health and
nutrition, and increased child educational attainment. In addition to the humanistic and societal
benefits of women’s education, Aslam (2006), King and Hill (1997), and Pervaiz et al. (2011)
provide evidence that there is an inverse relationship between a country’s education gender gap
(EGG) and the productivity of labor. Accordingly, a reduction in the EGG increases the
productivity of labor which results in an increase in the rate of economic growth.
For these reasons, many believe that improving women’s education is an important
developmental goal. Despite investments aimed at increasing girls’ school attendance, there are
substantial and persistent EGGs in many developing countries, including the rural areas of
Pakistan. The academic literature is divided on the reasons for the persistence of the EGG in
Pakistan’s Khyber Pakhtunkhwa Province (KPK). Generally speaking, the debate focuses on
parental and societal attitudes opposed to girls’ education; a lack of both family and public
resources for girls’ education, including a greater distance to female schools, a lack of separate
sanitation facilities, of female teachers, and of gender segregated classrooms; and low labor

3
market returns to women’s education.1 The purpose of this study is to investigate the obstacles to
girls’ school attendance in KPK.
Certainly, Pakistan’s EGG has not gone unnoticed by the central government and
international development agencies, which have invested significantly in Pakistan’s education
system, with some projects specifically promoting girls’ school attendance. These investments
include enrollment campaigns, the Punjab Women’s Empowerment Package, the National
Education Policy, incentive-based programs, and flexible community schools.2 The primary
targets of these investments are increasing school accessibility and returns to women’s
education. Despite these investments, there is a substantial and persistent EGG in KPK.
Many apparently believe that societal and parental attitudes opposed to girls’ education
and women’s employment outside the home are to blame for the persistence of the EGG in
Pakistan. The media’s portrayal of the attempted assassination of Nobel Laureate Malala
Yousafzai and the Taliban insurgency in KPK help promote such beliefs. Nor are such beliefs
limited to the public imagination. In an important study, Purewal and Hashmi (2014, p. 16)
conclude that “[n]egative attitudes towards female education are a root cause of the low
educational levels of girls in rural Pakistan.” The debate about the root causes of the EGG is not
merely of academic interest. To reduce the EGG, public policy must address the actual as
opposed to the perceived obstacles to girl’s school attendance. If, for example, there are strong
parental attitudes opposed to girl’s school attendance or women working outside the home,
devoting more public resources to improving girls’ access to schools may not be effective in
reducing the EGG. On the other hand, girls may not attend school because the quality of schools
1 See, for example, Burde and Linden (2012), Chaudhury et al. (2006), Gertler and Glewwe (1992), Kremer et al.
(2005), Lokshin and Sawada (2001), Memon (2007), Muralidharan and Sundamaran (2011), and Qureshi (2004). 2 For further details on these programs, see Chitrakar (2009), Government of the Punjab (2012), SDPI (2008), and
Ismail (1996).
4
is poor. Ironically, policy-makers may fail to devote sufficient resources to girls’ education
because they may hold mistaken beliefs that parents are opposed to girls’ school attendance. In
contrast, girls and their parents may not invest in a girls’ education if the market return to
women’s education is too low. For public policy to be effective in addressing EGGs, it is crucial
to have a deep contextual understanding of the circumstances prevailing in a given country. In
fact, the obstacles to girls’ school attendance may differ from country to country or even among
regions within a country.
To gain a better understanding of the obstacles to girls’ school attendance in KPK, we
conduct a survey of a random sample of 642 families in the Dir District of KPK with a high
school aged (HSA) girl that attended at least some primary school. The Dir District was chosen
because there has been considerable Talibanization and civil unrest in this district, and for this
and other reasons, it is perceived to be particularly unfavorable for girls’ school attendance
compared to some other districts in KPK.
The survey was conducted in October 2014 and was administered through face-to-face
interviews of the HSA girl’s guardian in the local language. We employed both male and female
enumerators in order to get the perspective of both male and female guardians towards girls’
education and women’s employment outside the home. To better understand the barriers to girls’
school attendance in KPK, the survey queried respondents about household characteristics,
attitudes toward education in general, attitudes toward girls’ education in particular, attitudes
toward women having careers outside the home, and reasons for the girl’s nonattendance.
One of the most intriguing findings of this study is that respondents, irrespective of their
gender, report very strong support for girls’ education and women’s careers. These findings
contradict the seemingly widespread belief that the persistence of the EGG in KPK is due to

5
parental or societal attitudes opposed to girls’ school attendance. Similarly, we find strong
support for women pursuing careers outside the home. Therefore, societal norms opposed to
women’s careers do not appear to be a serious impediment to women participating in the labor
force. According to our sample of respondents, family resources appear to be a major
impediment to girls’ school attendance.
The remainder of this article is organized as follows. The next section is a brief review of
the literature on the determinants of girls’ education in rural Pakistan. The subsequent section
describes the sample design and survey instrument. Section 4 summarizes the main survey
findings, and the final section concludes.
2. Brief review of the literature
The literature on the demand for girls’ education in Pakistan is relatively sparse. Burde
and Leigh (2013) provide evidence that village-based schools can eliminate the EGG. They
conduct a randomized control trial in Northwest Afghanistan. They find that the provision of
village-based schools increases girls’ enrollment by 52 percentage points, which virtually
eliminates the EGG, and increases girls’ average test score by 0.65 standard deviations. In
contrast, boys’ enrollment increases by 35 percentage points, and average test scores increase by
0.40 standard deviations. They (Burde and Leight 2013, p. 37) conclude, “[t]he very fact that
enrollment rates equalize in the treatment group suggests that demand for primary education is
the same for both genders, as long as the school is place in the village.” This result provides
indirect evidence that traditional attitudes toward woman’s role in society may not be as serious
an obstacle to girls’ education as some believe.
Using the Pakistan Integrated Household Survey (1991), Holmes (2001) reports that
mother’s educational attainment exerts a larger impact on daughters’ education and father’s

6
educational attainment exerting a stronger impact on son’s education. Household wealth and
male wages have a stronger impact on daughters’ than sons’ education. She also concludes that
money would be better spent increasing access to middle and secondary schools because
distances to middle and secondary schools are a significant determinant of final schooling level.
Purewal and Hashmi (2014) examine the relationship between the returns to girls’
education in rural Punjab, Pakistan and parental attitudes toward girls’ education. Using a survey
of 350 households collected in 2011 in rural areas of the districts of Faisalabad and Chiniot in the
providence of Punjab. They find that the population is split on their attitudes toward girls’
education. More specifically, 52.0 percent of the respondents believe that education should be
biased in favor of boys; whereas, 46.3 percent report believing that education should be
unbiased. In addition, 52.3 percent of the respondents agree with the statement that “schooling
causes girls to be rebellious towards parents,” and 49.1 percent agree with the statement that
“schooling encourages bad practices among girls.” They (Purewal and Hashmi 2014, p. 16)
conclude that “[t]he preoccupation with ‘rebelliousness’ and ‘bad practices’ that education
evokes for rural society in Pakistan exhibits the obstacles to overcoming gender disparity in
enrolment, attainment, and literacy when girl’s education is societally viewed with suspicion.”
In sum, the literature on the determinants of the demand for girls’ education in rural
Pakistan show that parental attitudes toward girls’ education, distance to school, and household
wealth play important roles. In addition, Purewal and Hashmi (2014) conclude that the
household responses are sensitive to framing and advocate for using “leading” questions.
3. Sample design and the survey instrument
By way of background, KPK lies in the northwest region of Pakistan. The majority of
KPK’s inhabitants are Pashtuns, Hazarewal, Chitrali, and Kohistanis. KPK has a significant and
7
persistent EGG, with only 59 percent of girls aged six through ten enrolled in primary school,
compared to 72 percent of boys in this age group. This is an EGG of 13 percentage points. As
shown in Table 1, male literacy rates greatly exceed that of females in KPK. The Pashtuns of
KPK practice purdah (seclusion of women), which may influence parental and societal attitudes
toward girls’ school attendance; the resources devoted to girls’ education; and the market returns
to women’s education.
The target region for the survey is the area bordering Upper and Lower Dir. This area
was selected because it is a blind spot between the highly pro-female education areas of Chitral
and Malakand districts in KPK. This area also lies in the Taliban affected Swat District and
Bajaur Agency in the east and west, respectively. Many girls’ schools in this region were
damaged or destroyed during the war on terror in KPK. Due to social and economic forces in
Dir, the overall environment would seem to be particularly unfavorable to girls’ school
attendance. In short, the target area provides an interesting case study for determining whether
parental attitudes opposing girls’ education is the root cause of the substantial and persistent
EGG in KPK.
We constructed a random sample of families with a HSA girl in the following manner.
The Education Department of KPK provided us with a list of girls’ high schools in the Dir
District. Seventeen high schools were randomly selected from this list. We contacted the
administrators of these high schools and asked them to identify the feeder schools from which
their high school received students. Then, the administrators of the feeder schools were contacted
and asked to provide a list of villages from which they draw their students. This formative
research helped to identify the exact reach of each of the 17 high schools in the sample.

8
A random sample of families was drawn from the student registries from the previous
three years. Between the 23rd of October, 2014 and the 27th of October 27, 2014, door-to-door
surveys were carried out in the sample villages. A minimum of 40 families or the maximum
number of qualified families was selected from each village. For purposes of this survey, only
one respondent and one HSA girl was selected from each household. To get a balanced gender
ratio among respondents, male and female enumerators were employed in approximately equal
numbers to administer the surveys. This strategy allows us to examine whether female guardians
hold different views than male guardians. Since the sample does not include respondents whose
HSA girl never attended school, we expect that the respondents generally have a more favorable
attitude toward girls’ school attendance than the general population of Dir District.
The survey instrument consists of three sections. The first section collects information
about the demographic profile of the respondent, including information about the respondent’s
relationship to the child as well as the respondent’s education level, ethnic group affiliation,
length of residence in the village, and several measures of household wealth (e.g., own a vehicle,
own land, own home). The survey also gathers information on the child’s means of
transportation to school and the distance from the child’s home to the nearest high school.
Furthermore, we also collect information on the number of and ages of the other children under
eighteen residing in the family residence. The second section concerns the respondent’s attitudes
toward education. Respondents are asked to indicate on a scale from one to five how strongly
they disagree or agree with statements about education in general, boys’ education, and girls’
education in particular. The statements used to elicit a guardian’s attitude toward girls’ education
are posed in a variety of ways to account for potential framing effects. The third section asks
whether the HSA girl is currently attending school beyond the 5th class. If the respondent
9
answers affirmatively, the survey requests information on how often the girl attends school, why
she attends, and reasons for her absence from school. For the girls that are not attending school
past the 5th class, the survey asks about the reasons for her nonattendance. An English language
version of the survey instrument is provided in an Appendix to this article; an Urdu version can
be provided upon request.
To ensure that the survey protocols were correctly implemented, enumerators provided
photographic evidence from the field. We also arranged for random field checks of completed
surveys, which were conducted by field supervisors recruited from the faculty of the University
of Peshawar. Finally, random spot checks were conducted by personnel from the Monitoring and
Evaluation Directorate of the Government of KPK. Based on these three independent sources of
information, we are confident that the survey was carried out as prescribed by the survey
protocols.
4. Summary of findings
We begin by discussing the sample statistics for key variables, including differences in
responses according to the respondent’s gender. Then, we discuss the distribution of attitudes
towards girls’ education and women working outside the home. We proceed by investigating the
reasons given for girls’ nonattendance beyond the 5th class, including interesting differences
given for nonattendance by gender of the respondent. We conclude this section by estimating a
mixed-process, simultaneous equations model (SEM) of the determinants of girls’ school
attendance beyond the 5th class.

10
4.1 Descriptive statistics
A total of 642 families participated in the survey. Table 2 provides sample statistics for
the full sample, as well as for the subsamples of male and female respondents. More specifically,
100 percent of the respondents are Pashtuns. Approximately 39 percent of the respondents report
being the mother of the HSA girl, and 49 percent, the father. Grandfathers account for 11 percent
of the sample. The remaining 1 percent has some other relationship to the HSA girl. In sum,
approximately 40 percent of the respondents are female and 60 percent male. Approximately half
of the respondents report that they did not attend secondary school. Approximately 28 percent of
the sample report being farmers; 22 percent laborers in the Gulf States; and 36 Housewives. In
terms of reported wealth, 25 percent report owning an automobile; whereas, 88 percent report
owning less than 2 acres of land. The demographic characteristics of the sample reveal that the
respondents on average have low levels of formal education and of wealth. This is generally
consistent with the demographic characteristics of this region.
There are some interesting and statistically significant differences at conventional levels
in the descriptive statistics, according to the gender of the respondent. In particular, female
respondents are approximately five years older than male respondents. Furthermore, female
respondents are more likely to have no formal education than male respondents; whereas, male
respondents are more likely to report attending at least some high school than female
respondents. Interestingly, female respondents are more likely than male respondents to report
having attained some middle-school education as their highest level of education. However, male
respondents are more likely to report having attended at least some high school as their highest
level of education. Thus, the differences observed between female and male respondents at the
middle-school level may be due to some females dropping out at the middle-school level while

11
more males continue with their schooling to attend some high school or beyond. These
observations are consistent with the observed EGG in this region of Pakistan.
The differences in reported occupations by gender are to be expected. Interestingly, there
is no statistically significant difference at convention levels in the proportion of females and
males reporting that they are civil servants. Ironically, this may reflect the separation of males
and females. Since girls do not attend school with boys, there must be qualified female teachers
to staff girl schools and similarly for female doctors. Female respondents are more likely to
report owning no land; whereas, male respondents are more likely to report owning land for
every category greater than no land. Male respondents are more likely to report that the HSA girl
walks to school than are female respondents. There is no statistically significance difference at
conventional levels in reported home ownership, distance to school, or whether the HSA girl
attends school beyond the 5th class.
4.2 Attitudes towards girls’ school attendance
On the whole, the respondents report strong support for girls’ education. We solicited the
respondent’s attitude towards girls’ education in a variety of different ways to control for
potential effects based on the framing of the survey question.
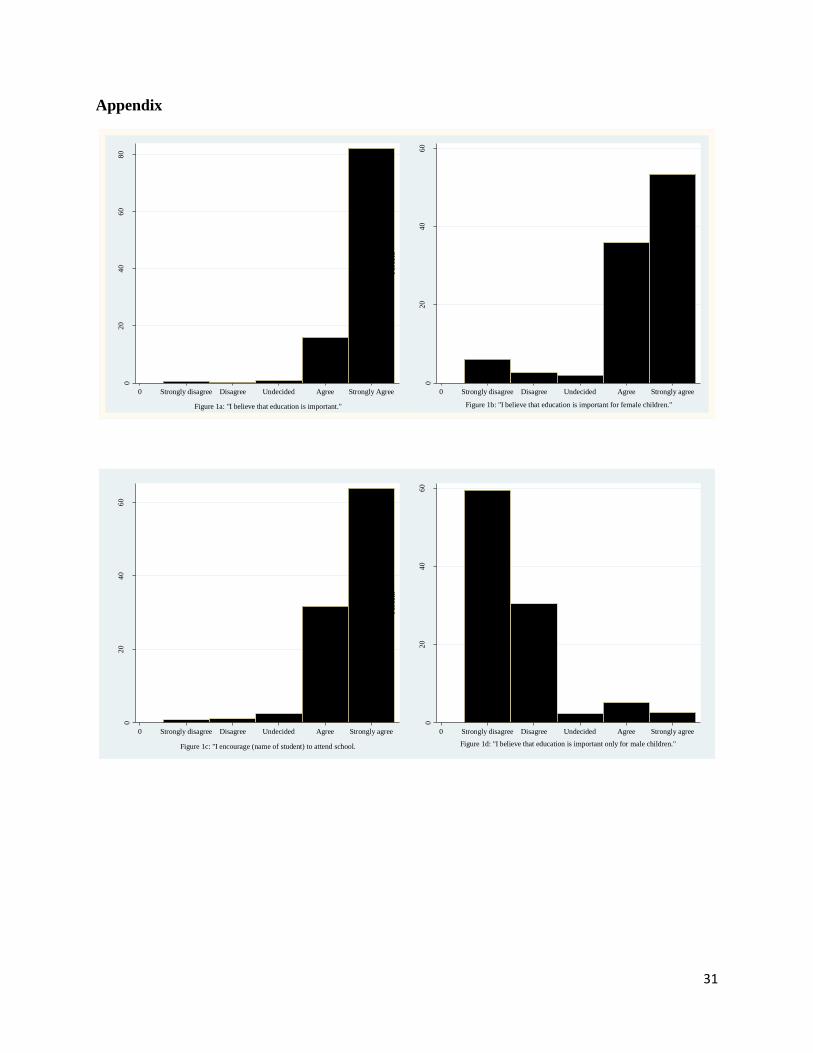
We begin by asking respondents whether they strongly disagree, disagree, are undecided,
agree, or strongly agree with the statement, “I believe that education is important.” Figure 1a (see
Appendix for all figures and tables) shows that over 90 percent of the respondents either agree or
strongly agree with this statement. Respondents are then asked their reaction, using the same 5
point Likert scale, to the statement, “I believe that education is important for female children.”
Figure 1b shows that the responses are very supportive of girls’ education, with 89 percent either
agree or strongly agree with the statement. In Figure 2a, the responses are divided by gender of

12
the respondent. This figure shows that while most respondents agree that education is important
for girl children, female respondents appear to agree more strongly with this statement; 65
percent of female respondents versus 46 percent of male respondents strongly agree with this
statement.
Since it is possible that people may be in favor of girls’ education in general but not in
the particular case of their own HSA girl, we also elicit the respondent’s attitude in a more
personalized manner. Figure 1c shows that over 90 percent of the respondents either agree or
strongly agree with the statement, “I encourage (name of child) to attend school.” Regarding
differences by gender, female respondents are more likely to strongly agree with this statement,
as shown in Figure 2b; 75 percent of female respondents versus 57 percent of male respondents
strongly agree with the statement. While both parents appear to encourage a girl child to attend
school beyond the 5th class, mothers seem to be somewhat more encouraging. Although the
female respondents in this sample have less education than the sampled male respondents on
average, the female respondents are more likely to report encouraging HAS girl to attend school.
Finally, we ask respondents to react to the statement, “I believe that education is
important only for the male child.” Figure 1d shows that over 90 percent of the respondents
either disagree or strongly disagree with this statement. Female respondents are more likely to
strongly disagree rather than simply disagree with this statement than male respondents, as
shown in Figure 2c; 73 percent of female respondents versus 51 percent of male respondents
strongly disagree with this statement. Again, female respondents seem to be more strongly in
favor of girl child education than male respondents. Overall, there is considerable consistency in
the responses to these statements. Taken in their totality, respondents express strong support for
girls’ school attendance and girls’ education.
13
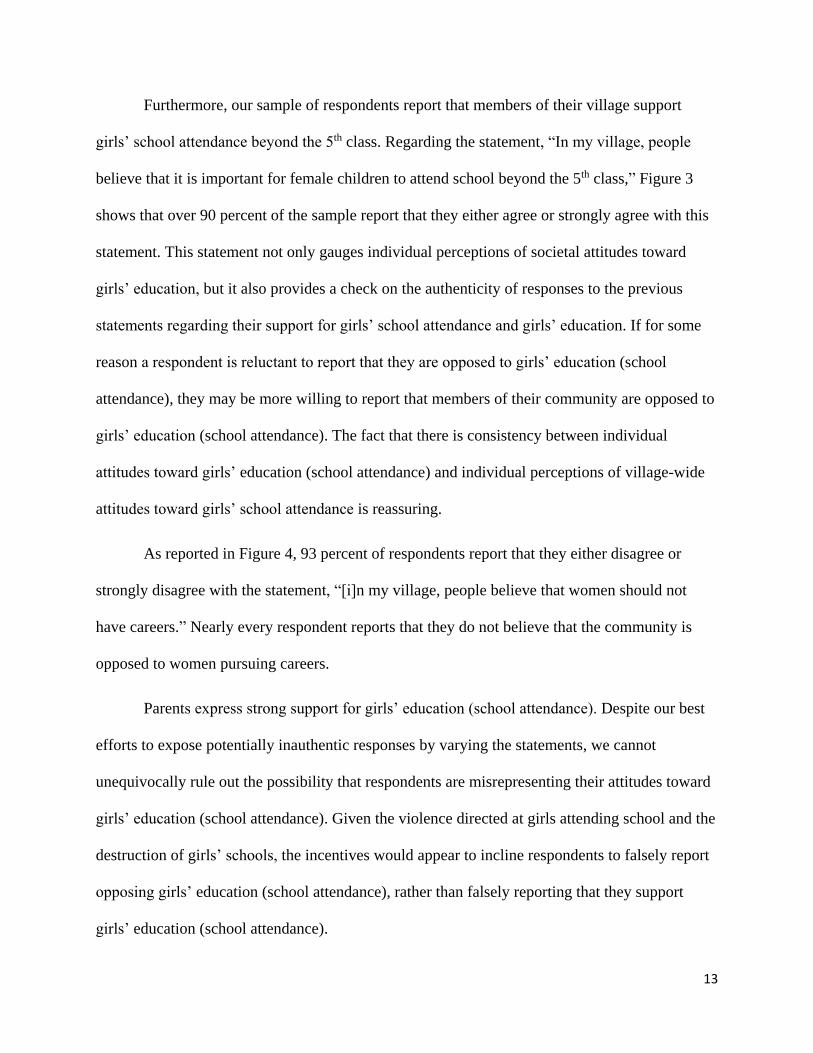
Furthermore, our sample of respondents report that members of their village support
girls’ school attendance beyond the 5th class. Regarding the statement, “In my village, people
believe that it is important for female children to attend school beyond the 5th class,” Figure 3
shows that over 90 percent of the sample report that they either agree or strongly agree with this
statement. This statement not only gauges individual perceptions of societal attitudes toward
girls’ education, but it also provides a check on the authenticity of responses to the previous
statements regarding their support for girls’ school attendance and girls’ education. If for some
reason a respondent is reluctant to report that they are opposed to girls’ education (school
attendance), they may be more willing to report that members of their community are opposed to
girls’ education (school attendance). The fact that there is consistency between individual
attitudes toward girls’ education (school attendance) and individual perceptions of village-wide
attitudes toward girls’ school attendance is reassuring.
As reported in Figure 4, 93 percent of respondents report that they either disagree or
strongly disagree with the statement, “[i]n my village, people believe that women should not
have careers.” Nearly every respondent reports that they do not believe that the community is
opposed to women pursuing careers.
Parents express strong support for girls’ education (school attendance). Despite our best
efforts to expose potentially inauthentic responses by varying the statements, we cannot
unequivocally rule out the possibility that respondents are misrepresenting their attitudes toward
girls’ education (school attendance). Given the violence directed at girls attending school and the
destruction of girls’ schools, the incentives would appear to incline respondents to falsely report
opposing girls’ education (school attendance), rather than falsely reporting that they support
girls’ education (school attendance).
14
As previously noted, the sample does not include respondents who never sent their HSA
girl to school. Therefore, the sample is likely to be more favorably inclined toward girls’
education, and by extension, more favorably inclined towards women having careers. However,
our sample of respondents also reports believing that members of their village are favorably
inclined toward women’s careers. In sum, the respondents in our sample report a favorable
attitude toward girls’ education (school attendance) and toward women pursuing careers. This is
in sharp contrast to widely held beliefs that the primary deterrent to girls’ education (school
attendance) in this region of Pakistan is parental and societal attitudes opposed to girls’ education
(school attendance) and women pursuing careers.
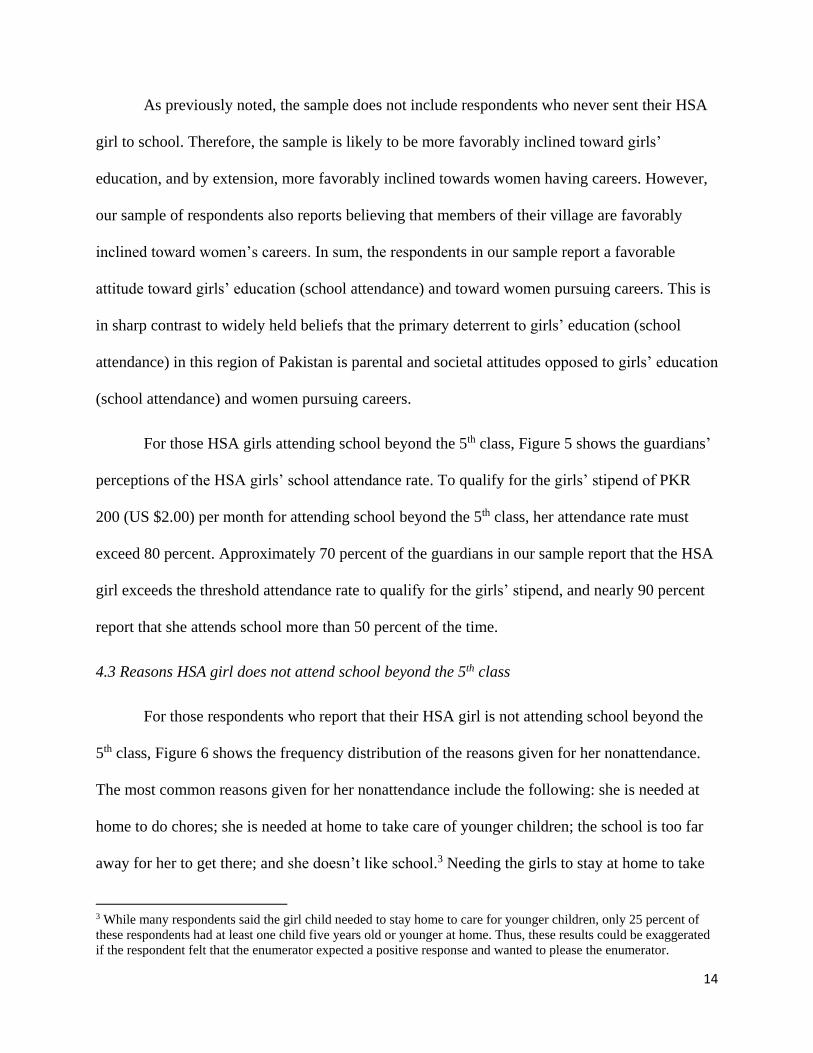
For those HSA girls attending school beyond the 5th class, Figure 5 shows the guardians’
perceptions of the HSA girls’ school attendance rate. To qualify for the girls’ stipend of PKR
200 (US $2.00) per month for attending school beyond the 5th class, her attendance rate must
exceed 80 percent. Approximately 70 percent of the guardians in our sample report that the HSA
girl exceeds the threshold attendance rate to qualify for the girls’ stipend, and nearly 90 percent
report that she attends school more than 50 percent of the time.
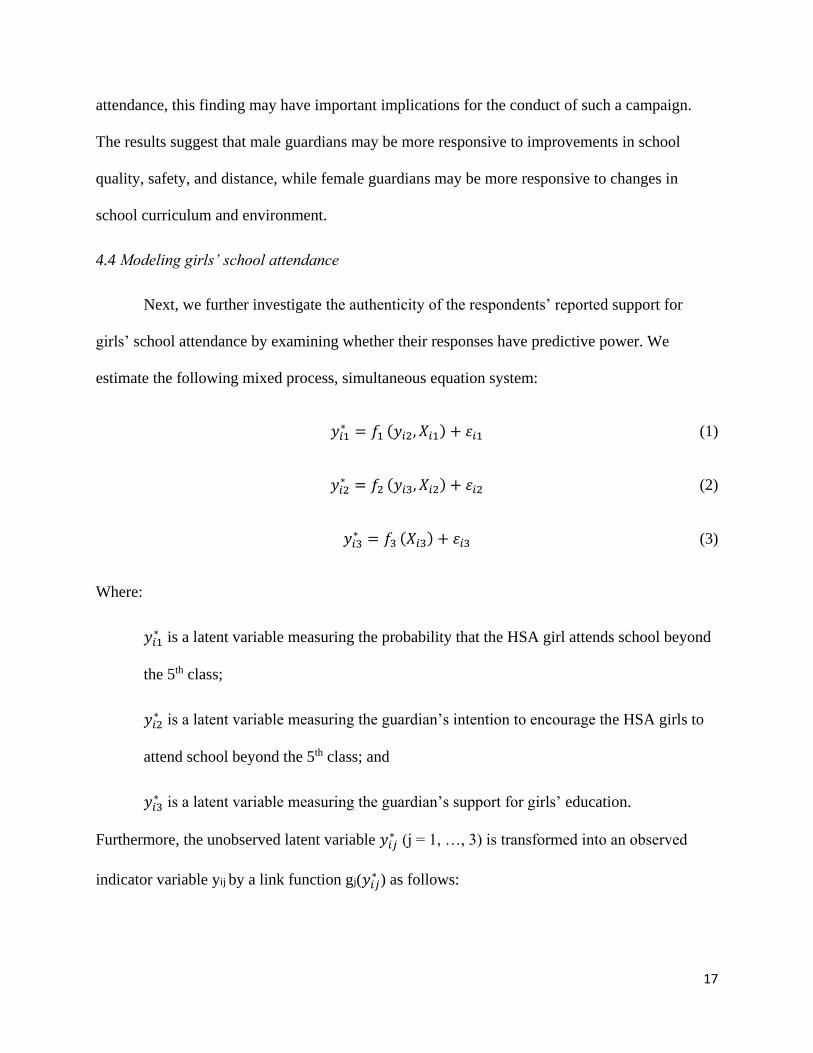
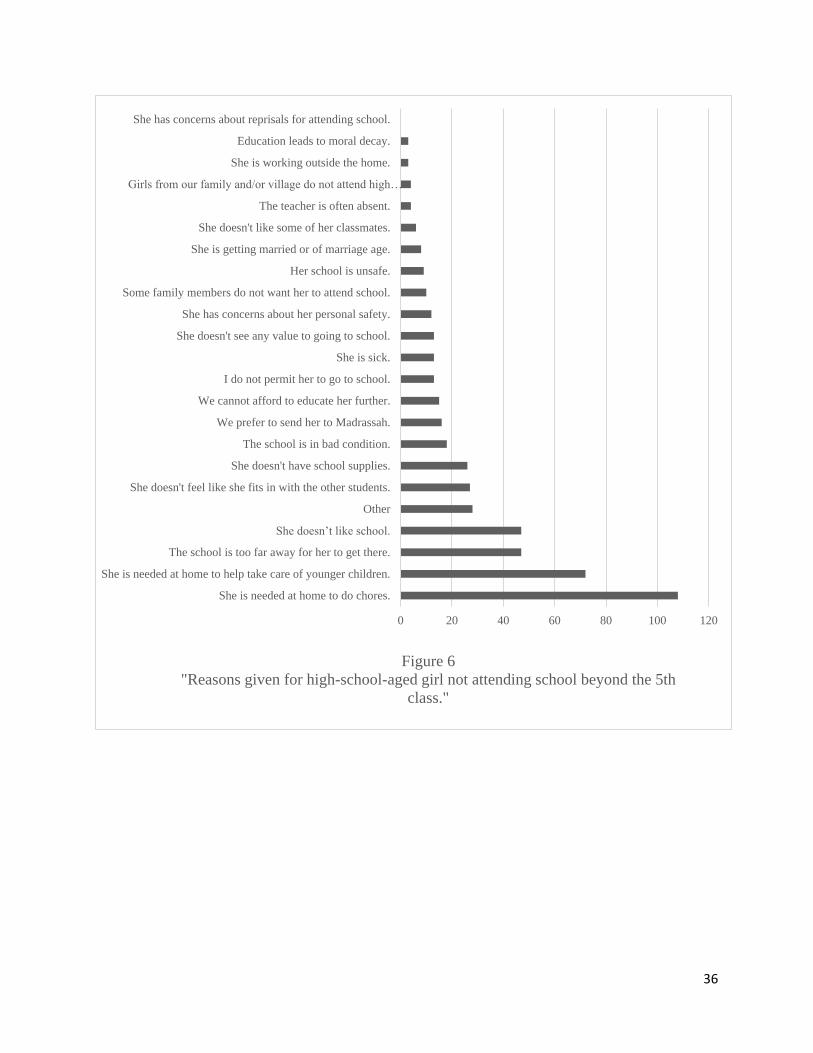
4.3 Reasons HSA girl does not attend school beyond the 5th class
For those respondents who report that their HSA girl is not attending school beyond the
5th class, Figure 6 shows the frequency distribution of the reasons given for her nonattendance.
The most common reasons given for her nonattendance include the following: she is needed at
home to do chores; she is needed at home to take care of younger children; the school is too far
away for her to get there; and she doesn’t like school.3 Needing the girls to stay at home to take
3 While many respondents said the girl child needed to stay home to care for younger children, only 25 percent of
these respondents had at least one child five years old or younger at home. Thus, these results could be exaggerated
if the respondent felt that the enumerator expected a positive response and wanted to please the enumerator.

15
care of younger children and/or to do household chores may reflect a lack of family resources.
The fact that the school is too far away for her to get there may reflect a lack of investment in
girls’ education by the government. While one cannot say for sure why some girls do not like
school, it may reflect a lack of public investment in girls’ education, such as poor infrastructure,
teacher absence or low quality instruction, lack of books and supplies, and lack of sanitary
facilities.
While the reasons cited above are the most common reasons cited for nonattendance, the
primary reasons vary according to the gender of the respondent. With the exception of needing
the child at home to do chores, female respondents tend to choose more “emotional” reasons for
the girls’ nonattendance; whereas, male respondents tend to choose more “practical” reasons. In
regards to chores, 54.3 percent of female respondents choose this response as opposed to 27.3
percent of male respondents. Since most of the female respondents report being housewives, they
are most likely the family member in charge of the household chores and may be more likely to
see household chores as a valid reason for keeping the HSA girl at home. Also, the male
guardians may not pay attention to chores since they are more likely to be working outside the
home.
Otherwise, female respondents are more likely to report the girl does not attend school
because she does not like school (27.6 percent of female respondents versus 8.4 percent of male
respondents); she does not feel like she fits in with the other students (15.7 percent of female
respondents versus 4.9 percent of male respondents); and girls from her family and/or village do
not attend high school (3.1 percent of female respondents versus zero percent of male
respondents). As few respondents say that girls from their families and/or villages do not attend
However, the possibility also exists that the girls were caring for children over five years old or they were caring for
other children (possibly relatives) who did not live in their home full time.

16
high school, we focus on the other two choices that differ significantly from the responses of
male respondents. These two responses have more to do with the girl’s personal preference and
her feelings toward school. Further, male respondents are more likely to report that the HSA girl
does not attend school because the school is too far away for her to get there (25.2 percent of
male respondents versus 7.9 percent of female respondents); the school is in bad condition (11.9
percent of male respondents versus 0.8 percent of female respondents); the family cannot afford
to educate her further (8.4 percent of male respondents versus 2.4 percent of female
respondents); she has concerns about her personal safety (7.7 percent of male respondents versus
0.8 percent of female respondents); her school is unsafe (6.3 percent of male respondents versus
zero percent of female guardians); and the teacher is often absent (2.8 percent of male
respondents versus zero percent of female respondents). All of these reasons point towards the
practicalities and usefulness of attending school. While it may be that girl children are more
likely to divulge their dislike of school to their mothers, respondents are instructed to select all
reasons that apply to their child’s situation. Thus, if mothers believe that these practical reasons
are valid, we would expect female respondents to select “practical” reasons as well as the
“emotional” ones. However, fathers are more likely to choose the practical as opposed to the
emotional reasons.
Another interesting aspect of these results is the implied discord between male and
female respondents. These differences suggest the male and female guardians may not have
discussed their girl child’s school attendance thoroughly or that they disagree about the reasons
their girl child does not attend school. Given these results, it appears females and males in this
region of KPK may use different criteria in determining whether a girl child should attend high
school. If the government undertakes a public awareness campaign to promote girl’s school
17
attendance, this finding may have important implications for the conduct of such a campaign.
The results suggest that male guardians may be more responsive to improvements in school
quality, safety, and distance, while female guardians may be more responsive to changes in
school curriculum and environment.
4.4 Modeling girls’ school attendance
Next, we further investigate the authenticity of the respondents’ reported support for
girls’ school attendance by examining whether their responses have predictive power. We
estimate the following mixed process, simultaneous equation system:
𝑦𝑖1∗ = 𝑓1 (𝑦𝑖2, 𝑋𝑖1) + 𝜀𝑖1 (1)
𝑦𝑖2∗ = 𝑓2 (𝑦𝑖3, 𝑋𝑖2) + 𝜀𝑖2 (2)
𝑦𝑖3∗ = 𝑓3 (𝑋𝑖3) + 𝜀𝑖3 (3)
Where:
𝑦𝑖1∗ is a latent variable measuring the probability that the HSA girl attends school beyond
the 5th class;
𝑦𝑖2∗ is a latent variable measuring the guardian’s intention to encourage the HSA girls to
attend school beyond the 5th class; and
𝑦𝑖3∗ is a latent variable measuring the guardian’s support for girls’ education.
Furthermore, the unobserved latent variable 𝑦𝑖𝑗∗ (j = 1, …, 3) is transformed into an observed
indicator variable yij by a link function gj(𝑦𝑖𝑗∗ ) as follows:

18
yi1 = g1(𝑦𝑖1∗ ) = 1 if the HSA girl i attends school beyond the 5th class, and zero otherwise;
yi2 = g2(𝑦𝑖2∗ ) = 1 if the guardian strongly disagrees with the statement, “I encourage my
girl to attend school beyond the 5th class”, …, and yi2 = g2(𝑦𝑖2∗ ) = 5 if the guardian
strongly agrees with the statement; and
yi3 = g3(𝑦𝑖3∗ ) = 1 if the guardian strongly disagrees with the statement, “I believe that
education is important for female children”, …, and yi3 = g3(𝑦𝑖3∗ ) = 5 if the guardian
strongly agrees with the statement.
Xij (j = 1,…, 3) is a vector of predetermined random variables, and
εij|Xij ~ i.i.d. N(0,Σ), where Σ = (
1 𝜌 𝜑𝜌 1 𝜓𝜑 𝜓 1
) .
Equation 1 is a Probit regression, and (2) and (3) are Ordered Probit regressions. We estimate
this mixed-process, simultaneous equations system, using Maximum Likelihood (ML)
Seemingly Unrelated Regression (SUR). Pagan (1979) and Roodman (2011) show that ML SUR
is equivalent to a Limited Information Maximum Likelihood (LIML) estimator. Gao and Lahiri
(2000) show the superiority of the LIML estimator over the Two-Stage Least Squares (2SLS)
estimator in the sense that the former is median unbiased while the latter is not.4
The estimates of the system of equations (1) – (3) are reported in Table 4. Beginning with
the Ordered Probit equation for the statement (3) “Education is important for females,” which is
reported in the third panel of Table 4, we assume that this is a taste variable. We further assume
that such tastes are explained by the demographic characteristics of the respondent. In this
equation, we include the respondent’s relationship to the HSA girl (mother = 1; zero otherwise),
4 If the structural equation is just identified, which is not the case in our application, then ML SUR and 2SLS are
equivalent to the LIML estimator.
19
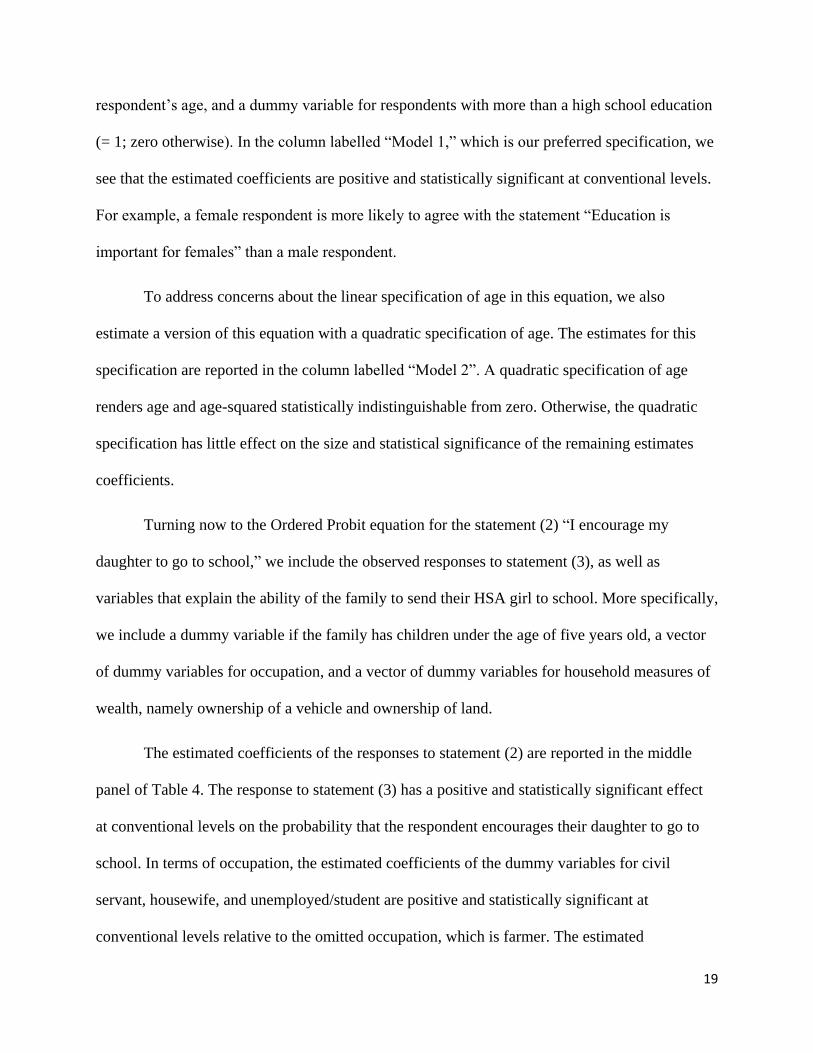
respondent’s age, and a dummy variable for respondents with more than a high school education
(= 1; zero otherwise). In the column labelled “Model 1,” which is our preferred specification, we
see that the estimated coefficients are positive and statistically significant at conventional levels.
For example, a female respondent is more likely to agree with the statement “Education is
important for females” than a male respondent.
To address concerns about the linear specification of age in this equation, we also
estimate a version of this equation with a quadratic specification of age. The estimates for this
specification are reported in the column labelled “Model 2”. A quadratic specification of age
renders age and age-squared statistically indistinguishable from zero. Otherwise, the quadratic
specification has little effect on the size and statistical significance of the remaining estimates
coefficients.
Turning now to the Ordered Probit equation for the statement (2) “I encourage my
daughter to go to school,” we include the observed responses to statement (3), as well as
variables that explain the ability of the family to send their HSA girl to school. More specifically,
we include a dummy variable if the family has children under the age of five years old, a vector
of dummy variables for occupation, and a vector of dummy variables for household measures of
wealth, namely ownership of a vehicle and ownership of land.
The estimated coefficients of the responses to statement (2) are reported in the middle
panel of Table 4. The response to statement (3) has a positive and statistically significant effect
at conventional levels on the probability that the respondent encourages their daughter to go to
school. In terms of occupation, the estimated coefficients of the dummy variables for civil
servant, housewife, and unemployed/student are positive and statistically significant at
conventional levels relative to the omitted occupation, which is farmer. The estimated

20
coefficients of the dummy variables for own a bicycle and for own a motorcycle are negative and
statistically significant at conventional levels, relative to the omitted category, which is own an
automobile. This suggests that high income or high wealth households are more likely to
encourage their daughters to go to school beyond the 5th class. In contrast, the estimated
coefficient of the dummy variable for owning some land but less than 2 acres is positive and
statistically significant at conventional levels; whereas, the estimated coefficient for owning
more than 8 acres of land is negative and statistically significant at conventional levels. This
suggests that “rich” farmers are less likely to encourage their HSA girl to attend school. The
omitted category in this case is owns no land.
Finally, the Probit equation for the statement “HSA girl attends school beyond the 5th
class,” which is reported in the upper panel labelled (1), we include variables that influence the
daughter’s decision to attend school, namely the observed response to the previous statement,
distance to school in kilometers, a dummy variable equal to one if she walks to school, and a
dummy variable equal to one if the family has a child under the age of five years old. We also
include a vector of dummy variables for the school to control for unobserved characteristics of
the schools.
The observed response to statement (2) “I encourage my daughter to attend school” has a
positive and statistically significant effect at conventional levels on the probability that the HSA
girl will attend school beyond the 5th class. As expected, walks to school and distance to school
have a negative and statistically significant effect on the probability that the HSA girl attends
school beyond the 5th class. The estimated coefficient of the dummy variable for a child under
age five years old is indistinguishable from zero at convention levels of significance.
21
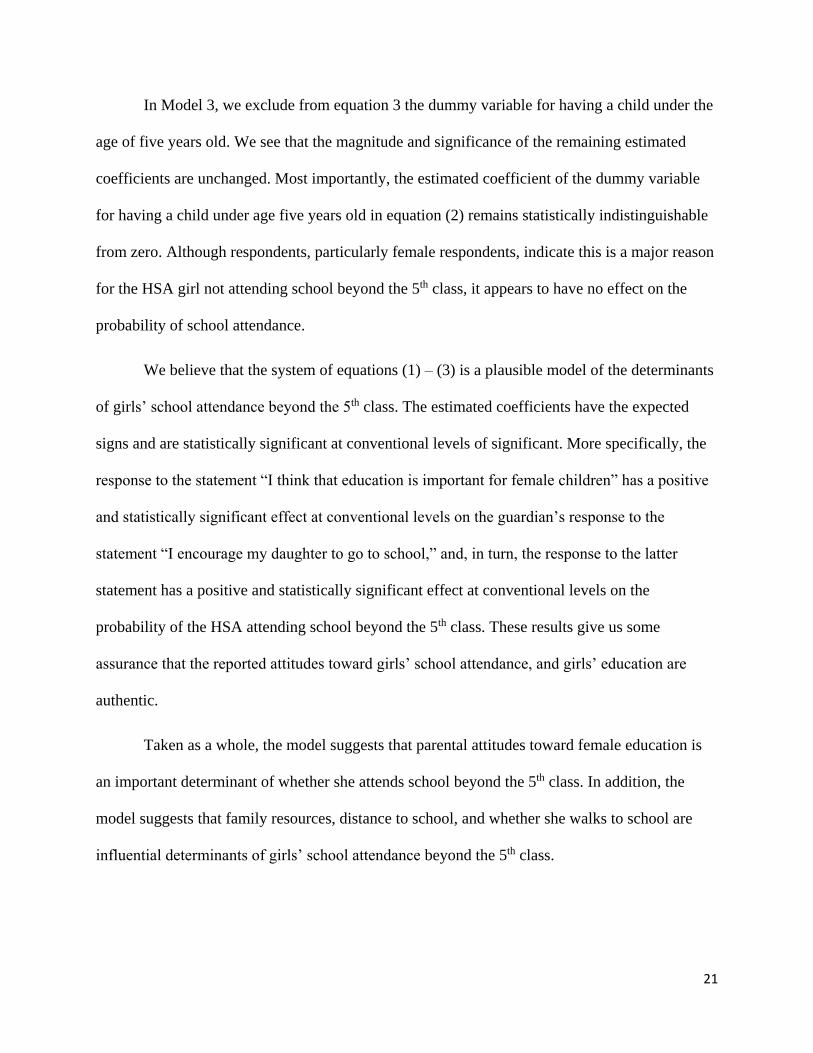
In Model 3, we exclude from equation 3 the dummy variable for having a child under the
age of five years old. We see that the magnitude and significance of the remaining estimated
coefficients are unchanged. Most importantly, the estimated coefficient of the dummy variable
for having a child under age five years old in equation (2) remains statistically indistinguishable
from zero. Although respondents, particularly female respondents, indicate this is a major reason
for the HSA girl not attending school beyond the 5th class, it appears to have no effect on the
probability of school attendance.
We believe that the system of equations (1) – (3) is a plausible model of the determinants
of girls’ school attendance beyond the 5th class. The estimated coefficients have the expected
signs and are statistically significant at conventional levels of significant. More specifically, the
response to the statement “I think that education is important for female children” has a positive
and statistically significant effect at conventional levels on the guardian’s response to the
statement “I encourage my daughter to go to school,” and, in turn, the response to the latter
statement has a positive and statistically significant effect at conventional levels on the
probability of the HSA attending school beyond the 5th class. These results give us some
assurance that the reported attitudes toward girls’ school attendance, and girls’ education are
authentic.
Taken as a whole, the model suggests that parental attitudes toward female education is
an important determinant of whether she attends school beyond the 5th class. In addition, the
model suggests that family resources, distance to school, and whether she walks to school are
influential determinants of girls’ school attendance beyond the 5th class.

22
5. Conclusion
We find little evidence of widespread disapproval of girls’ education and school
attendance in the Dir District of KPK. In fact, our results seem to indicate that the residents of
Dir generally have moderate to strongly favorable attitudes towards girls’ education.
Furthermore, respondents feel that their neighbors share these positive sentiments. Asking about
neighbors allows us to consider residents who presently do not have an HSA girl child. Given
these results, we are able to better understand the reasons for the large education gender gap.
As many respondents cited financial constraints on their girl child not attending school,
the evidence seems to point towards economic, rather than cultural, constraints creating the
education gender gap in the Dir District. Specifically, respondents are most likely to cite their
need for the girl child to do housework as the reason for nonattendance. If families had greater
financial resources, they could utilize outside services to help with the chores and childcare, thus
enabling the girl child to have time to go to school. Additionally, many respondents said that the
girl child did not like school or that she had trouble arriving at school. Difficulty arriving at
school is likely a matter of lack of financial resources and/or lack of available girl schools. If
families had more money, they would be better able to procure transportation to school for their
girl child. Furthermore, increasing funding and subsequently building more girl schools would
make transportation to school easier. In terms of the girl child not liking school, these results are
more difficult to interpret. While increasing funding to girl schools may help with this issue,
more research should be done to ascertain what aspects of the girl schools need to be improved.
Overall, the impediments to closing the gender gap seem to err on the side of economic
constraints rather than sociocultural resistance.
23
References
Aslam, M. (2006). Rates of return to education by gender in Pakistan (Economic Series
Working Papers GPRG-WPS-064). Oxford: University of Oxford, Department of
Economics.
Burde, D., & Linden, L. L. (2012). The effect of village-based schools: Evidence from a
randomized controlled trial in Afghanistan (NBER Working Paper 18039). Cambridge,
MA: The National Bureau of Economic Research.
Chaudhury, N., Hammer, J., Kremer, M., Muralidharan, K., & Rogers, K. (2006). Missing in
action: teacher and health worker absence in developing countries. Journal of Economic
Perspectives, 20(1), 91-116.
Chitrakar, R. (2009). Overcoming barriers to girls’ education in South Asia. Deepening the
analysis. Girls Too! Education for All, 1-128.
Duflo, E. (2012). Women empowerment and economic development. Journal of Economic
Literature, 50(4), 1051–1079.
Gao, C. & Lahiri, K. (2000). Further consequences of viewing LIMIL as an iterated Aitken
estimator. Journal of Econometrics, 98(2), 187-202.
Gertler, P., & Glewwe, P. (1992). The willingness to pay for education for daughters in contrast
to sons: evidence from rural Peru. The World Bank Economic Review, 6(11), 171-188.
Government of Pakistan Statistics Division. Pakistan Bureau of Statistics. (2013). Pakistan social
and living standards measurement survey (2011-12). Islamabad: Government of Pakistan.
Government of the Punjab. (2012). Punjab Women Empowerment Package, 2012. Punjab
Education Foundation.
Glewwe. (1999). Why does mother’s schooling raise child health in developing countries?:
evidence from Morocco. Journal of Human Resources, 24(1), 124-159.
Holmes, J. (2003). “Measuring the determinants of school completion in Pakistan: analysis of
censoring and selection bias.” Economics of Education Review 22: 249-64.
Ismail, Z. (1996). Gender differentials in the cost of primary education: a study of Pakistan. The
Pakistan Development Review, 35(4), 835-849.
Janzen, M. D. (2008). The women of Agabagaya: education and post-development theory.
Canadian Journal of Education, 31(1), 8–31.
King, E. M., & Hill, M. A. (1997). Women’s education in developing countries: barriers,
benefits, and policies. Baltimore, MD: The Johns Hopkins University Press.
24
Kremer, M., Chaudhury, N., Rogers, F., Muralidharan, K., & Hammer, J. (2005). Teacher
absence in India: a snapshot. Journal of the European Economic Association, 3(2-3),
658-667.
Lokshin, M., & Sawada, Y. (2001). Household schooling decisions in rural Pakistan (Policy
Research Working Paper 2541). Washington, DC: The World Bank.
Memon, G. (2007). Education in Pakistan: The key issues, problems and the new challenges.
Journal of Management and Social Sciences, 3(1), 47-55.
Muralidharan, K., & Sundararaman, V. (2011). Teacher performance pay: experimental evidence
from India. Journal of Political Economy, 119(1), 39-77.
Pagan, A. (1979). Some consequences of viewing LIML as an iterated Aitken estimator.
Economics Letters, 3, 369-72.
Patel, I. (1998). The contemporary women's movement and women's education in India.
International Review of Education, 44(2/3), 155–175.
Pervaiz et al. (2011). Gender inequality and economic growth: a time series analysis for
Pakistan. Middle East Journal of Scientific Research, 10(4), 434-439.
Purewal, N., & Hashmi, N. (2014). Between returns and respectability: parental attitudes towards
girls’ education in rural Punjab, Pakistan. British Journal of Sociology of Education,
36(7), 977-995.
Qureshi, S. (2004). Pakistan: education and gender policy. Girl's education: a lifeline to
development. Budapest, Hungary: Center for Policy Studies.
Rezai-Rashti, G. M., & Moghadam, V. M. (2011). Women and higher education in Iran: what
are the implications for employment and the "marriage market?" International Review of
Education, 57(3/4), 419–441.
Roodman, D. (2011). Fitting fully observed recursive mixed-process models with cmp. The Stata
Journal, 11(2), 159-206.
Ross, C., Masters, R., & Hummer, R. (2012) Education and the gender gaps in health and
mortality. Demography, 49(4), 1157-1183.
Shapiro, D. (2012). Women's education and fertility transition in sub-Saharan Africa. Vienna
Yearbook of Population Research, 10, 9–30.
Sustainable Development Policy Institute. (2008). Pakistan: country gender profile. Islamabad.
31
Appendix
02
04
06
08
0
Per
cent
Strongly disagree Disagree Undecided Agree Strongly Agree0
Figure 1a: "I believe that education is important."
02
04
06
0
Per
cent
0 Strongly disagree Disagree Undecided Agree Strongly agree
Figure 1b: "I believe that education is important for female children."
02
04
06
0
Per
cent
0 Strongly disagree Disagree Undecided Agree Strongly agree
Figure 1c: "I encourage (name of student) to attend school.
02
04
06
0
Per
cent
0 Strongly disagree Disagree Undecided Agree Strongly agree
Figure 1d: "I believe that education is important only for male children."

32

33

34
0%
10%
20%
30%
40%
50%
60%
Strongly Disagree Disagree Undecided Agree Strongly Agree
Figure 3
Statement: "In my village, people believe that it is important for
female children to attend school beyond the 5th class?"
0%
10%
20%
30%
40%
50%
60%
70%
80%
Strongly Disagree Disagree Undecided Agree Strongly Agree
Figure 4
"In my village, people believe that women should not have careers?"

35
0%
10%
20%
30%
40%
50%
60%
70%
80%
90%
100%
More than 80% of the time More than 50% of the time
but less than 80%
Less than 50% of the time
but more than 20%
Less than 20% of the time
Figure 5
Reported attendance rate of girls attending school beyond the 5th class.
36
0 20 40 60 80 100 120
She is needed at home to do chores.
She is needed at home to help take care of younger children.
The school is too far away for her to get there.
She doesn’t like school.
Other
She doesn't feel like she fits in with the other students.
She doesn't have school supplies.
The school is in bad condition.
We prefer to send her to Madrassah.
We cannot afford to educate her further.
I do not permit her to go to school.
She is sick.
She doesn't see any value to going to school.
She has concerns about her personal safety.
Some family members do not want her to attend school.
Her school is unsafe.
She is getting married or of marriage age.
She doesn't like some of her classmates.
The teacher is often absent.
Girls from our family and/or village do not attend high…
She is working outside the home.
Education leads to moral decay.
She has concerns about reprisals for attending school.
Figure 6
"Reasons given for high-school-aged girl not attending school beyond the 5th
class."

37
Table 1: Literacy Rates for the Population 10 Years and Older
Region 2007-2008 2011-2012 2013-2014
male female male female male female
Pakistan 69 44 70 47 70 47
Baluchistan 66 23 65 23 59 25
Khyber Paktunkhwa 68 33 72 35 72 36
Punjab 70 48 70 51 71 52
Sindh 69 42 72 47 67 43
Source: Government of Pakistan Statistics Division. (2013). Pakistan social and living standards
measurement survey (2011-12). Islamabad, Pakistan: Pakistan Bureau of Statistics.

38
Table 2: Sample Means and Standard Deviations
Variable Full sample Female guardians Male guardians
t-statistic
(p-value)
Respondent’s gender (Female = 1) 0.388
(0.488) - - -
Respondent’s age 43.555
(12.088)
46.618
(9.838)
41.613
(12.088)
5.739***
(0.000)
Respondent’s education
No formal education 0.398
(0.489)
0.474
(0.499)
0.366
(0.482)
2.707***
(0.007)
Some primary school 0.107
(0.310)
0.080
(0.272)
0.107
(0.331)
1.125
(0.261)
Some middle school 0.291
(0.455)
0.378
(0.486)
0.237
(0.426)
3.755***
(0.000)
At least some high school 0.204
(0.403)
0.068
(0.253)
0.290
(0.454)
7.941***
(0.000)
Respondent’s occupation
Farmer/business owner 0.277
(0.448)
0.016
(0.125)
0.444
(0.497)
16.279***
(0.000)
Laborer in Gulf States 0.223
(0.416)
0.004
(0.063)
0.361
(0.481)
14.518***
(0.000)
Civil servant 0.064
(0.245)
0.076
(0.266)
0.056
(0.230)
0.977
(0.329)
Housewife 0.358
(0.480)
0.900
(0.301)
0.015
(0.128)
43.946***
(0.000)
Unemployed/student 0.069
(0.253) -
0.112
(0.306) -
Other 0.009
(0.096)
0.004
(0.063)
0.012
(0.112)
1.156
(0.248)
Distance to school (kilometers) 1.663
(1.67)
1.572
(1.231)
1.721
(1.897)
1.207
(0.228)
Walk to school (YES = 1) 0.751
(0.433)
0.651
(0.478)
0.814
(0.389)
4.516***
(0.000)
High-school-aged girl attends school beyond
5th class
0.795
(0.404)
0.827
(0.379)
0.775
(0.418)
1.627
(0.104)
Measures of Household Wealth
1. Own vehicle
Own a motorcycle (YES = 1) 0.028
(0.165)
0.016
(0.126)
0.036
(0.186)
1.623
(0.105)
Own a bicycle (YES = 1) 0.016
(0.124)
0.004
(0.063)
0.023
(0.150)
2.221**
(0.027)
Own an automobile (YES = 1) 0.246
(0.431)
0.245
(0.430)
0.245
(0.043)
0.000
(1.000)
Own another motorized vehicle (YES =
1)
0.711
(0.454)
0.735
(0.442)
0.696
(0.461)
1.071
(0.285)
2. Own land
Own no land 0.338
(0.473)
0.591
(0.492)
0.179
(0.383)
11.232***
(0.000)
Own 0 < acres of land ≤ 2 0.541
(0.498)
0.365
(0.481)
0.652
(0.476)
7.396***
(0.000)
Own 2 < acres of land ≤ 4 0.066
(0.248)
0.028
(0.165)
0.090
(0.286)
3.480***
(0.001)
Own 4 < acres of land ≤ 8 0.027
(0.162)
0.008
(0.089)
0.038
(0.191)
2.687***
(0.007)
Own more than 8 acres of land 0.028
(0.165)
0.008
(0.089)
0.041
(0.198)
2.877***
(0.004)
3. Own home (YES = 1) 0.942
(0.233)
0.944
(0.231)
0.941
(0.235)
0.159
(0.874)
Number of observations 642 249 393 -

39
Table 3: Sample Means and Standard Deviations
“Reasons Given for High School Aged Girls’ Nonattendance beyond the 5th class”
Variable
Female guardians Male guardians
t-statistic
(p-value)
I do not permit her to go to school 0.039
(0.195)
0.056
(0.231)
0.656
(0.513)
The school is too far away for her to get there. 0.079
(0.270)
0.252
(0.436)
3.965***
(0.000)
She is needed at home to do chores. 0.543
(0.500)
0.273
(0.447)
4.654***
(0.000)
She is needed at home to take care of younger children. 0.299
(0.460)
0.238
(0.427)
1.125
(0.262)
She is sick. 0.071
(0.258)
0.028
(0.165)
1.609
(0.109)
She doesn't like school. 0.276
(0.449)
0.084
(0.278)
4.162***
(0.000)
She is working outside the home. 0.016
(0.125)
0.007
(0.084)
0.685
(0.494)
The teacher is often absent.
- 0.028
(0.165)
2.029**
(0.044)
The school is in bad condition. 0.008
(0.089)
0.119
(0.783)
1.683*
(0.095)
She doesn't like some of her classmates 0.024
(0.152)
0.021
(0.144)
0.166
(0.868)
She doesn't feel like she fits in with the other students. 0.157
(0.366)
0.049
(0.217)
2.903***
(0.004)
She doesn't have school supplies. 0.094
(0.294)
0.098
(0.298)
0.111
(0.912)
She doesn't see any value to going to school. 0.071
(0.258)
0.028
(0.165)
1.609
(0.109)
She has concerns about her personal safety. 0.008
(0.089)
0.077
(0.267)
2.913***
(0.004)
She has concerns about reprisals for attending school
- - -
She is getting married or of marriage age. 0.063
(0.244)
0.070
(0.256)
0.230
(0.818)
Girls from our family and/or village do not attend high school. 0.031
(0.175) -
1.996**
(0.048)
Some family members do not want her to attend school. 0.024
(0.152)
0.049
(0.217)
1.106
(0.270)
We cannot afford to educate her further. 0.024
(0.152)
0.084
(0.278)
2.232**
(0.027)
Education leads to moral decay. 0.016
(0.125)
0.007
(0.084)
0.685
(0.494)
We prefer to send her to Madrassah. 0.047
(0.213)
0.070
(0.256)
0.805
(0.421)
Her school is unsafe.
- 0.063
(0.244)
3.088***
(0.002)
Other
- 0.196
(0.398)
5.889***
(0.000)
Number of Observations 127 143 -

40
Table 4: Determinants of High School Aged Girls’ School Attendance beyond the 5th Class
Limited Information Maximum Likelihood (LIML) Estimates of a Mixed-Process, Simultaneous Equations Model
Variable Model 1 Model 2 Model 3 Probit (Yes = 1) (1) “High school aged girl attends school beyond 5th class?”
Encourage high school aged girl to attend school (endogeneous regressor, eq 2) 0.496**
(0.224)
0.501**
(0.230)
0.460**
(0.224)
Distance to school (kilometers) -0.083*
(0.045)
-0.083*
(0.045)
-0.082*
(0.045)
Walks to school -0.841***
(0.241)
-0.840***
(0.241)
-0.855***
(0.240)
Respondent has at least one child less than 5 years old 0.163
(0.172)
0.164
(0.172) -
Constant 1.613***
(0.366)
1.597***
(0.388)
1.674***
(0.124)
Ordered Probit (Strongly disagree = 1, …, Strongly agree = 5) (2) “I encourage my daughter to go to school.”
Education is important for female children (endogeneous regressor, eq 3) 0.432*
(0.253)
0.430*
(0.257)
0.440*
(0.251)
Respondent has at least one child less than 5 years old -0.189
(0.125)
-0.189
(0.125)
-0.169
(0.124)
Laborer (= 1) -0.104
(0.136)
-0.104
(136)
-0.104
(0.136)
Civil servant (= 1) 0.548*
(0.284)
0.549*
(0.284)
0.543*
(0.288)
Housewife (= 1) 0.349**
(0.153)
0.349**
(0.154)
0.355*
(0.154)
Unemployed/student (= 1) 0.788**
(0.319)
0.786**
(0.321)
0.806***
(0.315)
Other (= 1) 0.371
(0.575)
0.374
(0.574)
0.377
(0.592)
Motorcycle (= 1) -0.677***
(0.260)
-0.678***
(0.260)
-0.675**
(0.264)
Bicycle (=1) -0.717*
(0.375)
-0.719*
(0.375)
-0.709*
(0.380)
Other motorized vehicle (=1) -0.085
(0.123)
-0.085
(0.123)
-0.086
(0.124)
Between 0 and 2 acres (= 1) 0.237**
(0.117)
0.237**
(0.117)
0.237**
(0.118)
Between 2 and 4 acres (= 1) 0.338
(0.230)
0.338
(0.230)
0.332
(0.232)
Between 4 and 8 acres (= 1) -0.378
(0.238)
-0.378
(0.238)
-0.384
(0.237)
More than 8 acres (= 1) -0.798***
(0.276)
-0.799***
(0.276)
-0.794***
(0.280)
Ordered Probit (Strongly disagree = 1, …, Strongly agree = 5) (3) “Education is important for females.”
Respondent’s relationship to high school aged girl (mother = 1) 0.434***
(0.104)
0.432***
(0.105)
0.435**
(0.104)
Respondent’s age 0.018***
(0.004)
0.021
(0.021)
0.018***
(0.004)
Respondent’s age-squared - -0.000
(0.000) -
More than high school education 0.369***
(0.121)
0.370***
(0.121)
0.370***
(0.121)
Number of observations 641 641 641
Wald Χ2
(p-value)
141.0
(0.000)
141.0
(0.000)
140.3
(0.000)
Natural logarithm of the pseudolikelihood function -1,380.2 -1,380.2 -1,380.6
Includes dummy variables for school district in equation (1) Yes Yes Yes
Robust standard errors are reported in parentheses. *indicates statistical significance at the 10 percent level; ** indicates statistical significance at
the 5 percent level; and *** indicates statistical significance at the 1 percent level.

41
Survey Instrument
(Note: Figures in parentheses reflect the frequency of responses to a given question)
Section A: Demographics
1 Name of the
Student
2 Age of the
Student
3
Your
relationship
with the
student
Mother
(249)
Father
(312)
Grandmother
(0)
Grandfather
(12)
Other
(Please
Specify) (69)
4 Your age
5
Name of the
school last
attended
6
Name of the
parent
interviewed
7 What is your
occupation?
8
Education None
(255)
Primary
(69)
Middle
(187)
SSC
(78)
FA/FSc
(24)
BA/BS
c
(15)
MA or
Higher
(12)
Professi
onal
Degree
(MBBS
Etc.)
(1)
Darse
Niza
mi
(1)
9
Which of the
following ethic group
do you most identify
yourself as a member
of:
Pashtun
(642)
Hindko
speaking
Chitral
i
Other (Please Specify):
1
0
What type of vehicle
do you own?
Car
(157)
Motorcycl
e
(18)
Bicycl
e
(0)
Another motorized
vehicle
(10)
Do not own a
Vehicle (455)
1
1
Do you own your
home?
Yes
(605)
No
(37)
1
2
How much land do
you Own
None
(217)
Less than 2 acres
(346)
2 to 4
acres
(42)
4 to 8 acres
(17)
8 or above
acres
(18)
1
3
How far is the school
from your house?
1
4
How does your female child go to school?
(means of transportation)

42
13. Number of Children (Under the age of 18) in the household:
Number of Children Gender Age
Child 1
Child 2
Child 3
Child 4
Child 5
Child 6
Child 7
Child 8
Child 9
Child 10
14. How long have lived in this village? ______________________________________
43
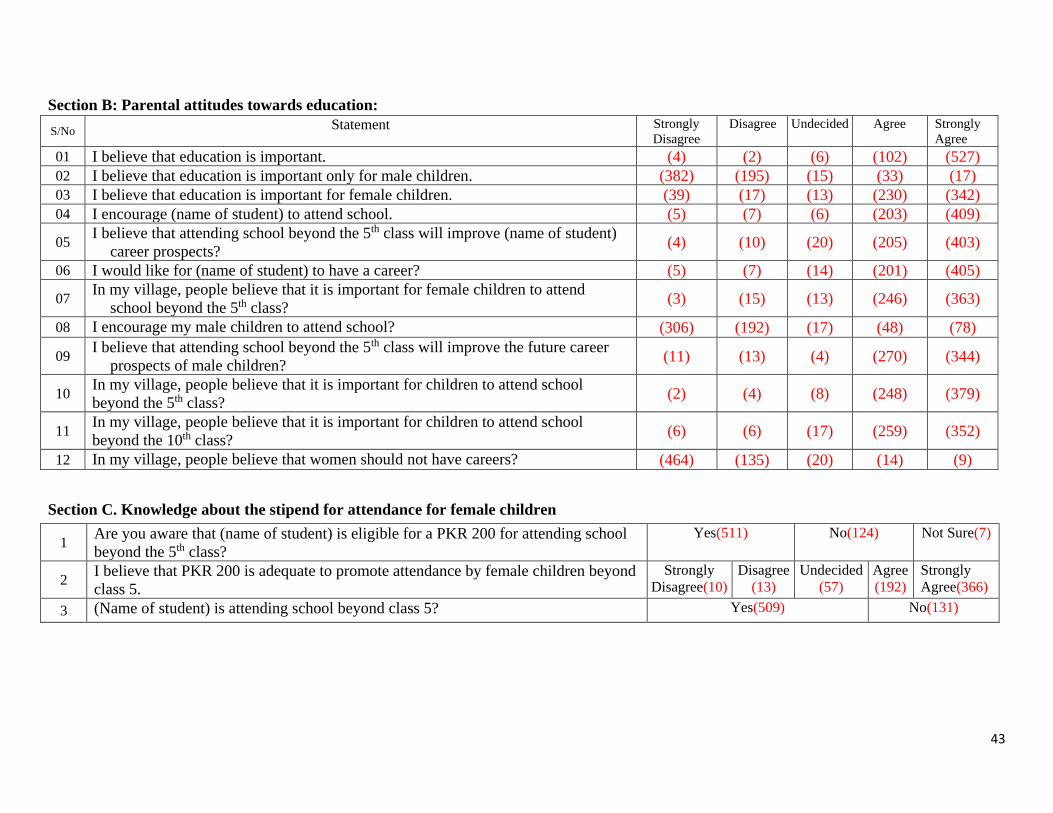
Section B: Parental attitudes towards education:
S/No Statement Strongly
Disagree
Disagree Undecided Agree Strongly
Agree
01 I believe that education is important. (4) (2) (6) (102) (527)
02 I believe that education is important only for male children. (382) (195) (15) (33) (17)
03 I believe that education is important for female children. (39) (17) (13) (230) (342)
04 I encourage (name of student) to attend school. (5) (7) (6) (203) (409)
05 I believe that attending school beyond the 5th class will improve (name of student)
career prospects? (4) (10) (20) (205) (403)
06 I would like for (name of student) to have a career? (5) (7) (14) (201) (405)
07 In my village, people believe that it is important for female children to attend
school beyond the 5th class? (3) (15) (13) (246) (363)
08 I encourage my male children to attend school? (306) (192) (17) (48) (78)
09 I believe that attending school beyond the 5th class will improve the future career
prospects of male children? (11) (13) (4) (270) (344)
10 In my village, people believe that it is important for children to attend school
beyond the 5th class? (2) (4) (8) (248) (379)
11 In my village, people believe that it is important for children to attend school
beyond the 10th class? (6) (6) (17) (259) (352)
12 In my village, people believe that women should not have careers? (464) (135) (20) (14) (9)
Section C. Knowledge about the stipend for attendance for female children
1 Are you aware that (name of student) is eligible for a PKR 200 for attending school
beyond the 5th class?
Yes(511) No(124) Not Sure(7)
2 I believe that PKR 200 is adequate to promote attendance by female children beyond
class 5.
Strongly
Disagree(10)
Disagree
(13)
Undecided
(57)
Agree
(192)
Strongly
Agree(366)
3 (Name of student) is attending school beyond class 5? Yes(509) No(131)

44
If the answer to 3 above is Yes, please answer the following question; otherwise skip to question 7.
4. (name of student) receives a stipend for attending school. How do you use the stipend? (circle all that apply).
1. To buy school supplies. (436)
2. Household expenses. (20)
3. Medical expenses. (0)
4. (name of student) gets to spend the stipend on discretionary items. (162)
5. Other (please specify) (5)
5. To the best of my knowledge, (Name of student) attends school (circle the one that best applies)
1. More than 80 percent of the time (363)
2. More than 50 percent of the time but less than 80 percent (126)
3. Less than 50 percent of the time but more than 20 percent (15)
4. Less than 20 percent of the time (1)
6. Why does (name of student) attend school?
1. She enjoys school. (64)
2. She wants to go to school. (191)
3. An education will help her to attain a better career. (141)
4. An education will aid her in her duties as a wife and mother. (11)
5. She will be better able to provide for us in old age. (11)
6. Her education improves her abilities in her household chores. (28)
7. An education will make her a well-rounded person. (22)
8. An education will make her more attractive to her future husband. (5)
9. An education will increase her future earnings potential. (26)
10. Her friends attend school. (1)
11. Women in our family and/or village attend school. (2)
12. The school is in good condition. (1)
13. She has a good teacher. (3)
14. Other (please specify) (0)

45
If the answer to question 5 is 2, 3, or 4, please answer the following question; otherwise you can STOP
here.
7. What are the main reasons for (name of student) for missing school? (circle all that apply)
1. She is needed at home to do chores. (117)
2. She is needed at home to help take care of younger children. (86)
3. She is sick. (18)
4. She doesn’t like school. (61)
5. She cannot get to school due to a lack of transportation and/or bad weather. (58)
6. She is working outside the home. (2)
7. Teacher is often absent. (5)
8. The school is in bad condition. (6)
9. She doesn’t like her teacher. (6)
10. She doesn’t like some of her classmates. (4)
11. She doesn’t feel like she fits in with the other students. (32)
12. She doesn’t have school supplies. (28)
13. She doesn’t see any value to going to school. (18)
14. She has concerns about her personal safety. (11)
15. She has concerns about reprisals for attending school. (3)
16. Her school is unsafe. (19)
17. Other (please specify) (18)
8. Why does (name of student) not attend school? (circle all that apply)
1. I do not permit her to go to school. (13)
2. The school is too far away for her to get there. (47)
3. She is needed at home to do chores. (108)
4. She is needed at home to help take care of younger children. (72)
5. She is sick. (13)
6. She doesn’t like school. (47)
7. She is working outside the home. (3)
8. The teacher is often absent. (4)
9. The school is in bad condition. (18)
10. She doesn’t like some of her classmates. (6)
11. She doesn’t feel like she fits in with the other students. (27)
12. She doesn’t have school supplies. (26)
13. She doesn’t see any value to going to school. (13)
14. She has concerns about her personal safety. (12)
15. She has concerns about reprisals for attending school. (0)
16. She is getting married or of marriage age. (8)
17. Girls from our family and/or village do not attend high school. (4)
18. Some family members do not want her to attend school. (10)
19. We cannot afford to educate her further. (15)
20. Education leads to moral decay. (3)
21. We prefer to send her to Madrassah. (16)
22. Her school is unsafe. (9)
23. Other (please specify) (28)


