Download - WFP Supply Chain Annual Report 2016

Figh
ting
Hun
ger
Wor
ldw
ide
2016WFP SUPPLY CHAIN ANNUAL REPORT

Contents
Foreword 1
An overview of WFP’s supply chain 2
Emergency response 5Focus on Yemen 6Focus on Nigeria 8Special Operations 10Standby Partners 11
The global supply chain 13Supply chain planning 13Food procurement 14Procurement of goods and services 15Food safety and quality 16Shipping 19Aviation 20Surface transport 22Global truck fleet 23
Shared humanitarian services 25UN Humanitarian Response Depot 25
UN Humanitarian Air Service 26Logistics Cluster 27Bilateral Services 28Delivering against the odds in Deir Ezzor, Syria 30
Reliability and cost-efficiency 31LESS: WFP’s key to real-time decisions 31How WFP optimizes its supply chain 32
Agility 33Advance positioning 33
Strengthening national capacities and markets 34WFP and the retail sector 34Paving the road from farm to market 35
Annex 36Where WFP purchased food in 2016 36Where WFP purchased goods and services in 2016 38Contributions received for WFP Special Operations in 2016 40
Photo credits 40

Foreword
In 2016, WFP faced an unprecedented number of complex emergencies challenging our systems and people. The WFP Supply Chain continued to deliver large-scale food assistance to Central African Republic, South Sudan and Syria, while at the same time responding to new spikes in needs in Nigeria, Southern Africa and Yemen.
2016 was also the first full year of the WFP Supply Chain – previously managed through separate Procurement and Logistics Divisions. Teams across the world came together to formulate the mission for the function: • Deliver WFP food assistance with a special focus on emergencies • Strengthen national supply chain capacities and local and regional markets• Support partners to achieve their own sustainable development goals
The above is underpinned by a performance optimisation objective, including a target to achieve ten percent in cost efficiency across the function by 2021.
We achieved efficiency gains of US$89 million in 2016 through end-to-end supply planning and strategic purchase decisions, supported by market information and new tools. This enabled WFP to deliver between 180 to 270 million more rations for the same dollar value, depending on whether in conflict or non-conflict areas. We expect these gains to increase as we work with governments, suppliers and donors to reach the optimal supply plan for our operations.
WFP spent US$4.3 billion of its total budget of US$6 billion in Supply Chain-related expenditure, approximately 60 percent of witch in local markets. Our footprint and Supply Chain expertise help strengthen local markets and institutional capacities, improve food systems and support governments and local Supply Chain actors to become strong first-line responders in emergencies.
One example of our work in this area: the vulnerable spend up to two-thirds of their income on food in what are often times inefficient and fragmented rural markets. We worked with retail experts to help develop the supply chains of retailers in initially four countries where WFP beneficiaries redeem vouchers. The results show a ten percent reduction of prices on the shelves in the retail shops. This translates into a boost in purchasing power for local customers, and once scaled, can become a significant stride toward Zero Hunger.
We continued to use our global capacity and decades of experience in logistics and supply chain management to provide shared services to the global humanitarian community through the Logistics Cluster, United Nations Humanitarian Air Service, and the United Nations Humanitarian Response Depot. WFP Supply Chain also provided, upon request, bilateral logistics services – ranging from shipping to warehousing solutions, with increasing requests from the health sector.
Innovation plays an important role in WFP’s ability to respond efficiently to increasingly complex emergencies and humanitarian needs. For the very first time in humanitarian aviation, we conducted high-altitude airdrops of food and relief items – into Deir Ezzor, Syria – after working with partners to design the appropriate parachute configuration. Innovative transport and digital supply chain solutions are key to reach people in inaccessible areas, and further improve delivery time and efficiency.
WFP Supply Chain will continue to learn from its challenges and achievements to help governments and partners achieve their Sustainable Development Goals over the coming years.
Corinne FleischerDirector, WFP Supply Chain Division
WFP Supply Chain Annual Report 2016 1

An overview of WFP’s supply chain
Main parts of WFP’s supply chain
WFP’s supply chain spans the entire process of end-to-end planning, sourcing and delivery of assistance. We deliver safe and quality food, goods and services for WFP and the humanitarian community.
■ Food procurement
US$1.36 billion
■ Logistics
US$987 million
■ Cash-based transfers*
US$880 million
■ Procurement of
goods and services
US$584 million
■ In-kind food donated
by governments
US$453 million
* Undertakenincollaborationwithprogrammeandfinanceexperts
On any given day, WFP manages:
5,000 trucks
800+ WFP trucks
650 warehouses
35 fleet workshops
20 liner shipments
20 chartered vessels
60 load ports
75 discharge ports
70 aircraft
Airlifts
Airfreight
Airdrops
Tens of thousands of suppliers
including local retailers participating in
WFP’s cash-based transfer programmes
WFP Supply Chain Annual Report 20162

purchased 2.6 million metric tons (mt)
of food, valued at US$1.36 billion from
93 countries
delivered 3.5 million mt of food to 74
countries, of which 2.2 million mt travelled
by sea
supported over 450 NGO, government and
UN partners with air passenger transport,
emergency stockpiling and dispatch,
warehousing, and a range of supply chain
solutions
In 2016, WFP:
3WFP Supply Chain Annual Report 2016

Shared services: supporting the humanitarian community in 2016
• 33 partners served• 90 countries reached• 515 shipments, carrying 6,300 mt• US$51 million value of relief items dispatched
• 15 operations, covering 16 countries • 269 regular destinations • 282,552 passengers transported• 3,068 mt of light cargo transported
• 12 operations• 87,239 mt of relief supplies on behalf of
170 organizations, transported by Logistics Cluster partners• 454 organizations supported
• 12 operations• 57 partners served across 30 countries• 18,000 mt (37,000 cubic mt) handled • 70% of services provided by WFP
consisted of warehousing solutions
BILATERALSERVICES
4 2016 WFP Supply Chain Annual Report

Emergency response
Level 3 (L3) is the United Nations classification for the most severe, large-scale humanitarian crises. In 2016, WFP responded to six L3 Emergencies across 16 countries and two continents. 52 percent of all food procured, and 46 percent of all food delivered by WFP, was used to support people in L3 emergencies.
Conflicts and wars in Iraq, north-east Nigeria, South Sudan, Syria and Yemen caused unprecedented displacement. El Niño brought drought to southern Africa. The proportions of food purchased and delivered by WFP for L3 Emergencies soared to record highs.
WFP food purchases, donations and deliveries for L3 emergencies as percentages of annual totals, 2014–2016
Complex L3 Emergency responses in 2016
Syria and Syrian refugee crisis
EgyptIraq
JordanLebanon
Turkey
Yemen
Iraq
Nigeria
South Sudan
El Niño: Southern Africa
droughtLesotho
MadagascarMalawi
MozambiqueSwaziland
ZambiaZimbabwe2014 2015
%
2016
100
90
80
70
60
50
40
30
20
10
0
2014 2015
%
2016
100
90
80
70
60
50
40
30
20
10
0
■Annualtotalfoodpurchases■WFPpurchasesforL3Emergencies■In-kinddonationsforL3Emergencies
■AnnualtotalofWFPdeliveries■WFPdeliveriesforL3Emergencies
5WFP Supply Chain Annual Report 2016

FOCUS ON YEMEN
Amid mounting challenges, WFP operated an agile, flexible supply chain — and was even able to save costs and reduce lead times by deploying new supply chain strategies.
WFP designed a forward hub concept whereby all WFP-procured food was stored in warehouses at Yemen’s three main entry points: Hudaydah, Sana’a and Aden. WFP outsourced these warehouses to commercial logistics service providers, then dispatched food from there to final delivery points (FDPs). This approach helped WFP to reduce lead times and deliver commodities when needs suddenly arose.
WFP rolled out downstream logistics innovations that included a new direct
distribution model, whereby WFP dispatched food from the port to FDPs, without transiting through a warehouse. This cut transport and storage costs and saved a total of US$1 million.
Supply chain staff improved WFP’s management of local transport capacity. By optimizing contracting processes, WFP cut idle times of its commercially contracted trucks and achieved US$2.4 million in savings.
Finally, WFP piloted a market-based approach to diversify the type of assistance it provides to families in hard-to-reach areas. WFP introduced the Commodity Voucher through Traders Network (CVTN), contracting local major importers of food items to establish
retail outlets and deliver commodity-based vouchers in urban settings. This proved to be a cost-effective alternative to general food distributions, and it enabled WFP to reach more areas with limited access. Recipient families then redeemed their vouchers at retail outlets managed by the importers.
While the suppliers delivered through their own supply chains, WFP complemented the CVTN with its own in-kind food assistance, ensuring that commodities were always on the shelves. By the end of 2016, WFP expanded the CVTN to seven governorates across Yemen, and delivered assistance to approximately 882,000 people through local retail networks.
Innovating WFP’s supply chain in Yemen to reach more people
Against the backdrop of civil war, a volatile operating environment and skyrocketing levels of food insecurity and
insufficient funding levels, WFP delivered food and voucher assistance to 7.4 million people in Yemen in 2016,
consistently reaching communities in conflict-affected areas where food needs were often the highest.
WFP Supply Chain Annual Report 20166

SAUDI ARABIA
ERITREA
ETHIOPIA
SOMALIA
DJIBOUTI
OMAN
Hudaydah
Sa’ada
AdenAden
Djibouti
Berbera
GULF OF ADEN
RED SEA
Ibb
To/from Am
man, Jordan
FromBrindisi,Italy
From D
ubai,
UAE
From Dub
ai, UAE10% of food
purchased in Yemen
YEMENSana’a
LogisticsCluster*
Coordination
Information management
Foodstorage
Storage
Fuelprovision
Forwardlogisticsbase
Roadtransport
Airtransport
Seatransport,cargo
Seatransport,passenger
UNHAS route
UNHRD air cargo route
UNHRDseacargoroute
Sea route, cargo
Searoute,passenger
*TheLogisticsClusterprovidescoordinationandinformationmanagementtopartners,andfacilitatesaccessto:air,landandseatransport;storage;andfuel.
Where WFP procured food for Yemen in 2016
United States of America, 51% (in-kind)
Black Sea Region (RussianFederation, Ukraine), 25%
Yemen, 10%
European Union (Belgium, France, Italy), 7%
Indonesia, 5%
Other (UNHRD, etc.), 3%
Total: 341,492 mt
7WFP Supply Chain Annual Report 2016
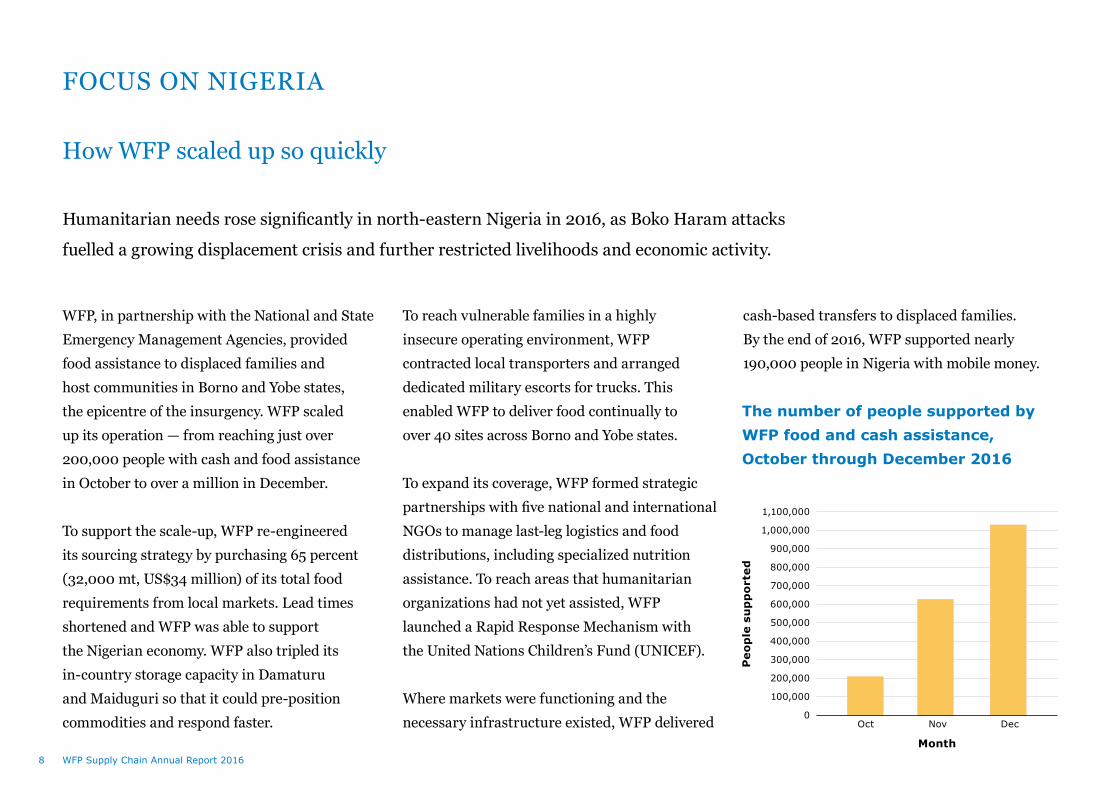
FOCUS ON NIGERIA
WFP, in partnership with the National and State Emergency Management Agencies, provided food assistance to displaced families and host communities in Borno and Yobe states, the epicentre of the insurgency. WFP scaled up its operation — from reaching just over 200,000 people with cash and food assistance in October to over a million in December.
To support the scale-up, WFP re-engineered its sourcing strategy by purchasing 65 percent (32,000 mt, US$34 million) of its total food requirements from local markets. Lead times shortened and WFP was able to support the Nigerian economy. WFP also tripled its in-country storage capacity in Damaturu and Maiduguri so that it could pre-position commodities and respond faster.
To reach vulnerable families in a highly insecure operating environment, WFP contracted local transporters and arranged dedicated military escorts for trucks. This enabled WFP to deliver food continually to over 40 sites across Borno and Yobe states.
To expand its coverage, WFP formed strategic partnerships with five national and international NGOs to manage last-leg logistics and food distributions, including specialized nutrition assistance. To reach areas that humanitarian organizations had not yet assisted, WFP launched a Rapid Response Mechanism with the United Nations Children’s Fund (UNICEF).
Where markets were functioning and the necessary infrastructure existed, WFP delivered
cash-based transfers to displaced families. By the end of 2016, WFP supported nearly 190,000 people in Nigeria with mobile money.
How WFP scaled up so quickly
Humanitarian needs rose significantly in north-eastern Nigeria in 2016, as Boko Haram attacks
fuelled a growing displacement crisis and further restricted livelihoods and economic activity.
The number of people supported by WFP food and cash assistance, October through December 2016
Month
1,100,000
1,000,000
900,000
800,000
700,000
600,000
500,000
400,000
300,000
200,000
100,000
0
Pe
op
le s
up
po
rte
d
Oct Nov Dec
WFP Supply Chain Annual Report 20168

YOBE STATE
BORNO STATE
Abuja Garoua
Ngaoundéré
Douala
Maroua
N’Djamena
Damatura Maiduguri
Ngala
Lomé
International and GCMF food purchases, and food donated by
governments
Lagos
NIGERIA
NIGER
CAMEROON
CHAD
TOGO
BENIN
Lake Chad
GULF OF GUINEA
Rann
Banki
65% of foodpurchased
locally
Primary route
Secondary route
Cross-borderoperation
Storage
Lagost
oMaidu
guri:1,715km
9WFP Supply Chain Annual Report 2016
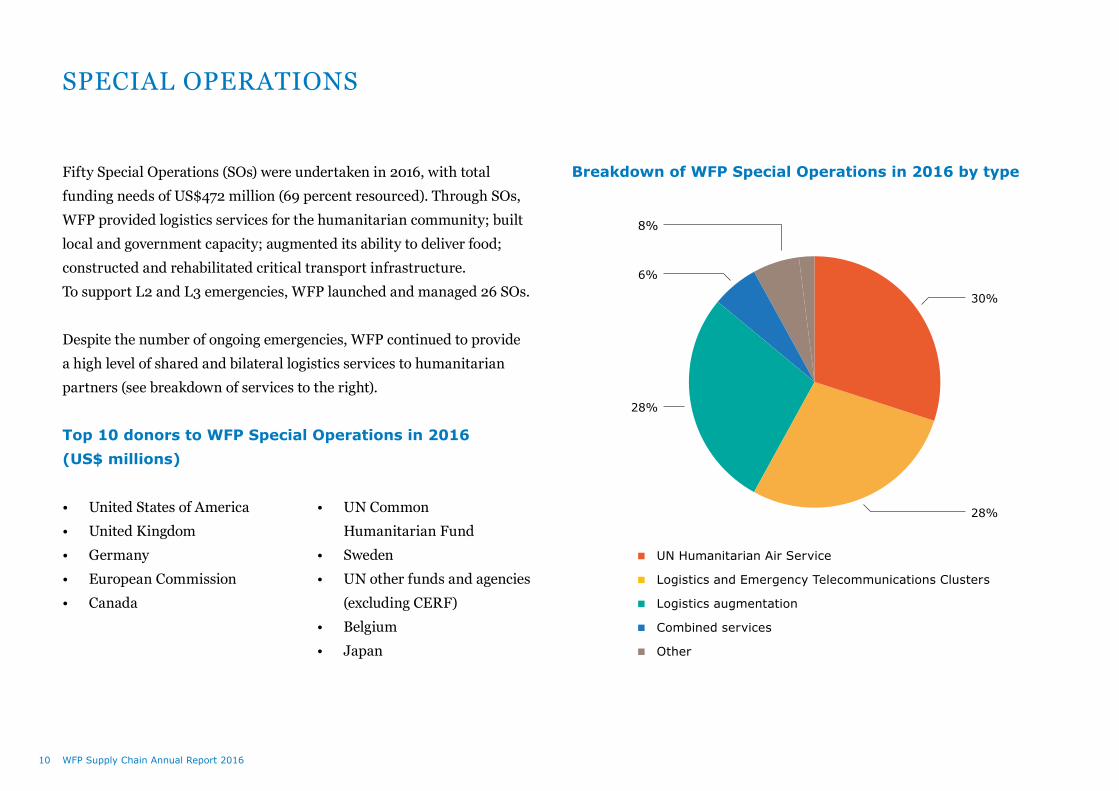
SPECIAL OPERATIONS
Fifty Special Operations (SOs) were undertaken in 2016, with total funding needs of US$472 million (69 percent resourced). Through SOs, WFP provided logistics services for the humanitarian community; built local and government capacity; augmented its ability to deliver food; constructed and rehabilitated critical transport infrastructure. To support L2 and L3 emergencies, WFP launched and managed 26 SOs.
Despite the number of ongoing emergencies, WFP continued to provide a high level of shared and bilateral logistics services to humanitarian partners (see breakdown of services to the right).
Top 10 donors to WFP Special Operations in 2016 (US$ millions)
Breakdown of WFP Special Operations in 2016 by type
• United States of America• United Kingdom• Germany• European Commission• Canada
• UN Common Humanitarian Fund
• Sweden• UN other funds and agencies
(excluding CERF)• Belgium• Japan
6%
28%
28%
30%
■ UN Humanitarian Air Service
■ LogisticsandEmergencyTelecommunicationsClusters
■ Logisticsaugmentation
■ Combinedservices
■ Other
WFP Supply Chain Annual Report 201610

STANDBY PARTNERS
Standby Partners (SBPs) are organizations that have formal agreements with WFP to maintain a roster of rapidly deployable staff and equipment to support emergency operations. SBPs include government agencies, NGOs and foundations. Their core role is to augment WFP’s response to emergencies, and SBP staff are deployed mainly at the onset of an emergency to meet WFP’s surge capacity requirements.
Key facts in 2016
• 165 SBP personnel deployed with WFP• 55 countries received deployed SBP personnel• 23,095 days, or approximately 770 months, of work were
contributed through SBP deployment • US$16.3 million was the in-kind value of SBP personnel,
quipment and training
Standby deployments to emergencies
• 77% of all Standby deployments related to WFP emergency operations• 7,211 days of support were provided by SBPs to L3 Emergencies• US$4,529,905 was the equivalent value, as in-kind contributions,
of these SBP deployments to L3 Emergencies
In-kind Contribution & Days to WFP Level 3 Regional Response
Sum of amount 2016 SumofTotaldays
Syria
Nigeria
Lebanon
Niger
Zimbabwe
Madagascar
Mozambique
Jordan
Malawi
Egypt
Lesotho
Turkey
Swaziland
South Sudan
Iraq
909
734
720
834
721
825
347
358
333
365
240
184
181
155
305
US$0 US$150,000 US$300,000 US$450,000 US$600,000 US$750,000
11WFP Supply Chain Annual Report 2016

12 WFP Supply Chain Annual Report 2016
The global supply chainSUPPLY CHAIN PLANNING
Through supply chain planning, WFP aims to cut operational costs and reduce lead times, so that we can deliver better assistance to the people we serve — whether that’s more diverse, nutritious products or higher purchasing power through our retail engagement strategy for cash-based transfers.
In 2016, WFP created the Supply Chain Planning Unit to carry out this critical work. They focus on four key areas:
• Supporting global, regional, and country-level planning and optimization exercises through advanced analytics and tools, with particular support to L3 emergency responses
• Providing support to performance monitoring and supply chain budget management for HQ, Regional Bureaux and Country Offices
• Piloting new initiatives and delivery models to increase operational agility, reduce costs, and share risk across the supply chain
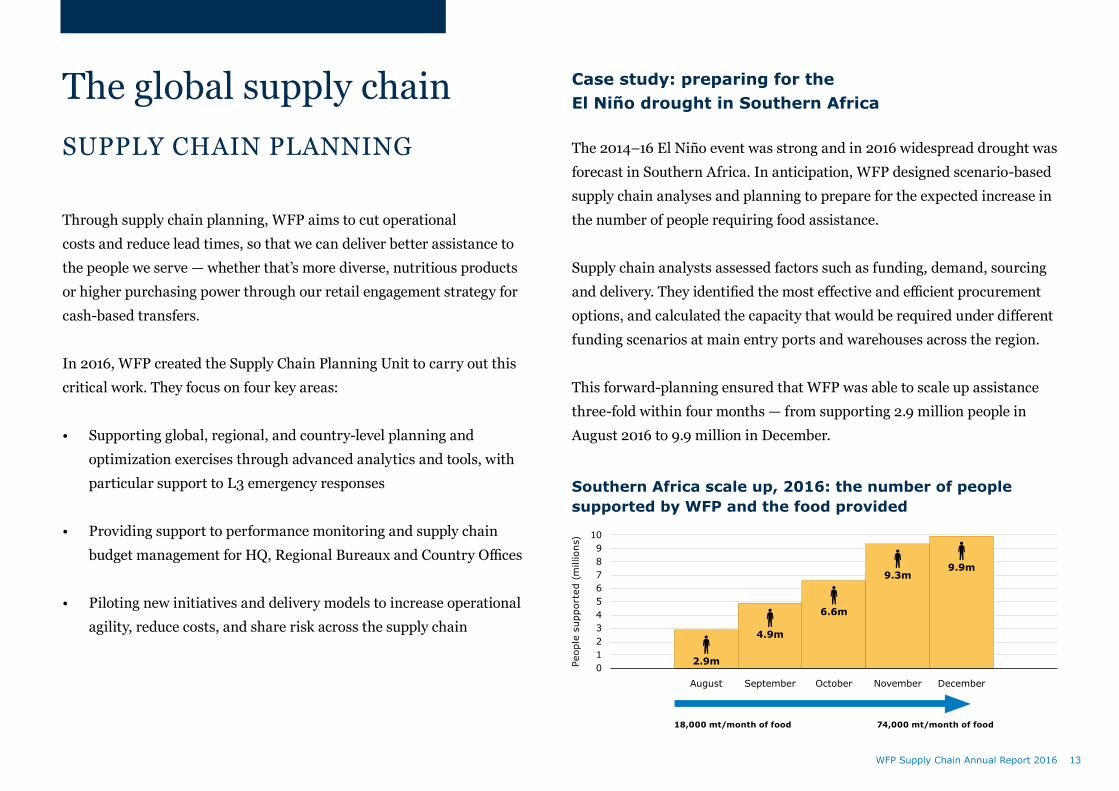
Case study: preparing for the El Niño drought in Southern Africa
The 2014–16 El Niño event was strong and in 2016 widespread drought was forecast in Southern Africa. In anticipation, WFP designed scenario-based supply chain analyses and planning to prepare for the expected increase in the number of people requiring food assistance.
Supply chain analysts assessed factors such as funding, demand, sourcing and delivery. They identified the most effective and efficient procurement options, and calculated the capacity that would be required under different funding scenarios at main entry ports and warehouses across the region.
This forward-planning ensured that WFP was able to scale up assistance three-fold within four months — from supporting 2.9 million people in August 2016 to 9.9 million in December.
18,000 mt/month of food 74,000 mt/month of food
Peoplesupported(millions)
August September October November December
109876543210
Southern Africa scale up, 2016: the number of people supported by WFP and the food provided
2.9m
4.9m
6.6m
9.3m9.9m
13WFP Supply Chain Annual Report 2016

FOOD PROCUREMENT
In 2016, WFP purchased the largest volume of commodities since 2010 and spent more (in US$) than it has since 2008. This reflected exceptionally high levels of humanitarian need arising from an unprecedented number of emergencies.
WFP sourced 72% of its commodity requirements, valued at US$980 million, from developing countries* — contracting a total of 692 suppliers, 177 of which were smallholder farmers’ organizations.
Key facts in 2016
• WFP purchased 2.6 million mt of food, valued at US$1.36 billion, from 93 countries
• WFP sourced 68% of its total requirements by volume from 15 countries (see list of origin countries in Annex 1)
• The value of total food procured was 28% higher in 2016, as compared to 2015
• The volume of food procured by WFP procured for L3 emergencies increased from 38% in 2015 to 55% in 2016
Food purchased by WFP in 2016, by type, tonnage, and percentage of total tonnage
Total tonnage: 2,634,536.257 mt
Canned foods2,053 (0.08%)
Other 25,797 (1%)
Sugar 62,522 (2%)
Cereal-based processed foods 101,701 (4%)
Vegetable oil 124,017 (5%)
Family parcels 128,254 (5%)
Sorghum 198,670 (8%)
Rice 274,899 (10%)
Specialized Nutritious Foods 276,626 (10%)
Wheat302,063 (11%)
Cereal flours331,696 (13%)
Dry pulses364,771 (14%)
Maize441,469 (17%)
* ThisincludesLeastDevelopedCountries,OtherLow-IncomeCountries,andLower-MiddleIncomeCountries,ascategorizedbytheDevelopmentAssistanceCommittee(DAC)
WFP Supply Chain Annual Report 201614
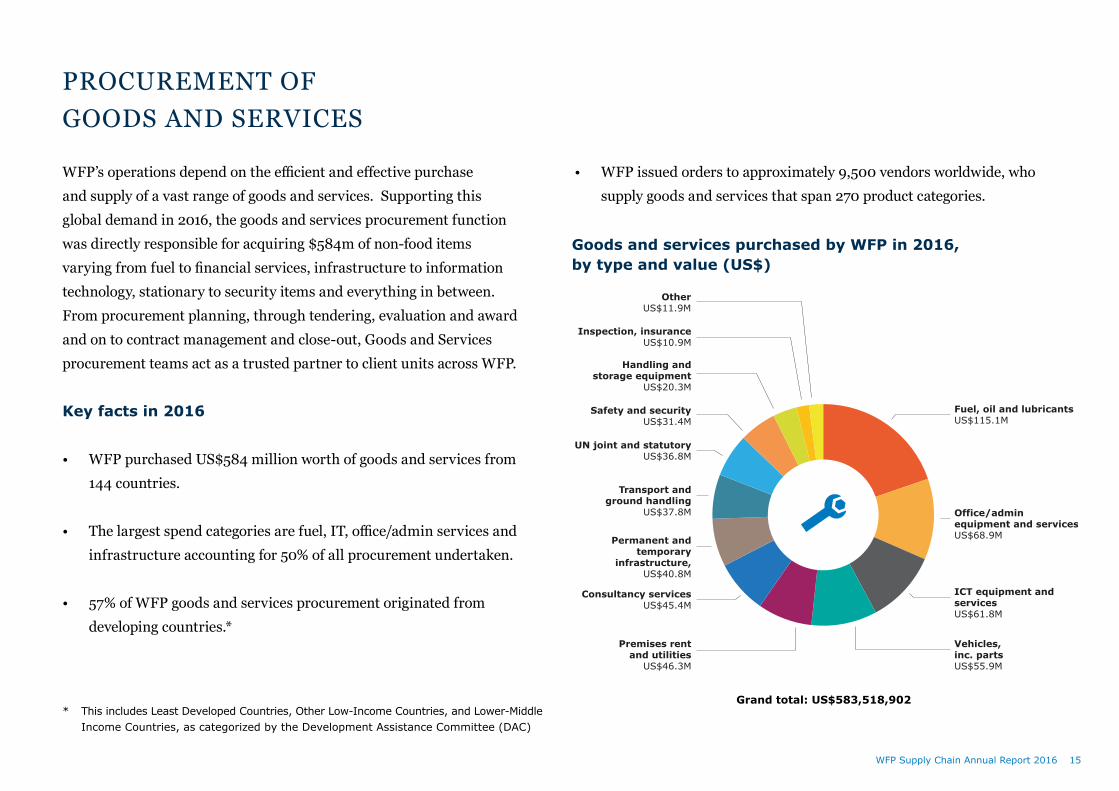
PROCUREMENT OF GOODS AND SERVICES
WFP’s operations depend on the efficient and effective purchase and supply of a vast range of goods and services. Supporting this global demand in 2016, the goods and services procurement function was directly responsible for acquiring $584m of non-food items varying from fuel to financial services, infrastructure to information technology, stationary to security items and everything in between. From procurement planning, through tendering, evaluation and award and on to contract management and close-out, Goods and Services procurement teams act as a trusted partner to client units across WFP.
Key facts in 2016
• WFP purchased US$584 million worth of goods and services from 144 countries.
• The largest spend categories are fuel, IT, office/admin services and infrastructure accounting for 50% of all procurement undertaken.
• 57% of WFP goods and services procurement originated from developing countries.*
Goods and services purchased by WFP in 2016, by type and value (US$)
Grand total: US$583,518,902* ThisincludesLeastDevelopedCountries,OtherLow-IncomeCountries,andLower-Middle
IncomeCountries,ascategorizedbytheDevelopmentAssistanceCommittee(DAC)
Vehicles,inc. partsUS$55.9M
ICT equipment and servicesUS$61.8M
Office/admin equipment and servicesUS$68.9M
Fuel, oil and lubricantsUS$115.1M
OtherUS$11.9M
Inspection, insuranceUS$10.9M
Handling andstorage equipment
US$20.3M
Transport andground handling
US$37.8M
Safety and securityUS$31.4M
UN joint and statutoryUS$36.8M
Permanent andtemporary
infrastructure,US$40.8M
Consultancy servicesUS$45.4M
Premises rent and utilities
US$46.3M
• WFP issued orders to approximately 9,500 vendors worldwide, who supply goods and services that span 270 product categories.
WFP Supply Chain Annual Report 2016 15

FOOD SAFETY AND QUALITY
WFP’s food safety and quality experts focus on strengthening quality management systems across the supply chain through internal and external partnerships with an eye towards achieving WFP’s strategic objectives and the SDGs.
In 2016, staff provided critical support in key areas such as: food commodity specifications improvement, vendor management, emergency response strategies, incident management, and local production capacity strengthening.
Support to the north-east Nigeria response
In Nigeria emergency, WFP’s food safety and quality staff engaged and coordinated with authorities from the national regulatory framework to assess risks and the capacity of local producers and suppliers in meeting food safety and quality standards.
As a result, WFP was able to enhance quality control and leverage existing regulatory requirements to increase local procurement and ensure on-time deliveries to families in need.
Proactive and preventative activities in 2016 ensured safe and quality foods across operations
Quality management
• Reviewed and updated over 90 food specifications, which were available as guidance to WFP staff working across the supply chain.
• Carried out over 20 audits and technical visits to factories, laboratories and inspection companies.
• Managed more than 75 commodity deviations and over 30 food safety or quality incidents as part of the Unit’s mandate within WFP’s risk matrix.
• Strengthened the assessment of suppliers through Initial Paper Assessments (IPAs), whereby suppliers are pre-screened based on their credibility jointly for procurement and food safety and quality criteria.
WFP Supply Chain Annual Report 201616
WFP Supply Chain Annual Report 2016 17

WFP Supply Chain Annual Report 201618
SHIPPING
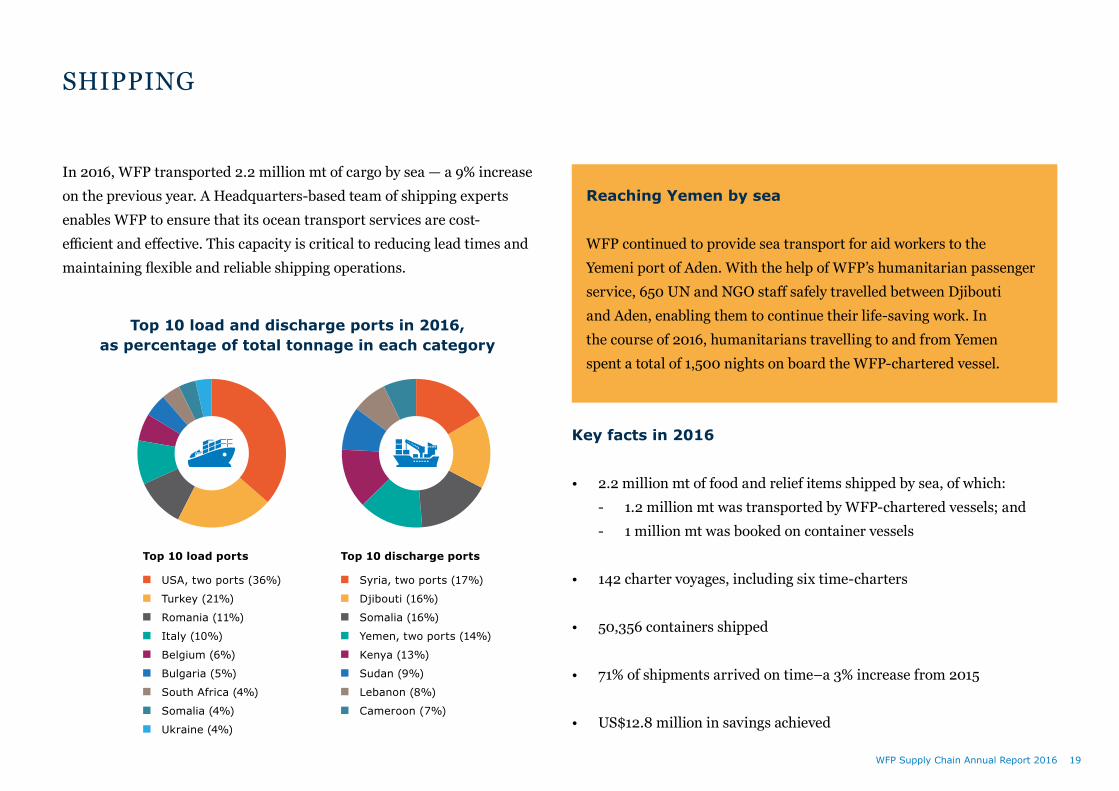
In 2016, WFP transported 2.2 million mt of cargo by sea — a 9% increase on the previous year. A Headquarters-based team of shipping experts enables WFP to ensure that its ocean transport services are cost-efficient and effective. This capacity is critical to reducing lead times and maintaining flexible and reliable shipping operations.
Key facts in 2016
• 2.2 million mt of food and relief items shipped by sea, of which:- 1.2 million mt was transported by WFP-chartered vessels; and- 1 million mt was booked on container vessels
• 142 charter voyages, including six time-charters
• 50,356 containers shipped
• 71% of shipments arrived on time–a 3% increase from 2015
• US$12.8 million in savings achieved
Top 10 load ports
■ USA,twoports(36%)
■ Turkey (21%)
■ Romania (11%)
■ Italy (10%)
■ Belgium (6%)
■ Bulgaria (5%)
■ South Africa (4%)
■ Somalia (4%)
■ Ukraine (4%)
Top 10 discharge ports
■ Syria,twoports(17%)
■ Djibouti (16%)
■ Somalia (16%)
■ Yemen,twoports(14%)
■ Kenya (13%)
■ Sudan (9%)
■ Lebanon (8%)
■ Cameroon (7%)
Top 10 load and discharge ports in 2016, as percentage of total tonnage in each category
Reaching Yemen by sea
WFP continued to provide sea transport for aid workers to the Yemeni port of Aden. With the help of WFP’s humanitarian passenger service, 650 UN and NGO staff safely travelled between Djibouti and Aden, enabling them to continue their life-saving work. In the course of 2016, humanitarians travelling to and from Yemen spent a total of 1,500 nights on board the WFP-chartered vessel.
WFP Supply Chain Annual Report 2016 19

AVIATION
WFP Aviation’s activities covered 36 countries across five continents in 2016 — from ad hoc airlifts and airfreight services to remote locations such as Fiji and Papua New Guinea, to regular passenger and cargo services in north-east Nigeria. WFP’s air operations contributed to the delivery of food and relief items on behalf of more than 1,000 organizations implementing programmes aimed at achieving zero hunger and the Sustainable Development Goals. WFP also provided customized air transport solutions including international airlifts, airfreight and dedicated aircraft capacity, to partner organizations such as United Nations High Commissioner for Refugees (UNHCR) and United Nations Department of Safety and Security (UNDSS).
Key facts in 2016
• 56,500 mt of food delivered through 2,228 airdrops in South Sudan and Syria
• 16,804 mt of relief supplies transported for humanitarian partners through airlifts and airfreight
• 74% of WFP Aviation’s business volume is UNHAS
Countries in which WFP Aviation was active in 2016
Latin America and the CaribbeanCubaEcuadorHaitiParaguay
AfricaBurundiCentral African RepublicCôte d’IvoireEthiopiaKenyaMadagascarNigerNigeriaRwandaSomaliaSouth SudanTanzaniaUganda
Middle East and North AfricaAlgeriaDjiboutiJordanLibyaSyriaYemen
South AsiaBangladeshNepal
East Asia and PacificFijiIndonesiaPapua New Guinea
WFP Supply Chain Annual Report 201620

WFP Supply Chain Annual Report 2016 21

SURFACE TRANSPORT
Using an intricate network of road, rail and river routes, WFP delivers food to some of the most remote and inaccessible areas of the world. Surface transport includes not only transportation, but also landside logistics services, such as warehousing, storage and fumigation.
Approximately 85% of WFP’s land transport activities are contracted through local commercial markets, directly supporting the development of the private sector and benefiting local economies in more than 70 countries. In locations where local transport capacity is unavailable or insufficient, WFP’s uses its own truck fleet.
Key facts in 2016
• WFP’s fleet consisted of more than 800 trucks
• US$895 million in landside logistics services contracted across WFP’s Regional Bureaux
Landside transport, storage and handling costs, 2016
Services Proportion of total (%)
■ Landsidetransport 41
■ Airtransport 17
■ Distribution 12
■ Warehouseoperations 10
■ Other 8
■ Global Commodity Management Facility (GCMF) 7
■ Portoperations 5
Total 100
Value of landside contracts by region, 2016
Regional Bureau Value of landside contracts (US$ million)
■ Regional Bureau of Nairobi (RBN) 457
■ Regional Bureau of Cairo (RBC) 206
■ Regional Bureau of Dakar (RBD) 103
■ RegionalBureauofJohannesburg(RBJ) 85
■ Regional Bureau of Bangkok (RBB) 35
■ Regional Bureau of Panama (RBP) 9
Total 895
WFP Supply Chain Annual Report 201622

GLOBAL TRUCK FLEET
In difficult operational environments, where needs exceed the capacities of local transporters, WFP relies on its own fleet of more than 800 heavy-duty trucks that often complete the ‘final mile’ of WFP’s supply chain.
In 2016, WFP-owned fleet trucks were active in 27 countries, including three strategically located regional hubs. They supported emergency response and humanitarian assistance efforts of WFP and the wider aid community in countries such as Ethiopia and Uganda.
Key facts in 2016
• 463,000 mt of food delivered by WFP’s fleet
• US$7.8 million achieved in cost avoidance, thanks to streamlined global fleet management processes
• US$801,000 saved through the implementation of more efficient spare parts procurement
• 29 technical trainings organized in 17 countries to enhance WFP fleet staff capacities
Locations of WFP-owned trucks, by numbers, in 2016
Rwanda
Chad
Malawi
Niger
Uganda
Burundi
RegionalFleetHub,EastAfrica
RegionalFleetHub,WestAfrica
Other
Liberia
Haiti
Sierra Leone
Democratic Republic of Congo
RegionalFleetHub,CentralAsia
Ethiopia
Afghanistan
Central African Republic
Sudan
South Sudan
0 10 20 30 40 50 60 70 80 90 100 110 120 130
WFP Supply Chain Annual Report 2016 23
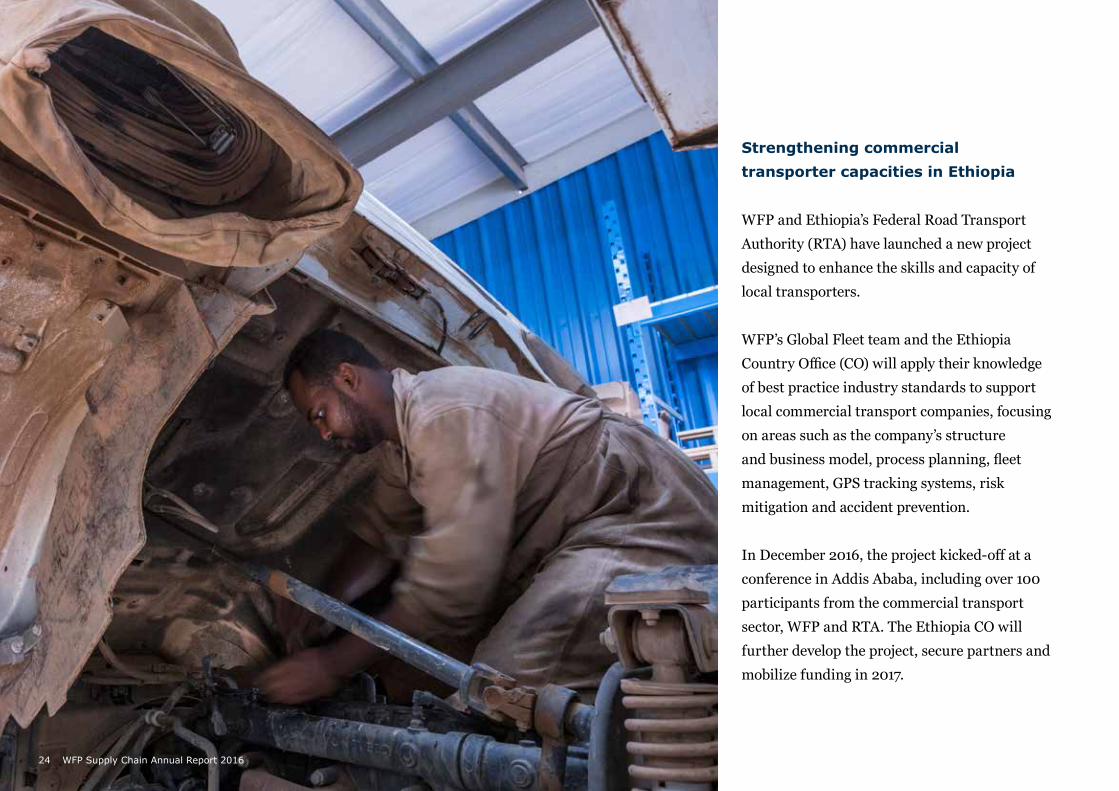
Strengthening commercial transporter capacities in Ethiopia
WFP and Ethiopia’s Federal Road Transport Authority (RTA) have launched a new project designed to enhance the skills and capacity of local transporters.
WFP’s Global Fleet team and the Ethiopia Country Office (CO) will apply their knowledge of best practice industry standards to support local commercial transport companies, focusing on areas such as the company’s structure and business model, process planning, fleet management, GPS tracking systems, risk mitigation and accident prevention.
In December 2016, the project kicked-off at a conference in Addis Ababa, including over 100 participants from the commercial transport sector, WFP and RTA. The Ethiopia CO will further develop the project, secure partners and mobilize funding in 2017.
24 WFP Supply Chain Annual Report 2016
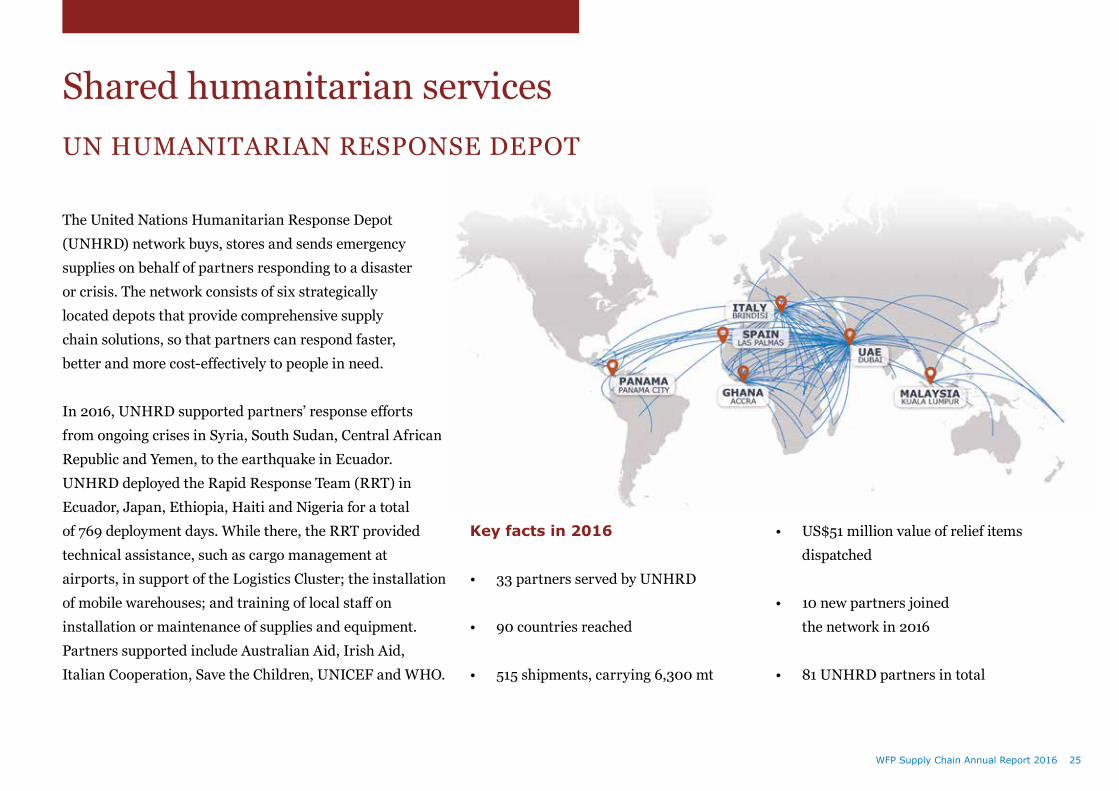
The United Nations Humanitarian Response Depot (UNHRD) network buys, stores and sends emergency supplies on behalf of partners responding to a disaster or crisis. The network consists of six strategically located depots that provide comprehensive supply chain solutions, so that partners can respond faster, better and more cost-effectively to people in need.
In 2016, UNHRD supported partners’ response efforts from ongoing crises in Syria, South Sudan, Central African Republic and Yemen, to the earthquake in Ecuador. UNHRD deployed the Rapid Response Team (RRT) in Ecuador, Japan, Ethiopia, Haiti and Nigeria for a total of 769 deployment days. While there, the RRT provided technical assistance, such as cargo management at airports, in support of the Logistics Cluster; the installation of mobile warehouses; and training of local staff on installation or maintenance of supplies and equipment. Partners supported include Australian Aid, Irish Aid, Italian Cooperation, Save the Children, UNICEF and WHO.
Key facts in 2016
• 33 partners served by UNHRD
• 90 countries reached
• 515 shipments, carrying 6,300 mt
• US$51 million value of relief items dispatched
• 10 new partners joined the network in 2016
• 81 UNHRD partners in total
Shared humanitarian servicesUN HUMANITARIAN RESPONSE DEPOT
WFP Supply Chain Annual Report 2016 25

UN HUMANITARIAN AIR SERVICE
The United Nations Humanitarian Air Service (UNHAS) offers timely, effective and cost-efficient passenger and light cargo transport for the wider humanitarian community. It is the only humanitarian air service that gives equal access to all actors supporting vulnerable populations.
In 2016, UNHAS provided passenger and light cargo services through 15 WFP Special Operations in 16 countries: Afghanistan, Cameroon, Central African Republic, Chad, Democratic Republic of the Congo, Ethiopia, Guinea, Kenya, Mali, Mauritania, Niger, Nigeria, Somalia, South Sudan, Sudan and Yemen. In sudden onset emergencies, as well as protracted humanitarian crises, the aid community depends on UNHAS to provide quick, safe and dependable access.
Key facts in 2016
• 15 operations, covering 16 countries
• 269 regular destinations
• 282,552 passengers transported
• 3,068 mt of light cargo transported
• 1,406 people evacuated
Focus on Nigeria
Since August 2015, UNHAS has provided access to humanitarians in Nigeria, who often have no other way to reach conflict-affected communities with life-saving assistance. Generous donor contributions, enabled UNHAS Nigeria to add two rotary-wing aircraft to their fleet and base them strategically in Maiduguri, Borno State. These aircraft can land on unpaved and improvised airstrips, and have made it possible for WFP to deliver critical relief items to remote locations.
In 2016, WFP transported 14,768 passengers and 58,786 kg of light cargo on behalf of 64 humanitarian organizations, including Action Contre la Faim, International Rescue Committee and the Norwegian Refugee Council. Operational planning was closely coordinated with partners on the ground to ensure a safe, agile and reliable service.
Non-governmental organizations(NGOs)54%
Governments,media,diplomatic community
5%
UNagencies41%
Breakdown of UNHAS passengers by category
WFP Supply Chain Annual Report 201626

LOGISTICS CLUSTER
The Logistics Cluster is part of the humanitarian cluster system, and is led by WFP.
Globally, it provides strategic guidance to broaden knowledge and improve decision making in humanitarian logistics. It also works with local governments on system-wide preparedness and contingency planning.
In 2016, the Logistics Cluster held 15 trainings that were attended by a total of 400 trainees. These were aimed at improving organizations’ capacity to respond to emergencies, and their ability to work within the cluster system and collaborate with partners on the ground to avoid overlaps and maximise impact.
In the field, the Logistics Cluster is responsible for coordination and information management of the logistics response. When necessary, it also coordinates access to common logistics services, by facilitating the delivery and storage of supplies. Logistics Cluster field operations in 2016 included: the Central African Republic, Democratic Republic of Congo, Ethiopia, Fiji, Haiti, Iraq, Nigeria, Papua New Guinea, Somalia, South Sudan, Syria, Ukraine and Yemen.
Key facts in 2016
The Logistics Cluster supported 454 organizations with:
• Coordination of inter-agency convoys
• Facilitation of delivery and storage of 87,239 mt of relief supplies and the distribution of more than 1.3 million litres of fuel
• 362 Logistics Cluster coordination meetings
• 1,126 information management products
Types of organizations supported by the Logistics Cluster in 2016
InternationalNGOs39%
Intergovernmentalorganizations 2%
UNagencies 5%
Foundationsandotherentities 8%
Governments 11%
LocalNGOs 35%
WFP Supply Chain Annual Report 2016 27

BILATERAL SERVICES
Upon request of humanitarian partners, such as NGOs and UN agencies, WFP offers innovative logistics services that span the supply chain:
• Shipping and chartering solutions• Land transport, storage and handling• Fleet and workshop management• Fuel provision• Management of complex end-to-end
supply chain logistics operations• Air services• Logistics engineering
Key facts in 2016
• 57 partners served across 30 countries
• 18,000 mt / 37,000 cubic mt handled
• 87% of partners are UN agencies
• 70% of services comprised of warehousing solutions
Focus on Uganda
The Mombasa corridor is a critical supply corridor for South Sudan, which is landlocked. In July 2016, fighting broke out in South Sudan’s capital Juba, and the Uganda–South Sudan border was closed for two weeks. Across the supply corridor hundreds of trucks loaded with humanitarian supplies were stranded. As trucks stood idle, unable to move, the humanitarian community faced having to absorb significant costs.
WFP’s supply chain team in Uganda was able to receive stranded humanitarian supplies on behalf of UNICEF, FAO, WHO, IOM and others. WFP’s warehouse in Tororo became a temporary regional staging hub during the crisis, providing storage and emergency transport of medicines and other life-saving items into South Sudan. Through centralized coordination and support, WFP was able to reduce duplication of efforts to provide efficient and effective services at a critical time. As part of WFP Uganda’s commitment, a portion of the Tororo storage facility will be converted into a non-food item warehouse, with racking and cold chain facilities for use by the humanitarian and development community across East Africa.
WFP Supply Chain Annual Report 201628

WFP Supply Chain Annual Report 2016 29
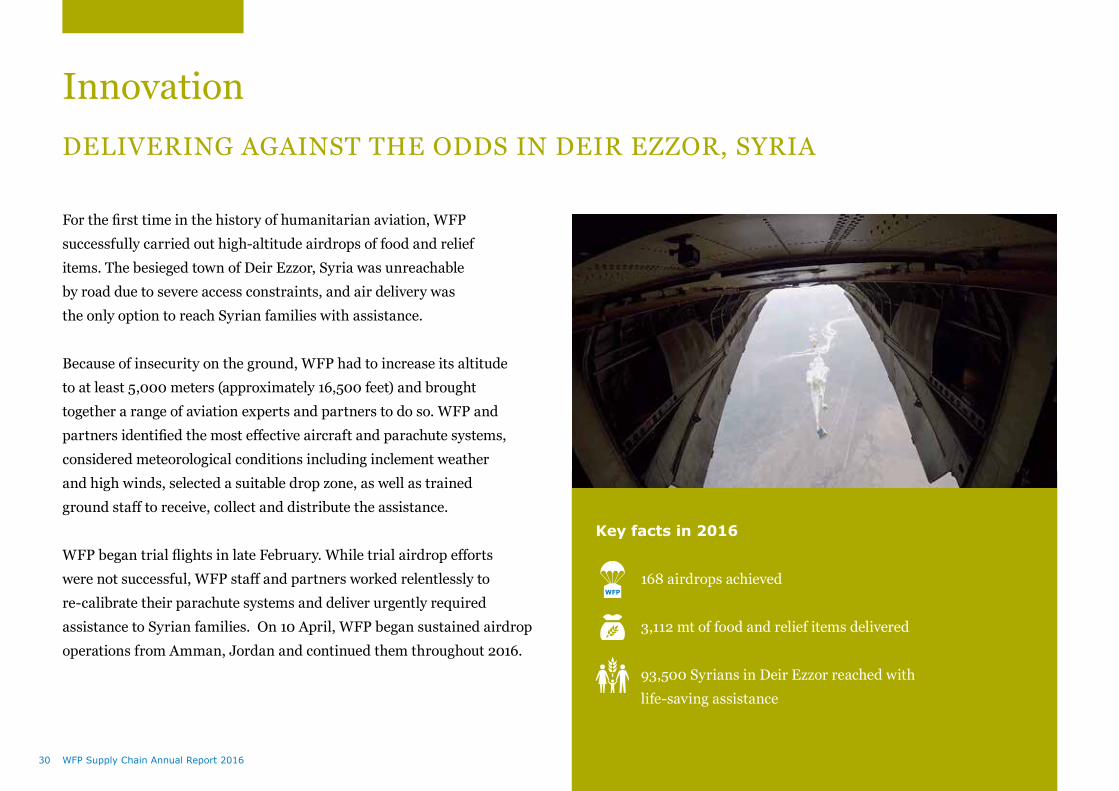
For the first time in the history of humanitarian aviation, WFP successfully carried out high-altitude airdrops of food and relief items. The besieged town of Deir Ezzor, Syria was unreachable by road due to severe access constraints, and air delivery was the only option to reach Syrian families with assistance.
Because of insecurity on the ground, WFP had to increase its altitude to at least 5,000 meters (approximately 16,500 feet) and brought together a range of aviation experts and partners to do so. WFP and partners identified the most effective aircraft and parachute systems, considered meteorological conditions including inclement weather and high winds, selected a suitable drop zone, as well as trained ground staff to receive, collect and distribute the assistance.
WFP began trial flights in late February. While trial airdrop efforts were not successful, WFP staff and partners worked relentlessly to re-calibrate their parachute systems and deliver urgently required assistance to Syrian families. On 10 April, WFP began sustained airdrop operations from Amman, Jordan and continued them throughout 2016.
InnovationDELIVERING AGAINST THE ODDS IN DEIR EZZOR, SYRIA
Key facts in 2016
168 airdrops achieved
3,112 mt of food and relief items delivered
93,500 Syrians in Deir Ezzor reached with life-saving assistance
WFP Supply Chain Annual Report 201630

The Logistics Execution Support System (LESS) is WFP’s end-to-end food supply chain management system.
WFP completed the system’s global roll-out in October 2016, and can now track, monitor and manage all its food commodities online and in real-time. With a single click, WFP staff can have full visibility of planned arrivals and dispatches — locally, regionally and globally.
LESS brings operational efficiencies to every facet of the supply chain — from resourcing to procurement, finance, logistics, pipeline management and programme.
The system has also brought improvements to planning, enabling WFP’s supply chain to respond faster, be more agile, reduce costs and achieve greater efficiency. This strengthens WFP’s ability to make the most of donor resources.
Reliability and cost-efficiencyLESS: WFP’S KEY TO REAL-TIME DECISIONS
Measurable effects in supply chain operations
More detailed
information per batch:
• Best-beforedates
• Quality
• Specificcommodity
• Location
• Contribution
restrictions
Digital, real-time
information in one,
automated system
Standardized
processes and
segregation of duties
Third-party
system access
Features of LESS Long-term impact
• Better overall
planning
and management
• Quicker
decision making
• Faster
response times
• Increased
cost savings
• Stronger
risk management
• Full transparency
and accountability
Overall planning
Commodities
Human resources
Assets
Improved emergency planning and response
• Reduced commodity losses
• Optimized commodity procurement
• Optimized programme delivery
• Optimized staff capacity planning
• Improved staff productivity
• Improved oversight
• Optimized utilization of WFP fleet
• Improved warehouse utilization
• Improved IT set-up
• Optimized transport contracting
• Optimized third-party outsourcing
• Increased benefits for partners
and national markets
Contracted services
Impacts of LESS
Key Facts in 2016
• LESS is live in 83 countries, including 1,200 locations and 90,000 final delivery points
• 100% of WFP’s food supply chain is managed through LESS
• 2,500+ staff use the system worldwide
WFP Supply Chain Annual Report 2016 31

HOW WFP OPTIMIZES ITS SUPPLY CHAIN
Every day, WFP staff plan, source and deliver assistance in more than 80 countries. They make decisions according to factors such as commodity availability, quality, prices, logistics networks, lead times, and even dietary preferences of local communities. Thus, they ensure that WFP provides the most efficient, effective delivery of assistance.
Data is crucial to this process. Supply chain analysts utilize information from several sources, including LESS, WFP’s supply chain management system, and data produced by WFP’s food security analysis team, commonly known as Vulnerability Assessment and Mapping (VAM). With this intelligence, the Supply Chain Division designs advanced analytics to help experts quickly assess scenarios and build optimal supply chain networks and plans.
Supply chain innovation: the Optimus solution
What it isThe Optimus solution assists Country Offices in identifying the most effective and efficient supply chain, given funding and operational constraints while also maximizing nutritional outcomes and value for money. The solution uses mathematical algorithms to assess all available options and propose optimized supply chain setups. WFP has successfully piloted the solution in Iraq, Syria, Yemen and Mali, and achieved significant cost savings.
Results in IraqIn 2016, WFP used Optimus to optimize its food basket for Iraq and saved more than US$13 million (17%, year on year). 500,000 people in Iraq benefited from the revised basket. By substituting commodities with similar nutritional value, WFP delivered food assistance that not only supplied 98% of the total 1,800 kilocalories required (at a cost of US$10.89 per person/per month), but it also better aligned with local dietary preferences.
Savingperperson:US$1.03Totalsavingsin2016by
swappinglentilswithbeans:US$6 million
Rationprovided:5kgKCAL:114
Costperperson:$1.98
Rationprovided:5kgKCAL:114
Costperperson:$0.95
WFP Supply Chain Annual Report 201632

An agile supply chain responds quickly with the right commodities at the right time to reach people in need. WFP enhances its speed and effectiveness through advanced positioning – using advance financing tools such as the Global Commodity Management Facility (GCMF) and flexible procurement contracting modalities, including Food Supply Agreements and Long-Terms Agreements to save time and costs.
The GCMF allows WFP to better plan its purchases according to when the time is right in the markets, and can significantly shorten the delivery times for operations.
Speeding up the supply chain — and saving costs
Through a forward-planning contracting tool, WFP has been able to achieve significant cost and lead time reductions in 2016. Food Supply Agreements are contracts that WFP uses to provide long-term demand visibility to suppliers on commodity requirements. This allows them to plan ahead and reduce their costs, which are then passed on to WFP in the form of lower prices. At the same time, competition for a larger share of WFP business contributes to price reductions and increased participation to WFP tenders. As most of the long-term agreements signed by WFP are non-committal, they provide WFP with the flexibility to increase purchases as required to rapidly deliver to people in need.
Concrete results of food supply agreements: Specialized Nutritious Food procurement and delivery
US$3 million in savings achieved for the purchase of specialized nutritious foods, compared to the price WFP would have paid for ad hoc tenders
10-day lead time reduction per contract, enabling faster deliveries of life-saving nutritious food for children
AgilityADVANCE POSITIONING
Through the GCMF facility, WFP food procurement sourced 1.4 million mt of commodities valued at US$612 million in 2016. The mechanism is an essential tool for WFP’s response and assistance programmes.
In 2016, GCMF reached the significant milestone of transferring 1.4 million mt of food to country offices. This is the highest quantity ever delivered through the facility and it accounts for 36 percent of the total volume distributed by WFP. More than 40 percent of GCMF food was sourced in local and regional markets in East, West and Southern Africa.
WFP Supply Chain Annual Report 2016 33

WFP has decades of experience working with importers, manufacturers, wholesalers, transporters, local shopkeepers and small-scale farmers to deliver food assistance to an average 80 million people every year. As part of our food assistance interventions, WFP also seeks to improve the livelihoods of local communities and businesses in locations where we operate.
In 2015, WFP designed and launched a retail engagement strategy with three objectives:
• to increase the purchasing power of all customers of WFP-contracted shops by lowering shelf prices through improved supply chains;
• to enhance accountability, transparency, internal controls, and the overall effectiveness of WFP programmes through the use of itemized sales data;
• to develop the capacity of the local retail sector, so that it is able to sustain the gains after WFP leaves.
WFP’s retail engagement strategy
A commercial approach to delivering humanitarian assistance through the retail sector.
Four key facts about the strategy
• How: built with private sector retail supply chain industry experts
• Where: Iraq, Jordan, Kenya and Lebanon
• Where in 2017: Nigeria, Sudan and Uganda
• Achievements in 2016: on average, above 10% reduction in shelf prices in the areas where WFP implements the retail strategy
Strengthening national capacities and marketsWFP AND THE RETAIL SECTOR
WFP Supply Chain Annual Report 201634

What is the Farm to Market Alliance?The Farm to Market Alliance is a consortium of organizations that aims to transform food crop markets by ensuring the participation and long-term engagement of smallholder farmers. Through the Alliance, WFP and seven global members work together to transition smallholder farmers from subsistence farming to market-oriented agriculture. Members include Alliance for a Green Revolution in Africa (AGRA), Bayer, Grow Africa, International Finance Corporation (IFC), Rabobank, Syngenta and Yara.
How it WorksThe Alliance was launched in 2015 in Rwanda, Tanzania and Zambia. The global members create demand-led value chains for food crops based on commercial relationships between buyers, farmers, and suppliers of finance, inputs
and technical expertise. Through multi-year pre-planting contracts, farmers organizations use aggregated demand to secure buyers, credit and products that smallholders need to plant and harvest quality crops, and sustainably grow their business. The Alliance aims to support farmers to boost their incomes and build long-term resilience.
Global snapshot
• Active in Rwanda, Tanzania and Zambia
• 68,141 participating farmers
• 247 contracts signed with 12 commercial buyers — a total value of US$7.6 million
The Alliance in Tanzania
• 50% of farmers were women
• 97% loan repayment rate
• 150% increase in smallholder farmer food production
• Introduction of post-harvest loss reduction equipment and training, provided by WFP and partners
• Introduction of new technologies, such as digitized ordering and delivery, to increase local supply chain efficiencies and reduce costs
PAVING THE ROAD FROM FARM TO MARKET
WFP Supply Chain Annual Report 2016 35

Afghanistan 66,176 25,087
Algeria 21,274 7,234
Antigua and Barbuda 90 34
Argentina 3,078 1,605
Australia 1,394 504
Bangladesh 1,277 1,318
Belgium 70,428 60,425
Benin 876 361
Bolivia 614 489
Brazil 2,035 1,204
Bulgaria 50,002 9,114
BurkinaFaso 1,258 753
Burundi 4,492 2,180
Cambodia 5 2
Cameroon 12,053 5,405
Canada 20,822 16,948
Central African Republic 212 91
Chad 13,109 4,203
China 1,088 1,039
Colombia 53 130
Côte d’Ivoire 1,648 1,037
Dem. Rep. of the Congo 19,944 12,144
Denmark 10 273
Egypt 28,642 21,158
Ethiopia 76,418 26,641
European Union 502 515
France 45,558 78,250
Gambia 122 92
Germany 10 290
Ghana 753 548
Guatemala 469 197
Guinea 1,594 1,038
Haiti 12,321 7,273
Honduras 10,107 7,853
India 142,982 62,753
Indonesia 65,070 49,435
Iran 3,480 1,888
Iraq 4,058 6,468
Ireland 516 400
Italy 115,401 76,333
Japan 9,163 10,162
Jordan 40,041 37,687
Kazakhstan 14,750 11,647
Kenya 17,271 6,350
Kyrgyzstan 22,024 15,936
Lebanon 2,617 1,963
Liberia 2,120 1,356
Madagascar 10,092 4,720
Malawi 48,708 28,451
Malaysia 60 75
Mali 11,700 4,199
Mauritania 48 5
Mexico 117,194 39,759
Morocco 21,723 11,411
Mozambique 27,860 13,213
Myanmar 27,228 9,762
Namibia 458 38
AnnexWHERE WFP PURCHASED FOOD IN 2016
COUNTRY QUANTITY VALUE (MT) (US$ THOUSAND)
COUNTRY QUANTITY VALUE (MT) (US$ THOUSAND)
COUNTRY QUANTITY VALUE (MT) (US$ THOUSAND)
WFP Supply Chain Annual Report 201636

Nepal 2,766 1,165
Netherlands 19,152 10,037
Nicaragua 1,755 1,485
Niger 33,970 13,201
Nigeria 33,078 35,304
Oman 1,078 984
Pakistan 72,527 34,640
Palestine 22,752 8,019
Paraguay 84 117
Portugal 4,000 3,098
Romania 173,100 31,417
RussianFederation 84,398 59,902
Rwanda 25,435 10,972
Senegal 793 276
Sierra Leone 465 283
Somalia 4,000 1,751
South Africa 67,194 32,531
South Sudan 70 35
Sri Lanka 20 7
Sudan 67,800 18,976
Switzerland 3,211 9,479
Syria 8,802 6,479
Tajikistan 132 16
Tanzania 29,089 9,884
Thailand 6,780 3,589
Timor-Leste 412 547
Turkey 405,668 222,614
Uganda 126,230 47,747
Ukraine 119,949 46,396
UnitedArabEmirates 6,900 3,439
United Kingdom 504 261
UnitedStatesofAmerica10,362 11,560
Uruguay 575 315
Vietnam 7,688 4,064
Yemen 28,437 11,320
Zambia 92,368 29,796
Grand total 1,361,151
COUNTRY QUANTITY VALUE (MT) (US$ THOUSAND)
COUNTRY QUANTITY VALUE (MT) (US$ THOUSAND)
WFP Supply Chain Annual Report 2016 37

Afghanistan 16,914
Algeria 902
Antarctica 5
Antigua and Barbuda 67
Argentina 6
Armenia 332
Australia 1,797
Austria 44
Bangladesh 2,685
Belgium 614
Benin 419
Bhutan 51
Bolivia 386
Botswana 30
Brazil 621
BurkinaFaso 1,362
Burundi 2,618
Cambodia 1,011
Cameroon 3,700
Canada 5,134
Central African Republic 3,270
Chad 7,326
Chile 219
China 2,378
China, Hong Kong SAR 13
China, Macau SAR 3
Colombia 1,339
Comoros 106
Congo (Brazzaville) 746
Côte d’Ivoire 956
Cuba 811
Cyprus 84
Czech Republic 1,206
Dem. Rep. of the Congo 12,104
Denmark 10,860
Djibouti 2,045
Dominican Republic 114
DPR Korea 252
Ecuador 2,486
Egypt 4,421
El Salvador 1,100
Eritrea 72
Ethiopia 45,843
Fiji 187
Finland 914
France 15,550
French Guiana 2
Gambia 369
Georgia 203
Germany 8,127
Ghana 4,187
Gibraltar 100
Guatemala 1,363
Guinea 2,643
Guinea-Bissau 577
Haiti 4,779
Honduras 1,028
Hungary 9
Iceland 64
India 3,219
Indonesia 544
Iran 176
Iraq 3,313
Ireland 3,990
Israel 312
Italy 34,343
Japan 7,796
Jordan 9,307
Kazakhstan 4
Kenya 26,483
Kuwait 0
Kyrgyzstan 1,079
Lao PDR 2,246
Lebanon 6,734
Lesotho 1,309
Liberia 3,119
Libya 2
Lithuania 7
Luxembourg 1
Madagascar 1,647
Malawi 6,027
Malaysia 302
Mali 3,098
Malta 44
Mauritania 1,303
Mauritius 322
Mexico 208
Monaco 8
WHERE WFP PURCHASED GOODS AND SERVICES IN 2016
COUNTRY SUM OF VALUE (US$ THOUSAND)
COUNTRY SUM OF VALUE (US$ THOUSAND)
COUNTRY SUM OF VALUE (US$ THOUSAND)
COUNTRY SUM OF VALUE (US$ THOUSAND)
WFP Supply Chain Annual Report 201638

Mozambique 2,364
Myanmar 1,737
Namibia 109
Nepal 2,817
Netherlands 10,029
New Zealand 446
Nicaragua 903
Niger 6,963
Nigeria 1,645
Norway 11,968
Oman 2,215
Pakistan 9,449
Palestine 1,880
Panama 1,555
Papua New Guinea 337
Paraguay 182
Peru 881
Philippines 3,001
Portugal 1
Russia 1,014
Rwanda 2,000
São Tomé and Principe 21
Saudi Arabia 20
Senegal 1,920
Sierra Leone 1,933
Singapore 664
Slovakia 170
SolomonIslands 3
Somalia 6,180
South Africa 4,165
South Korea 28
South Sudan 45,421
Spain 906
Sri Lanka 699
Sudan 28,850
Swaziland 281
Sweden 635
Switzerland 8,705
Syria 6,368
Tajikistan 748
Tanzania 3,559
Thailand 1,337
Timor-Leste 470
Togo 233
Tonga 0
Tunisia 224
Turkey 5,683
Uganda 7,941
Ukraine 348
UnitedArabEmirates 23,308
United Kingdom 17,008
UnitedStatesofAmerica 39,201
Vietnam 9
Yemen 17,864
Zambia 1,342
Zimbabwe 2,284
Grand Total 583,519
COUNTRY SUM OF VALUE (US$ THOUSAND)
COUNTRY SUM OF VALUE (US$ THOUSAND)
COUNTRY SUM OF VALUE (US$ THOUSAND)
WFP Supply Chain Annual Report 2016 39

UnitedStatesofAmerica 103,216,033
United Kingdom 26,516,027
Germany 24,539,959
EuropeanCommission 23,244,017
Canada 11,235,823
UN Common Humanitarian Fund 10,588,914
Sweden 9,202,691
UNOtherFundsandAgencies 7,366,992
(excludingCERF)
Belgium 6,658,162
Japan 6,100,000
Switzerland 5,418,879
Netherlands 3,639,514
UN CERF 3,631,356
Denmark 1,681,575
Norway 1,190,334
UNHumanitarianResponseFund 1,045,695
Privatedonors 989,621
Italy 438,596
Spain 331,126
Ireland 262,295
Luxembourg 113,379
Lithuania 11,038
Grand total 247,422,026
DONOR CONTRIBUTION (US$ MILLION)
DONOR CONTRIBUTION (US$ MILLION)
CONTRIBUTIONS RECEIVED FOR WFP SPECIAL OPERATIONS IN 2016
Photo credits
Cover:WFP/AmmarBamatraf,Yemen
Pages:
3. WFP/Kabir Dhanji, Somalia
4. WFP/Marco Frattini, Cameroon
12. WFP/Gabriela Vivacqua, Sudan
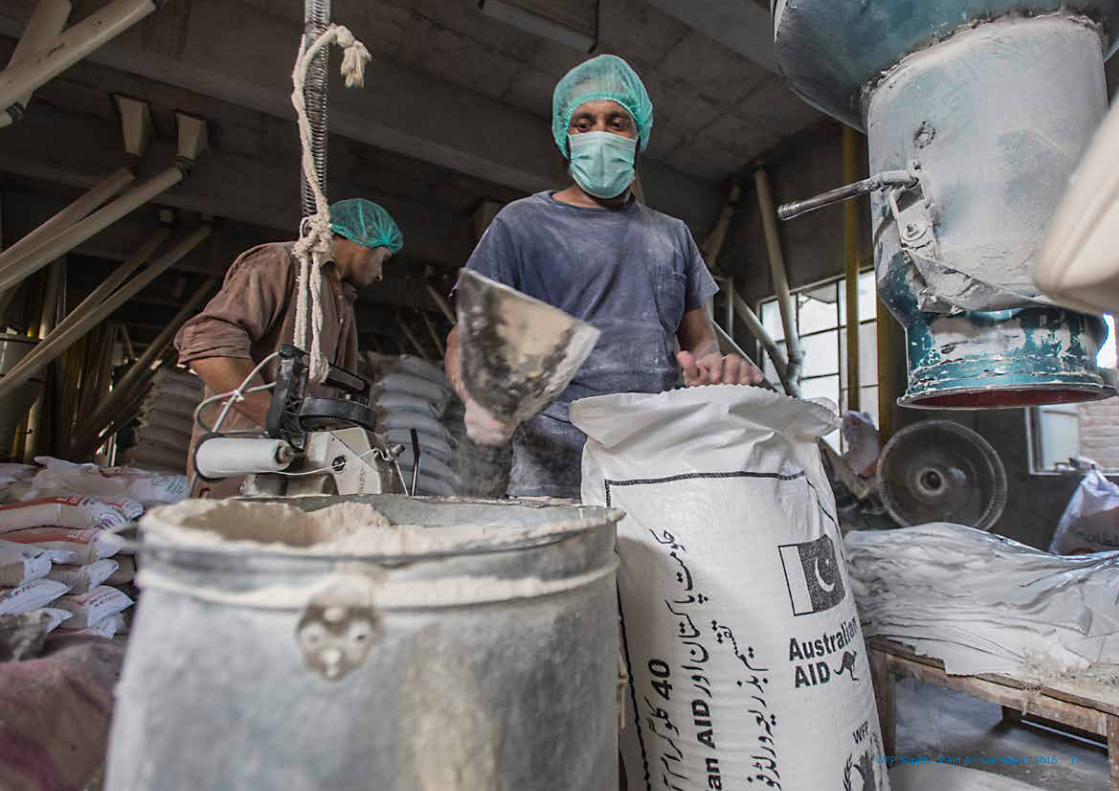
17. WFP/ReinSkullerud,Pakistan
18. WFP/Ammar Bamatraf, Yemen
21. WFP/Shaza Moghraby, Jordan
24. WFP/PetterikWiggers,Ethiopia
29. WFP/Kabir Dhanji, Somalia
30. WFP Aviation, Syria
34. WFP/EdwardJohnson,Lebanon
35. WFP/RianaRavoala,Madagascar
Insidebackcover:WFP/MaxWohlgemuth,Tanzania
Backcover:WFP/KabirDhanji,Somalia
WFP Supply Chain Annual Report 201640


Printed: September 2017
World Food Programme ViaC.G.Viola,68/70-00148Rome,Italy-Tel:+390665131
For more information:[email protected]


