WEEC: Future of Performance Contracting1
Proven Strategies for Making Existing Buildings Energy and Operationally Efficient
REMOVING OBSTACLES TO ENERGY EFFICIENCYTHROUGH BUSINESS CASE AND REAL RESULTS John W. Conover IV, President, Trane Commercial Americas At Fairleigh Dickinson University
2
About John W. Conover IV
• Leader for the Trane commercial business in the Americas – 14,200 employees in the U.S., Canada and Latin America
• Been in the HVAC-R industry for 30 years
• During tenure with Trane, played integral role in better understanding customer expectations and market needs such as the growing search for energy efficiency solutions.
• Focus heavily on gaining innovative insights on what it takes to acquire, satisfy and retain customers.
• Earned a bachelor’s of science degree in civil engineering from Lehigh University and is a registered professional engineer.
• Attended the Executive Leadership Program at the Wharton School of Business at the University of Pennsylvania.
• John and his wife Marsha live in New Jersey and are the proud parents of four children
3
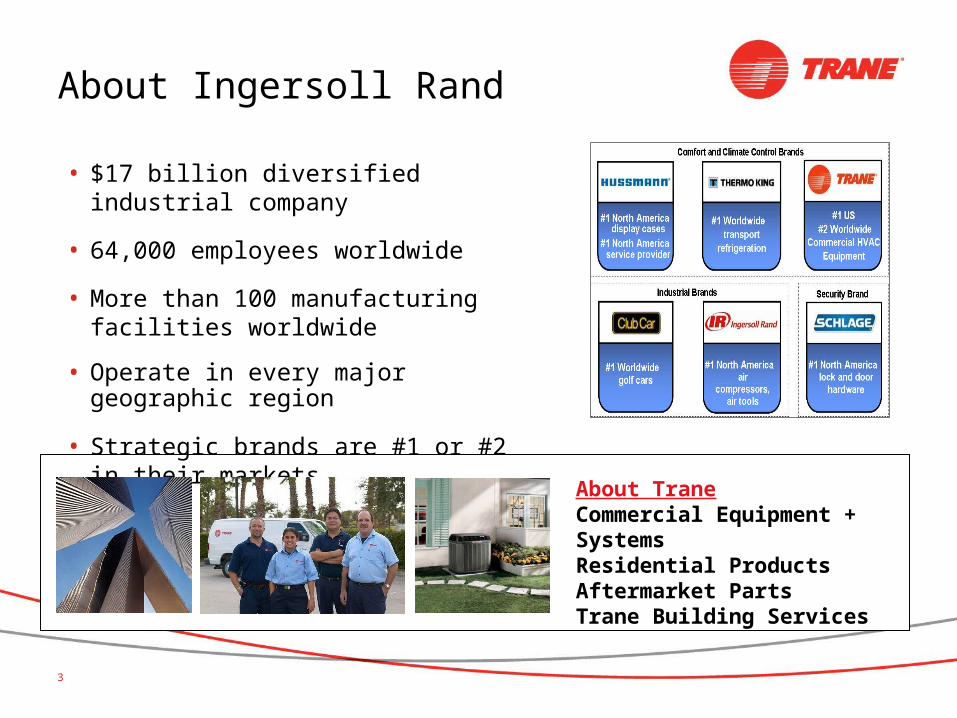
About Ingersoll Rand
• $17 billion diversified industrial company
• 64,000 employees worldwide
• More than 100 manufacturing facilities worldwide
• Operate in every major geographic region
• Strategic brands are #1 or #2 in their markets
About TraneCommercial Equipment + SystemsResidential ProductsAftermarket PartsTrane Building Services

4
How Ingersoll Rand Walks the Talkabout Energy Efficiency
INGERSOLL RAND IS REDUCING ITS OWN ENVIRONMENTAL FOOTPRINT• Trane and Ingersoll Rand – active with the U.S. Environmental Protection Agency
– Members of Climate Leader Program – Joined Smart Way Program: To reduce environmental impact of transportation activities – Members of the Green Chill program: Energy efficiency in the supermarket industry
• Member of the Dow Jones North American Sustainability Index, various investing indicies
• Established internal goals for reduction of energy use and climate change emissions
– Energy audit program to understand energy use/strategies for reducing consumption
– Established a Sustainability Strategy Council to further integrate Sustainability principles throughout our business
– Created “green teams” in all locations to engage employees and champion reduction
– Established national patch program with Girl Scouts of the Americas called “BTU Crew” to encourage girls to reduce energy use in community buildings
– LEED certified buildings in the U.S. and Asia
5
Why Trane is Talking About Energy Efficiency
WHAT WE DO
• Trane works with leaders who take a broad view of organizational performance
• We offer most energy efficient systems along with energy management and optimization service that leverages operational savings to support business objectives
OUR EXPERIENCE
• 1 out of every 2 buildings in the U.S. has a Trane system
• More LEED certified Accredited Professionals (AP) in the industry
• Most energy efficient large chilled water system on the market today
• More than 125 performance contracting projects
– Average project in the range of $2M with 10 year contract
OUR ENVIRONMENTAL CONTRIBUTION (ENERGY SAVINGS EQUIVALENT)
• 18,722 cars taken off the highway
• 11,323,812 gallons of gasoline saved
• 21,843 planted mature trees
• 68,074,062 gallons of water saved
• 224,666,420 pounds of CO2 saved
6
Perfect Storm:Factors Influencing Energy Efficiency + Building Owners Today
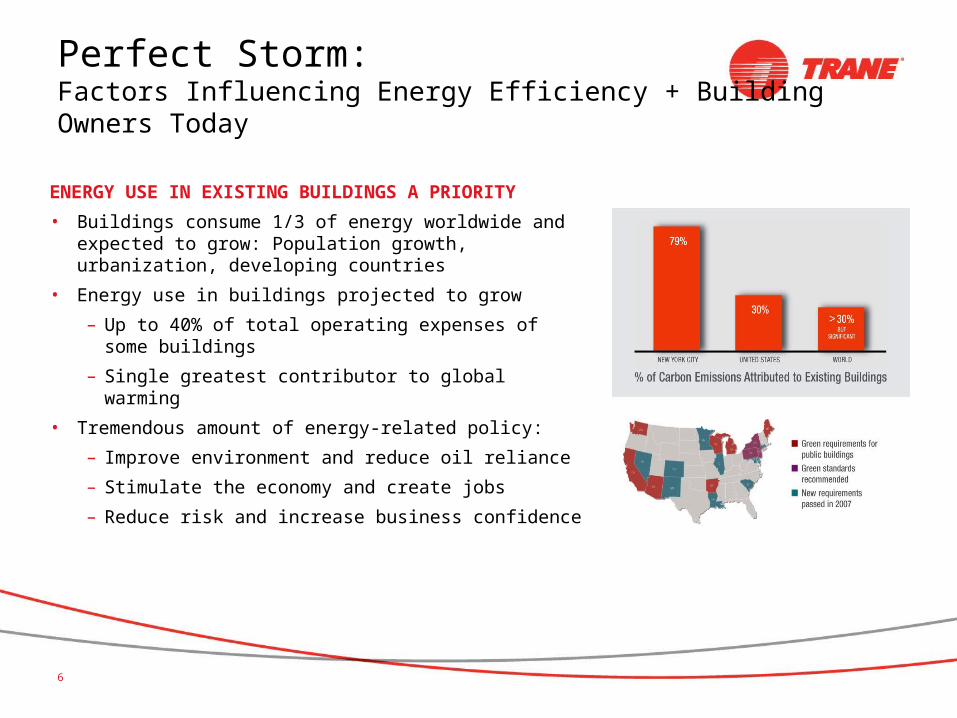
ENERGY USE IN EXISTING BUILDINGS A PRIORITY
• Buildings consume 1/3 of energy worldwide and expected to grow: Population growth, urbanization, developing countries
• Energy use in buildings projected to grow
– Up to 40% of total operating expenses of some buildings
– Single greatest contributor to global warming
• Tremendous amount of energy-related policy:
– Improve environment and reduce oil reliance
– Stimulate the economy and create jobs
– Reduce risk and increase business confidence

7
Perfect Storm:Factors Influencing Energy Efficiency + Building Owners Today
ESPECIALLY IN CHALLENGING ECONOMIC ENVIRONMENT
• Reduced operating budgets and deferred maintenance
• New construction outlook remains weak
• Considered to be operating in a global recessionary market
• Businesses pinched more than ever
– Operating costs continue to rise with intense pressure to reduce
– Access to cash and credit more limited than ever
– Limited appetite for capital investments without clear payback
8
What This Means:For Building Owners and Business Leaders
ENERGY EFFICIENCY IS A BUSINESS IMPERATIVE
• More than a “nice to do” or method for being socially responsible
• There are tangible business results directly associated with energy efficiency
– Financial, customer satisfaction, employee productivity
– Not to mention that it makes assets more valuable
– And there’s a positive environmental contribution
• As business leaders, our job is to remove obstacles to energy efficiency
– Must be C-level owned / championed
– Need a financially-motivated business plan
– Don’t get caught up in the noise – there are proven strategies and technologies for making existing business more efficient

9
Why A C-Level ImperativeFor Building Owners and Business Leaders
CONSERVATION IS FOR THE BOILER ROOM … EFFICIENCY IS FOR THE BOARD ROOM
ENERGY CONSERVATION
• Using less energy, without necessarily increasing the output
– Fewer truck runs to / from warehouse
– Turning off unused equipment on weekends / off-hours
– Modifying behaviors and practices
– Low hanging fruit / low first cost / fast payback projects
– “Holding the Gains” – depends on culture
ENERGY EFFICIENCY
• Using less energy and achieving more output
– Rightsizing / replacing infrastructure
– Process / product improvement
– Less environmental impact in the supply chain
– Often higher initial cost, but better life cycle payback (need to understand the financials)
– Holding the gains – depends on automatic controls and monitoring
The Value of Efficiency: Reduce production losses, spoilage, downtime while increasing good will and customer impact
Alliance to Save Energy: Strategic Industrial Energy Efficiency
10
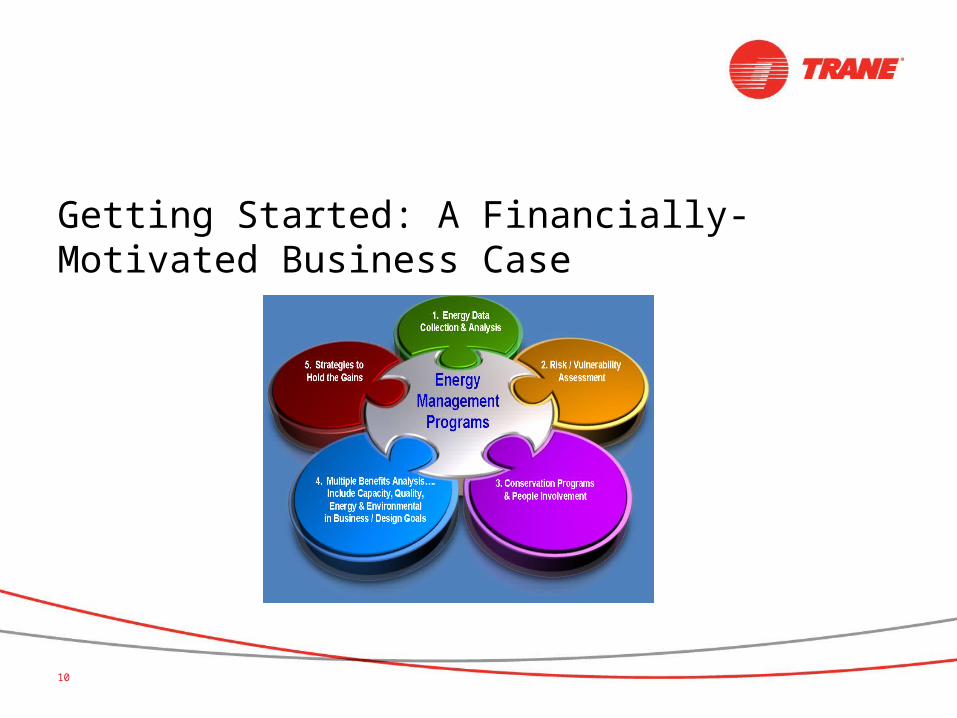
Getting Started: A Financially-Motivated Business Case

11
Making the Case for Energy Efficiency
Critical question: Is your building overhead or an asset?
Owners who view their buildings as assets link the physical environment to business outcomes – customer and employee satisfaction, productivity, operating expense reduction, among others. These buildings can be “high performance” and tie to the mission, values and results of a business
• Value to people the building serves (environment, comfort, safety) • Value to customers and community (competence, environmental
responsibility) • Value to the bottom line (cost savings, avoidance, ROIC)
12
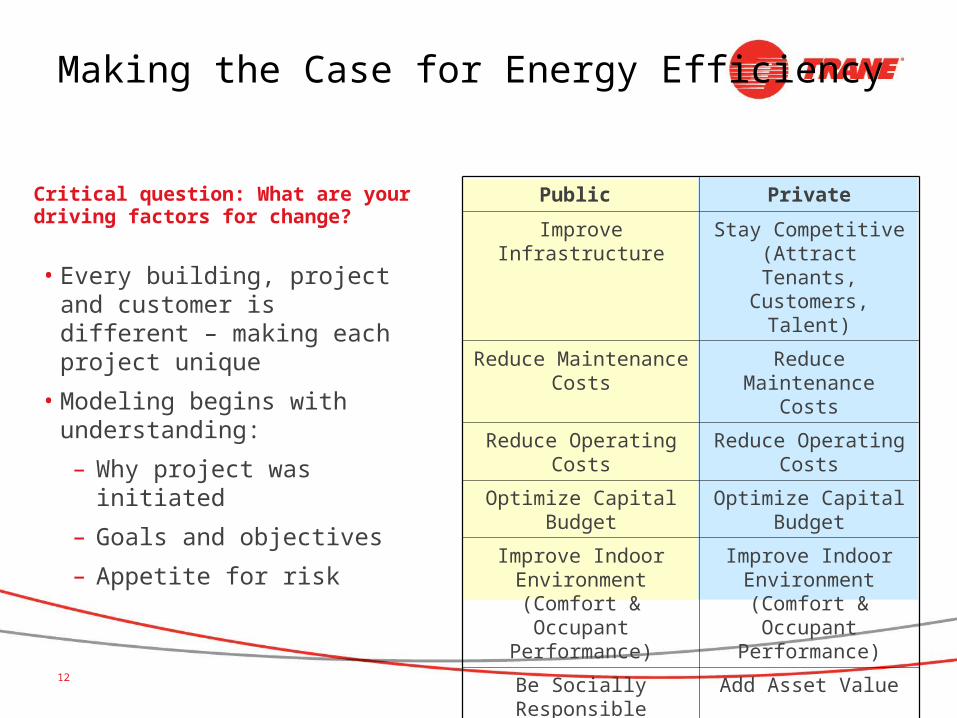
Public Private
Improve Infrastructure Stay Competitive (Attract Tenants,
Customers, Talent)
Reduce Maintenance Costs
Reduce Maintenance Costs
Reduce Operating Costs Reduce Operating Costs
Optimize Capital Budget Optimize Capital Budget
Improve Indoor Environment (Comfort & Occupant Performance)
Improve Indoor Environment (Comfort
& Occupant Performance)
Be Socially Responsible Add Asset Value
Making the Case for Energy Efficiency
Critical question: What are your driving factors for change?
• Every building, project and customer is different – making each project unique
• Modeling begins with understanding:
– Why project was initiated
– Goals and objectives
– Appetite for risk
13
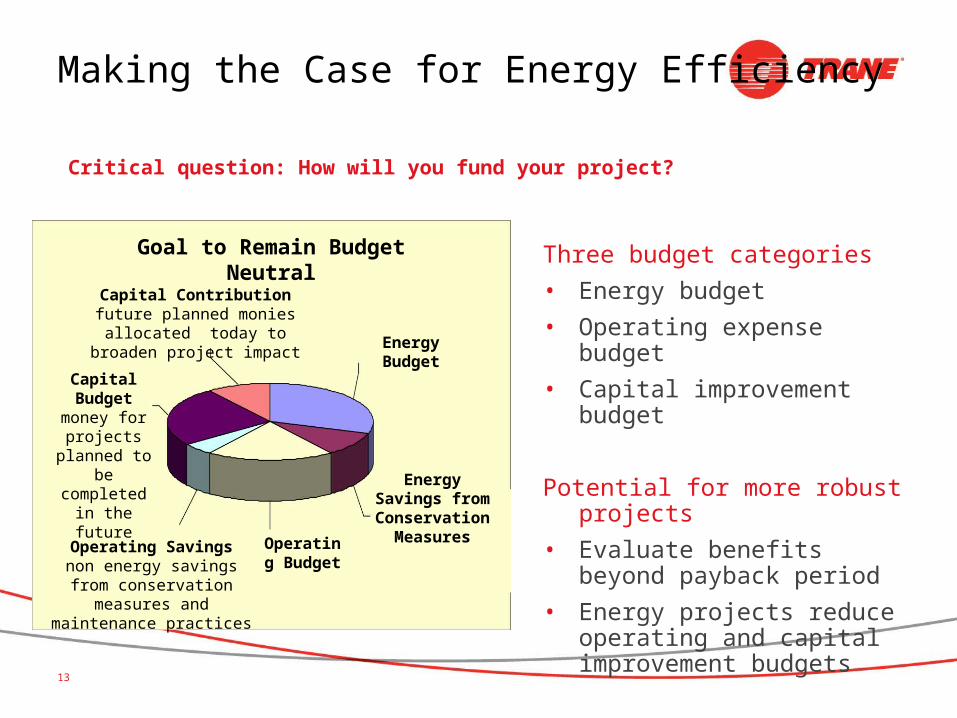
Critical question: How will you fund your project?
Three budget categories • Energy budget• Operating expense budget• Capital improvement budget
Potential for more robust projects • Evaluate benefits beyond payback
period• Energy projects reduce operating
and capital improvement budgets
Goal to Remain Budget Neutral
Capital Contributionfuture planned monies allocated
today to broaden project impact
Capital Budget
money for projects
planned to be completed in
the future
Operating Savingsnon energy savings from
conservation measures and maintenance practices
Operating Budget
Energy Savings from Conservation
Measures
Energy Budget
Making the Case for Energy Efficiency

14
Goal to Remain Budget Neutral
Operating Budget
Operating Savings - non energy savings from
conservation measures and maintenance practices
Capital Budget - money for projects planned to be completed in the future
Capital Contribution - future planned monies allocated today to broaden project
impactEnergy Budget
Energy Savings from Conservation Measures
• Goal: Allocate potential savings from operating budgets and avoidance from capital budgets to fund project:
– Operating budgets should reflect the funding of the debt service for the project with offsets to energy and maintenance budgets.
– Capital budgets should also reflect the funding of debt service...this is the amount of capital avoided as a result of the project.
– Projects that take a comprehensive approach create a consistent funding expectation and help mitigate unexpected spikes in funding requirements.
Critical question: How will you fund your project?
Making the Case for Energy Efficiency

15
Critical question: How will your project be delivered?
• Though capital remains the same, performance can be guaranteed by providers
• Providers compensated based upon success in achieving goals
• Contracts typically stipulate how incentives will be paid out for elevated performance or penalties assessed for missed targets.
Performance criteria examples
• Reliability (uptime, # of unplanned incidents)
• Efficiency (kW/Ton, mcf/BTU, etc.)
• Operating status (state of readiness, availability)
• Field conditions (clean towers, condensers, air intake)
• Output (BTUs, cooling tons, cfm, gpm)
• Capacity (peak output matched to load)
• Quality (power quality, load factors, IAQ)
• Rate of economic return (sustained energy efficiency)The Aberdeen Group, February 2007
Making the Case for Energy Efficiency
16
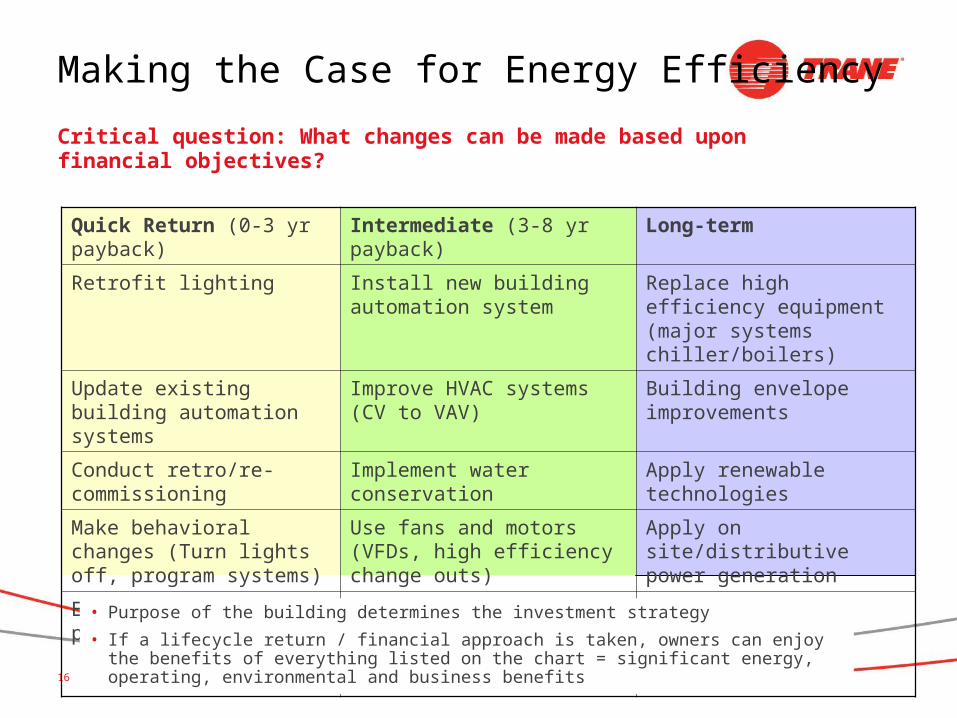
Quick Return (0-3 yr payback) Intermediate (3-8 yr payback) Long-term
Retrofit lighting Install new building automation system
Replace high efficiency equipment (major systems chiller/boilers)
Update existing building automation systems
Improve HVAC systems (CV to VAV)
Building envelope improvements
Conduct retro/re-commissioning
Implement water conservation Apply renewable technologies
Make behavioral changes (Turn lights off, program systems)
Use fans and motors (VFDs, high efficiency change outs)
Apply on site/distributive power generation
Explore utility procurement options
Apply load shifting technology (ice storage)
Implement comprehensive maintenance and repair strategies
Critical question: What changes can be made based upon financial objectives?
• Purpose of the building determines the investment strategy
• If a lifecycle return / financial approach is taken, owners can enjoy the benefits of everything listed on the chart = significant energy, operating, environmental and business benefits
Making the Case for Energy Efficiency
17
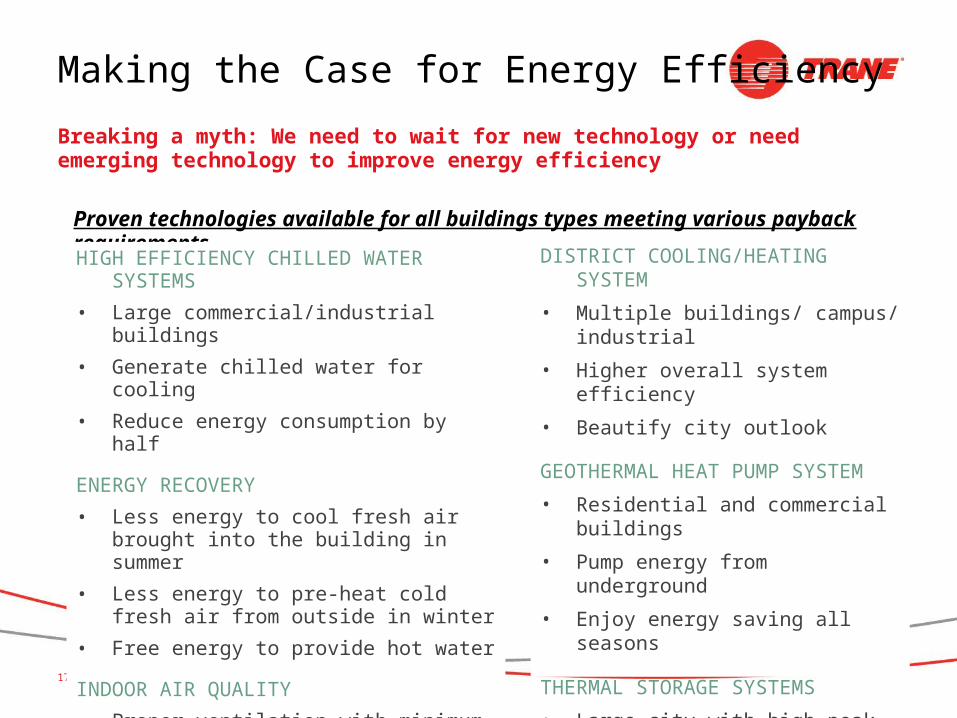
Breaking a myth: We need to wait for new technology or need emerging technology to improve energy efficiency
Making the Case for Energy Efficiency
DISTRICT COOLING/HEATING SYSTEM
• Multiple buildings/ campus/ industrial
• Higher overall system efficiency
• Beautify city outlook
GEOTHERMAL HEAT PUMP SYSTEM
• Residential and commercial buildings
• Pump energy from underground
• Enjoy energy saving all seasons
THERMAL STORAGE SYSTEMS
• Large city with high peak demand
• Shift demand from daytime to night
• Reduce blackout during hot summer
Proven technologies available for all buildings types meeting various payback requirements
HIGH EFFICIENCY CHILLED WATER SYSTEMS
• Large commercial/industrial buildings
• Generate chilled water for cooling
• Reduce energy consumption by half
ENERGY RECOVERY
• Less energy to cool fresh air brought into the building in summer
• Less energy to pre-heat cold fresh air from outside in winter
• Free energy to provide hot water
INDOOR AIR QUALITY
• Proper ventilation with minimum energy
• Temperature and humidity control
• Filtration options ensure good IAQ

18
Critical question: What costs need to be considered when financially modeling an energy project?
Total cost of ownership approach
• All of these factors need to be addressed at some point
• Modeling the building as a long-term asset
– Offers greater financial transparency
– Will ultimately save energy and operating dollars throughout the life of the asset
Hidden Costs
Visible Costs
Price/Time
CFC IssuesEnergy Costs Engineering
Charges
Equipment Shutdown
Costs
Maintenance Costs
Legal CostsSecurity Costs
Construction Change Orders
Being Green Costs Performance
Problems
Start-up Delays
Indoor Air Quality
Fire Protection Cost
Making the Case for Energy Efficiency
19
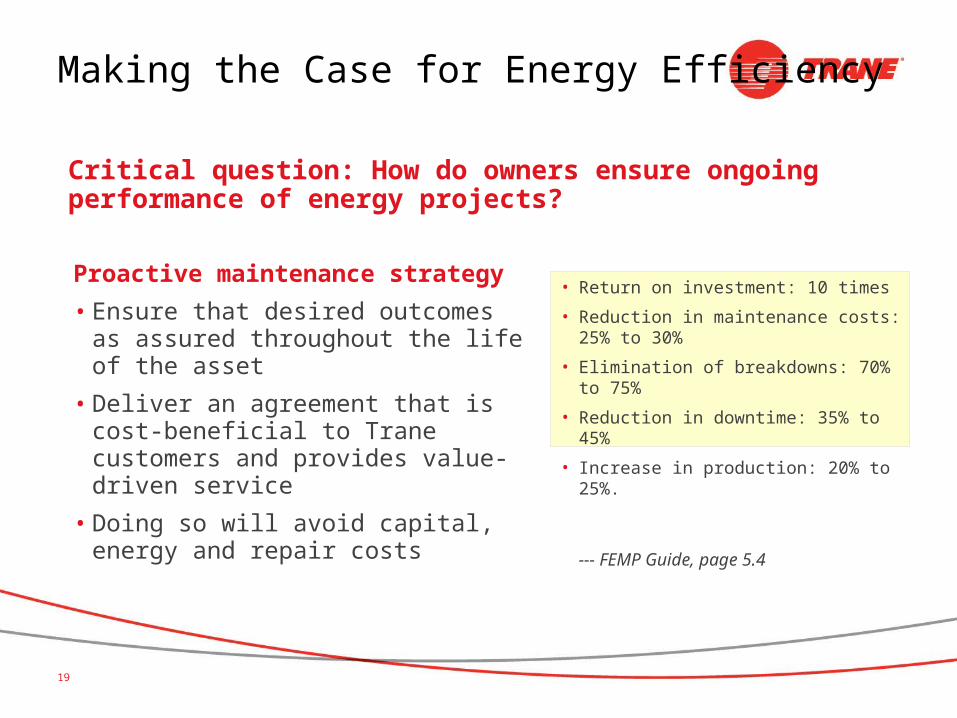
Critical question: How do owners ensure ongoing performance of energy projects?
Proactive maintenance strategy
• Ensure that desired outcomes as assured throughout the life of the asset
• Deliver an agreement that is cost-beneficial to Trane customers and provides value-driven service
• Doing so will avoid capital, energy and repair costs
• Return on investment: 10 times
• Reduction in maintenance costs: 25% to 30%
• Elimination of breakdowns: 70% to 75%
• Reduction in downtime: 35% to 45%
• Increase in production: 20% to 25%.
--- FEMP Guide, page 5.4
Making the Case for Energy Efficiency
20
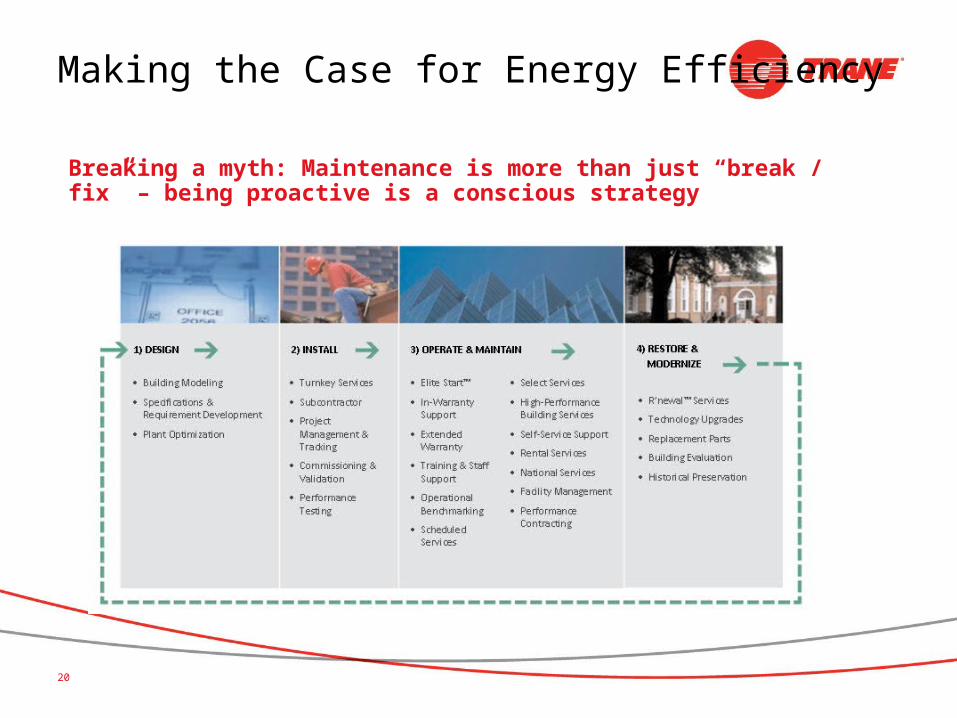
Breaking a myth: Maintenance is more than just “break / fix” – being proactive is a conscious strategy
Making the Case for Energy Efficiency

21
Critical question: What is the financial model (example)?
Construction CustomerPro Forma
Cash PurchaseYes Yes 14-Apr-09
Yes Yes0 1 2 3 4 5 6 7
Year 0 Year 1 Year 2 Year 3 Year 4 Year 5 Year 6 Year 7 TotalsEnergy Savings - Gas 300,000 600,000 630,000 661,500 694,575 729,304 765,769 804,057 5,185,205Energy Savings - Electric 125,000 250,000 260,000 270,400 281,216 292,465 304,163 316,330 2,099,574Operational Savings 300,000 309,000 318,270 327,818 337,653 347,782 358,216 2,298,739Capital Cost Avoidance 250,000 250,000 250,000Utility Rebate 500,000 500,000 500,000Total Annual Savings 425,000 1,650,000 1,449,000 1,250,170 1,303,609 1,359,421 1,417,714 1,478,603 10,333,517
Installation Costs 5,000,000 5,000,000Maintenance Costs 25,000 65,000 66,950 68,959 71,027 73,158 75,353 445,447Central Plant Operations 75,000 78,750 82,688 86,822 91,163 95,721 100,507 610,651Total Annual Costs 5,000,000 100,000 143,750 149,638 155,780 162,190 168,879 175,860 6,056,097
Annual Net Cash Flow (4,575,000) 1,550,000 1,305,250 1,100,533 1,147,829 1,197,231 1,248,835 1,302,743 4,277,420
Cumulative Cash Flow (4,575,000) (3,025,000) (1,719,750) (619,218) 528,611 1,725,842 2,974,677 4,277,4200
(4,575,000) 1,550,000 1,305,250 1,100,533 1,147,829 1,197,231 1,248,835 1,302,743(4,575,000) (3,025,000) (1,719,750) (619,218) 528,611 1,725,842 2,974,677 4,277,420
1.00 1.00 1.00 0.54 0.00 0.00 0.00Assumptions Net Cash Flow 4,277,420 Financing Institution: Fleet
NPV @ 15% 664,840 Amount Financed: 4,000,000
Payback Period 3.5 Years Interest Rate: 8.50%
Making the Case for Energy Efficiency

22
Critical question: What is the financial model (example)?
Model offers comprehensive view• Driving factors, funding and budget allocations, capital expenses, total cost of
ownership and financial return • Analyzes cash flow over project life
Model incorporates more ECMs• If owner considers only energy savings in financial decision
– Project would yield a 11.7 year payback • If owner considers energy, operating cost, maintenance and asset replacement
cost savings over the life of the project– Project yields a 3 year payback and it generates positive cash flow
Making the Case for Energy Efficiency
23
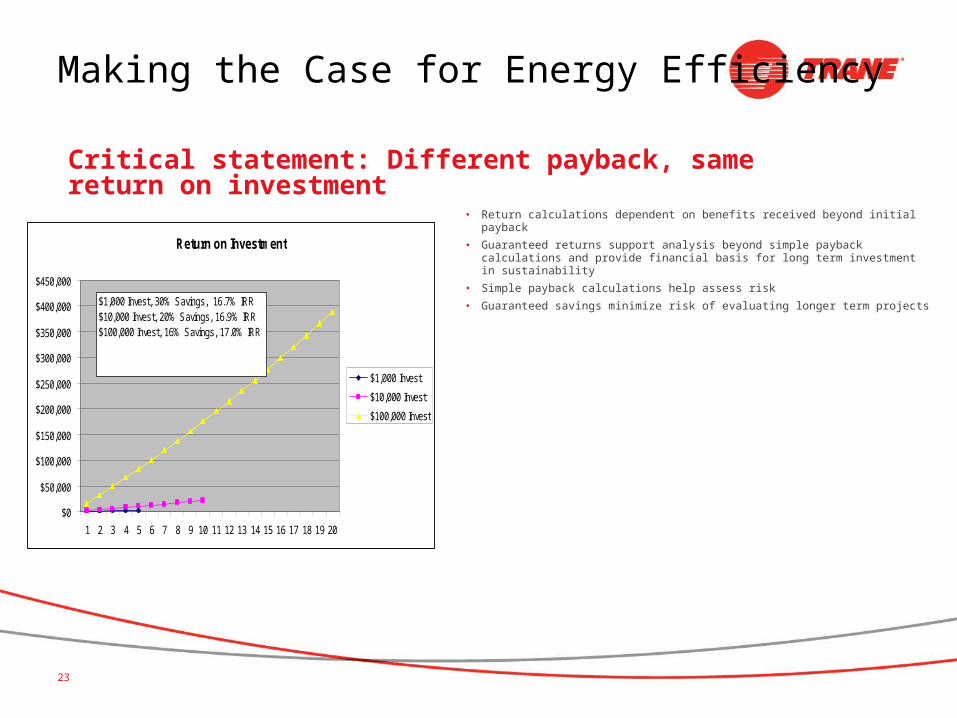
• Return calculations dependent on benefits received beyond initial payback
• Guaranteed returns support analysis beyond simple payback calculations and provide financial basis for long term investment in sustainability
• Simple payback calculations help assess risk
• Guaranteed savings minimize risk of evaluating longer term projects
Return on Investment
$0
$50,000
$100,000
$150,000
$200,000
$250,000
$300,000
$350,000
$400,000
$450,000
1 2 3 4 5 6 7 8 9 10 11 12 13 14 15 16 17 18 19 20
$1,000 Invest
$10,000 Invest
$100,000 Invest
$1,000 Invest, 30% Savings, 16.7% IRR$10,000 Invest, 20% Savings, 16.9% IRR$100,000 Invest, 16% Savings, 17.0% IRR
Critical statement: Different payback, same return on investment
Making the Case for Energy Efficiency

24
How To Get Started: And Hold the Gains
Make efficiency a c-level imperative
Create a shared vision and create a mindset of “high performance buildings” rather than “overhead”
Make the business case to understand appetite for risk, payback and
realistic measures / actions that can be taken
Make decisions and initiate your project
Integrate energy efficiency into business strategies, build employee engagement
Measure progress to ensure continuous improvement
25
Proving the Model: Case Examples of Large Energy Projects

26
Situation:• Campus-style 102.200-sq-meter (1,1 million-sq-ft) heavy industrial manufacturing plant • Aging infrastructure with low energy efficiency and reliability and high operating and maintenance costs
– Dramatic downturn in product sales – While experiencing 70+% increase in energy costs
• Corporate goal of 15% reduction in energy cost by 2013
Approach:• Factors driving improvements:
– Need to stay competitive– Reduce maintenance and operating costs – Add asset value
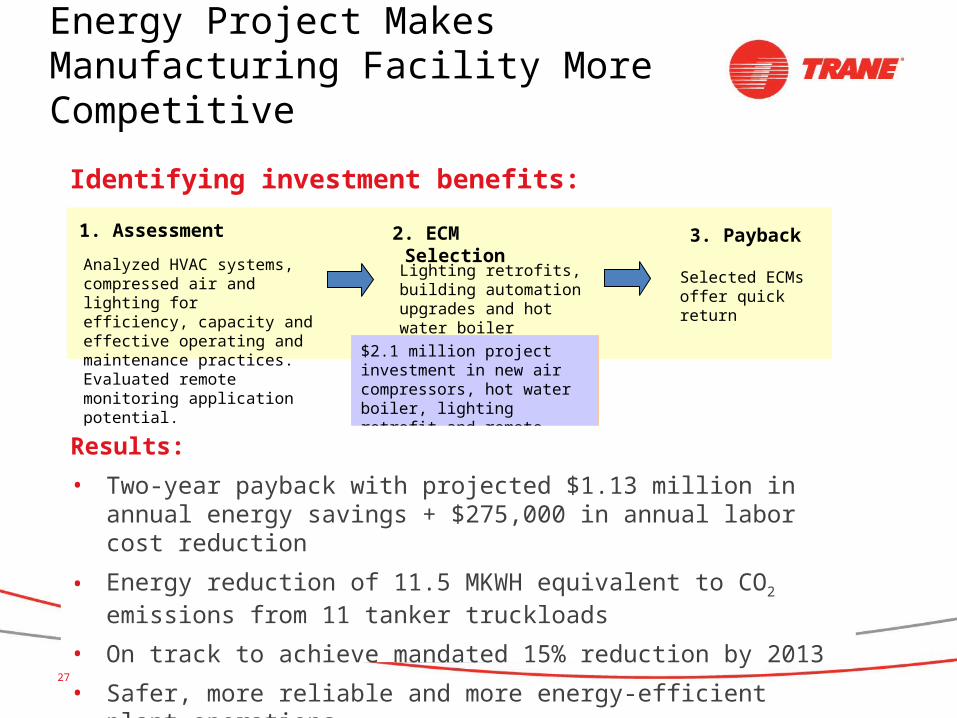
Energy Project Makes Manufacturing Facility More Competitive
27
Identifying investment benefits:
2. ECM Selection 1. Assessment 3. Payback
Analyzed HVAC systems, compressed air and lighting for efficiency, capacity and effective operating and maintenance practices. Evaluated remote monitoring application potential.
Lighting retrofits, building automation upgrades and hot water boiler
Selected ECMs offer quick return
$2.1 million project investment in new air compressors, hot water boiler, lighting retrofit and remote monitoring
Results:
• Two-year payback with projected $1.13 million in annual energy savings + $275,000 in annual labor cost reduction
• Energy reduction of 11.5 MKWH equivalent to CO2 emissions from 11 tanker truckloads
• On track to achieve mandated 15% reduction by 2013
• Safer, more reliable and more energy-efficient plant operations
Energy Project Makes Manufacturing Facility More Competitive
28
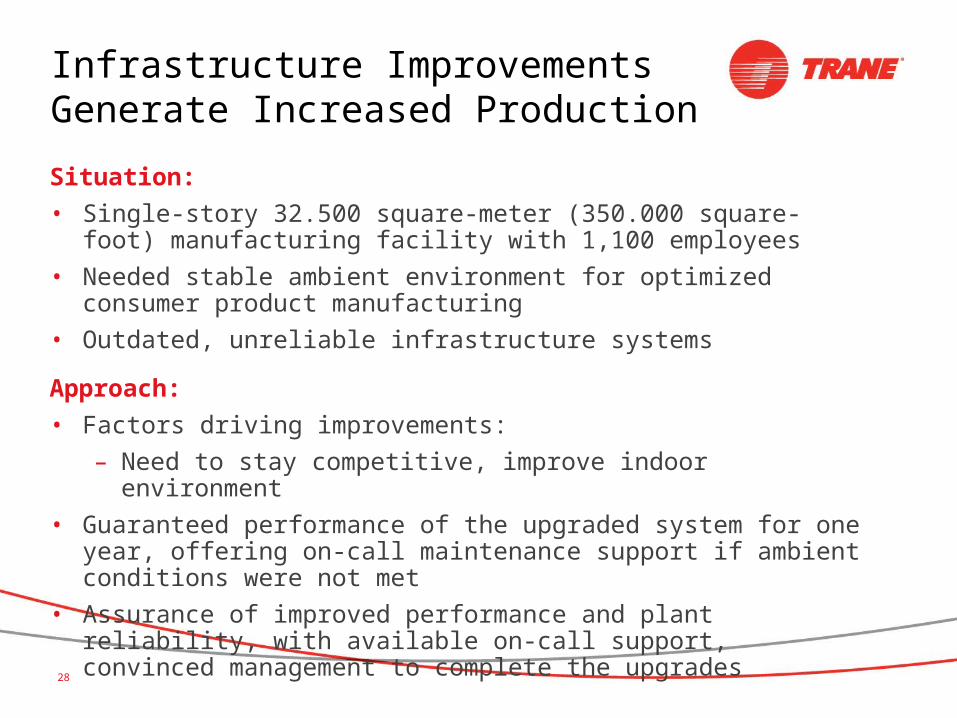
Infrastructure Improvements Generate Increased Production
Situation:• Single-story 32.500 square-meter (350.000 square-foot) manufacturing
facility with 1,100 employees • Needed stable ambient environment for optimized consumer product
manufacturing• Outdated, unreliable infrastructure systems
Approach:• Factors driving improvements:
– Need to stay competitive, improve indoor environment• Guaranteed performance of the upgraded system for one year, offering
on call maintenance support if ambient conditions were not met‑
• Assurance of improved performance and plant reliability, with available on-call support, convinced management to complete the upgrades

29
Identifying investment benefits:
2. ECM Selection1. Assessment 3. PaybackAnalyzed chiller and air handling systems and the pneumatic building automation system (BAS) for reliability, efficiency, capacity and performance
High-efficiency chiller systems with variable flow water pumps, upgraded air handling systems and centralized BAS --
Quick return: BAS
Solid return: Chiller and air handling systems
Results:
• Customer able to more effectively compete
– Increased production in improved environment
– Maintained near-perfect system performance
– Completed needed adjustments within hours
– Project finished on time and on budget with minimal production downtime
$8 million system upgrade
Infrastructure Improvements Generate Increased Production

30
Five Star Hotel Increases Comfort and Efficiency
Situation:• Five-star Le Meridian Hotel on three-acre complex• High operating expenses and service costs• Outdated systems lacking centralized control• Noise levels compromising guest and employee comfort and
government regulations
Approach:• Factors driving improvements: increase competitiveness, reduce
operating costs, add asset value • Identifying investment benefits:
2. ECM Selection1. Assessment 3. PaybackEvaluated efficiency, capacity, noise, safety and maintenance
New chiller systems and a centralized (BAS)
Selected ECMs offer solid return

31
Deliverables:
• $375K project with reduction of operating costs, increasing reliability with a 3.5 year payback – included systems and remote monitoring
Results:
• Significant reliability increase and 30% improvement in chiller plant energy efficiency
• BAS achieved additional 6-8% energy savings
• Project completed in tight timeframe with minimal guest inconvenience
• Ongoing maintenance contract reduced service costs 30%
• Noise level reduction of 40% improved guest and employee comfort and brought systems to code
Five Star Hotel Increases Comfort and Efficiency
32
Hotel Hosts Upgrades for Increased Reliability
Situation:• 20-story hotel with 518 guest rooms, casino and meeting and exhibition • Frequent breakdowns, reduced efficiency and high operating costs from outdated systems• Difficult-to-access plant room and decentralized system control• Infrastructure systems generating noise complaints from guests
Approach:• Factors driving improvements:
– Increase competitiveness– Reduce operating costs – Increase asset value – Environmental responsibility in compliance with 2010 mandate
33
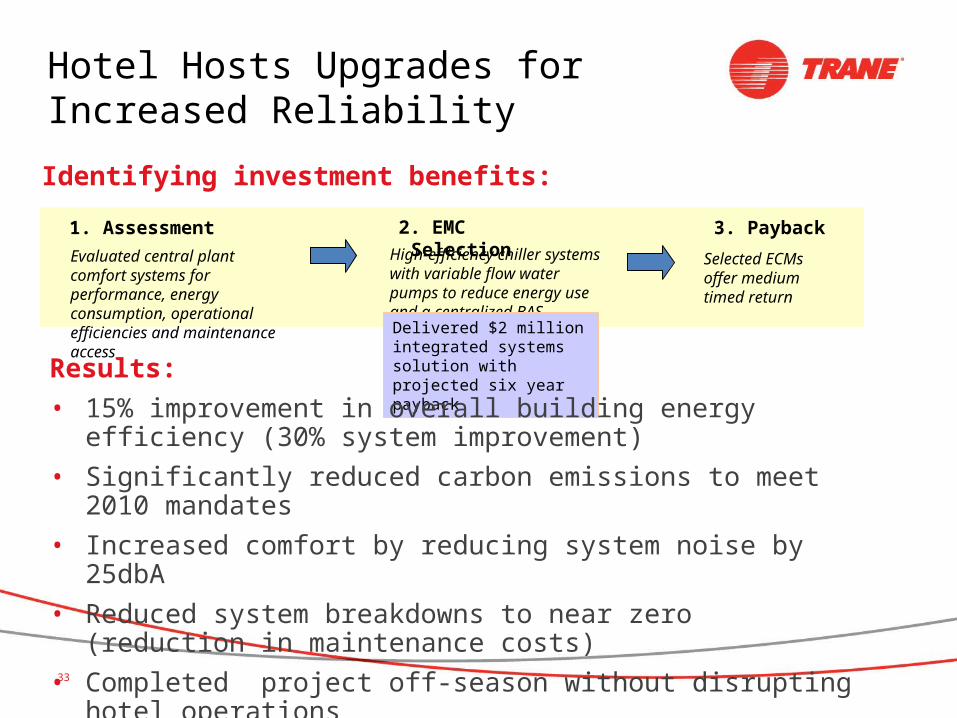
Identifying investment benefits:
2. EMC Selection1. Assessment 3. Payback
Evaluated central plant comfort systems for performance, energy consumption, operational efficiencies and maintenance access
High-efficiency chiller systems with variable flow water pumps to reduce energy use and a centralized BAS
Selected ECMs offer medium timed return
Delivered $2 million integrated systems solution with projected six year paybackResults:
• 15% improvement in overall building energy efficiency (30% system improvement)
• Significantly reduced carbon emissions to meet 2010 mandates• Increased comfort by reducing system noise by 25dbA• Reduced system breakdowns to near zero (reduction in maintenance
costs) • Completed project off-season without disrupting hotel operations
Hotel Hosts Upgrades for Increased Reliability
34
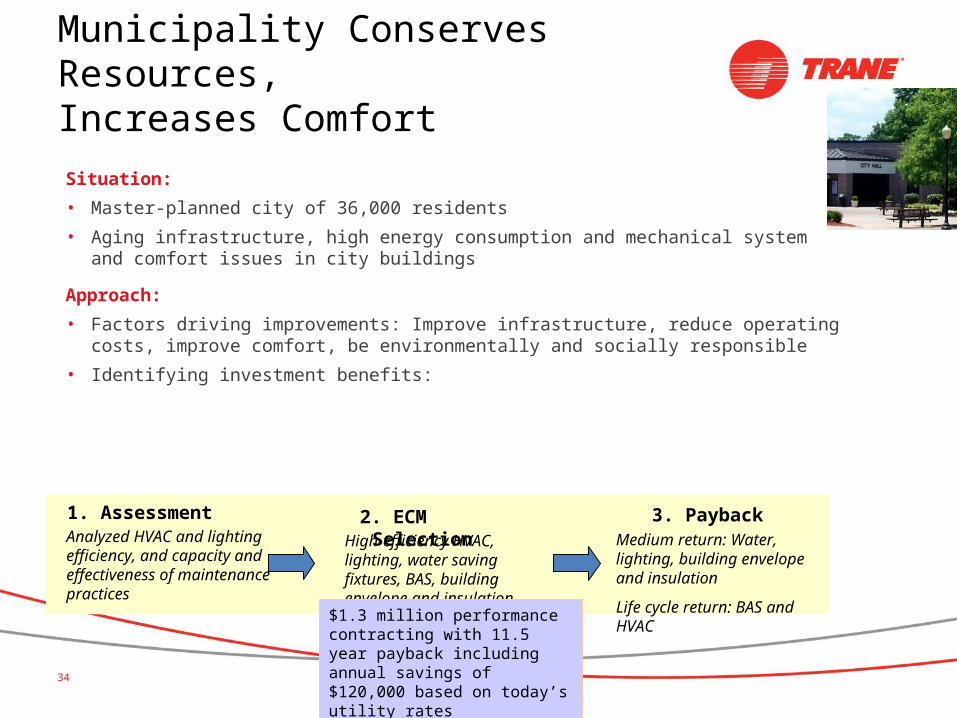
Municipality Conserves Resources, Increases ComfortSituation:
• Master-planned city of 36,000 residents
• Aging infrastructure, high energy consumption and mechanical system and comfort issues in city buildings
Approach:
• Factors driving improvements: Improve infrastructure, reduce operating costs, improve comfort, be environmentally and socially responsible
• Identifying investment benefits:
2. ECM Selection1. Assessment 3. PaybackAnalyzed HVAC and lighting efficiency, and capacity and effectiveness of maintenance practices
High-efficiency HVAC, lighting, water saving fixtures, BAS, building envelope and insulation
Medium return: Water, lighting, building envelope and insulation
Life cycle return: BAS and HVAC
$1.3 million performance contracting with 11.5 year payback including annual savings of $120,000 based on today’s utility rates

35
Results:
• No capital funding increase to make significant physical improvements
• Project guaranteed energy savings of 877,266 kWh per year, equivalent to recycling 215 tonnes of waste
• First full year following renovations showed 10% energy savings above predicted savings
• Project has also saved 18,448 therms of natural gas and 1.2 million gallons of water
• Comfort and maintenance issues resolved
Municipality Conserves Resources, Increases Comfort
36
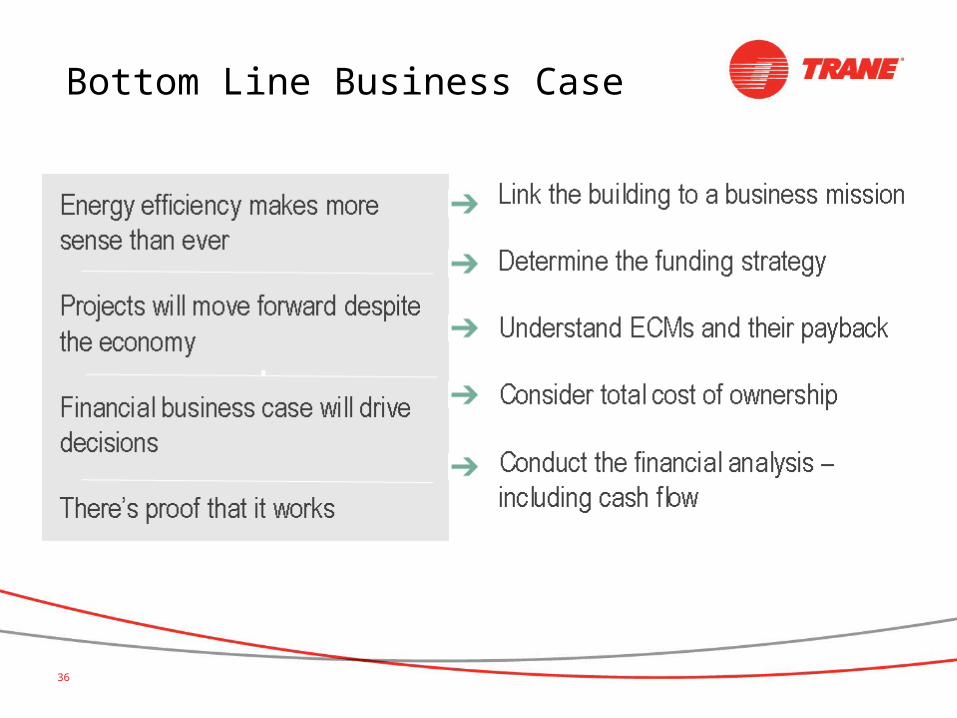
Bottom Line Business Case