Quantum Planning Group September 7 2016
QPG Page 1 of 15
WECC Scenarios: Early Indicator, Trends and
Scenario Movement Analysis
The 11th Monthly Report to WECC and the SPSG For August 2016
The Quantum Planning Group September 7, 2016
Quantum Planning Group September 7 2016
QPG Page 2 of 15
INTRODUCTION This is the 11th of the monthly reports by the Quantum Planning Group to WECC and the SPSG delivered on the 7th day of each month, covering:
1. Significant Event-Pattern-Structure (EPS) Events and Early Indicators (EIs) for the WECC scenarios and their implications
2. Significant Uncertainties and Major Trends within the EPS and Early Indicators 3. Movement / progress indicated by the trends towards one or more of the WECC
scenarios
These reports include Scenario 5: Energy/Water/Climate Change since Event EPS’ can be related to this scenario even though there are no specific Early Indicators for this scenario.
While this monthly report details EPS submittals for the period of August 1-31 2016 inclusively, our analysis considers and builds on learnings from the last 10 reports.
We refer the reader to our report to the SPSG of November 3 2015 entitled: WECC Scenarios Trends and Early Indicator Analysis, and the prior WECC Scenarios: Early Indicator, Trends and Scenario Movement Analysis reports of October 2015 - July 2016 reports for additional information.
The links to the event EPS’ below are “hot” and when clicked on will take the reader directly to the EPS in the SPSG pages on the WECC website.
For August there were: 16 new EPS with significant events added 11 EPS (69%) with one or more EIs flagged for a total of 22 EIs flagged
For the period September 2015 – August 2016 there were: 243 Total EPS with significant events added 120 EPS (49%) with one or more EIs flagged for a total of 213 EIs flagged
August’s report includes the following sections:
Significant Uncertainties, Recent Trends & Wild Cards…… Page 3 Scenario Axis Trends………………………………………….. Page 6 EPS Events with EIs and Scenario Movement Analysis….. Page 8
• Scenario 1 • Scenario 2 • Scenario 3 • Scenario 4 • Scenario 5
EPS Events without EIs Flagged…………………………….. Page 15
Quantum Planning Group September 7 2016
QPG Page 3 of 15
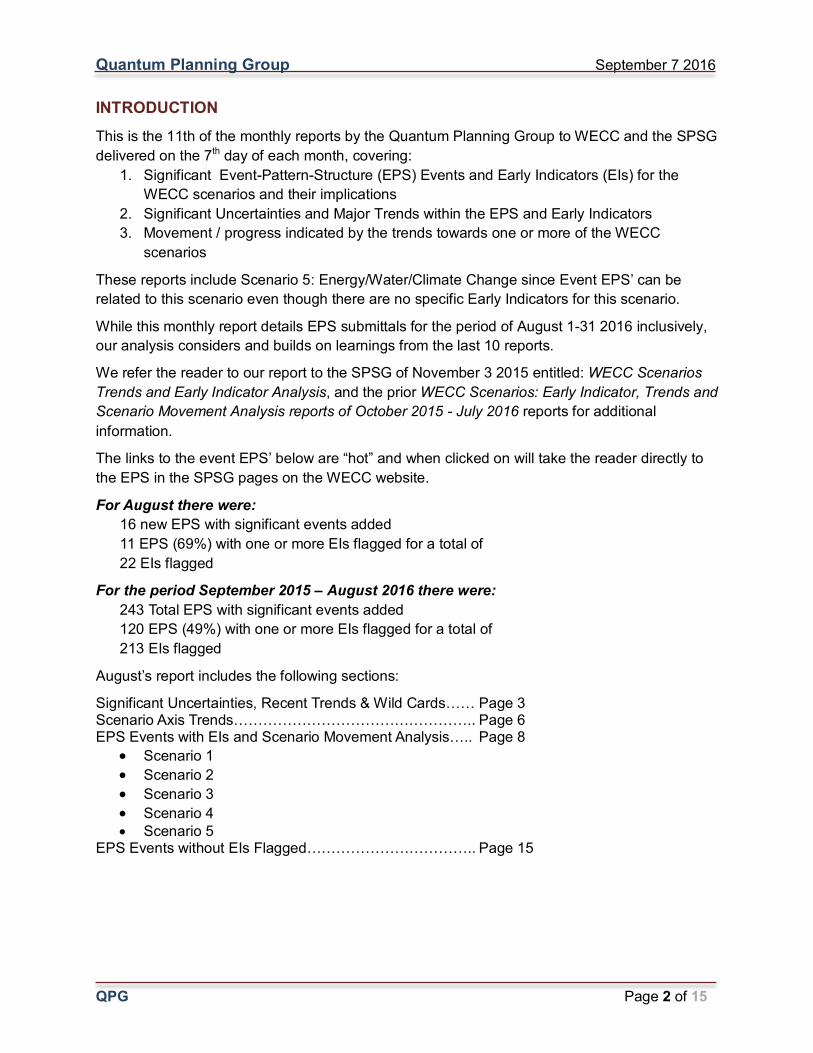
SIGNIFICANT UNCERTAINTIES FOR CONSIDERATION Declining Productivity Driving Slower Economic Growth “…The United States is adding jobs at a healthy clip, as a recent New York Times article showed, and the unemployment rate is relatively low1…”
But that is happening despite a long-term trend of much lower growth, both in the United States and other advanced nations, than was evident for most of the post-World War II era.2 “…The slowdown boils down to supply and demand: the ability of the global economy to produce goods and services, and the desire of consumers and businesses to buy them, but now there are fewer and fewer people reaping the benefits of what growth there is. What’s worrisome is that weakness in global supply and demand seems to be pushing each other in a vicious circle…”
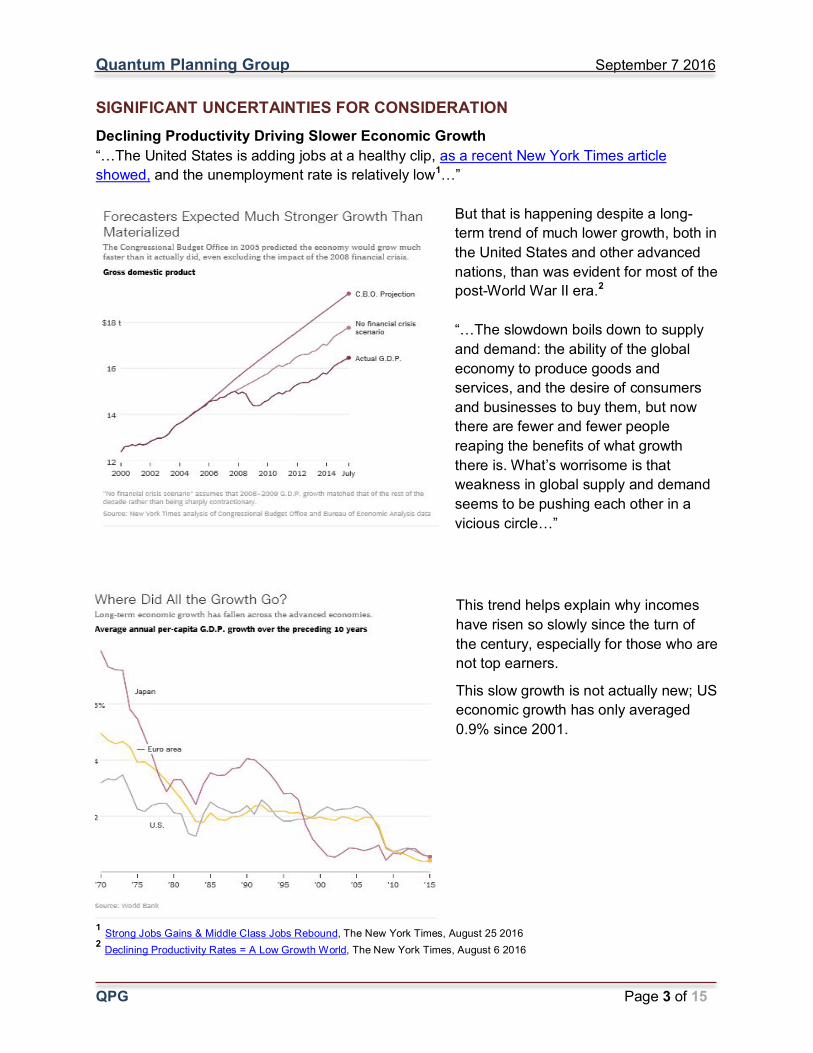
This trend helps explain why incomes have risen so slowly since the turn of the century, especially for those who are not top earners.
This slow growth is not actually new; US economic growth has only averaged 0.9% since 2001.
1 Strong Jobs Gains & Middle Class Jobs Rebound, The New York Times, August 25 2016 2 Declining Productivity Rates = A Low Growth World, The New York Times, August 6 2016
Quantum Planning Group September 7 2016
QPG Page 4 of 15
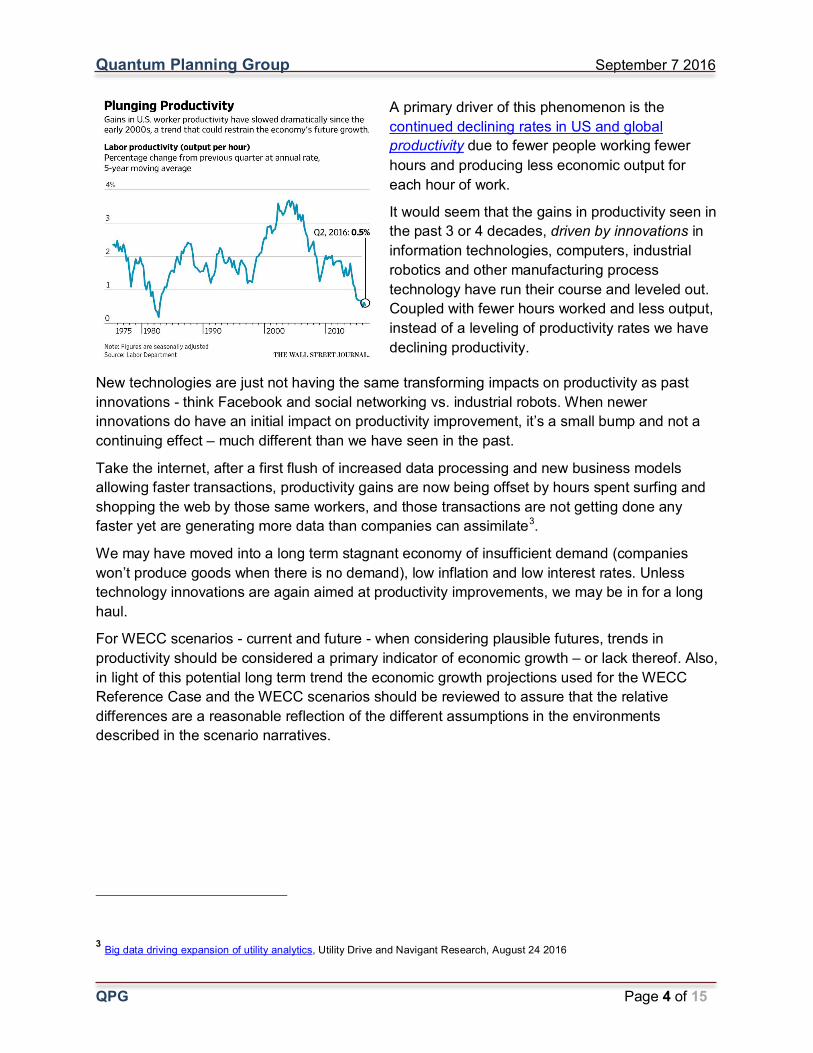
A primary driver of this phenomenon is the continued declining rates in US and global productivity due to fewer people working fewer hours and producing less economic output for each hour of work.
It would seem that the gains in productivity seen in the past 3 or 4 decades, driven by innovations in information technologies, computers, industrial robotics and other manufacturing process technology have run their course and leveled out. Coupled with fewer hours worked and less output, instead of a leveling of productivity rates we have declining productivity.
New technologies are just not having the same transforming impacts on productivity as past innovations - think Facebook and social networking vs. industrial robots. When newer innovations do have an initial impact on productivity improvement, it’s a small bump and not a continuing effect – much different than we have seen in the past.
Take the internet, after a first flush of increased data processing and new business models allowing faster transactions, productivity gains are now being offset by hours spent surfing and shopping the web by those same workers, and those transactions are not getting done any faster yet are generating more data than companies can assimilate3.
We may have moved into a long term stagnant economy of insufficient demand (companies won’t produce goods when there is no demand), low inflation and low interest rates. Unless technology innovations are again aimed at productivity improvements, we may be in for a long haul.
For WECC scenarios - current and future - when considering plausible futures, trends in productivity should be considered a primary indicator of economic growth – or lack thereof. Also, in light of this potential long term trend the economic growth projections used for the WECC Reference Case and the WECC scenarios should be reviewed to assure that the relative differences are a reasonable reflection of the different assumptions in the environments described in the scenario narratives.
3 Big data driving expansion of utility analytics, Utility Drive and Navigant Research, August 24 2016
Quantum Planning Group September 7 2016
QPG Page 5 of 15
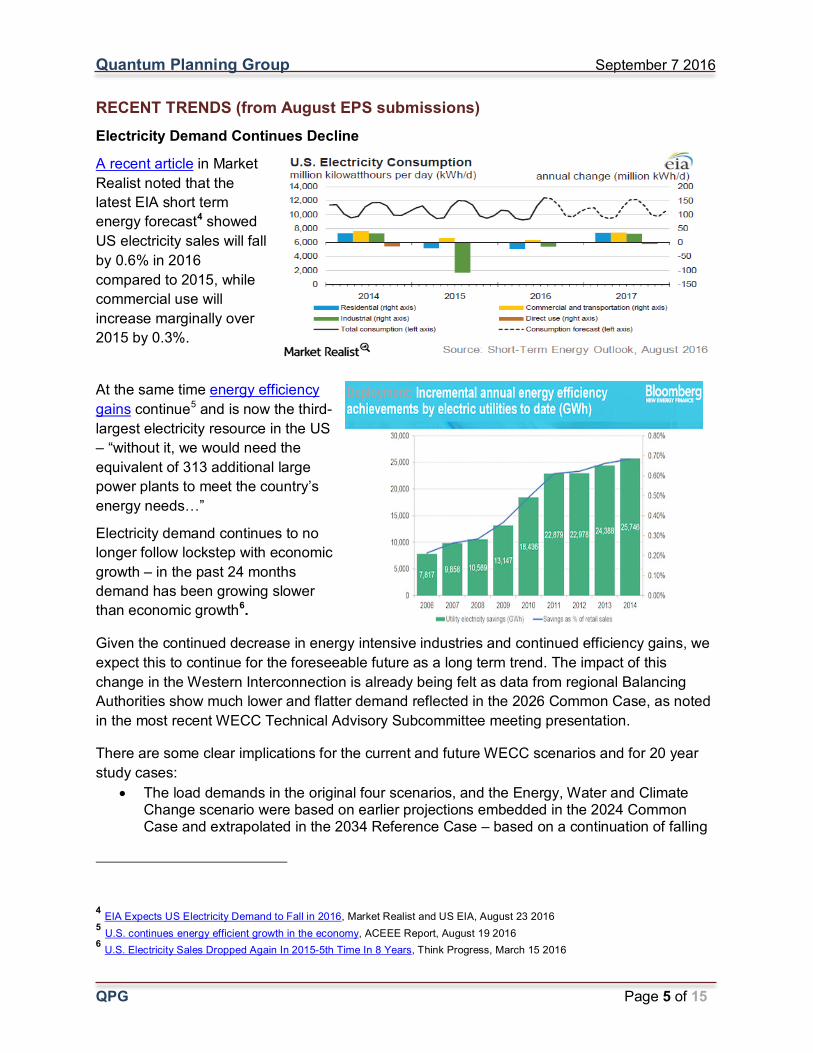
RECENT TRENDS (from August EPS submissions) Electricity Demand Continues Decline
A recent article in Market Realist noted that the latest EIA short term energy forecast4 showed US electricity sales will fall by 0.6% in 2016 compared to 2015, while commercial use will increase marginally over 2015 by 0.3%.
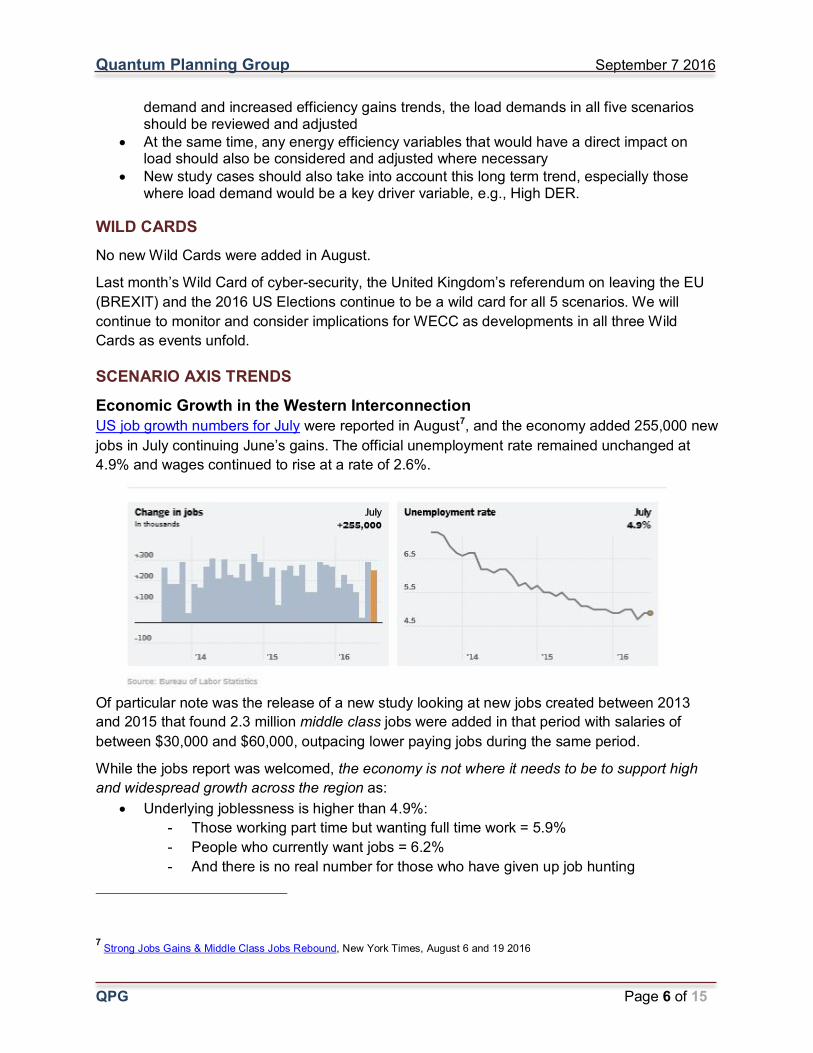
At the same time energy efficiency gains continue5 and is now the third-largest electricity resource in the US – “without it, we would need the equivalent of 313 additional large power plants to meet the country’s energy needs…”
Electricity demand continues to no longer follow lockstep with economic growth – in the past 24 months demand has been growing slower than economic growth6.
Given the continued decrease in energy intensive industries and continued efficiency gains, we expect this to continue for the foreseeable future as a long term trend. The impact of this change in the Western Interconnection is already being felt as data from regional Balancing Authorities show much lower and flatter demand reflected in the 2026 Common Case, as noted in the most recent WECC Technical Advisory Subcommittee meeting presentation.
There are some clear implications for the current and future WECC scenarios and for 20 year study cases:
• The load demands in the original four scenarios, and the Energy, Water and Climate Change scenario were based on earlier projections embedded in the 2024 Common Case and extrapolated in the 2034 Reference Case – based on a continuation of falling
4 EIA Expects US Electricity Demand to Fall in 2016, Market Realist and US EIA, August 23 2016 5 U.S. continues energy efficient growth in the economy, ACEEE Report, August 19 2016 6 U.S. Electricity Sales Dropped Again In 2015-5th Time In 8 Years, Think Progress, March 15 2016
Quantum Planning Group September 7 2016
QPG Page 6 of 15
demand and increased efficiency gains trends, the load demands in all five scenarios should be reviewed and adjusted
• At the same time, any energy efficiency variables that would have a direct impact on load should also be considered and adjusted where necessary
• New study cases should also take into account this long term trend, especially those where load demand would be a key driver variable, e.g., High DER.
WILD CARDS No new Wild Cards were added in August.
Last month’s Wild Card of cyber-security, the United Kingdom’s referendum on leaving the EU (BREXIT) and the 2016 US Elections continue to be a wild card for all 5 scenarios. We will continue to monitor and consider implications for WECC as developments in all three Wild Cards as events unfold.
SCENARIO AXIS TRENDS
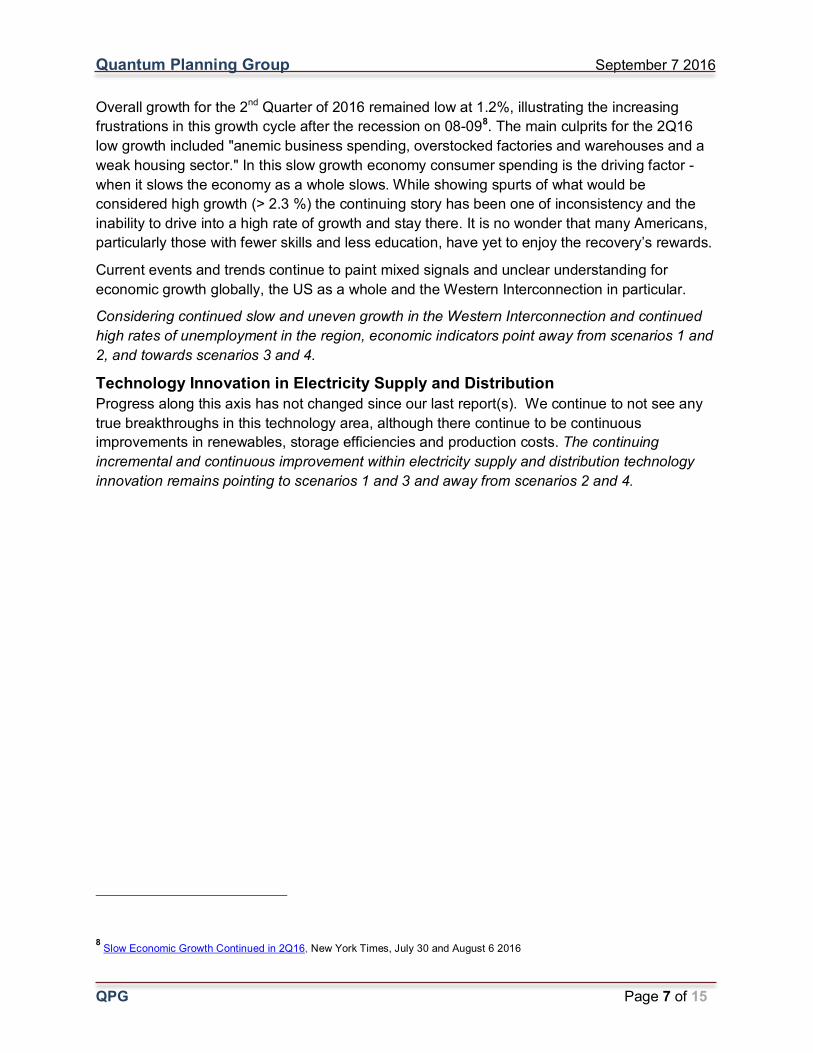
Economic Growth in the Western Interconnection US job growth numbers for July were reported in August7, and the economy added 255,000 new jobs in July continuing June’s gains. The official unemployment rate remained unchanged at 4.9% and wages continued to rise at a rate of 2.6%.
Of particular note was the release of a new study looking at new jobs created between 2013 and 2015 that found 2.3 million middle class jobs were added in that period with salaries of between $30,000 and $60,000, outpacing lower paying jobs during the same period.
While the jobs report was welcomed, the economy is not where it needs to be to support high and widespread growth across the region as:
• Underlying joblessness is higher than 4.9%: - Those working part time but wanting full time work = 5.9% - People who currently want jobs = 6.2% - And there is no real number for those who have given up job hunting
7 Strong Jobs Gains & Middle Class Jobs Rebound, New York Times, August 6 and 19 2016
Quantum Planning Group September 7 2016
QPG Page 7 of 15
Overall growth for the 2nd Quarter of 2016 remained low at 1.2%, illustrating the increasing frustrations in this growth cycle after the recession on 08-098. The main culprits for the 2Q16 low growth included "anemic business spending, overstocked factories and warehouses and a weak housing sector." In this slow growth economy consumer spending is the driving factor - when it slows the economy as a whole slows. While showing spurts of what would be considered high growth (> 2.3 %) the continuing story has been one of inconsistency and the inability to drive into a high rate of growth and stay there. It is no wonder that many Americans, particularly those with fewer skills and less education, have yet to enjoy the recovery’s rewards.
Current events and trends continue to paint mixed signals and unclear understanding for economic growth globally, the US as a whole and the Western Interconnection in particular.
Considering continued slow and uneven growth in the Western Interconnection and continued high rates of unemployment in the region, economic indicators point away from scenarios 1 and 2, and towards scenarios 3 and 4.
Technology Innovation in Electricity Supply and Distribution Progress along this axis has not changed since our last report(s). We continue to not see any true breakthroughs in this technology area, although there continue to be continuous improvements in renewables, storage efficiencies and production costs. The continuing incremental and continuous improvement within electricity supply and distribution technology innovation remains pointing to scenarios 1 and 3 and away from scenarios 2 and 4.
8 Slow Economic Growth Continued in 2Q16, New York Times, July 30 and August 6 2016
Quantum Planning Group September 7 2016
QPG Page 8 of 15
EPS EVENTS WITH EARLY INDICATORS
Scenario 1: Focus on Economic Recovery (S1) Note: Items with * indicate EPS affecting more than one scenario EPS Events Noting Flagged Early Indicators:
EPS Key Drivers EIs Flagged Court Allows Social Cost of Carbon Use by Federal Agencies*
Evolution of Electric Demand in the WECC Region; Evolution of Electric Supply in the WECC Region; Changes in Social Values Related to Energy Issues; Changes in Society’s Preferences for Sustaining Environment and Natural Resources; Shifts in Availability and Prices of Fuels used in Electricity Sector
1.1
Wind energy continues its growth in U.S.* Evolution of Electric Supply in the WECC Region 1.3,1.5 Coal use continues its decline in the US but grows globally*
Shifts in national and global financial markets 1.3
Tres Amigas transmission line continues* Innovation in Electric Supply and Distribution 1.3 Natural Gas CO2 Emissions Pass Coal* Evolution of Electric Supply in the WECC Region;
Changes in Regulation of Electric Power Systems in the WECC Region; Changes in Federal Regulation of Electric Power Systems in the WECC Region; Changes in Social Values Related to Energy Issues; Changes in Society’s Preferences for Sustaining Environment and Natural Resources; Shifts in Availability and Prices of Fuels used in Electricity Sector
None
Strong Jobs Gains & Middle Class Jobs Rebound*
Economic Growth in the WECC Region None
Slow Economic Growth Continued in 2Q16*
Economic Growth in the WECC Region; Shifts in national and global financial markets
None
U.S. continues energy efficient growth in the economy* Evolution of Electric Demand in the WECC Region None
Big data driving expansion of utility analytics*
Innovation in Electric Supply and Distribution None
S1 Trends Economic Growth: Considering the section above on the Economic Growth axis, we can make a strong case that economic trends continue to point away from Scenario 1.
Technology Innovation: Current trends continue to indicate continued incremental improvements in electricity supply and distribution technology therefore pointing towards the Scenario 1 technology quadrant.
Other indicators: The Wild Cards of cyber-security, the 2016 US elections and BREXIT impacts remain as Wild Cards for Scenario 1.
S1 Movement NO CHANGE: Year to date events indicate continued conflicting movement around S1.
Quantum Planning Group September 7 2016
QPG Page 9 of 15
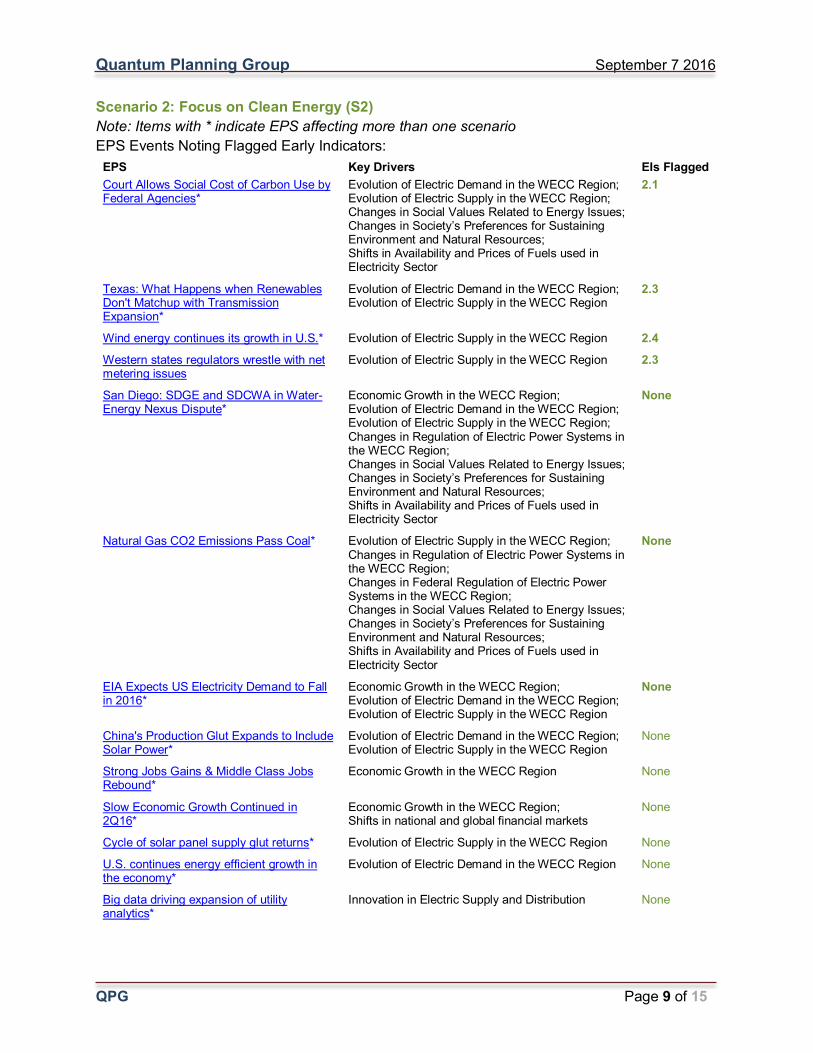
Scenario 2: Focus on Clean Energy (S2) Note: Items with * indicate EPS affecting more than one scenario EPS Events Noting Flagged Early Indicators:
EPS Key Drivers EIs Flagged Court Allows Social Cost of Carbon Use by Federal Agencies*
Evolution of Electric Demand in the WECC Region; Evolution of Electric Supply in the WECC Region; Changes in Social Values Related to Energy Issues; Changes in Society’s Preferences for Sustaining Environment and Natural Resources; Shifts in Availability and Prices of Fuels used in Electricity Sector
2.1
Texas: What Happens when Renewables Don't Matchup with Transmission Expansion*
Evolution of Electric Demand in the WECC Region; Evolution of Electric Supply in the WECC Region
2.3
Wind energy continues its growth in U.S.* Evolution of Electric Supply in the WECC Region 2.4 Western states regulators wrestle with net metering issues
Evolution of Electric Supply in the WECC Region 2.3
San Diego: SDGE and SDCWA in Water-Energy Nexus Dispute*
Economic Growth in the WECC Region; Evolution of Electric Demand in the WECC Region; Evolution of Electric Supply in the WECC Region; Changes in Regulation of Electric Power Systems in the WECC Region; Changes in Social Values Related to Energy Issues; Changes in Society’s Preferences for Sustaining Environment and Natural Resources; Shifts in Availability and Prices of Fuels used in Electricity Sector
None
Natural Gas CO2 Emissions Pass Coal* Evolution of Electric Supply in the WECC Region; Changes in Regulation of Electric Power Systems in the WECC Region; Changes in Federal Regulation of Electric Power Systems in the WECC Region; Changes in Social Values Related to Energy Issues; Changes in Society’s Preferences for Sustaining Environment and Natural Resources; Shifts in Availability and Prices of Fuels used in Electricity Sector
None
EIA Expects US Electricity Demand to Fall in 2016*
Economic Growth in the WECC Region; Evolution of Electric Demand in the WECC Region; Evolution of Electric Supply in the WECC Region
None
China's Production Glut Expands to Include Solar Power*
Evolution of Electric Demand in the WECC Region; Evolution of Electric Supply in the WECC Region
None
Strong Jobs Gains & Middle Class Jobs Rebound*
Economic Growth in the WECC Region None
Slow Economic Growth Continued in 2Q16*
Economic Growth in the WECC Region; Shifts in national and global financial markets
None
Cycle of solar panel supply glut returns* Evolution of Electric Supply in the WECC Region None
U.S. continues energy efficient growth in the economy*
Evolution of Electric Demand in the WECC Region None
Big data driving expansion of utility analytics*
Innovation in Electric Supply and Distribution None
Quantum Planning Group September 7 2016
QPG Page 10 of 15
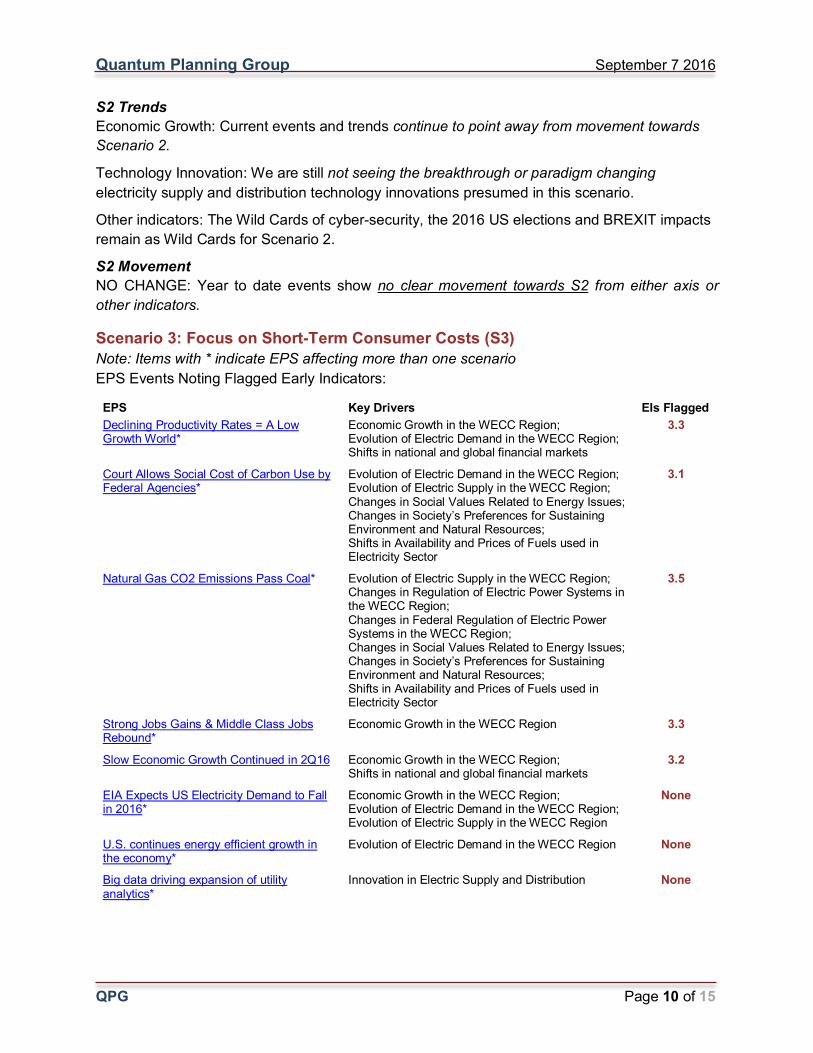
S2 Trends Economic Growth: Current events and trends continue to point away from movement towards Scenario 2.
Technology Innovation: We are still not seeing the breakthrough or paradigm changing electricity supply and distribution technology innovations presumed in this scenario.
Other indicators: The Wild Cards of cyber-security, the 2016 US elections and BREXIT impacts remain as Wild Cards for Scenario 2.
S2 Movement NO CHANGE: Year to date events show no clear movement towards S2 from either axis or other indicators.
Scenario 3: Focus on Short-Term Consumer Costs (S3) Note: Items with * indicate EPS affecting more than one scenario EPS Events Noting Flagged Early Indicators:
EPS Key Drivers EIs Flagged Declining Productivity Rates = A Low Growth World*
Economic Growth in the WECC Region; Evolution of Electric Demand in the WECC Region; Shifts in national and global financial markets
3.3
Court Allows Social Cost of Carbon Use by Federal Agencies*
Evolution of Electric Demand in the WECC Region; Evolution of Electric Supply in the WECC Region; Changes in Social Values Related to Energy Issues; Changes in Society’s Preferences for Sustaining Environment and Natural Resources; Shifts in Availability and Prices of Fuels used in Electricity Sector
3.1
Natural Gas CO2 Emissions Pass Coal* Evolution of Electric Supply in the WECC Region; Changes in Regulation of Electric Power Systems in the WECC Region; Changes in Federal Regulation of Electric Power Systems in the WECC Region; Changes in Social Values Related to Energy Issues; Changes in Society’s Preferences for Sustaining Environment and Natural Resources; Shifts in Availability and Prices of Fuels used in Electricity Sector
3.5
Strong Jobs Gains & Middle Class Jobs Rebound*
Economic Growth in the WECC Region 3.3
Slow Economic Growth Continued in 2Q16
Economic Growth in the WECC Region; Shifts in national and global financial markets
3.2
EIA Expects US Electricity Demand to Fall in 2016*
Economic Growth in the WECC Region; Evolution of Electric Demand in the WECC Region; Evolution of Electric Supply in the WECC Region
None
U.S. continues energy efficient growth in the economy*
Evolution of Electric Demand in the WECC Region None
Big data driving expansion of utility analytics*
Innovation in Electric Supply and Distribution None
Quantum Planning Group September 7 2016
QPG Page 11 of 15
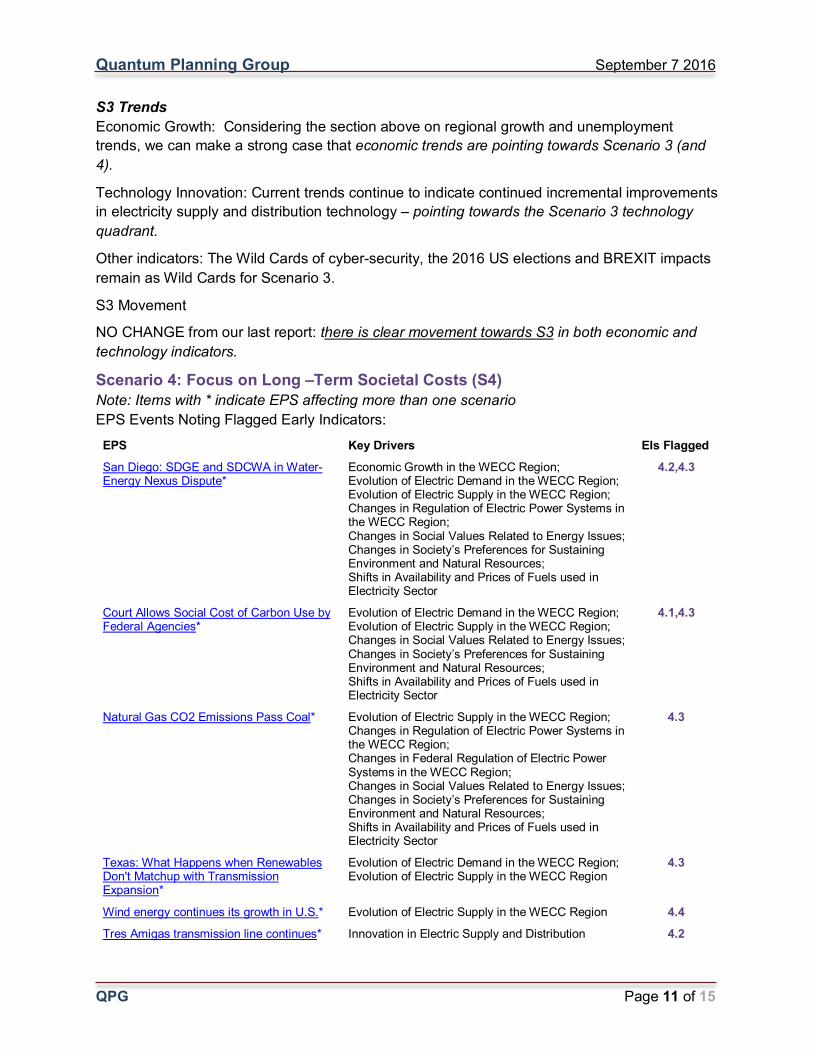
S3 Trends Economic Growth: Considering the section above on regional growth and unemployment trends, we can make a strong case that economic trends are pointing towards Scenario 3 (and 4).
Technology Innovation: Current trends continue to indicate continued incremental improvements in electricity supply and distribution technology – pointing towards the Scenario 3 technology quadrant.
Other indicators: The Wild Cards of cyber-security, the 2016 US elections and BREXIT impacts remain as Wild Cards for Scenario 3.
S3 Movement
NO CHANGE from our last report: there is clear movement towards S3 in both economic and technology indicators.
Scenario 4: Focus on Long –Term Societal Costs (S4) Note: Items with * indicate EPS affecting more than one scenario EPS Events Noting Flagged Early Indicators:
EPS Key Drivers EIs Flagged San Diego: SDGE and SDCWA in Water-Energy Nexus Dispute*
Economic Growth in the WECC Region; Evolution of Electric Demand in the WECC Region; Evolution of Electric Supply in the WECC Region; Changes in Regulation of Electric Power Systems in the WECC Region; Changes in Social Values Related to Energy Issues; Changes in Society’s Preferences for Sustaining Environment and Natural Resources; Shifts in Availability and Prices of Fuels used in Electricity Sector
4.2,4.3
Court Allows Social Cost of Carbon Use by Federal Agencies*
Evolution of Electric Demand in the WECC Region; Evolution of Electric Supply in the WECC Region; Changes in Social Values Related to Energy Issues; Changes in Society’s Preferences for Sustaining Environment and Natural Resources; Shifts in Availability and Prices of Fuels used in Electricity Sector
4.1,4.3
Natural Gas CO2 Emissions Pass Coal* Evolution of Electric Supply in the WECC Region; Changes in Regulation of Electric Power Systems in the WECC Region; Changes in Federal Regulation of Electric Power Systems in the WECC Region; Changes in Social Values Related to Energy Issues; Changes in Society’s Preferences for Sustaining Environment and Natural Resources; Shifts in Availability and Prices of Fuels used in Electricity Sector
4.3
Texas: What Happens when Renewables Don't Matchup with Transmission Expansion*
Evolution of Electric Demand in the WECC Region; Evolution of Electric Supply in the WECC Region
4.3
Wind energy continues its growth in U.S.* Evolution of Electric Supply in the WECC Region 4.4 Tres Amigas transmission line continues* Innovation in Electric Supply and Distribution 4.2
Quantum Planning Group September 7 2016
QPG Page 12 of 15
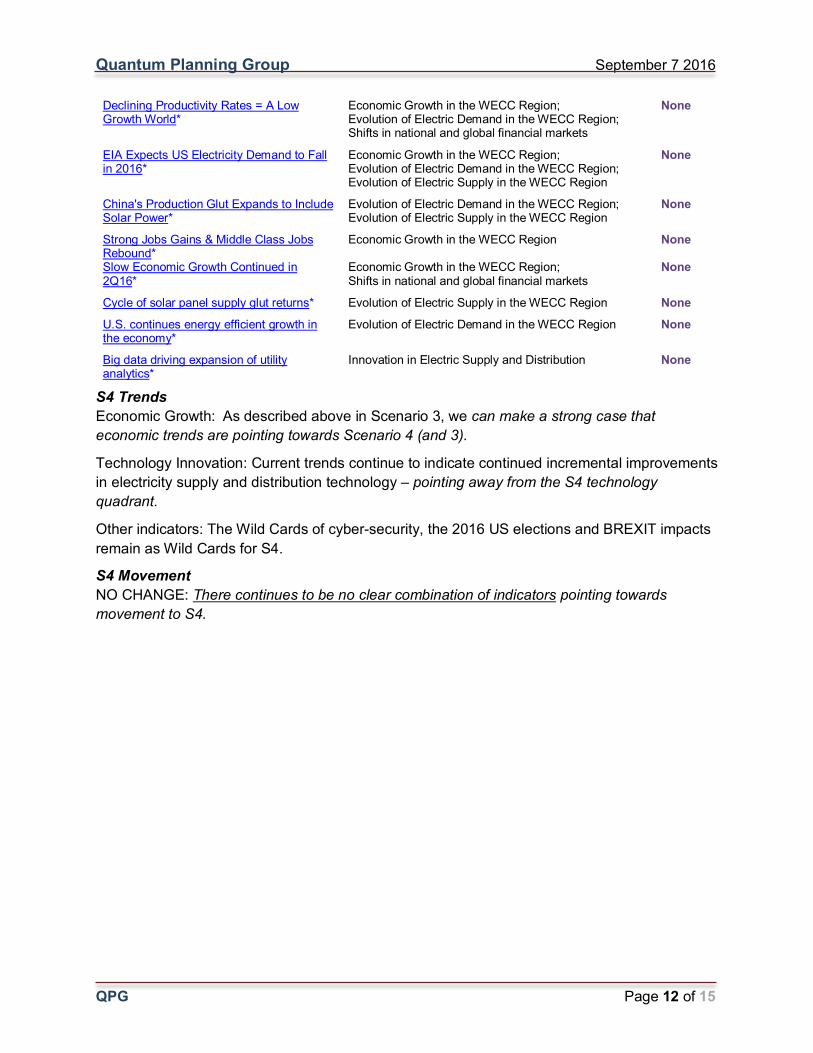
Declining Productivity Rates = A Low Growth World*
Economic Growth in the WECC Region; Evolution of Electric Demand in the WECC Region; Shifts in national and global financial markets
None
EIA Expects US Electricity Demand to Fall in 2016*
Economic Growth in the WECC Region; Evolution of Electric Demand in the WECC Region; Evolution of Electric Supply in the WECC Region
None
China's Production Glut Expands to Include Solar Power*
Evolution of Electric Demand in the WECC Region; Evolution of Electric Supply in the WECC Region
None
Strong Jobs Gains & Middle Class Jobs Rebound*
Economic Growth in the WECC Region None
Slow Economic Growth Continued in 2Q16*
Economic Growth in the WECC Region; Shifts in national and global financial markets
None
Cycle of solar panel supply glut returns* Evolution of Electric Supply in the WECC Region None U.S. continues energy efficient growth in the economy*
Evolution of Electric Demand in the WECC Region None
Big data driving expansion of utility analytics*
Innovation in Electric Supply and Distribution None
S4 Trends Economic Growth: As described above in Scenario 3, we can make a strong case that economic trends are pointing towards Scenario 4 (and 3).
Technology Innovation: Current trends continue to indicate continued incremental improvements in electricity supply and distribution technology – pointing away from the S4 technology quadrant.
Other indicators: The Wild Cards of cyber-security, the 2016 US elections and BREXIT impacts remain as Wild Cards for S4.
S4 Movement NO CHANGE: There continues to be no clear combination of indicators pointing towards movement to S4.
Quantum Planning Group September 7 2016
QPG Page 13 of 15
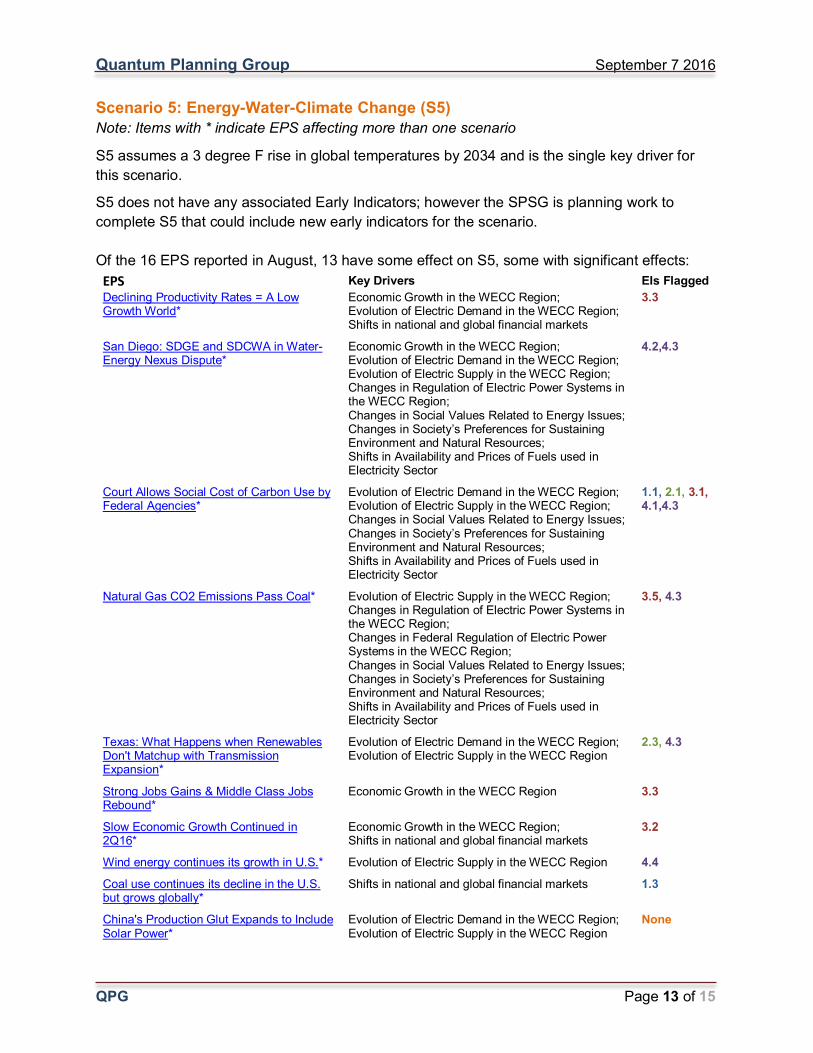
Scenario 5: Energy-Water-Climate Change (S5) Note: Items with * indicate EPS affecting more than one scenario
S5 assumes a 3 degree F rise in global temperatures by 2034 and is the single key driver for this scenario.
S5 does not have any associated Early Indicators; however the SPSG is planning work to complete S5 that could include new early indicators for the scenario. Of the 16 EPS reported in August, 13 have some effect on S5, some with significant effects:
EPS Key Drivers EIs Flagged Declining Productivity Rates = A Low Growth World*
Economic Growth in the WECC Region; Evolution of Electric Demand in the WECC Region; Shifts in national and global financial markets
3.3
San Diego: SDGE and SDCWA in Water-Energy Nexus Dispute*
Economic Growth in the WECC Region; Evolution of Electric Demand in the WECC Region; Evolution of Electric Supply in the WECC Region; Changes in Regulation of Electric Power Systems in the WECC Region; Changes in Social Values Related to Energy Issues; Changes in Society’s Preferences for Sustaining Environment and Natural Resources; Shifts in Availability and Prices of Fuels used in Electricity Sector
4.2,4.3
Court Allows Social Cost of Carbon Use by Federal Agencies*
Evolution of Electric Demand in the WECC Region; Evolution of Electric Supply in the WECC Region; Changes in Social Values Related to Energy Issues; Changes in Society’s Preferences for Sustaining Environment and Natural Resources; Shifts in Availability and Prices of Fuels used in Electricity Sector
1.1, 2.1, 3.1, 4.1,4.3
Natural Gas CO2 Emissions Pass Coal* Evolution of Electric Supply in the WECC Region; Changes in Regulation of Electric Power Systems in the WECC Region; Changes in Federal Regulation of Electric Power Systems in the WECC Region; Changes in Social Values Related to Energy Issues; Changes in Society’s Preferences for Sustaining Environment and Natural Resources; Shifts in Availability and Prices of Fuels used in Electricity Sector
3.5, 4.3
Texas: What Happens when Renewables Don't Matchup with Transmission Expansion*
Evolution of Electric Demand in the WECC Region; Evolution of Electric Supply in the WECC Region
2.3, 4.3
Strong Jobs Gains & Middle Class Jobs Rebound*
Economic Growth in the WECC Region 3.3
Slow Economic Growth Continued in 2Q16*
Economic Growth in the WECC Region; Shifts in national and global financial markets
3.2
Wind energy continues its growth in U.S.* Evolution of Electric Supply in the WECC Region 4.4
Coal use continues its decline in the U.S. but grows globally*
Shifts in national and global financial markets 1.3
China's Production Glut Expands to Include Solar Power*
Evolution of Electric Demand in the WECC Region; Evolution of Electric Supply in the WECC Region
None
Quantum Planning Group September 7 2016
QPG Page 14 of 15
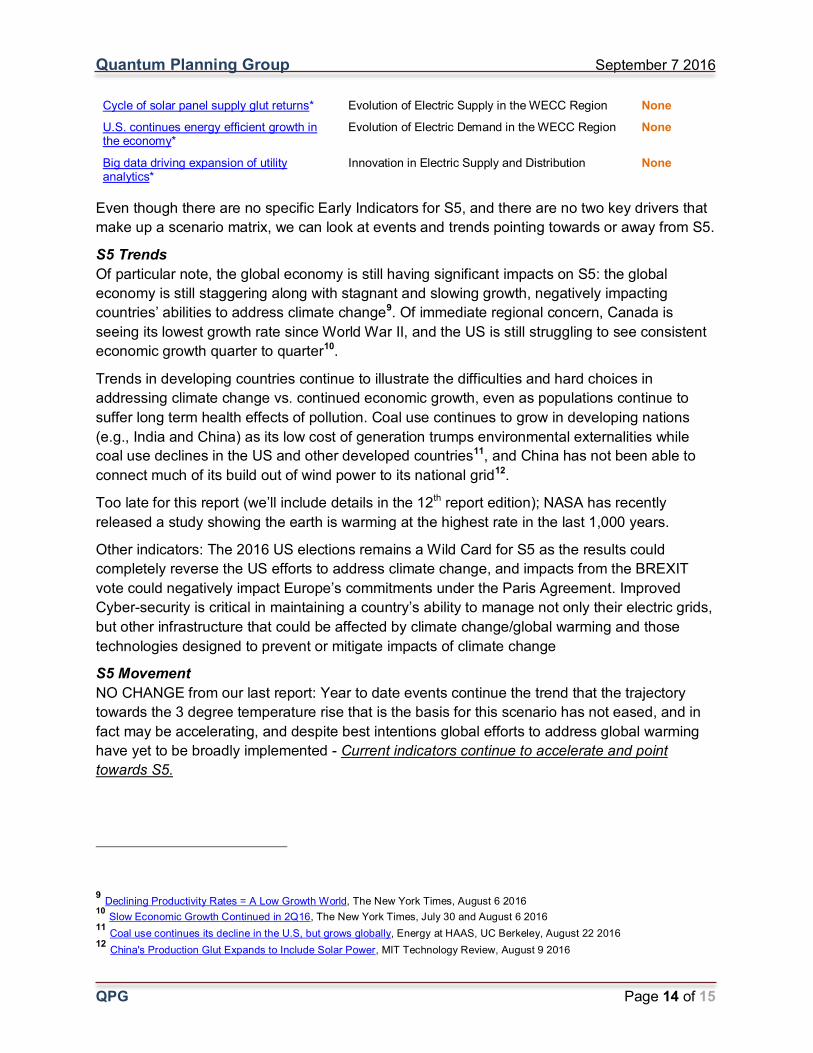
Cycle of solar panel supply glut returns* Evolution of Electric Supply in the WECC Region None U.S. continues energy efficient growth in the economy*
Evolution of Electric Demand in the WECC Region None
Big data driving expansion of utility analytics*
Innovation in Electric Supply and Distribution None
Even though there are no specific Early Indicators for S5, and there are no two key drivers that make up a scenario matrix, we can look at events and trends pointing towards or away from S5.
S5 Trends Of particular note, the global economy is still having significant impacts on S5: the global economy is still staggering along with stagnant and slowing growth, negatively impacting countries’ abilities to address climate change9. Of immediate regional concern, Canada is seeing its lowest growth rate since World War II, and the US is still struggling to see consistent economic growth quarter to quarter10.
Trends in developing countries continue to illustrate the difficulties and hard choices in addressing climate change vs. continued economic growth, even as populations continue to suffer long term health effects of pollution. Coal use continues to grow in developing nations (e.g., India and China) as its low cost of generation trumps environmental externalities while coal use declines in the US and other developed countries11, and China has not been able to connect much of its build out of wind power to its national grid12.
Too late for this report (we’ll include details in the 12th report edition); NASA has recently released a study showing the earth is warming at the highest rate in the last 1,000 years.
Other indicators: The 2016 US elections remains a Wild Card for S5 as the results could completely reverse the US efforts to address climate change, and impacts from the BREXIT vote could negatively impact Europe’s commitments under the Paris Agreement. Improved Cyber-security is critical in maintaining a country’s ability to manage not only their electric grids, but other infrastructure that could be affected by climate change/global warming and those technologies designed to prevent or mitigate impacts of climate change
S5 Movement NO CHANGE from our last report: Year to date events continue the trend that the trajectory towards the 3 degree temperature rise that is the basis for this scenario has not eased, and in fact may be accelerating, and despite best intentions global efforts to address global warming have yet to be broadly implemented - Current indicators continue to accelerate and point towards S5.
9 Declining Productivity Rates = A Low Growth World, The New York Times, August 6 2016 10 Slow Economic Growth Continued in 2Q16, The New York Times, July 30 and August 6 2016 11 Coal use continues its decline in the U.S, but grows globally, Energy at HAAS, UC Berkeley, August 22 2016 12 China's Production Glut Expands to Include Solar Power, MIT Technology Review, August 9 2016
Quantum Planning Group September 7 2016
QPG Page 15 of 15
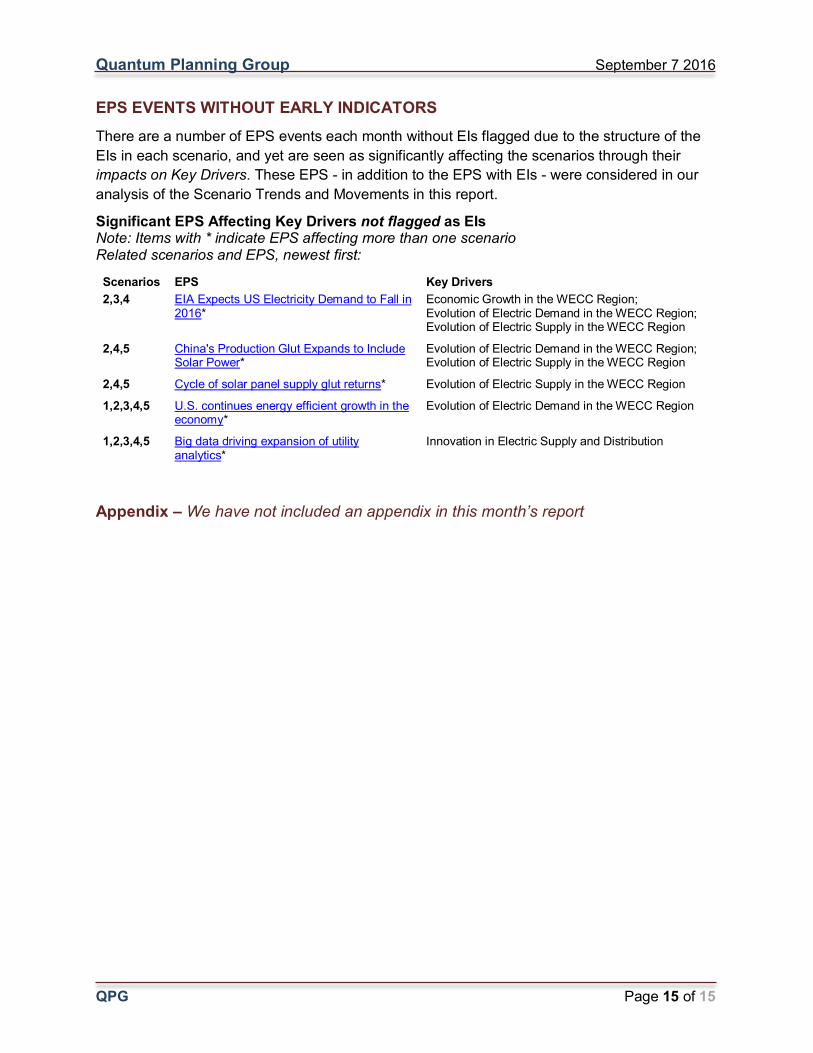
EPS EVENTS WITHOUT EARLY INDICATORS There are a number of EPS events each month without EIs flagged due to the structure of the EIs in each scenario, and yet are seen as significantly affecting the scenarios through their impacts on Key Drivers. These EPS - in addition to the EPS with EIs - were considered in our analysis of the Scenario Trends and Movements in this report.
Significant EPS Affecting Key Drivers not flagged as EIs Note: Items with * indicate EPS affecting more than one scenario Related scenarios and EPS, newest first:
Scenarios EPS Key Drivers 2,3,4 EIA Expects US Electricity Demand to Fall in
2016* Economic Growth in the WECC Region; Evolution of Electric Demand in the WECC Region; Evolution of Electric Supply in the WECC Region
2,4,5 China's Production Glut Expands to Include Solar Power*
Evolution of Electric Demand in the WECC Region; Evolution of Electric Supply in the WECC Region
2,4,5 Cycle of solar panel supply glut returns* Evolution of Electric Supply in the WECC Region
1,2,3,4,5 U.S. continues energy efficient growth in the economy*
Evolution of Electric Demand in the WECC Region
1,2,3,4,5 Big data driving expansion of utility analytics*
Innovation in Electric Supply and Distribution
Appendix – We have not included an appendix in this month’s report


