Download - WAVE IMPACT PRESSURES ON STEPPED REVETMENTS

Proceedings of the 7th International Conference on the
Application of Physical Modelling in Coastal and Port
Engineering and Science (Coastlab18)
Santander, Spain, May 22-26, 2018
1
WAVE IMPACT PRESSURES ON STEPPED REVETMENTS
NILS B. KERPEN1, TALIA SCHOONEES2, TORSTEN SCHLURMANN3
1 Leibniz University Hannover, Ludwig-Franzius-Institute, Germany, [email protected]
2 Leibniz University Hannover, Ludwig-Franzius-Institute, Germany, [email protected]
3 Leibniz University Hannover, Ludwig-Franzius-Institute, Germany, [email protected]
ABSTRACT
The wave impact on horizontal and vertical step faces of stepped revetments is analyzed by means of hydraulic
model tests conducted with wave spectra in a wave flume. Wave impacts on revetments with relative step heights of
0.3 < Hm0/Sh < 3.5 and a constant slope of 1:2 are analyzed with respect to 1) the probability distribution of the impacts,
2) the time evolution of impacts including a classification of load cases and 3) a special distribution of the positon of the
maximum impact. The validity of the approved log-normal probability distribution for the largest wave impacts is
experimentally verified for stepped revetments. The wave impact properties for stepped revetments are compared with
those of vertical seawalls. The impact rising times for both structure types are within the same range. The impact duration
for stepped revetments is shorter and decreases with increasing step height. Maximum horizontal wave impact loads are
about two times larger than the corresponding maximum vertical wave impact loads. Horizontal and vertical impact loads
increase with a decreasing step height. Data are compared with findings from literature for stepped revetments and vertical
walls. A prediction formula is provided to calculate the maximum horizontal wave impact at stepped revetments along
its vertical axis.
KEYWORDS: Stepped revetment, wave impact, surface roughness, physical model test.
1 INTRODUCTION
The increasing population living in coastal areas poses new demands in terms of the environmental and touristic
compatibility of coastal protection structures. As aesthetically pleasing coastal protection structures gain increasing
importance, accessible revetments, e.g. stepped revetments have become more attractive. In addition the stepped surface
of a stepped revetment induces additional turbulence in the flow which leads to increased energy dissipation.
Consequently, wave energy available as kinetic energy for the wave run-up process is reduced. But presently, practical
design guidance is limited for stepped revetments. A comprehensive overview of existing research focusing on the general
wave-interaction with stepped revetments is presented in Kerpen & Schlurmann (2016). Kerpen & Schlurmann (2018)
highlight the reduction capabilities of stepped revetments on the wave run-up and wave overtopping. So far wave impacts
on stepped revetments have not been analyzed systematically and are discussed in this study.
1.1 Wave impacts on stepped structures
Knowledge of loads on a coastal protection system is important to determine its final design. Hydraulic loads can be
classified as either hydrostatic or hydrodynamic. Only the hydrodynamic load cases are addressed in this paper.
Dynamic impact loads occur as wave’s impact on a structure. The progress of a single wave impact is dependent on
the hydraulic- and geometry-related boundary conditions (described in this section). A stepped revetment has horizontally
and vertically aligned faces relative to gravity. The loads on these two faces are different due to the asymmetric orbital
velocities in shallow waters and the asymmetric geometry of a wave (wave height H ≪ wave length L). Furthermore, the
effect of wave loads is dependent on the overall slope (n) of a structure. One extreme case is a plain vertical wall without
horizontal planes where breaking waves are slamming undamped against the wall. The other extreme case is a very gentle
slope (nearly horizontal) where plunging and spilling breakers appear (dependent on the Iribarren number
ξ = tanα/√𝐻/𝐿). In this case the load is often damped by previous waves. On a structure with horizontal and vertical
faces, waves can be redirected upwards and form an up-rushing jet of water. This jet of water will fall downwards and in
turn induces impact loads on the horizontal faces. It is evident that the impact loads on a horizontally aligned face is
smaller than on a vertical face.
The recent literature provides only three sources dealing with wave impacts on stepped revetments. According to
SPM (1984) the forces on stepped structures should be calculated for design purposes with the same method as for vertical
walls since the dynamic pressures is about the same. Heimbaugh (1988) conducted hydraulic model tests with irregular
waves for a stepped seawall in a 76 m long wave flume (Froude scale 1:19). These tests focussed on measuring the
reduction of wave overtopping and the wave-induced impacts on stepped seawalls. Two sloping structures (n = 1.5, n = 2)
with step heights of Sh = 0.026 m were analyzed. A recurve seawall was incorporated at the crest of both sloping

2
structures. Heimbaugh (1988) analyzed the wave loads on stepped structures for Iribarren numbers of 2.8 < ξ < 6.3 and
step ratios in a range of 2.0 < Hms/Sh < 3.9 with Hms as mean spectral wave height. Heimbaugh (1988) highlights the
importance of the short duration shock pressures (impacts) resulting from the rapid compression of an air pocket trapped
between the face of a breaking wave and the wall. For vertical walls ’the shock pressure exerted by a breaking wave is
due to the violent simultaneous retardation of a certain limited mass of water which is brought to rest by the action of a
thin cushion of air, which in the process becomes compressed by the advancing wave front’ (Bagnold, 1939). The position
of the highest measured impacts was dependent on the initial still water level SWL. According to the analysis of impact
distributions, the maximum impacts at different wall elevations rarely occur simultaneously. This statement is especially
true in the case of a non-vertical wall, such as the stepped wall studied here, since some wave energy is dissipated through
turbulence. In some cases a negative impact duration was measured which is interpreted as a characteristic of turbulence
and air entrainment occurring at the base of each seawall step. Finally, Heimbaugh (1988) summarizes a discussion about
the importance of shock pressures for the actual design of a stepped seawall. According to the discussion, pressures of
such short duration should not be used for establishing the design load case. It is recommended to rather consider the
smaller surge pressures with a longer duration to determine the critical dynamic load.
Melby et al. (2009) conducted hydraulic model tests in a Froude scale of 1:20 for stepped revetments (Sh = 0.015 m).
The focus of the tests were on wave run-up and wave overtopping. The vertical wave impact was measured on a single
step. The sampling rate was only 100 Hz which is very low for measuring impact pressures. The provided data represent
averaged maximum impact pressures Pmax of six repetitions (with a standard deviation of STD ~ 0.1 Pmax).
Both studies lack a comprehensive discussion on the measured pressure impact events with corresponding wave
conditions. Hence, the systematic analysis of the wave impacts on stepped revetments conducted in the present study
includes a comparison with the data provided by Heimbaugh (1988) and Melby et al. (2009).
2 EXPERIMENTAL SET-UP, TEST CONDITIONS AND PROCEDURES
Hydraulic model tests focusing on the wave interaction with stepped revetments are conducted in a wave flume
which has a length of 110 m, a width of 2.2 m and an overall depth of 2.0 m. For these tests wave spectra are calculated
with 2nd order wave routines. The waves are generated with a piston-type wave maker. Two model set-ups, constructed
from plywood, with varying step heights (large steps: Sh = 0.3m, small steps: Sh = 0.05 m) are placed over a horizontal
flume bottom at a distance of 81.6 m from the wave paddle (Figure 1).
The surface elevation is measured by five ultrasonic sensors. The sensors show a measuring range of 200 to
1200 mm, a superior resolution of 0.36 mm and a sampling rate fsample. = 50 Hz. Three sensors are positioned at a distance
larger than two wave lengths L from the toe of the revetment. These sensors are used to conduct a reflection analysis and
calculate the incident wave conditions. One sensor is placed at the toe of the stepped revetment and another in the shallow
water region of the still water level. Pressure impacts on the stepped revetment are recorded by seven pressure transducers
(fsample. = 2.4 kHz for vertically orientated sensors and fsample. = 19.2 kHz for horizontally orientated sensors) which are
placed along the horizontally and vertically orientated step faces (Figure 1). An impression of the set-ups is given in
Figure 2 for the analyzed step heights of 0.05 m (a) and 0.3 m (b). In order to capture a profile of wave induced loads on
an 1:2 inclined stepped revetment, sensor locations are varied in relative water depths – 6.0 < z/Hm0 < 2.0 relative to the
still water level. The pressure sensors (ATM.1ST/N fabricated by sts-sensors) have a range from 0 to 150 mbar and a
non-conformity of ± 0.1 % from full scale. The sensors are connected by a serial interface connection (RS232) to the data
acquisition and provide an output signal from 0 to 10 V. The configuration of the probes allows a local (over a single
step) and a more global interpretation (for the whole revetment).
Figure 1. Model set-up of pressure sensors and position of the SWL for two 1:2 inclined stepped
revetments with step height of Sh = 0.3 m and 0.05 m.

3
Figure 2. Impression of the model set-up with instrumentation for a) step height 0.05 m and b) step
height 0.3 m.
The hydraulic boundary conditions of the wave impact experiments are listed in Table 1. The parameter choice
covers a wide range of dimensionless variables with wave steepness of 0.015 < Hm0/Lp < 0.04 (with Hm0: spectral wave
height, Lp: wave length calculated from the peak period Tp) and Iribarren numbers of 2.5 < ξ < 4.9. Three different water
levels hs with intermediate water depth (0.05 < Hm0/hs < 0.18) are tested. Additionally, the corresponding freeboard height
Rc and the number of waves NW in each test are given. A total of 13 tests are conducted for steps with a height of
Sh = 0.05 m (1.1 < Hm0/Sh < 2.8) and 10 tests with a step height of Sh = 0.3 m (0.2 < Hm0/Sh < 0.6).
Raw data from the pressure sensors are offset-corrected by means of the first five seconds of the data. The time and
amplitude of the peaks are calculated for minimum peak heights of 10 mbar and a minimum distance between two peaks
of 0.8 times the wave period Tp.
Table 1. Hydraulic boundary conditions for the wave impact tests.
Test Sh Rc Hm0 Tp hs NW ξ Hm0/Lp Hm0/hs Hm0/Sh
# [m] [m] [m] [s] [m] [-] [-] [-] [-] [-]
101 0.05 0.121 0.056 1.43 1.100 1298 3.7 0.018 0.051 1.12
102 0.063 1.20 1.100 427 3.0 0.028 0.057 1.26
103 0.084 1.38 1.100 1261 2.9 0.029 0.076 1.68
104 0.082 1.38 1.100 1256 3.0 0.028 0.074 1.63
105 0.082 1.38 1.100 1261 3.0 0.028 0.075 1.64
106 0.084 1.37 1.100 167 2.9 0.029 0.076 1.67
107 0.088 2.11 1.100 1422 4.2 0.015 0.080 1.76
108 0.114 2.20 1.100 171 3.8 0.019 0.104 2.28
109 0.119 2.81 1.100 179 4.6 0.016 0.108 2.38
110 0.143 2.26 1.100 162 3.5 0.023 0.130 2.86
111 0.211 0.085 2.09 1.010 1410 4.2 0.016 0.084 1.71
112 0.085 2.07 1.010 1434 4.1 0.016 0.084 1.70
113 0.085 2.08 1.010 1371 4.1 0.016 0.084 1.70
201 0.30 0.121 0.111 1.37 1.100 1413 2.6 0.038 0.101 0.37
202 0.129 3.18 1.100 307 4.9 0.016 0.117 0.43
203 0.116 1.38 1.100 1428 2.5 0.040 0.106 0.39
204 0.167 2.08 1.100 278 3.0 0.030 0.151 0.56
205 0.211 0.064 1.36 1.010 1586 3.3 0.023 0.064 0.21
206 0.091 1.34 1.010 1390 2.8 0.033 0.090 0.30
207 0.166 2.01 1.010 1515 2.9 0.032 0.164 0.55
208 0.300 0.064 1.41 0.921 1339 3.4 0.021 0.069 0.21
209 0.089 1.38 0.921 1294 2.8 0.031 0.097 0.30
210 0.170 2.11 0.921 1468 2.9 0.032 0.184 0.57
1 Pressure sensors 2 Run-up gauge 3 ADV 4 Crest level
1
2
4
3
0.7 m
a)
1
b)
2
4
0.3 m
0.05 m
P1
P2
P3
P1
P2
P3
P6, P7

4
Every single wave in a wave spectrum causes an individual impact on the structure. The magnitude of the impact
depends on its individual wave kinematics and the influence of the previous wave (remaining water layer over a pressure
sensor and amount of aeration in the wave). The analysis of wave loads includes a number of parameters such as the
maximum impact pressure Pmax or a mean pressure Pm. The maximum induced impact Pmax is very important for the
design of a structure. But, a comparison between single tests is less convincing since the maximum values scatter
significantly from test to test. Therefore, the pressures will rather be described with a probability of exceedance (e.g. 2 %
of all incident waves reveals the probability of exceedance impact pressure P98%). This approach is more representative.
In order to compare the measured data to data from previous investigations (e.g. Cuomo et al., 2010), the impact values
exceeded by the four highest waves out of a 1,000-wave test should be calculated. Hence, P99.6% is calculated. The impact
with a certain probability of exceedance is calculated finally by a descend sorting of all recorded impact peaks within a
single test run. Then the mean of a certain number of events is averaged.
3 RESULTS
The analysis of the recorded data for stepped revetments focuses on 1) the probability distribution of impact
pressures, 2) the time evolution and load cases of impact pressures and 3) the spatial distribution of impact pressures.
Recent literature on wave impacts on impermeable slopes, stepped revetments and vertical seawalls is presented to
complement the findings of this research and ensure a comprehensive analysis of processes.
3.1 Probability distribution of impact pressures
According to Führböter (1966) and Weggel (1971) the probability distributions of wave impact pressures can be
described in agreement with theory as log-normal functions. Additionally, they found that these log-normal functions are
the same in model scale and prototype.
Hence, Figure 3 gives the log-normal probability distribution over the maximum impact pressure for two exemplary
tests (test number 103 and 209 according to Table 1). The tests were conducted with a spectral wave height of
Hm0 = 0.08 m and a corresponding Iribarren number of ξ = 3.0. Figure 3 a) provides measurements of wave impacts on
slopes with a small step height (Hm0/Sh = 1.7). A total of 876 individual wave impacts have been recorded with pressure
sensor P2 with a maximum recorded pressure impact of Pmax = 1.25 kPa. The wave impacts are presented with a certain
probability of exceedance. The figure presents an idealized normal-distribution, shown as a dashed line, as reference. As
is evident from the presented figure, the wave impacts on this stepped revetment follow a log-normal distribution. Slight
deviations appear for impacts larger P95% and smaller P10%.
Figure 3 b) presents the log-normal distribution of wave impact pressures on a revetment with large steps
(Hm0/Sh = 1.7) for the same hydraulic boundary conditions as in Figure 3 a). The maximum pressure impact Pmax from
1,114 individual impacts is 1.68 kPa which is about 35 % larger when compared to the small steps. As for Figure 3 c)
slight deviations from the ideal log-normal distribution are detected for impacts smaller P10%. But, impacts larger than
P90% deviate significantly from this trend. These deviations indicate that the influence of the wave-interaction with large
steps differs for high and low impact scenarios.
Figure 3. Log-normal probability distributions of the maximum impact pressures for a) small step
heights (test 103, pressure sensor P1, Hm0/Sh = 1.7) and b) large step heights (test 209, pressure sensor
P2, Hm0/Sh = 0.3). c) gives a detail of the log-normal probability distribution of the 18 largest impacts in
test 209.

5
The geometry of a wave front has a significant influence on its resulting wave impact. Generally the wave height
plays a dominant role. It is observed, that small wave heights in the spectrum lead to pulsating loads whereas the largest
waves lead to impacting loads. Hull et al. (1998) indicated that for vertical walls impacts smaller than 0.4Pmax are based
on pulsating loads and larger impacts on impacting loads. Führböter (1986) found that often only a part of all impacts
show a good agreement with the log-normal distribution. In contrast, when considering only the highest impacts during
one wave impact event a better agreement can be obtained. Hence, Figure 3 c) gives a detail of the log-normal probability
distribution of the 18 largest impacts (impacts > P98%) of test 209 and confirms Führböter’s findings to be also valid for
stepped revetments.
3.2 Time evolution and load cases of impact pressures
The time evolution of wave impact pressures on vertical structures was initially categorized by Oumeraci et al.
(1993) and analyzed in depth by Kortenhaus et al. (1998). According to Kortenhaus et al. (1998), impacting loads on
vertical structures are defined as impact peaks that are minimum 2.5 times larger than the subsequent quasi-static peak
Pq. Slightly breaking waves induces peaks in a range of 1.0 < Pmax/Pq < 2.5. Pulsating impacts due to standing waves
occur when the impact peak and its subsequent quasi-static peak Pq has the same value. Figure 4 gives a parameter
definition describing a pressure impact event (a) and an exemplary time series of the maximum impact event during test
204 for pressure sensors P1, P2 and P3 (b). A typical time evolution with an impact and subsequent quasi-static peak is
observed. The highest impact is recorded by sensor P2, which is located near thestill water level SWL. The oscillation of
the signal and negative pressures, as also observed by Heimbaugh (1988), are interpreted as a characteristic of turbulence
and air entrainment occurring at the base of each revetment step. With increasing distance to the SWL the impact amplitude
decreases (P1 and P3). Sensor P2 recorded an impacting load, P1 a peak induced by a slightly breaking wave and P3 a
pulsating impact.
Figure 5 presents the normalized time evolution of impact events with a certain probability of exceedance for a 1:2
stepped slope with large (test 103) and small step heights (test 209). These tests were conducted with a spectral height of
Hm0 = 0.08 m and a steepness of Hm0/Lm–1,0 = 0.03 in. Raw data (black line) are given to indicate the largest impact. A
filtered time series (red line, 6th order low pass filter with 38.4 Hz cut-off frequency) is superimposed in order to highlight
a clearer temporal progress. Subfigures (a – f) correspond to step ratios of Hm0/Sh = 1.7 (small steps) and subfigures (g – l)
to step ratios of Hm0/Sh = 0.3 (large steps). Each subfigure displays the measured impact event of a certain probability of
exceedance (Pmax to P10%) over the relative time. The time t is normalized by the wave period Tm–1,0. The time step t/T = 0
occurs at the time of maximum impact. Each peak impact (based on the raw data) is given proportionally to the maximum
measured peak Pmax of the entire test duration.
The maximum measured impact for the small steps (a) was 1.26 kPa which is about 30 % lower than the maximum
impact for large steps (g). For the large steps the maximum peak amplitude decays more rapidly with increasing
probability of exceedance than for the small steps. In the case with smaller steps, a peak amplitude of about 35 % of the
maximum impact Pmax is reached by 5 % of all impact events (P95%) (d), whereas in the case of the large steps (h) it is
only 0.4 % (P99.6%) of all impact events.
A comparison of the occurring load cases defined by Kortenhaus et al. (1999) elucidates that large steps (Hm0 < Sh)
behave similar to vertical walls (a clear initial impact followed by a quasi-static peak Pq). For small steps (Hm0 > Sh) the
impact peak is also clearly visibly, but the subsequent quasi-static peak Pq is not as prominent as for large steps or vertical
walls. These differences are caused due to different flow principles. At large steps, the water level in front of the step face
Figure 4. a) Parameter definition describing a pressure impact event, b) exemplary time series of the
maximum impact event during test 204 for pressure sensors P1, P2 and P3.
a) b)

6
is constantly rising after the initial impact. This water level rise induces the quasi-static load. At small steps a highly
aerated flow emerges after the initial impact. Moreover, the absolute depth under the wave crest for a smaller step is
evidently lower. This leads in general to smaller quasi-static peaks. For the specific case presented in Figure 5, impacting
loads are observed for 5% of all impacts at the small steps and 2% of all impacts at the large steps. The initial violent
impact dissipates more energy than a pulsating load induced by wave run-up. As a result, it can be deduced that the overall
energy dissipation at small step heights is larger.
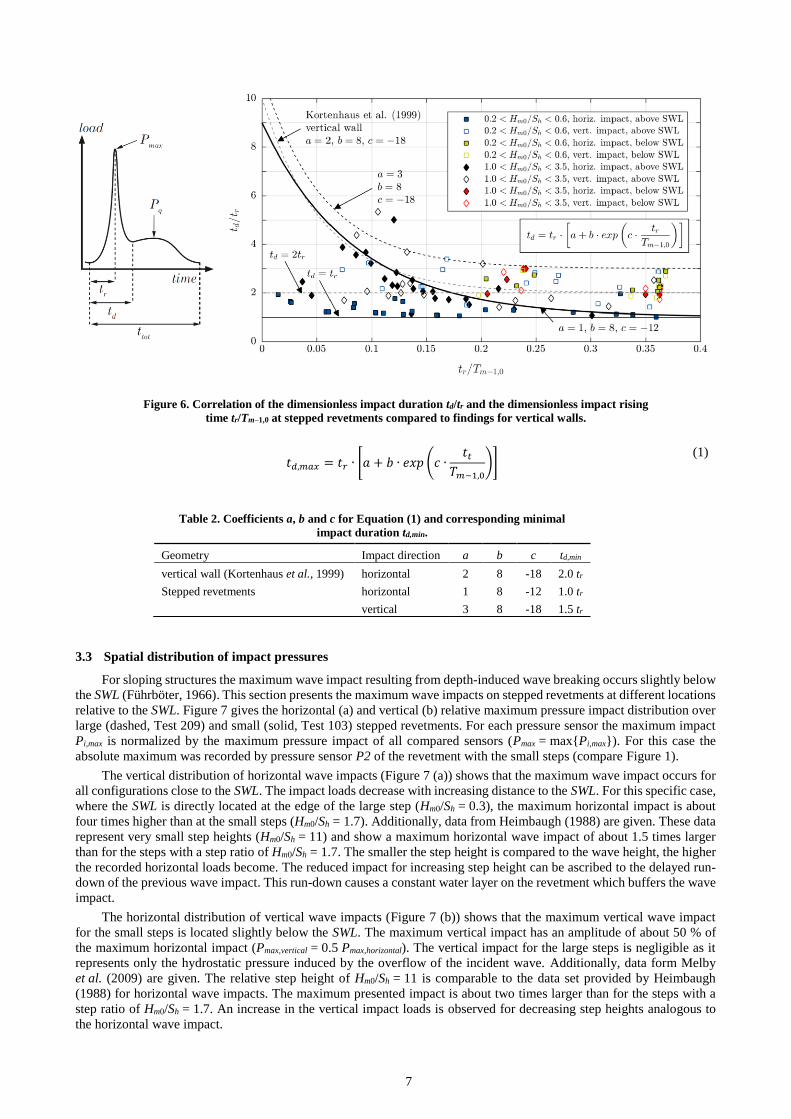
The characteristics of an impact pressure on stepped revetments can be described by the rising time tr and impact
pressure duration td as defined in Figure 6. The figure gives the correlation between the dimensionless impact duration
td/tr and the dimensionless impact rising time tr/Tm–1,0. The data are grouped in terms of the step ratios Hm0/Sh, the direction
of the measured wave impact (horizontal or vertical with respect to gravity) and the position of the impact (above or
below the still water level SWL). As reference, Figure 6 presents the empirical predictions for rising times and durations
of impacts at vertical walls (Kortenhaus et al., 1999). Impacting load cases (Pmax > 2.5 Pq) are characterized by a short
relative rising time (0.02 < tr/Tm–10 < 0.2) while pulsating loads are characterized by a longer peak duration (tr/Tm–10 > 0.2).
The dominance of a peak is characterized by the relative impact duration td/tr. The highest impact loads (e.g. Pmax or
P99.6%) correspond to short relative impact durations td/tr in combination with a short relative rising time tr/Tm–10. The
larger the relative impact duration td/tr the more critical the impact becomes in terms of causing damage or instability of
the revetment.
Impacts measured at stepped revetments below the SWL (green and red markers) show relative rising times of
tr/Tm–10 > 0.2. Horizontal impacts (filled marker) or vertical impacts (empty marker) have comparable impact rising times
and impact durations. Below the SWL, no impacting load case was detected for both small and large steps. The recorded
loads have a pure hydrostatic nature induced due to the water level changes over the pressure sensors. Real impacts are
buffered by a water layer protecting the steps from violent impacts. The stepped shape of the slope delays the run-down
leading to a permanent water cover of the revetment below the SWL.
The relative impact rising time of horizontal impacts above the SWL (filled blue squares for large steps
0.2 < Hm0/Sh < 0.6) and filled black diamonds for small steps 1.0 < Hm0/Sh < 3.5) ranges from very short impacts
(tr/Tm–10 < 0.05) up to long load cases (tr/Tm–10 > 0.3). The latter ones represent a full run-up and run-down phase inducing
pulsating loads. However the impacts at small steps show an increase in the peak duration for decreasing relative peak
rising times up to td = 4tr, whereas the maximum duration of td = 2tr is observed for large steps. Rising times and peak
durations of vertical impacts above SWL (empty blue squares for large steps 0.2 < Hm0/Sh < 0.6) and empty black
diamonds for small steps 1.0 < Hm0/Sh < 3.5) scatter significantly and do not show a clear trend. Pulsating loads can be
explained by the water layer thickness during the wave run-up and run-down. Impacting conditions occur only very close
to the SWL. The impact rising times for vertical walls and stepped revetments are in the same rage. Kortenhaus et al.
(1999) found a minimum peak duration of td = 2tr for vertical walls, whereas the minima for stepped revetments is td = tr.
These differences may be based on differences in the sampling frequency of the impact pressures (0.6 to 1.0 kHz at
Kortenhaus et al. (1999) and 19.2 kHz in the present study). Lines of best fit for the different load cases are calculated
according to Equation (1) with corresponding regression coefficients a, b and c given in Table 2.
Figure 5. Comparison of pressure events with a certain probability of exceedance between small steps
((a – f), Hm0/Sh = 1.7, test 103) and large steps ((g – l), Hm0/Sh = 0.3, test 209).
impact load pulsating load
small steps
large steps
7
Figure 6. Correlation of the dimensionless impact duration td/tr and the dimensionless impact rising
time tr/Tm–1,0 at stepped revetments compared to findings for vertical walls.
𝑡𝑑,𝑚𝑎𝑥 = 𝑡𝑟 ∙ [𝑎 + 𝑏 ∙ 𝑒𝑥𝑝 (𝑐 ∙𝑡𝑡
𝑇𝑚−1,0
)]
Table 2. Coefficients a, b and c for Equation (1) and corresponding minimal
impact duration td,min.
Geometry Impact direction a b c td,min
vertical wall (Kortenhaus et al., 1999) horizontal 2 8 -18 2.0 tr
Stepped revetments horizontal 1 8 -12 1.0 tr
vertical 3 8 -18 1.5 tr
(1)
3.3 Spatial distribution of impact pressures
For sloping structures the maximum wave impact resulting from depth-induced wave breaking occurs slightly below
the SWL (Führböter, 1966). This section presents the maximum wave impacts on stepped revetments at different locations
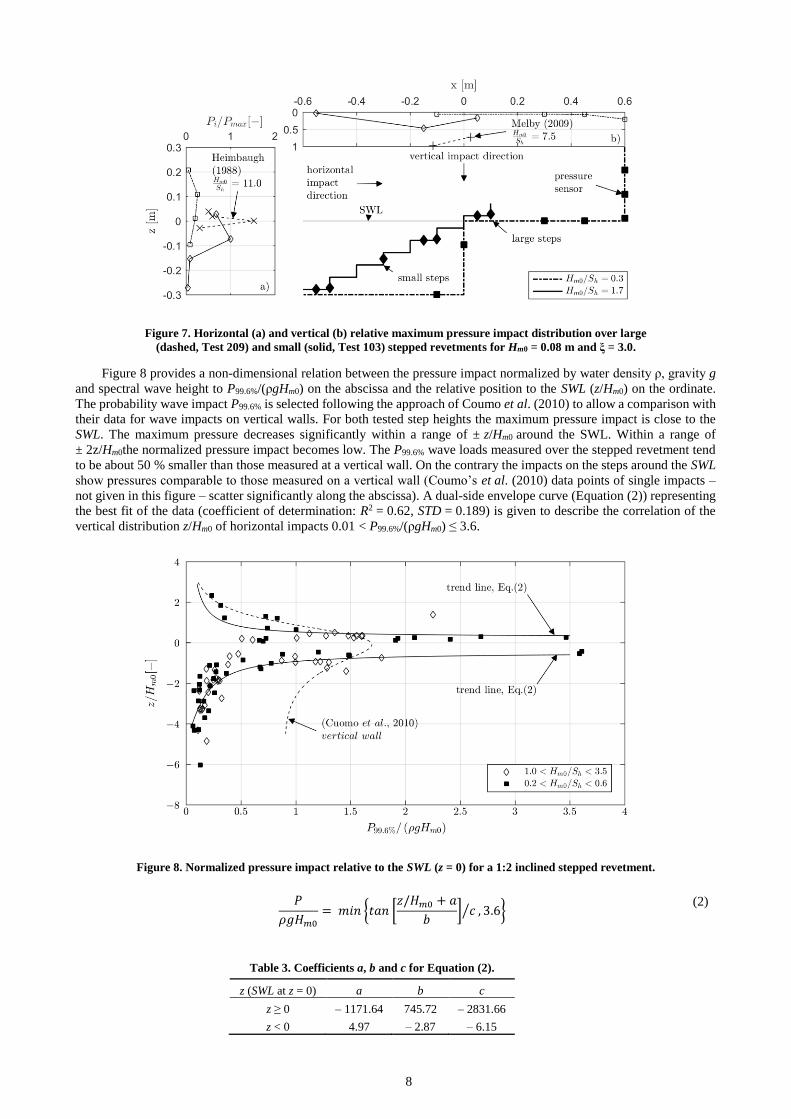
relative to the SWL. Figure 7 gives the horizontal (a) and vertical (b) relative maximum pressure impact distribution over
large (dashed, Test 209) and small (solid, Test 103) stepped revetments. For each pressure sensor the maximum impact
Pi,max is normalized by the maximum pressure impact of all compared sensors (Pmax = max{Pi,max}). For this case the
absolute maximum was recorded by pressure sensor P2 of the revetment with the small steps (compare Figure 1).
The vertical distribution of horizontal wave impacts (Figure 7 (a)) shows that the maximum wave impact occurs for
all configurations close to the SWL. The impact loads decrease with increasing distance to the SWL. For this specific case,
where the SWL is directly located at the edge of the large step (Hm0/Sh = 0.3), the maximum horizontal impact is about
four times higher than at the small steps (Hm0/Sh = 1.7). Additionally, data from Heimbaugh (1988) are given. These data
represent very small step heights (Hm0/Sh = 11) and show a maximum horizontal wave impact of about 1.5 times larger
than for the steps with a step ratio of Hm0/Sh = 1.7. The smaller the step height is compared to the wave height, the higher
the recorded horizontal loads become. The reduced impact for increasing step height can be ascribed to the delayed run-
down of the previous wave impact. This run-down causes a constant water layer on the revetment which buffers the wave
impact.
The horizontal distribution of vertical wave impacts (Figure 7 (b)) shows that the maximum vertical wave impact
for the small steps is located slightly below the SWL. The maximum vertical impact has an amplitude of about 50 % of
the maximum horizontal impact (Pmax,vertical = 0.5 Pmax,horizontal). The vertical impact for the large steps is negligible as it
represents only the hydrostatic pressure induced by the overflow of the incident wave. Additionally, data form Melby
et al. (2009) are given. The relative step height of Hm0/Sh = 11 is comparable to the data set provided by Heimbaugh
(1988) for horizontal wave impacts. The maximum presented impact is about two times larger than for the steps with a
step ratio of Hm0/Sh = 1.7. An increase in the vertical impact loads is observed for decreasing step heights analogous to
the horizontal wave impact.
8
Figure 7. Horizontal (a) and vertical (b) relative maximum pressure impact distribution over large
(dashed, Test 209) and small (solid, Test 103) stepped revetments for Hm0 = 0.08 m and ξ = 3.0.
Figure 8 provides a non-dimensional relation between the pressure impact normalized by water density ρ, gravity g
and spectral wave height to P99.6%/(ρgHm0) on the abscissa and the relative position to the SWL (z/Hm0) on the ordinate.
The probability wave impact P99.6% is selected following the approach of Coumo et al. (2010) to allow a comparison with
their data for wave impacts on vertical walls. For both tested step heights the maximum pressure impact is close to the
SWL. The maximum pressure decreases significantly within a range of ± z/Hm0 around the SWL. Within a range of
± 2z/Hm0the normalized pressure impact becomes low. The P99.6% wave loads measured over the stepped revetment tend
to be about 50 % smaller than those measured at a vertical wall. On the contrary the impacts on the steps around the SWL
show pressures comparable to those measured on a vertical wall (Coumo’s et al. (2010) data points of single impacts –
not given in this figure – scatter significantly along the abscissa). A dual-side envelope curve (Equation (2)) representing
the best fit of the data (coefficient of determination: R2 = 0.62, STD = 0.189) is given to describe the correlation of the
vertical distribution z/Hm0 of horizontal impacts 0.01 < P99.6%/(ρgHm0) ≤ 3.6.
Figure 8. Normalized pressure impact relative to the SWL (z = 0) for a 1:2 inclined stepped revetment.
𝑃
𝜌𝑔𝐻𝑚0
= 𝑚𝑖𝑛 {𝑡𝑎𝑛 [𝑧/𝐻𝑚0 + 𝑎
𝑏] 𝑐⁄ , 3.6}
(2)
Table 3. Coefficients a, b and c for Equation (2).
z (SWL at z = 0) a b c
z ≥ 0 – 1171.64 745.72 – 2831.66
z < 0 4.97 – 2.87 – 6.15

9
Figure 9. Normalized horizontal pressure impacts with varying probability of exceedance and
corresponding relative water depth z/Hm0 for large (0.2 < Hm0/Sh < 0.6) and small (1.0 < Hm0/Sh < 3.5)
stepped revetments.
Normalized horizontal pressure impacts with varying probability of exceedance and corresponding relative water
depth z/Hm0 for revetments with large (0.2 < Hm0/Sh < 0.6, Figure 9 (a – d)) and small (1.0 < Hm0/Sh < 3.5, Figure 9 (e – h))
steps are shown. Each row represents data with a certain probability of exceedance as described in Section 3.1. For
comparison, the reference line for the horizontal impact forces (Cuomo et al., 2010) and the trend line according to
Equation (2) are given. The pressure distribution predicted for P99.6% values by Equation (2) shows also a good agreement
for Pmax values, if the step height is larger than the wave height (a). Pmax values for revetments with step heights smaller
than the wave height (e) show higher impacts which scatter in a range of ± 2 z/Hm0. The higher and more variable
distributed impacts for small steps compared to large steps can again be ascribed to the influence of higher aeration
(Bagnold, 1939; Heimbaugh, 1988). With increasing probability of exceedance ((c – d) for large steps and (g – h) for
small steps) the peaks around the SWL become less prominent, although the peaks are still visible. The overall distribution
over the water depth become more homogeneous with decreasing probability of exceedance for reason discussed in
Section 3.2.
4 CONCLUSIONS
Wave-induced impacts on stepped revetments have been analyzed by means of physical model tests conducted in a
wave flume. The tests focused on the wave impact on stepped revetments with relative step heights in a range of
0.3 < Hm0/Sh < 3.5.
It was found that the probability distributions of wave impact pressures on stepped revetments follow a log-normal
distribution which confirm initial findings by Führböter (1966; 1986) and Weggel (1971). The maximum peak amplitude
in a test series decreases with increasing probability of exceedance. The decay is more intensive for step heights larger
than the wave height due to significant wave transformation processes over the dominant horizontal step faces. Large
steps (Hm0 < Sh) show similar load cases compared to vertical walls. For small steps (Hm0 > Sh) the impact peak is also
clearly visibly but the subsequent quasi-static peak Pq is not as prominent as for large steps or vertical walls. Therefore
the recommendation of the SPM (1984) to calculate the forces on stepped structures with the same method as for vertical
walls, only holds true only for large steps.
It was found that at small steps the highly aerated flow that emerges after the initial wave impact leads generally to
to smaller quasi-static peaks. The initial violent impact dissipates more energy than a pulsating load induced by wave
run-up. As a result, it can be deduced that the overall energy dissipation at small step heights is larger. Impacts measured
at stepped revetments below the SWL show relative rising times tr/Tm–10 > 0.2. No impacting load case was detected at
stepped revetments with large or small step height below the SWL. Real impacts are buffered by a water layer protecting

10
the steps from violent impacts. Impacting conditions occur only very close to the SWL. Compared to impacts on vertical
walls, the impact rising times are in the same rage. The minima for stepped revetments is td = tr. As the importance of
aeration in the run-up to the wave impact is addressed a future study should focus on this effect in analogy to Führböter
(1986).
The spatial distribution of the impact loads generally decrease with increasing distance to the SWL. The smaller the
step height is compared to the wave height, the higher the horizontal loads become. The reduced impact for increasing
step height can be ascribed to the delayed run-down of the previous wave impact. The maximum vertical wave impact
for the small steps (Hm0 > Sh) is located slightly below the SWL with an amplitude of about 50 % of the maximum
horizontal impact. The vertical impact for the large steps (Hm0 < Sh) is negligible as it represents only the hydrostatic
pressure induced by the overflow of the incident wave. An increase in the vertical impact loads is seen for decreasing step
heights analogous to the horizontal wave impact. The maximum impact decreases significantly within a range of ± z/Hm0,
mainly in the range of ± 2 z/Hm0. The highest (P99.6%) wave loads measured over the stepped revetment tend to be about
50 % smaller than those measured at a vertical wall. On the contrary the impacts on the steps around the SWL showed
impacts comparable to those measured on a vertical wall. Higher and more variable distributed impacts for small steps
(Hm0 > Sh) compared to large steps can be explained by the influence of higher aeration. With increasing probability of
exceedance the peaks around the SWL are less significant.
ACKNOWLEDGEMENT
The presented findings were developed within the framework of the research project ‘waveSTEPS – Wave run-up
and overtopping at stepped revetments’ (03KIS118) funded by the Federal Ministry of Education and Research (BMBF)
through the German Coastal Engineering Research Council (KFKI).
REFERENCES
Bagnold, R.A., 1939. Interim report on wave-pressure research, Excerpt Journal of The Institution of Civil Engineers, 12, The
Institution, London.
Cuomo, G., Allsop, N.W.H., Bruce, T.P., Pearson, J., 2010. Breaking wave loads at vertical seawalls and breakwaters, Coastal
Engineering, 57(4), 424–439.
Führböter, A., 1966. Der Druckschlag durch Brecher auf Deichböschungen, Mitteilungen des Franzius-Instituts für Wasserbau der
Technischen Hochschule Hannover, 28, Hannover.
Führböter, A., 1986. Model and prototype tests for wave impact and run-up on a uniform 1:4 slope, Coastal Engineering, 10, 1, 49-84.
Heimbaugh, M.S., 1988. Beach Erosion Control and Hurricane Protection Project: Report 1, Physical model tests of irregular wave
overtopping and pressure measurements, National Technical Information Service of CERC, 88(1), Springfield, Va.
Hull, P.; Müller, G.; Allsop, N.W.H., 1998: A vertical distribution of wave impact pressures for design purposes. Research Report,
MAST III, PROVERBS-Project: Probabilistic Design Tools for Vertical Breakwaters, Belfast, Northern Ireland, 16 pp.
Kerpen, N.B., & Schlurmann, T. ,2016. Stepped revetments – Revisited, Proc. 6th Int. Conf. on the Application of Physical Modelling
in Coastal and Port Eng. and Science (Coastlab16), Ottawa, Canada, 1-10.
Kerpen, N.B., Schlurmann, T., 2018. System performance and wave-induced responses of stepped revetments (in prep.).
Kortenhaus, A., Oumeraci, H., Allsop, N.W.H., McConnell, K.J., Van Gelder, P.H.A.J.M., Hewson, P.J & Vicinanza, D. (1999). Wave
impact loads-pressures and forces. Final Proceedings, MAST III, PROVERBS-Project: Vol. IIa: Hydrodynamic Aspects.
Melby, J.A., Burg, E., McVan, D.C., Henderson, W.G., 2009. South Florida Reservoir Embankment Study, Technical Report
ERDC/CHL TR-09-3, U.S. Army Engineer Research and Development Center, Vicksburg, MS.
Oumeraci, H., Klammer, P., Partenscky, H.W., 1993. Classification of Breaking Wave Loads on Vertical Structures, ASCE, Journal
of Waterway, Port, Coastal and Ocean Engineering, 119 (4), 381 – 397.
SPM, 1984. Shore protection manual. U.S. Army Engineer Waterways Experiment Station Coastal Engineering Research Center,
Vicksburg, Mississippi 4th ed. edition.
Weggel, R.L., 1971. Discussion on: Shock pressures on coastal structures (by Kamel). ASCE, J. Waterways Harbour Div., WW3.


